
In previous articles reviewing the quality of service on various routes, I have concentrated on long, major lines such as Queen, Dufferin, Finch West and Lawrence East. However, a review of a few shorter routes has been on my “to do” list for a while because the problems that beset longer routes should not be present.
This brings me to routes 6 Bay and 94 Wellesley (the subject of a future article). Both of these routes are quite short, and they operate in the “old” city of Toronto mostly south of Bloor Street.
6 Bay went through the travails of construction at Union Station and, to a lesser extent, on Queens Quay, but that is now finished. 94 Wellesley didn’t have construction to deal with, but until September 2015, it had an old schedule which the bus operators could not meet.
How are these routes running today?
Service Levels
The scheduled service in effect for January 2016 on 6 Bay is shown below (click to enlarge).
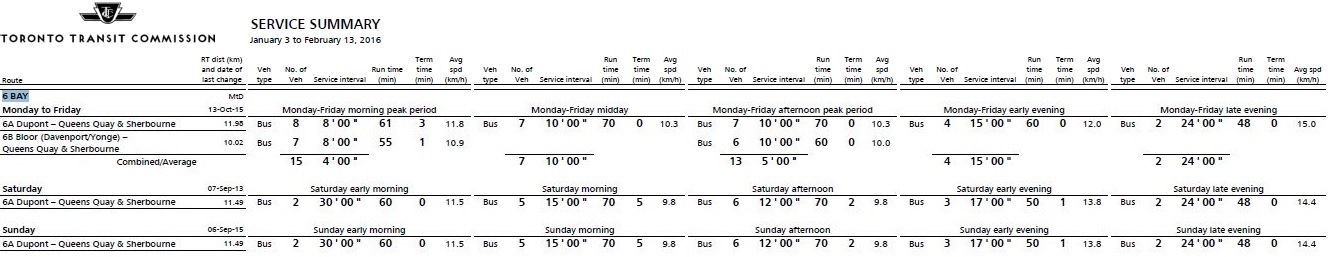
The 6 Bay bus carried 10,300 riders per day as of April 2014.
Screenlines
For the purpose of this analysis, various locations were used to measure headways (time between vehicles at a point) and running times (travel time between two points) at the following locations:
- Davenport east of Bedford: This is effectively the start of a southbound trip from the Davenport/Dupont/Bedford loop.
- Bay at Charles: This measures service southbound after it leaves the major boarding point at Bloor.
- Bay at Dundas: This location is south of the government office district but north of the more congested corridor through the financial district.
- Bay at Front: This is the transition from the financial district to the waterfront.
- Queens Quay at Jarvis: This is just west of the southeastern terminus at Sherbourne.
For both terminals, the service is measured clear of the loops to avoid confusion about just when a trip “starts” because vehicle behaviour within the loops is not consistent.
Headways
The chart sets here show the headways at three points. In each set, there are several pages:
- One page per week containing only weekday data
- A summary page showing all weekday data
- One page each for Saturday and Sunday/Holiday data
- One page each consolidating data for weekday, Saturday and Sunday with averages and standard deviations
6_201601_SB_EofBedford_MonthHeadways
The overall pattern of weekday headways southbound from Dupont is quite consistent as shown by the trend lines for four weeks of January. Although the trends may lie on the same path for each day and chart, the individual values are spread out considerably on either side of those trends indicating that service experience by riders is erratic. The average headway may match the scheduled value, but the typical rider sees a larger gap followed by two vehicles.
This pattern shows up in two other charts. First is the all-weekdays chart (page 5) where especially during peak periods many values are close to the horizontal axis, a very bad sign when the scheduled headways are 8′ in the AM and 10′ in the PM peak. Second is the chart of overall averages and standard deviations. Throughout the day, the SD values range from 3 to 5 minutes showing that the TTC generally does not achieve the 6 minute window for “on time” performance simply on the basis of headways. It is quite clear these buses cannot hit their scheduled performance with headways so far askew from the advertised values.
Weekends show the same problem with headways trending consistently from day-to-day, but SD values above 3 minutes. Buses are not providing the advertised level of service except on an “average” basis.
Sunday January 17 deserves special mention. The extended headways shown in the morning are the result of one vehicle, bus 1558, transmitting unreliable GPS data. Sometimes it was trackable, other times it was not. Throughout my analyses of various routes, I have encountered “problem” vehicles like this, and they must make central tracking difficult even by the TTC. That they show up repeatedly suggests that identification and repair of vehicles with erratic GPS readings is not a standard maintenance priority.
6_201601_SB_Charles_MonthHeadways
At Charles Street southbound, the peak period short turns from Yorkville have merged into the service. Although in theory there should be a bus every 4′ in the AM and 5′ in the PM peak, many values lie close to the axis indicating bunching. This is reflected in the weekday SD values that lie in the 3-5 minute range. In other words, although there are more buses when the short turns are included, the scatter in values of headways south of the merge point is similar to north of it.
Weekend values are similar to those in the previous chart because there is no short turn service.
6_201601_NB_JarvisSt_MonthHeadways
From the southern end of the route, the situation is quite similar to the north end. Bunching is commonplace, notably in the peak period when headways close to zero are common. Of particular concern is the weekend when short headways are common even though the afternoon scheduled service is every 12 minutes. Sundays are particularly bad with an SD value running consistently at 5 minutes.
A few days deserve a detailed view. Each set of the following charts contains the headway data for each of the screenlines travelling from one end of the route to the other.
6_20160101_Headways_SB
6_20160101_Headways_NB
New Year’s Day shows us a route under ideal conditions: no traffic, light passenger loads, and more than enough running time to stay vaguely close to schedule. However, the actual service operated tells quite a different story.
Southbound from the loop at Dupont, even the early morning 30′ service does not leave reliably, and the problem actually gets worse through the day. Wide and short headways alternate with each other, and these are often outside of the TTC’s generous 6-minute range. The problem with this picture is that most of the service meets the standard, but the operation represents wildly varying wait time for riders. By the time the service crosses Jarvis Street eastbound, the pattern has become even more skewed with the wide gaps getting much wider, and the narrow gaps getting even shorter. Although the scheduled headway matches the 12′ average for the afternoon, many buses are close together followed by very long gaps.
Even more astounding is the service leaving northbound. From roughly 9:00 am to 3:00 pm, the service is uneven leaving the terminal. There is a slight improvement later on, but headways still lie far from the average values. Delving into the actual movement of buses, the source of the problem becomes evident.
This chart shows the movement of vehicles back and forth on the route. For most of the day, there is no sign of congestion as indicated by the consistently sloped and straight lines. However, two common behaviours are evident:
- Buses routinely have time for a generous terminal layover. Considering that a one-way trip takes only half an hour, operators on 6 Bay on New Year’s Day did not face anywhere near the stress one might imagine on the much longer 501 Queen.
- Buses took layovers at various points along the route, notably eastbound on Queens Quay before arriving at the terminal. Some of these layovers can be understood as Transit Control spacing out the service, except that the results are at times far from even. Indeed, a bus can run considerably off schedule knowing that there is sufficient padding to get back “on time” at the next layover.
6_20160113_Headways_SB
6_20160113_Headways_NB
Wednesday, January 13, 2016 was not an unusual day, and the headway charts are typical for this route on a weekday. Southbound service from the Dupont loop is irregular, and bunching is common in both the AM peak and the early PM peak. By Charles Street, the peak short turns have merged in, and bunching is quite common through the peak periods. This situation continues right along the line to Jarvis eastbound.
Returning west/north from Queens Quay, service continues to be erratic, although not as bad as eastbound, and pairs of buses commonly leave the terminus during both peaks. This pattern continues over the entire route.
The detailed chart of bus movements shows the irregular headways and bunching, but it also reveals that short turns at Davenport are responsible for some of the large gaps in service beyond notably at the end of peak periods. This is the sort of behaviour we regularly encounter on streetcar routes.
Buses get reasonable, even generous layovers at the south end of the route, and tend to pause for a shorter period at the north end.
Running Times
Northbound
Each page of the Links chart above shows the running times over segments of the route northbound from Jarvis and Queens Quay to Davenport east of Bedford. The values are quite even, although there is some variation, particularly northbound at Bloor where buses might lay over for a crew change. The spike in the Jarvis-to-Front data between noon and 1:00 pm was caused by a bus that appears to have gone out of service near Lake Shore and Bay, then ran north and disappeared off of the route (this is visible on the Chart as a stationary yellow line just after 12:40 am).
Looking at monthly data for each route section (below), the relatively small change in running times over each segment is quite a contrast to what has been observed on major downtown routes. There is no segment with a substantial peak, only a gentle rise and fall of values.
By contrast with the headway data, the standard deviation values are low, typically below two minutes showing a route where travel times do not vary nearly as much as the headways, at least over modest distances.
6_201601_NB_JarvisSt_FrontSt_MonthLinks
6_201601_NB_FrontSt_DundasSt_MonthLinks
6_201601_NB_DundasSt_Charles_MonthLinks
6_201601_NB_Charles_EofBedford_MonthLinks
Over the entire route, the picture is a bit different. Between Jarvis and Bedford, there is a clear build-up of running time to the PM peak, and the SD values are higher. Of particular interest is that data for Mondays (red on the charts) shows better running times in the PM peak than other weekdays.
The SD values for trips over the entire route from Jarvis to Bedford are higher than for Jarvis to Charles because they include the effects of layovers at Bloor, particularly on weekends.
6_201601_NB_JarvisSt_EofBedford_MonthLinks
6_201601_NB_JarvisSt_Charles_MonthLinks
Southbound
As with the northbound times, the southbound running times do not vary much over the period of the day at the route segment level. The SD values are low, and there is little evidence of congestion at specific points along the route.
For January 13, there are two exceptions in the data are caused by varying periods of layovers southbound at Bloor, and by buses taking layovers enroute to Queens Quay in the evening at points west and north of the screenline at Jarvis (examples are easily matched between the Links chart above, and the overall chart of service).
6_201601_SB_EofBedford_Charles_MonthLinks
6_201601_SB_Charles_DundasSt_MonthLinks
6_201601_SB_DundasSt_FrontSt_MonthLinks
6_201601_SB_FrontSt_JarvisSt_MonthLinks
Running times for each of the four segments of the route do not vary much over the day on weekdays.
- There is a definite peak for the Bedford to Charles segment in the AM and PM peaks. This is mainly caused by longer dwell times to load southbound at Bay Station.
- From Charles to Dundas, running times show a slow decline from the AM peak through the rest of the day, but with an SD value of about 1 minute.
- From Dundas to Front, running times stay much the same all day except on Sunday, January 17 where there was congestion south of Queen for much of the day.
- From Front to Jarvis, especially in the evening, there are some long trips mainly caused by buses taking layovers on Queens Quay west of Jarvis. Saturday, January 2 also included a disruption at about 10:00 pm south of Front that affected a few trips.
6_201601_SB_EofBedford_JarvisSt_MonthLinks
6_201601_SB_Charles_JarvisSt_MonthLinks
Southbound running times are shown for the full line (Bedford to Jarvis), and for the portion of the line south of Bloor which does not include extra dwell time at Bay Station. Standard deviations in times over the full route are slightly higher than those for the segment from Charles southward showing the contribution of these dwells.
As with the northbound data, there is a slightly lower trend line for running times on Monday (red) than for other days of the week. SD value are higher on weekends, particularly Sunday, than on weekdays, the reverse of normal expectations, because faster trips are offset by more ad hoc layovers enroute that are counted in the travel time.
Terminal Layovers
The “Terminal Links” charts below have the same format as the charts for other segments of the route, but these look at the time spent on a round trip from screenline nearest each terminal to the end of the line and back. This gives us both the likely minimum time for such a trip (typically one that does not stop very long to serve passengers) as well as a sense of how much extra time is used up by terminal layovers.
6_201601_NB_Bedford_Terminal_MonthLinks
6_201601_SB_JarvisSt_Terminal_MonthLinks
At the north end, the minimum values across all data sits at about 3 minutes, and allowing for a terminal layover, this would mean we would expect to see round trips of about 6 minutes. This is the case for weekday data (see the summary pages 8-10 with the monthly averages and SD values), but for weekends, the averages are much higher during many periods.
At the south end, the minima similarly lie at about 3 minutes, and therefore a typical round trip should be about 6 minutes (or maybe a bit more considering how busy the stop can be at this location). However, the average values, particularly on weekends, are much higher showing that the route has excessive running time. The same buses could provide more frequent service while still having enough time to operate the route.
Why Is The Service So Chaotic on 6 Bay?
For several years, service on 6 Bay was routinely a shambles thanks to delays with the construction at Front Street. The construction is now finished, but extra time remains in the schedules. This may combine with a laissez-faire approach to managing the route left over from the construction period resulting in service that is not well regulated, and which has so much padding in the schedule at times that staying “on time” is not worth the effort when lengthy layovers at terminals or even along the route beckon.
With all of the routes getting extra running time so that vehicles don’t have to short turn, 6 Bay could do with a review to reduce running times and tighten up on keeping service spaced close to the advertised frequency.
Methodology
For a description of the methodology behind these analyses, please read Methodology For Analysis of TTC’s Vehicle Tracking Data.
Weather
This article reviews the data for January 2016 for 6 Bay. Although that is a winter month, it has been relatively mild with little snow, and so the results are not skewed by unusual operating conditions.

Wasn’t the ridership higher when trolley buses ran on Bay Street? Of course, when the Dupont and Bay streetcars used Bay Street as an alternative routing for downtown bound riders, there would have been at their peak.
How quickly, people forget that the Bay bus can be used as an alternative whenever the Yonge Subway is down.
Steve: Bay bus ridership is probably up now that (a) construction work at Union Station is finished and (b) there is a substantial demand to the George Brown building at the south end of the route. Time was that much of the service never got to Queens Quay, but now everything is scheduled to run through to Sherbourne.
LikeLike
No, people haven’t forgotten, they know it very well, like a few weeks back when the subway shut down. I was stuck in that crowd.
I take the bus to get to meetings and find it’s pretty reliable. I’ve only ever waited more than a few minutes once. It’s very convenient.
LikeLike
Having driven Bay, the problem during the day is simple: Too much time at the bottom as you said (Half of the run time is allotted south of King), just the right amount of time from College to Bloor, and nowhere near enough north of Bloor. You’ll see a lot of drivers pushing to get to Bay/Bloor about 5 minutes early, because you lose about 3 minutes between there and Dupont/Davenport, plus 3-5 minutes coming south… but every Bay driver leaves Dockside drive 5 minutes late so as not to get too far ahead. The supervisors actually watch Bay quite a bit… but the schedule is just THAT broken.
LikeLike