7 Bathurst Update: Data to April 2026

This article updates a series of posts looking at the 7 Bathurst bus and the effect of transit priority changes made on that route. Originally the City and TTC had proposed red lanes from Bathurst Station north to Eglinton. This was substantially changed to parking and turning restrictions, and the elimination of some transit stops. The changes predominantly affected northbound travel and in the interest of brevity, I have included mainly northbound data here. The changes implemented were:

  • Extendind the no stopping period on the east side of Bathurst between Eglinton and Bathurst Station North Exit from 2:00 to 7:00pm, weekdays, and from noon to 7:00pm, weekends, except public holidays. Previously, there was no stopping from 4:00 to 6:00pm or 3:30 to 7:00pm, Monday to Friday, depending on the segment
  • No left turns northbound from 7:00am to 7:00pm Monday to Saturday, except public holidays (Toronto Transit Commission vehicles excepted), at Bathurst & Davenport northbound, and at Bathurst & Dupont southbound. Previous hours were 4:00 to 6:00pm weekdays northbound at Davenport, and 7am to 6pm southbound at Dupont.
  • The existing no left turns restriction northbound at Bathurst & Dupont from 7:00 to 9:00am weekdays was removed.
  • Concurrently with these changes, the TTC removed stops from the route, mostly north of St. Clair, with the premise that fewer stops would make faster trips. The actual effect varies depending on how heavily a stop is used, whether each bus or only some trips actually stop there, and whether there is an associated traffic signal that could compound the delay of serving a stop.

A saving of 1/3 in travel times has been claimed between Bathurst Station and Dupont, but this is not supported by actual tracking data. There may be best case comparisons where there is a 1/3 saving, but this does not apply across the board. The primary intent, as explained in the presentation to Council at the time, was to improve the reliability of travel times, not to speed up service.

A major issue on Bathurst is that the service is infrequent (generally every 10 minutes) and very unreliable. How much road capacity should be dedicated to such a route by comparison with other priority implementations such as on King Street or Eglinton Avenue East?

The first set of charts in this article shows the evolution of travel times between Barton (just north of Bathurst Station), St. Clair and Eglinton. The second compares April 2026 with April 2025 in detail. The third reviews the history of headway reliability on the route.

Continue reading

TTC World Cup Plans: April 2026

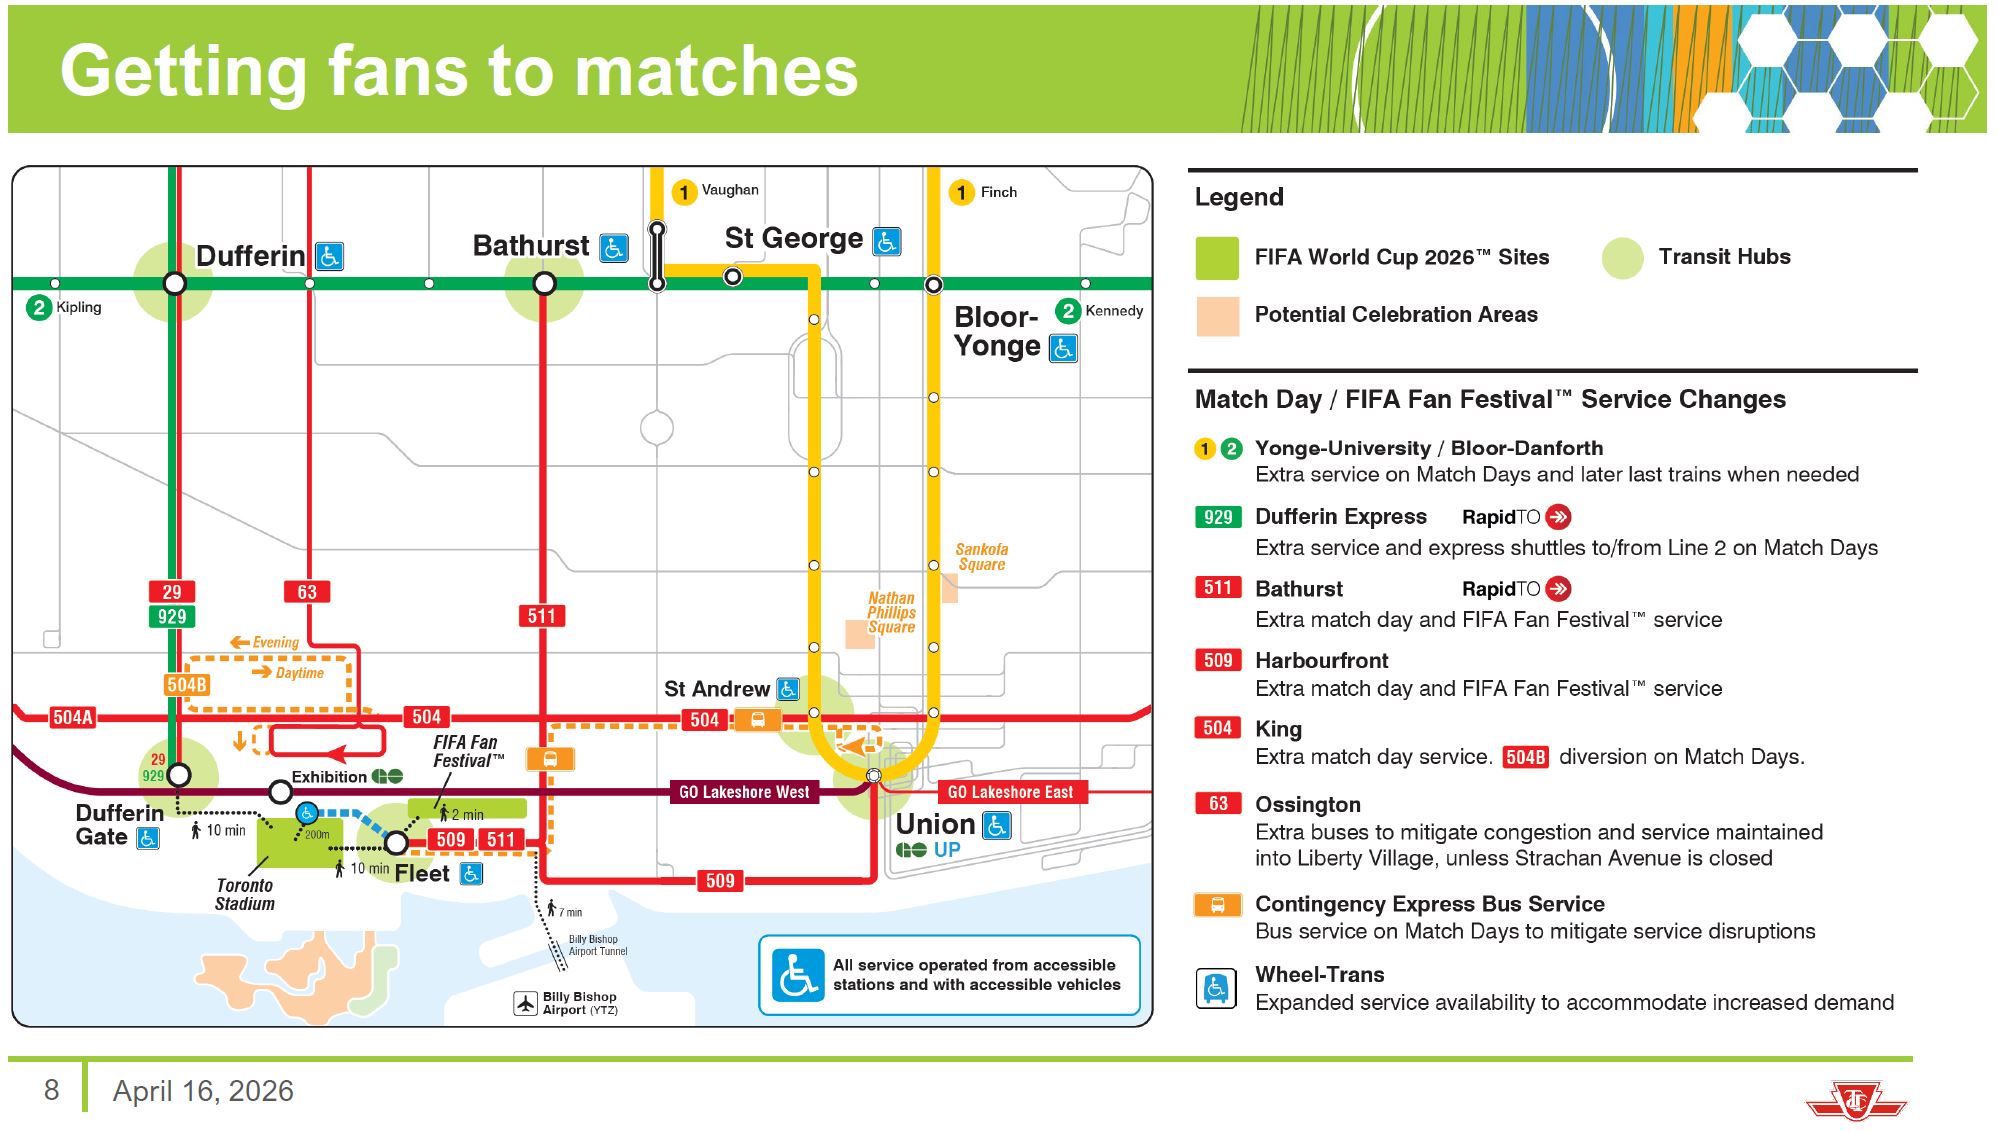
TTC Plans for service to the six World Cup games to be played in Toronto, as well as to the nearby Fan Fest area, were covered in a presentation deck in a recent TTC Board agenda. Because the Board had been rather chatty on previous items, this one was not presented although there was a media scrum afterward.

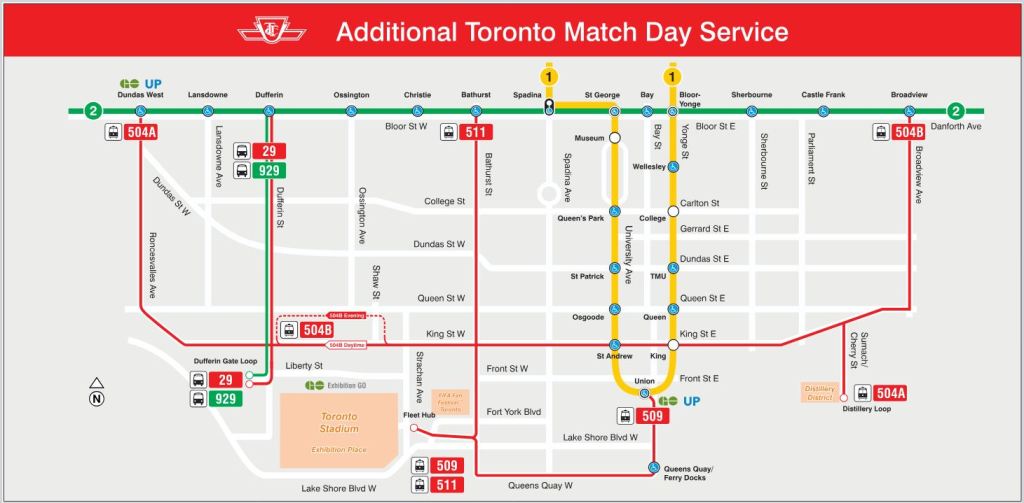
The plan for transportation to the venues depends on a combination of routes. However, the description of the service varies between the presentation deck and info on the TTC’s World Cup web page.

On the left, the presentation clearly shows the 63 Ossington bus as a World Cup route, but it is missing on the web page.

According to the web page, there will be “expanded service” on subway lines 1 and 2, and “enhanced sevice” on 29/929 Dufferin. Service on 504 King, 509 Harbourfront and 511 Bathurst will run every 5 minutes all day on game days.

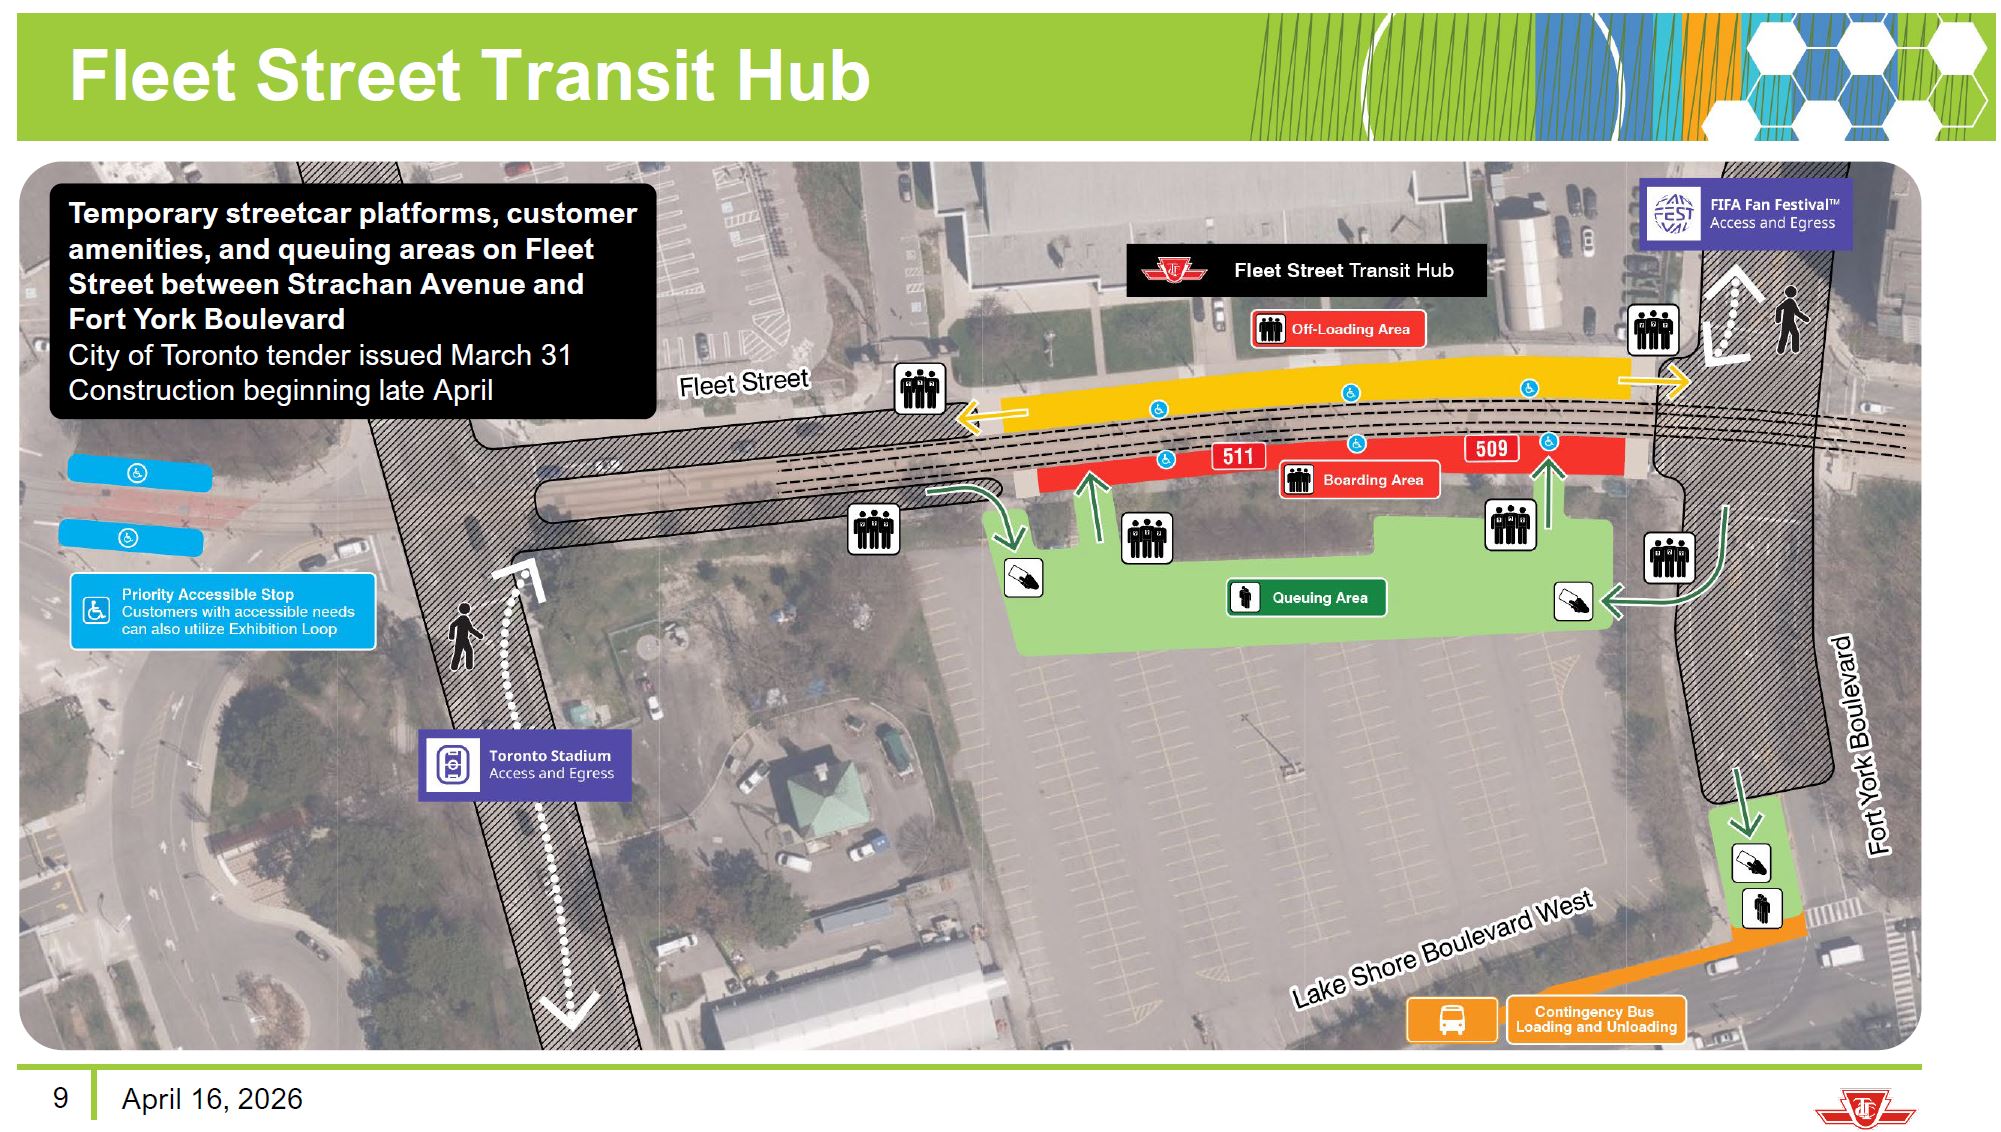
Because the 509 and 511 streetcars merge at Bathurst and Fleet, this will mean a 2’30” combined service to Exhibition Loop. That is substantial by current TTC streetcar standards, but it will only provide 24 cars per hour with a capacity of 3,600 riders, generously allowing for 150 per car. The stress on service will be stronger after games when many fans want to leave in a short period. Whether the combined streetcar, bus and GO train service will be able to handle this remains to be seen.

Note the planned access routes to the queuing area on Fleet Street includes fare payment points. This will allow the loading to occur from a fare paid zone without the delay of on board taps, and without the need for fare enforcement in a congested area. This is also shown for access to a contingency bus area at Fort York and Lake Shore, and it is reasonable to assume the same approach will be used at Dufferin Loop.

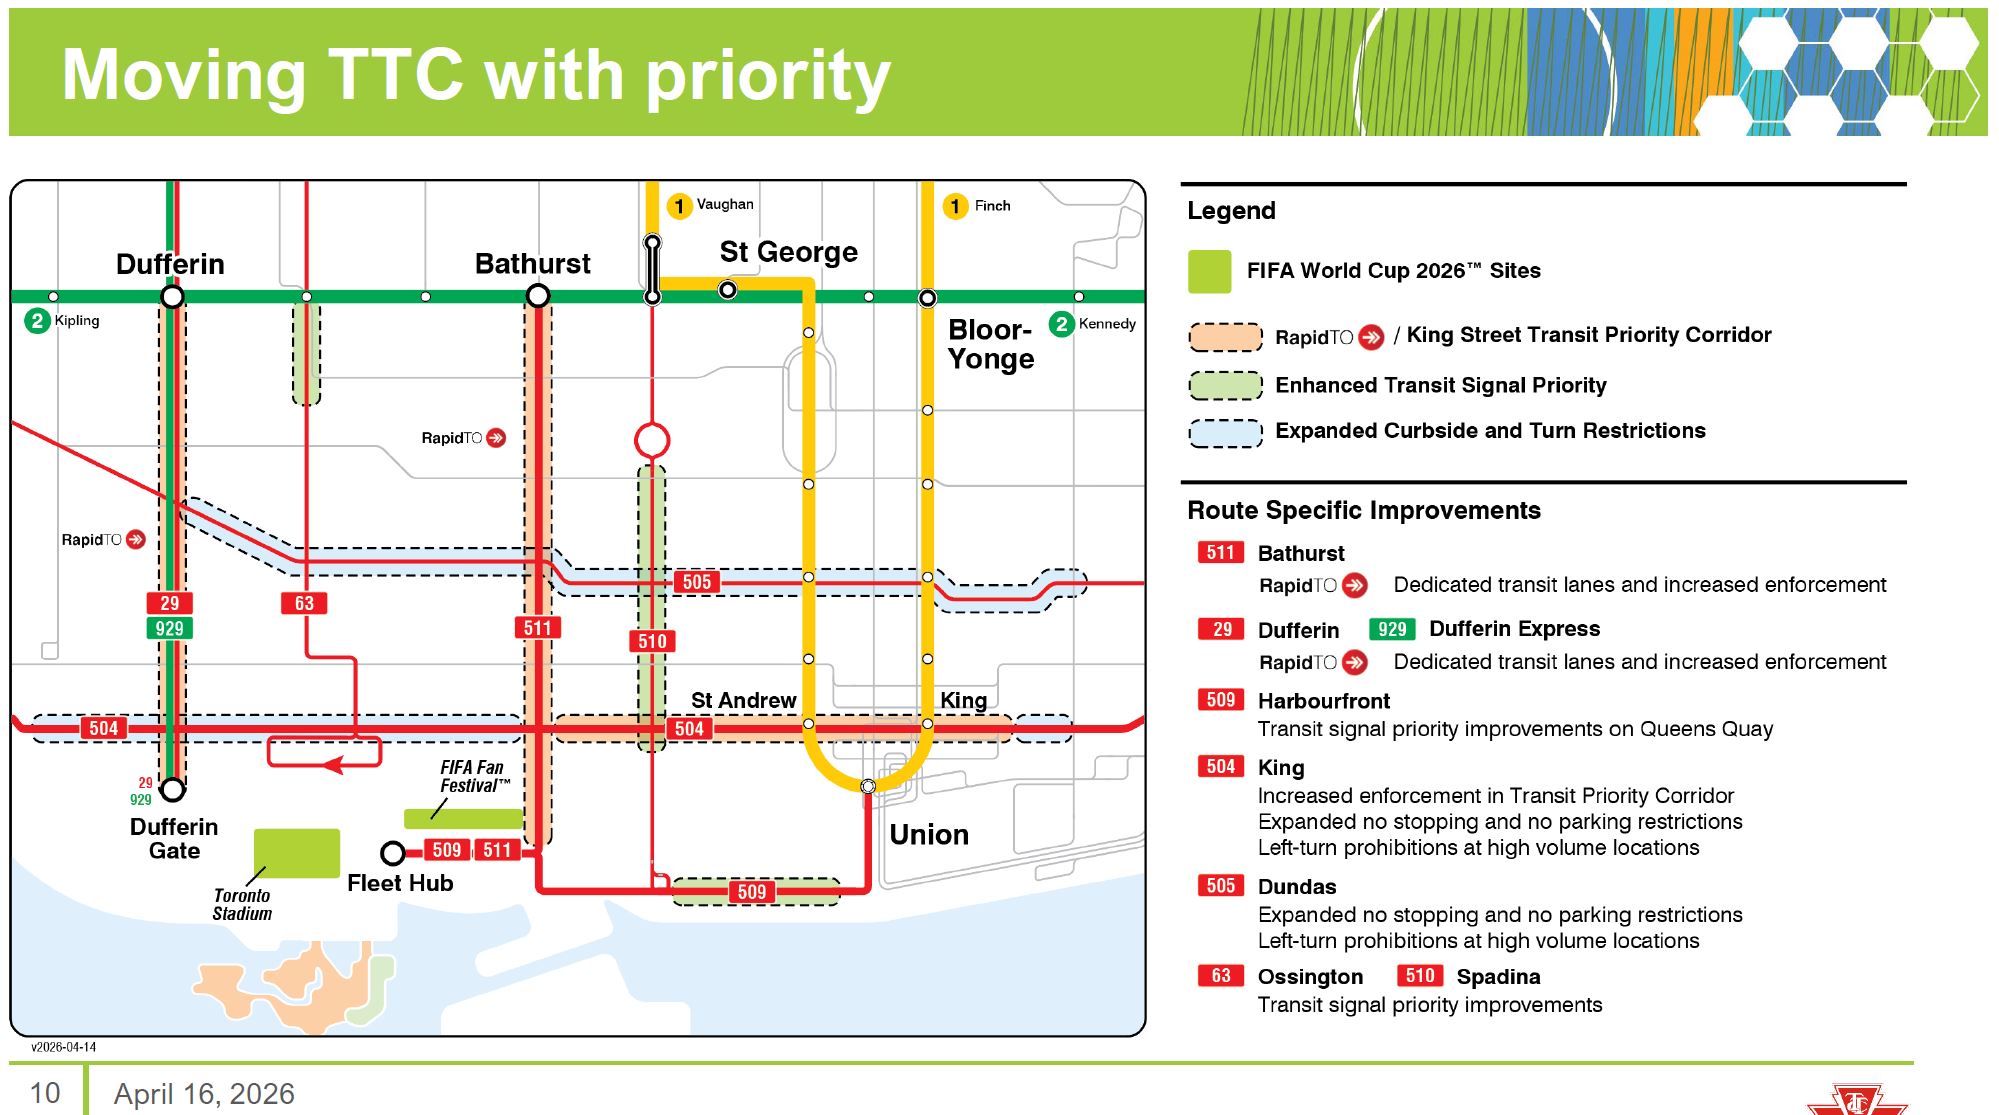
Aggressive transit priority measures will be needed to keep streets clear. Toronto does not have a good history in restricting motorists to leave the streets for transit service, and the affected areas are not just the downtown business district but residential streets.

Both Bathurst and Dufferin Streets will, by the time of the matches, have RapidTO red lanes south from Bloor. Early plans for Bathurst called for express streetcars and local bus service, but that scheme has been dropped.

I asked Josh Colle, TTC’s Chief Strategy and Customer Experience Officer, about this, and here is his reply:

Earlier iterations of our conceptual service plan envisioned removing intermediate stops along 511 Bathurst to increase the speed of travel along the corridor during the World Cup. Bus service would be provided to serve all existing stops.

With the expected travel time improvements from RapidTO, the implementation of 6-minute or better service, and further service increases during the World Cup period, the express streetcar concept was abandoned. There were also concerns about buses operating in the dedicated lanes and needing to merge in and out of potentially congested curb lanes to serve curbside stops.

This was originally seen as an opportunity to pilot a stop removal program for streetcar while operating a local bus service. However, given the recent priority to improving streetcar operations through other initiatives, our focus remains providing the best service for all customers during the World Cup period.

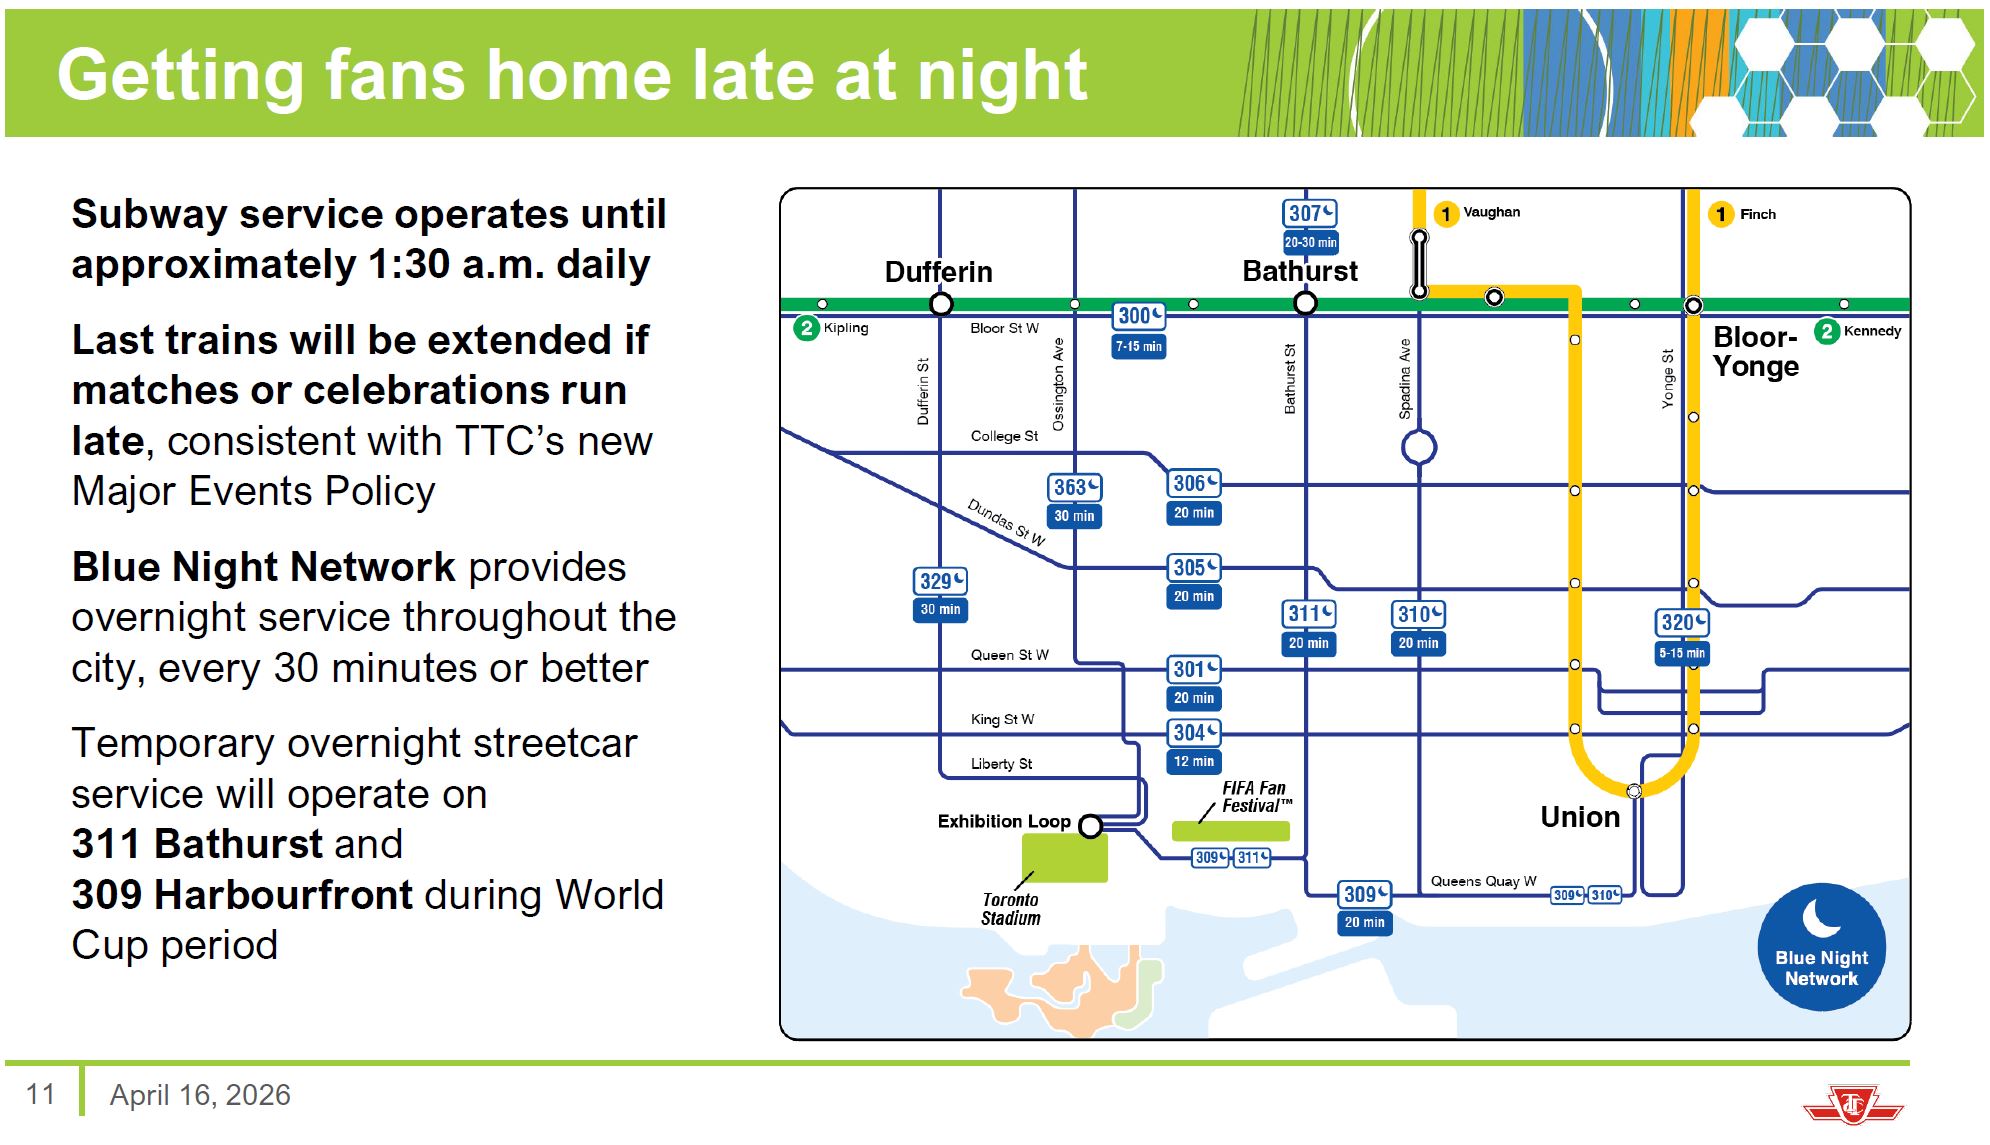
The TTC intends to provide Blue Night service as shown on the map below beyond the usual level.

Things do go wrong, inevitably, and here are the TTC’s preparations:

Service delivery and performance:

  • Supplementary supervisors in stations, on-street, and at key locations
  • Additional standby and change-off vehicles on all modes
  • Enhanced station staff, customer service and ambassadors
  • Real-time system oversight and coordinated decision making

Infrastructure readiness:

  • Streetcar switch duty operators at critical points
  • Extra janitorial and vehicle cleaning crews
  • Additional line mechanics, elevator, overhead, subway, signal, and track crews
  • Standby streetcar support and service trucks

Emergency safety:

  • Added security personnel on match days
  • Toronto Police paid duty officers EMS at key locations
  • Coordinated approach with Station staff, Transit Control and Special Constables
  • Continued access to social supports and resources through partnerships

This is substantially more than we see for day-to-day operations, and there may be some lessons to be learned about the level of supervisory and support services needed to handle major events and their demand.

(The reference to switch duty operators is a tad embarrassing considering that the planned streetcar routes do not involve any manual switches, and this does not show great confidence in their existing technology.)

There will be “testing exercises” although the exact scale of these is not yet known.

Finally there are plans for enhanced and visible safety and security with the use of Special Constables, Fare Inspectors (Provincial Offenses Officers) and contract security staff. Ideally, as many riders as possible will pass through fare controls at some point in their journey and extensive fare checks on board will not be needed. More important will be visibility of staff who can intervene, if only to report issues and act as a visible deterrent.

Management will bring an updated plan to the June 3 Board meeting.

7 Bathurst Update: Data to February 2026

This article updates previous posts on service quality on the 7 Bathurst Bus with data added to February 2026.

See:

This route had small changes in transit priority in Fall 2025 with removal of parking on the south end of the route during selected periods, and removal of three stops both ways between St. Clair and Eglinton. Although TTC cites stop removal as a travel time saving, this depends on two factors: how often buses actually stop at them, and whether there is a traffic signal that can add to the delay of stopping and falling out of the general traffic flow. None of these stops had signals.

Meanwhile 7 Bathurst is also supposed to be part of the TTC’s pilot to reduce bunching and gapping. That project began in March 2025 on several routes, but was scaled back to peak periods in October.

The tracking data show little effect of the changes which were quite limited in scope. Headway reliability remains a major problem from both ends of the line, and even worse midway along the route. There is also a very large difference between off-peak and peak travel times affecting many parts of the route, not just the portion south of Eglinton.

Improvements are needed both to deal with peak period congestion delays, but also to improve the reliability of vehicle departures and spacing on an all-day basis. With the results to date, it is hard to believe that substantial new ridership will be attracted to the line especially with its chronic problem of irregular headways.

Continue reading

Bunching & Gapping: AI To The Rescue?

In a previous article, I examined the report on the Bunching & Gapping pilot now in progress at the TTC.

At the November 3 Board meeting, there was almost no discussion of that report, but in its place management provided a short presentation. Unfortunately, this portion of the meeting was not uploaded to YouTube, and so readers will not be able to view it for greater detail.

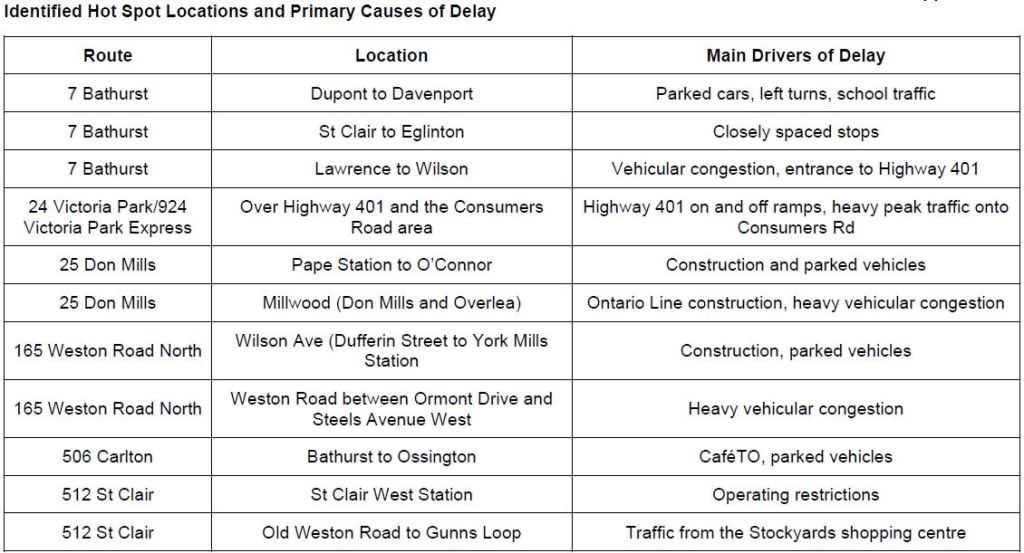
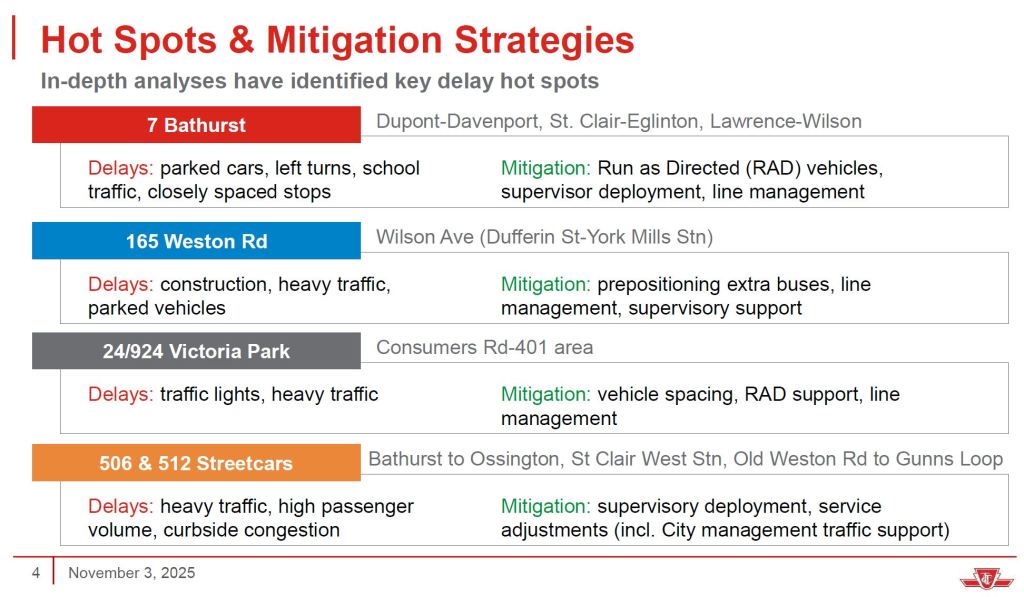
Information about hot spots on routes was presented in a different way from the original report. Both versions are shown below.

The original version has more granularity showing the issues specific to each route segment.

The presentation shown at the meeting included a hot spots map across the whole system, but this is not included in the published deck. I will ask TTC for a copy and add it here when available.

The important point about that map is that the hot spots are all over the city, while conventional wisdom presents this more as a downtown, streetcar-centric problem.

Results on the pilot routes have been mixed, and even this has required a high level of supervision that likely would not scale to the entire system and most hours of service. As an alternative, the TTC is considering an AI (Artificial Intelligence) tool developed at York University. Initially this would be used in an advisory manner to route supervisors who would decide whether its recommendations were valid. Later, it would directly instruct operators to hold enroute to even out headways.

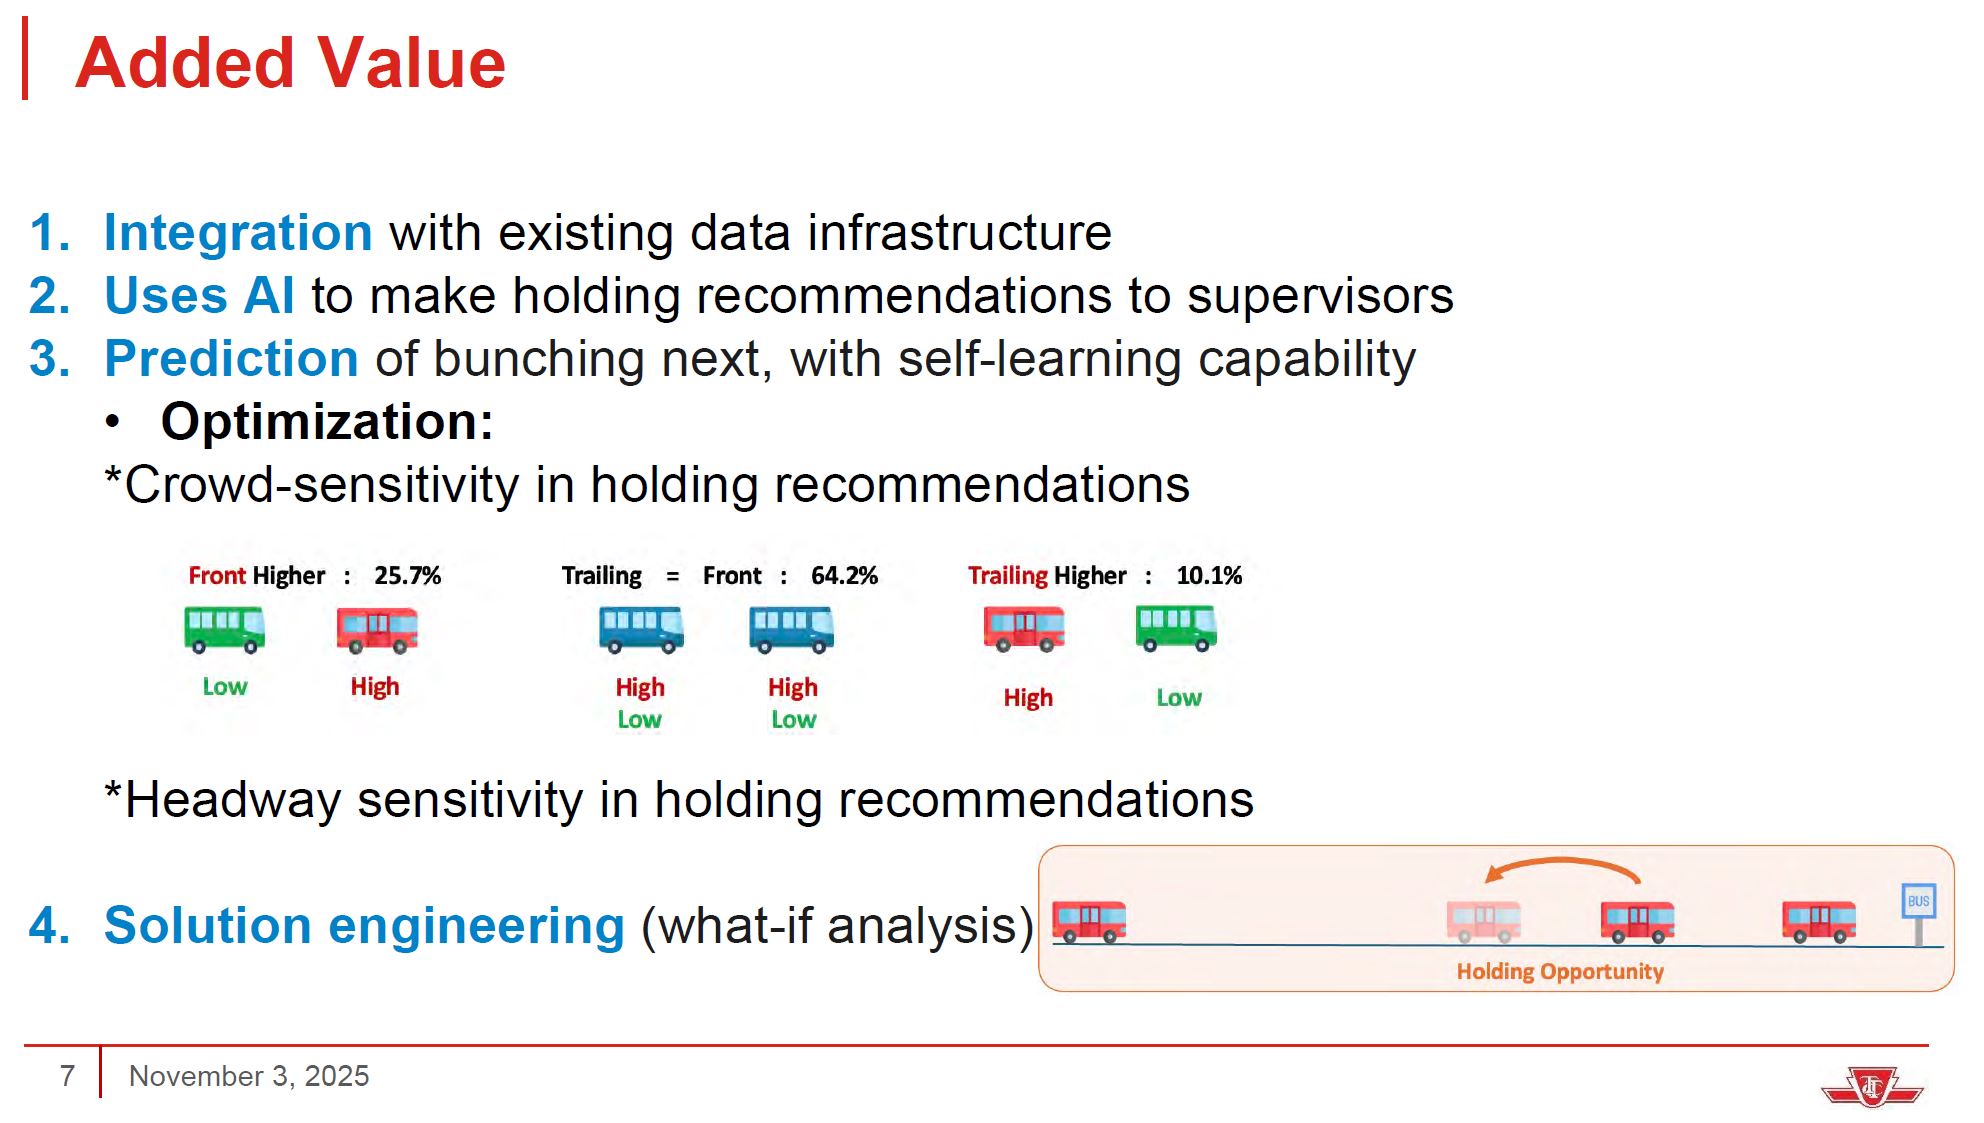
A decision to hold a vehicle would take into account the relative loads of the leading (gap) bus and the trailing (bunched) one. Ideally, a bunched bus will have the lighter load and holding it to space service will affect fewer riders. This is not always the case if pairs of buses leap-frog to share the work along a route, and the “trailing” bus might have the heavier load at some points.

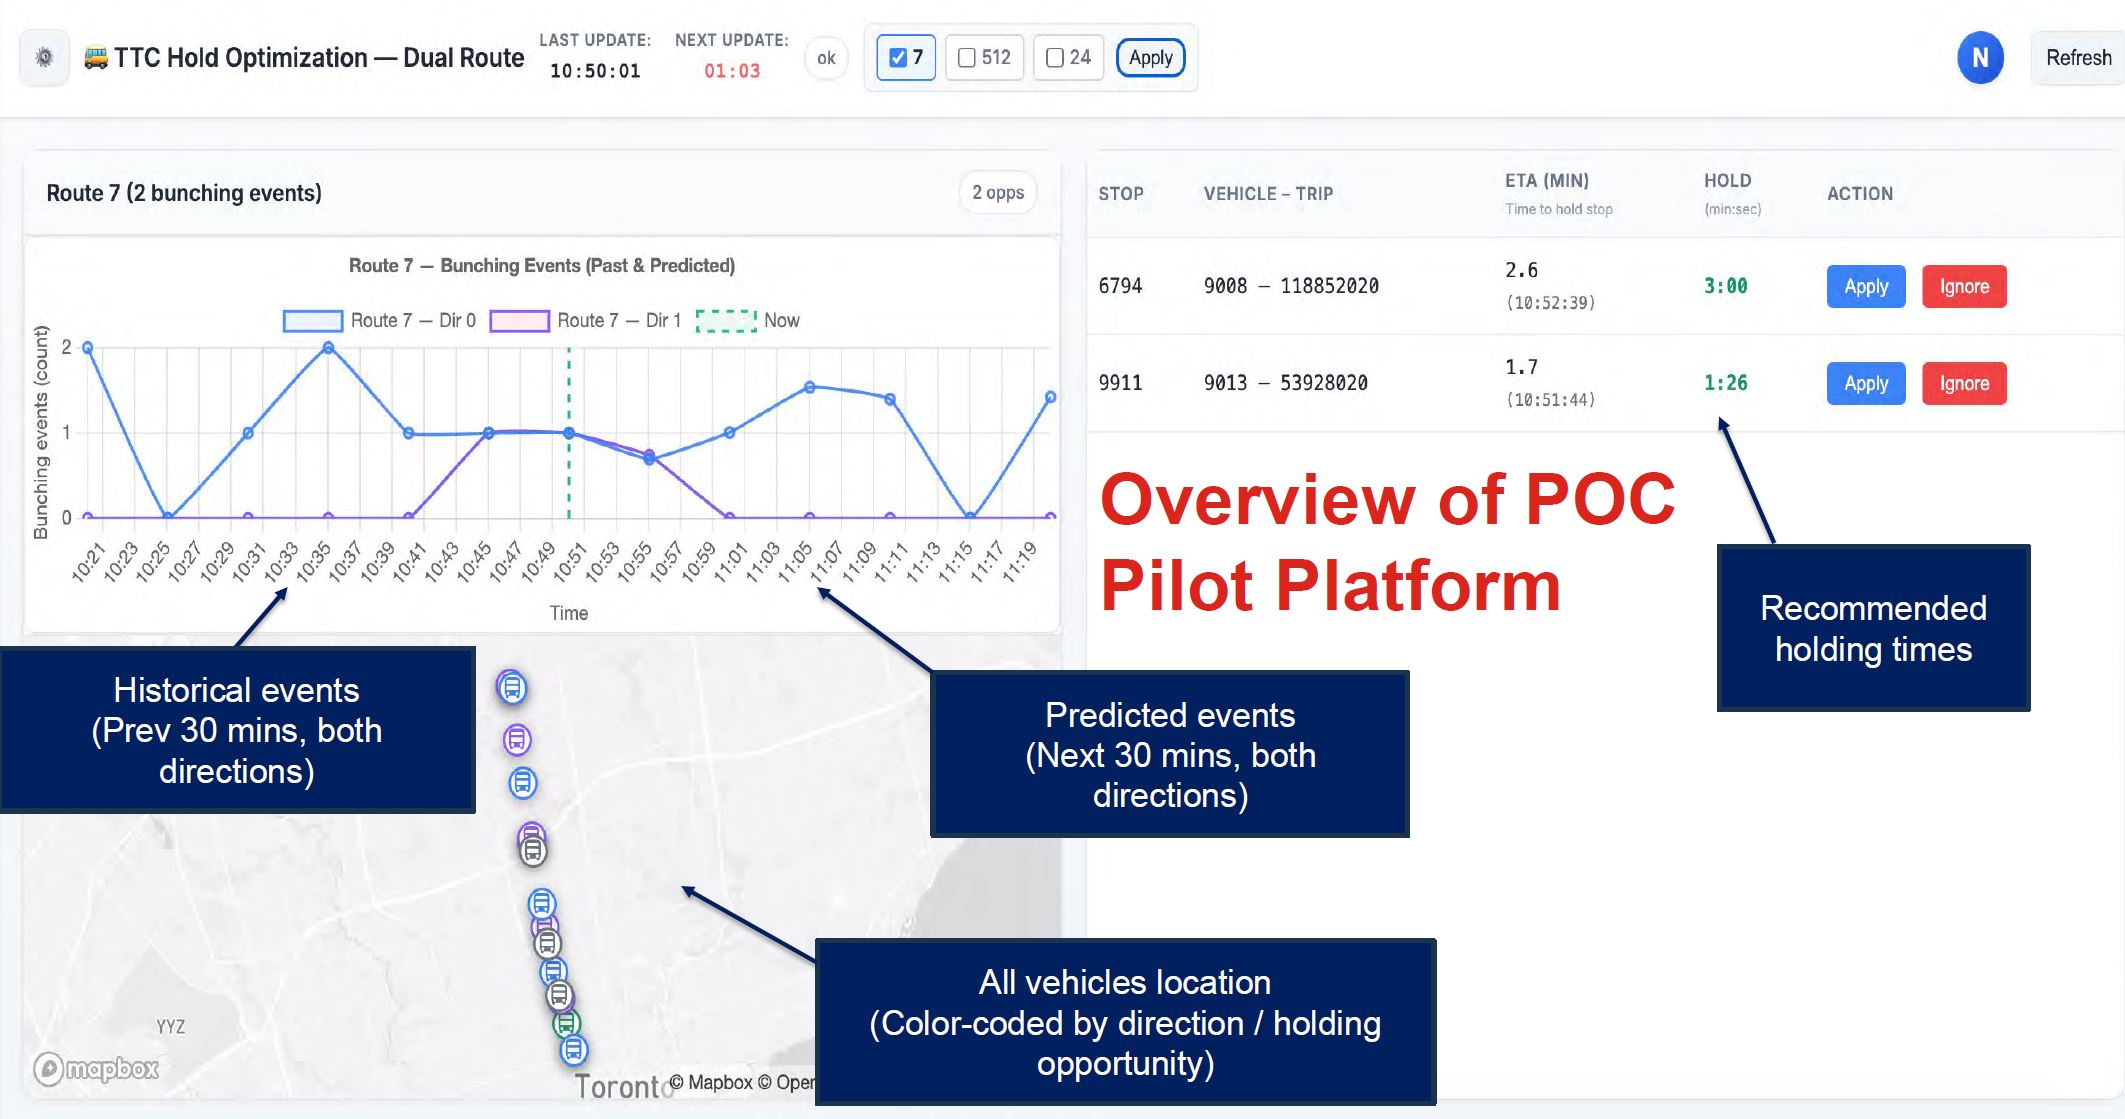
A proof of concept dashboard gives an idea of what might be presented to a route supervisor. This shows recommended holds, as well as the distribution of historical and predicted bunching. Note that the scale on the chart is the number of bunched buses, not the gap size to be corrected.

The challenge here will be for the AI model to predict future behaviour. Many things affect bus spacing, and some of them are not predictable. For example, irregular terminal departures can begin a process where a small gap gradually widens. That effect can be predicted and service adjusted, but the actual late or early departure is only known when it happens. Developing gaps are easy to spot along a route because the future service at a location can be predicted by what is in the few kilometres approaching it.

Congestion caused by accidents cannot be predicted, but the act of smoothing out service can deal with its results at least in part based on past experience with similar events. There is no mention of short turns or tracking of issues with buses running late due to insufficient schedule time, or the timidity of a junior operator.

Notable in the presentation is the implication of headway management, not on-time performance. The TTC needs to decide which of these it will adopt and incorporate that into terminal dispatching.

There is also the question of whether the Service Standards are too generous in defining the allowable variation in “on-time” and “headway” values. Departures are supposed to be no more than 5 minutes late, and never early. Headways on a 10-minute service like 7 Bathurst can vary from 5 to 15 minutes. If the AI tool uses these as its goal, it will perpetuate the uneven service allowed by the standards, particularly in headway management. There is also a danger that route speed will be determined by spacing service to accommodate the slowest drivers.

No computer system inherently “knows” what it is supposed to achieve, and depends on the parameters set down by its developers. If the TTC does not fully understand what “good service” should look like, an AI tool will only work toward expectations built into its design. An important component should be the ability to tighten or relax the targets for “good” service management.

TTC plans to shift the focus of its more intense supervision from the 7 Bathurst and 24/924 Victoria Park routes to 29/929 Dufferin and 25/925 Don Mills. I have collected tracking data on these routes for some time, and will publish analyses of changes in route behaviour after a few months have accumulated.

The Board approved the following motion:

Request TTC staff report back to the TTC’s Strategic Planning Committee as a part of consideration for 2026 budget priorities on the resource requirements, staffing, and operational needs to sustain a full-year Bunching and Gapping Pilot in 2026 as well as the feasibility of expanding the pilot to additional key routes across the City to improve service and reliability.

The next meeting of the Strategic Planning Committee is on November 25, 2025.

TTC Bunching and Gapping Pilot

The TTC has a pilot program underway on several routes with increased supervision in an attempt to improve service quality by addressing service gaps and bunching. These are complementary effects in that a gap is often followed by a bunch, although gaps can also occur due to missing vehicles and short turns. See:

The pilot evolved over the year as some of the challenges and resource needs to manage service became apparent.

March 2025Pilot launched on 7 Bathurst, 24 Victoria Park, 924 Victoria Park Express, 25 Don Mills, 925 Don Mills Express, 29 Dufferin, 929 Dufferin Express, 100 Flemington Park, 165 Weston Road North, 506 Carlton, 512 St Clair.
Dedicated staff to manage each route were not used initially and results were poor.
June 2025The pilot was scaled back to 7 Bathurst, 24 Victoria Park, 924 Victoria Park Express, 506 Carlton, and 512 St Clair.
One route supervisor was assigned to each route.
September 2025100 Flemingdon Park and 165 Weston Road North were added.
October 2025Pilot “refined” to focus on the weekday peak periods.

The TTC recognizes that delays leading to gaps can be caused by several effects: “including including Operator behaviour, customer incidents, traffic congestion, city events, construction, and operational factors, such as door/ramp operations.” [p. 2]

Later in the report, there is mention of the effect of passenger loads and long traffic signal wait times.

If vehicles are crowded either because service is inadequate for demand, or because a gap creates an extra load, they will take longer at stops. Filling vehicles to the brim can be counter-productive and inefficient. Space limitations onboard can delay passenger movement especially for those with large objects (e.g. strollers, luggage) and mobility devices. Although ramp operations are mentioned, there are many other types of passengers with extra space and boarding time needs.

Transit signal priority is also mentioned, but there is no indication of where or what priority measures were added on the pilot routes.

The remainder of this article reviews the metrics used by the TTC to track the success of the pilot project, as well as problems and actions that might be taken to resolve them.

Continue reading

Bathurst Street Proposal Update: September 2025

On September 18, 2025, Toronto & East York Community Council will consider a report recommending a revised proposal for speeding up bus service on Bathurst Street.

Back in July, the original proposal would have seen red transit-only curb lanes in both directions from just north of Bathurst Station to Eglinton Avenue. This proposal encountered substantial opposition, and the revised version is intended to improve transit and traffic operations when and where it is most needed in that segment of route 7 Bathurst Bus. There is no change proposed for the transit priority scheme for streetcars from Bathurst Station south to Lake Shore Boulevard.

The primary time and location of congestion affecting the south end of 7 Bathurst is in the afternoon, Mondays through Saturdays. To address this, the following changes are proposed:

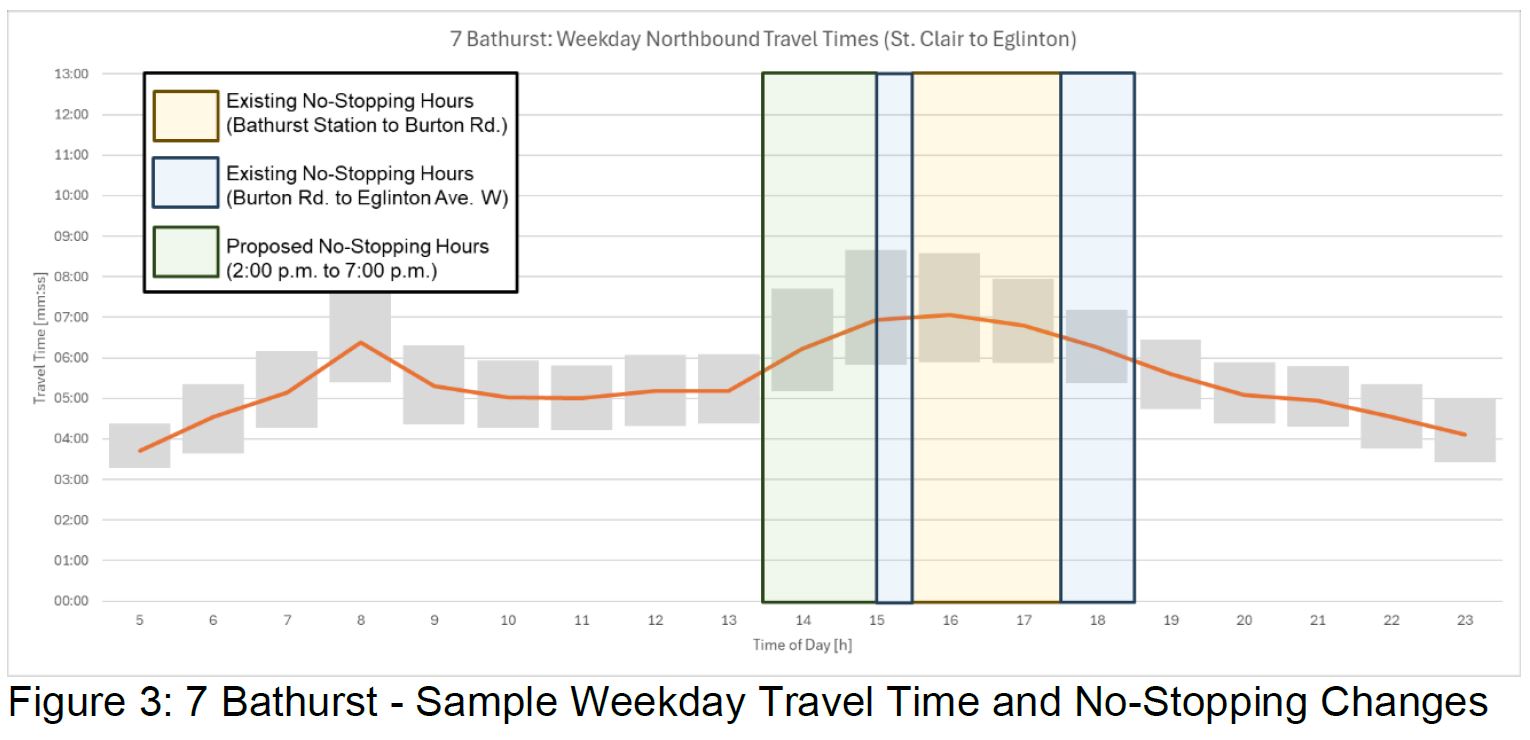
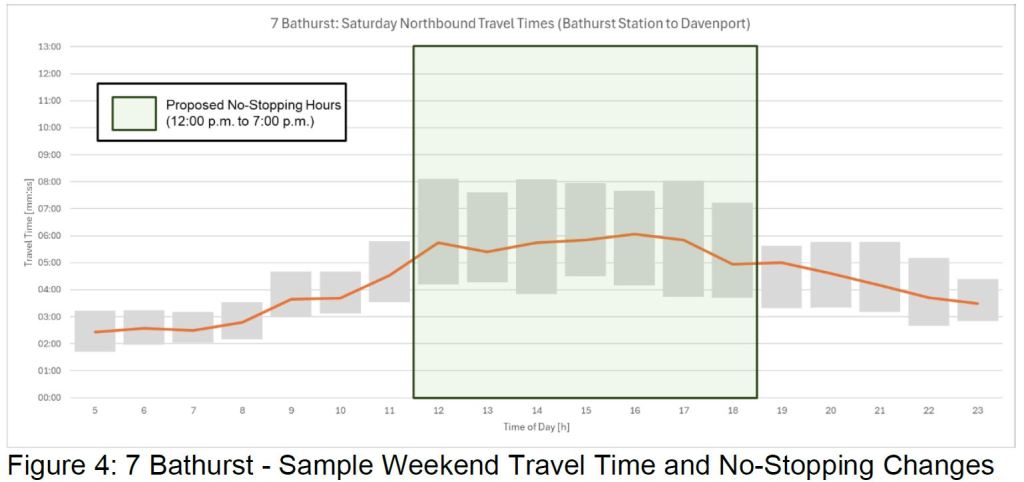
  • No stopping will be permitted on Bathurst Street northbound from the north exit of Bathurst Station to Eglinton Avenue from 2-7pm on weekdays, and 12-7pm on weekends.
  • North-to-west left turns at Bathurst & Davenport will be banned from 7am-7pm Monday to Saturday, except holidays.
  • South-to-east left turns at Bathurst & Dupont will be banned from 7am-7pm Monday to Saturday, except holidays.
  • The existing 7am-9am ban on north-to-west left turns at Bathurst & Dupont will be removed.

The chart below shows the weekday and weekend travel time profiles for Bathurst Street with the existing and planned hours of “no stopping” overlaid.

Continue reading

When Artics Aren’t Artics

Several routes in the TTC network are scheduled to operate partly or completely with 18m articulated buses in place of the standard 12m varieties seen on most of the system. A problem commonly found on some of these routes is that although the schedule assumes an 18m bus, what actually shows up is a 12m bus with less capacity.

On some routes, the proportion of shorter buses grows later in the day suggesting that for some reason the longer buses were replaced. The number of buses per hour is fairly consistent from day-to-day, and generally matches the scheduled level of service. This means that few extras (or “run as directed” buses) served these routes even though the capacity was reduced by substitution of smaller buses.

This post looks at how often this problem arises on several routes through the month of July 2025.

Continue reading

Travel Speed and Time on Bathurst/Dufferin Part I: 7 Bathurst

In recent discussions of the Bathurst and Dufferin transit priority schemes, a major issue is the degree to which various parts of the routes contribute to slower operation by time-of-day and direction. In this article and two to follow, I will review the actual behaviour of these routes to provide both a basis for discussion of expanding the priority schemes, and as a “before” reference for comparison after they are implemented.

Reviews by time-of-day are useful not just to spot peak period issues, but also as a reference for what might be achieved. At the beginning and end of service hours on most routes, there is no traffic congestion and lighter passenger demand reduces stop service time. Bettering travel times from those periods would be challenging.

Travel times are affected by many factors including:

  • Interference from other traffic on the road, and the degree of congestion for traffic generally.
  • Absence of signal priority and “priority” signals that do not adequately reflect actual operating conditions.
  • Stop service time including both the penalty for stopping, starting and rejoining the traffic flow; and passenger boarding times which depend on the volume of riders and crowding conditions.
  • The proportion of riders with large objects such as bicycles, baby carriages, shopping carts, luggage, scooters and wheelchairs. This affects not just boarding times, but also the ability of passengers to move within vehicles, particularly buses.
  • Slow driving speeds induced by a desire to avoid running early when scheduled times exceed what is actually needed.
  • Posted speed limits.
  • Weather conditions.

Express services have fewer stops and therefore lose less time on that account, but this is only one of many possible factors.

A further consideration is that for the transit vehicle, we generally talk about point-to-point times, but for a rider, “travel” includes access time to and from stops at their origin and destination. Removing stops might speed up buses, but at the cost of longer access time. This is a balancing act depending on local geography, the location of signalized intersections and major trip generators.

Travel Times and Ridership

The relationship between travel times and demand is not exact, and depends on various factors:

  • A substantial reduction in a long trip is more noticeable than a small reduction.
  • For short trips, an improvement in scheduled service and reliability will improve wait times possibly by more than the saving for in-vehicle time. This is compounded by riders experiencing wait time as longer than in vehicle travel time.
  • Comfort is important for longer trips where standing in a packed bus is no fun. For short trips the inability to board is a disincentive to ride. Speed is only one measure of attractiveness.
  • If service is changed, or stops are removed, in parallel with the reduction in travel time, it is not clear which factor influenced ridership the most.

The origin and quantity of any new riders can vary and will depend greatly on both the latent demand and the perceived improvement for travellers. Would-be riders who now drive require a substantial inducement to change modes especially if their trip would involve multiple routes of which only one was improved. Some riders may shift from nearby routes as happened with the King Street corridor, but this is very specific to local routes and riding patterns, and it does not represent net new transit users.

Any analysis is complicated by the events of 2020-25 and a major shift in overall travel including the stronger recovery of off-peak as compared to peak period demand. If transit priority only yields its greatest benefit in the peak, a large part of the travel market sees little change.

The TTC projects substantial ridership increases on Jane, Dufferin and Bathurst through the proposed transit priority schemes, and this implies both a major improvement in perceived service quality and a latent demand for better transit. However, they do not explain how they reach this conclusion nor the methodology behind their claims, nor the amount of extra service, if any, that will be fielded in anticipation of growth.

Looking at the Whole Route

The Council debate concerned only the section of 7 Bathurst and 29/929 Dufferin south of Eglinton, and of 511 Bathurst from Bloor to Fleet. An inordinate amount of time was spent on a short section of Bathurst south of Dupont. For both corridors, much work was done by local Councillors, their communities and Transportation Services to fine tune the design. This should have occurred earlier in the process.

The larger question, however, is not just the installation of transit priority over a portion of these corridors, but the routes overall and the service they provide. The TTC loves to point to external factors like traffic congestion as their rationale for irregular service, but they do not manage the service they already have as I have shown in numerous articles. Moreover, the standard on which they base reports of “reliability” is very generous for routes that only run every 10 minutes allowing a deviation between 5 and 15 minutes in vehicle spacing.

If one were to say “make it tighter”, I expect the first response would be “oh, we cannot possibly do that” even though the same standards set a tighter deviation for more frequent routes. If it is possible to manage to a six minute window on a 6 minute service, it should be possible to manage to this on a 10 minute service. TTC Service Standards excuse poor service rather than demanding excellence.

The main part of this article presents speed profiles showing details over 7 Bathurst by hour. Within these, one can see locations where transit vehicles have slow operation over extended distances, notably on approaches to intersections. These are key sites for any focus on speeding up transit service.

As a reference, the travel times over each segment, broken down by hour, are also included to show the variation over the day, and the degree of variation (standard deviation of values).

There are many charts, but only a sampling is included inline here. PDFs with full day sets are linked for those who are interested.

I will cover 29/929 Dufferin and 511 Bathurst Streetcar in Parts II and III.

Continue reading

Does TTC Mid-Point Route Management Work? (Part I)

In February-March 2025, the TTC added on-street supervisors on eleven routes in an attempt to reduce the incidence of gaps and bunching. This is described in the June 2025 CEO’s Report and the associated Metrics Report containing performance stats for the system.

Bunching and gapping of TTC service

Last March, the TTC expanded a pilot to improve service reliability on 11 key bus and streetcar routes. Working through the Transit Control Centre, uniformed Supervisors have been deployed mid-route to ensure our service frequency meets customer expectations and that we reduce the bunching and gapping of our buses and streetcars, which is a source of frustration for riders.

The pilot involves the following routes: 7 Bathurst, 24/924 Victoria Park, 25/925 Don Mills, 29/929 Dufferin, 100 Flemington Park, 165 Weston Rd North, 506 Carton, and 512 St Clair.

Starting in July, the CEO’s Report will include a Hot Topic that will provide news and updates on the progress – and challenges – related to this important issue. [CEO’s Report, p. 9]

Also:

TTC expanded a pilot to improve service reliability on key bus routes. Mid-route Field Supervisor presence on the nine priority bus routes was increased throughout the February and March Board Period, where the focus is on reducing bunching and gapping, in order to improve the reliability of service. Bunching and gapping is measured by “Headway Adherence”: the vehicle is considered on-time when the headway deviation is less than 50% of the scheduled headway. [Metrics Report, p. 15]

Mid-route Field Supervisor presence on the two priority streetcar routes continued throughout the February and March Board Period, to reduce bunching and gapping and improve the reliability of service. Bunching and gapping is measured by “Headway Adherence”: the vehicle is considered on-time when the headway deviation is less than 50% of the scheduled headway. [Metrics Report, p. 16]

Although there is a Service Standard for headway adherence, this is not measured and reported publicly, and results are never cited in ongoing service quality reports. For many years, the TTC clung to the concept that if routes were on time at terminals, the rest of the line would look after itself. However, the “on time” standard is sufficiently lax that badly bunched and gapped service can meet the target. That, combined with reporting only average results, hides the real character of service that riders experience day-to-day.

At the June 23 Board meeting, management gave the impression that they would not report on all routes in July and might have to farm some of the analytical work out.

This is a sad admission considering the years of articles I have written on service analysis showing what could be done with the hope that the TTC would develop internal tools to perform similar tasks. Sadly, however, I have been told by some at TTC they have what they need, and, in effect that I should run along and not bother them.

Partly to hold their feet to the fire, and to provide the type of information that should be routinely available to the Board, management and the public, this article will do the work the TTC claims they cannot. Here are headway reliability analyses for the routes involved over much or all of the period from January 1, 2024 to June 30, 2025.

In a very few cases, it is possible to see a change in service quality (measured as a smaller spread between minimum and maximum headways, or gaps between vehicles) around the beginning of March 2025. These are rare, and short-lived. February was a really bad time to try to implement any new practice as the city was digging out (or not depending on where you live) of a huge snowstorm. (The extended effect of the City’s poor snow clearing on transit routes is evident in the multi-day peaks in irregular service on some routes.)

I have presented 18 months of data to show that problems with headway reliability have existed for some time. There is more data going further back, but 18 months makes the point. Moreover, a consistent pattern is that headways might be well-behaved in the AM peak and Midday, but evening service does not fully “recover” from PM peak conditions, and erratic service is common.

Quite bluntly, service on all of these routes was poor, well beyond the TTC’s own Service Standards, for 2024 and early 2025, and showed little sign of improvement through to mid-year. It will be interesting to compare whatever stats TTC comes up with to the performance shown on charts here.

Part I of this series includes data for 7 Bathurst, 100 Flemingdon Park, 165 Weston Road North, 506 Carlton and 512 St. Clair. Part II will include 24/924 Victoria Park, 25/925 Don Mills and 29/929 Dufferin.

There are a lot of charts and this is a long read. I will put the “more” break here. Those readers interested in specific routes can soldier on. Thanks for reading!

Continue reading

Night Bus On Time Charts: Request For Comment

In a recent article, I detailed the headway reliability of night buses on several routes. In a comment, a reader asked if I could relate that data to “on time” performance.

There are a few problems with that concept, not least that the TTC’s own standard is so lax. The charts presented here are an attempt to show the degree to which departure times on two routes are scattered (307 Bathurst) or more closely bunched in a more-or-less reliable group (335 Jane).

Depending on reader feedback, I will include these charts, or possibly a modified version of them, in future articles about night services.

Updated June 20, 2025: The charts for 307 Bathurst Night Bus have been modified to show the advertised times of buses to show the degree to which service is “on time” or not.

A separate set of charts has been added to show the evolution of departure times northbound over the route from Front to Steeles.

Continue reading