This article updates previously published on the Dufferin bus and Bathurst streetcar routes to show how the travel times in affected areas changed with the gradual implementation of red lanes over past months.
In summary, there is a reduction in travel time during some periods, but not others, typically because congestion is not an issue all of the time. An important factor, one we saw some years back on King Street, is not just to lower travel times, but to reduce the variations that contribute to irregular headways.
With a reserved lane, periods that might not be badly congested all the time have extra protection against surges like special events or construction projects that remove some network capacity. This depends on enforcement, of course, and paint alone will not keep motorists out of transit lanes.
The balance of the article shows how travel times have evolved from 2024 to May 2026 as a reference point before the World Cup events stress the transit and road system.
Also shown here are the headways on the three services from terminals and along the route. This is a very serious problem, and, indeed, the Achilles’ Heel of the RapidTO scheme. It is not enough to reduce travel times by a few minutes if the service reliability is poor.
Riders are more sensitive to wait times than travel times, especially over shorter distances because the unreliability of a wait contributes substantially to total travel time. On a route like Dufferin with local and express service, the short travel time can be completely outweighed by the longer wait for a bus which is also likely to be crowded when it eventually arrives.
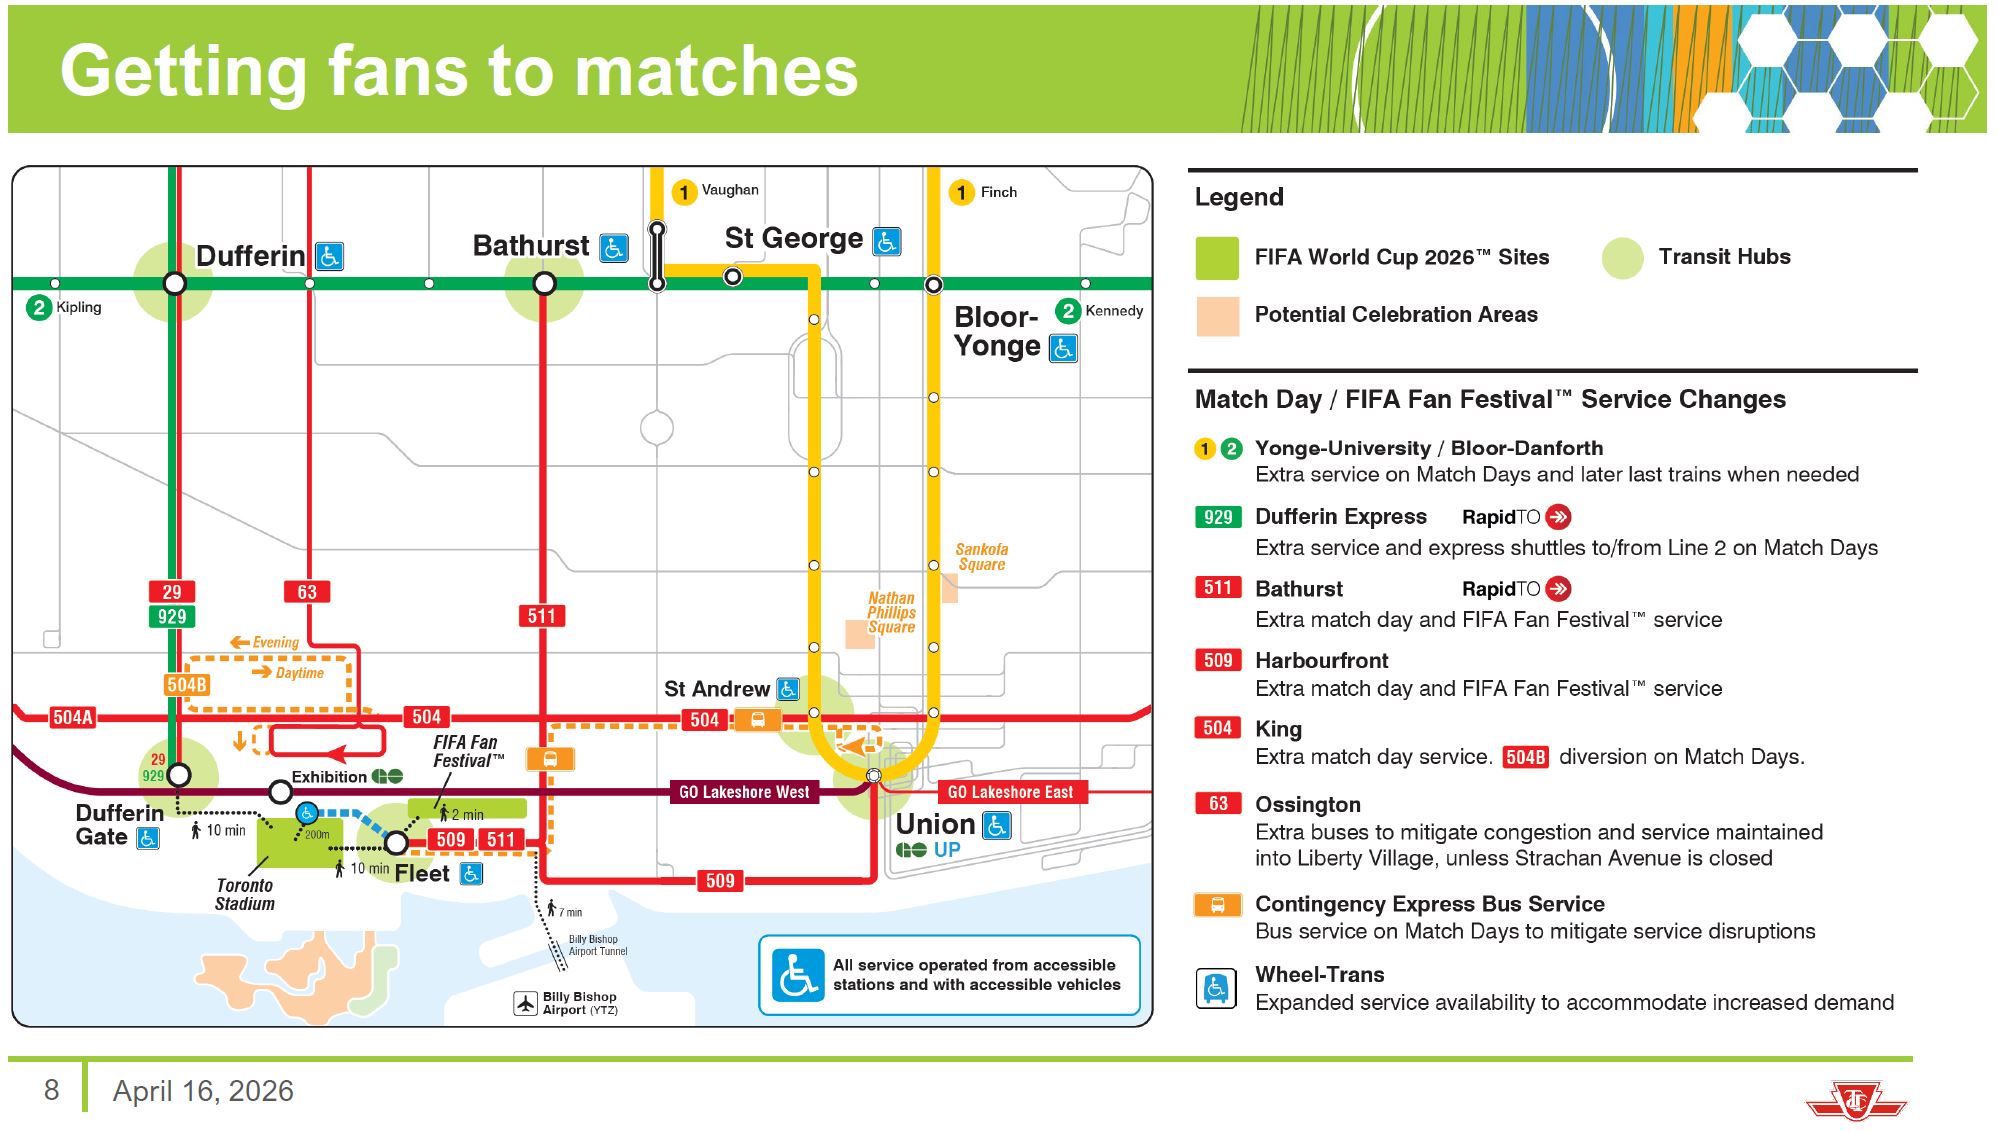
TTC Plans for service to the six World Cup games to be played in Toronto, as well as to the nearby Fan Fest area, were covered in a presentation deck in a recent TTC Board agenda. Because the Board had been rather chatty on previous items, this one was not presented although there was a media scrum afterward.
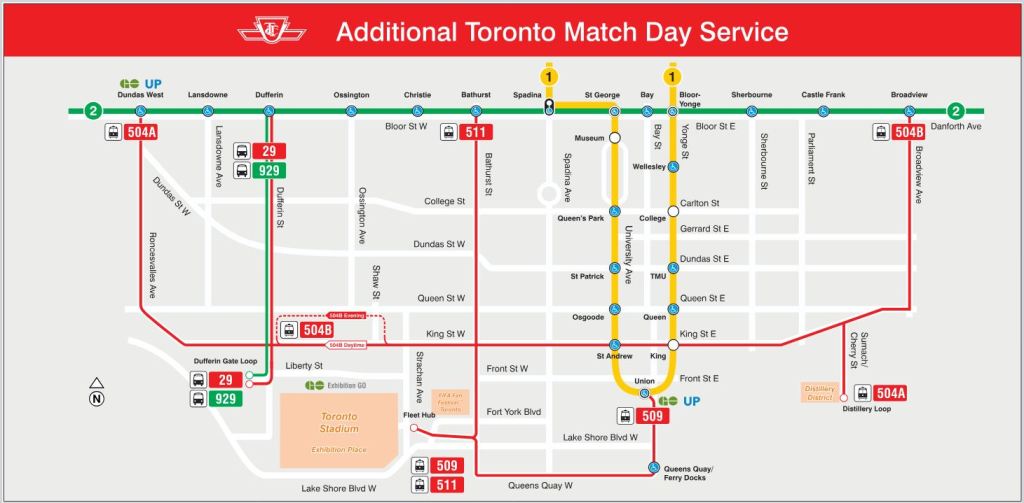
The plan for transportation to the venues depends on a combination of routes. However, the description of the service varies between the presentation deck and info on the TTC’s World Cup web page.
On the left, the presentation clearly shows the 63 Ossington bus as a World Cup route, but it is missing on the web page.
According to the web page, there will be “expanded service” on subway lines 1 and 2, and “enhanced sevice” on 29/929 Dufferin. Service on 504 King, 509 Harbourfront and 511 Bathurst will run every 5 minutes all day on game days.
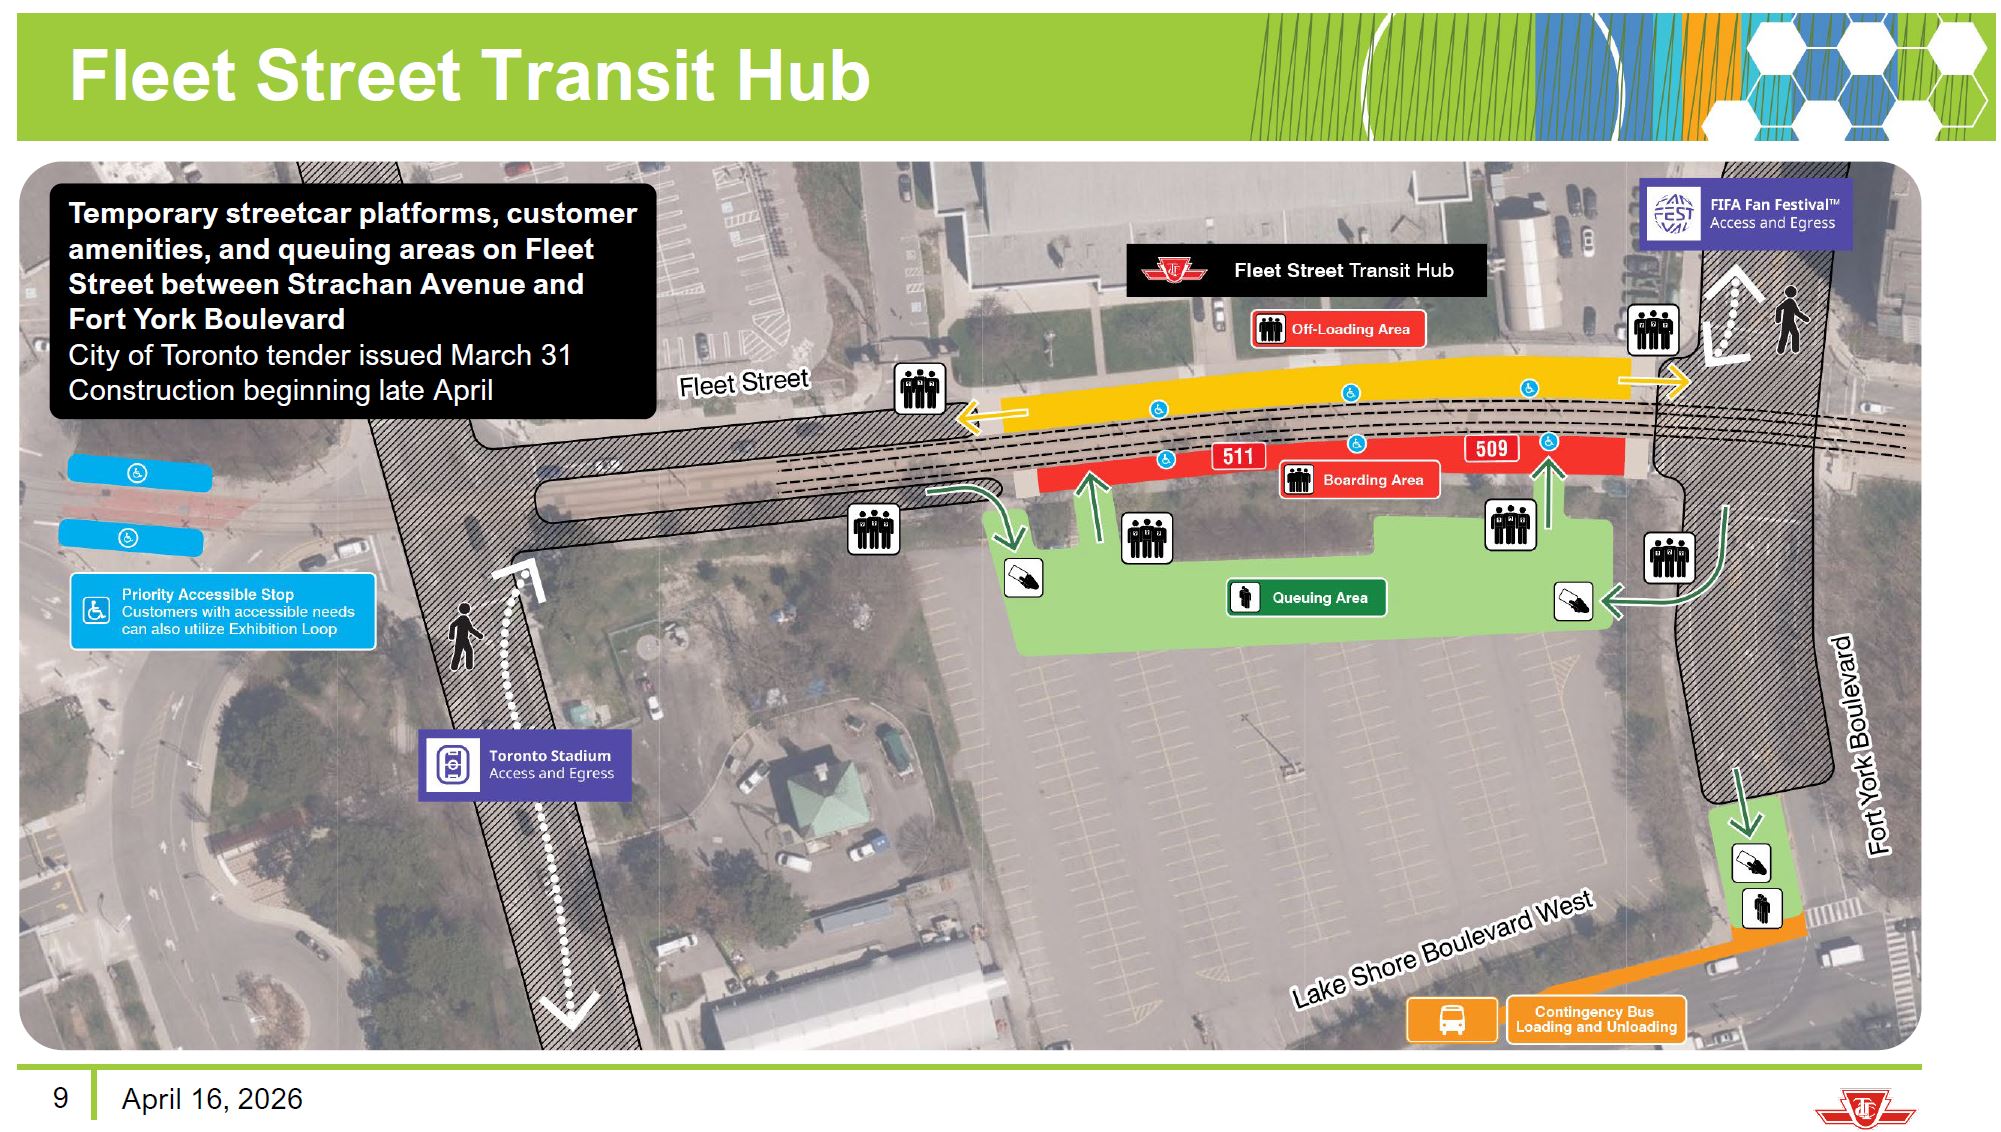
Because the 509 and 511 streetcars merge at Bathurst and Fleet, this will mean a 2’30” combined service to Exhibition Loop. That is substantial by current TTC streetcar standards, but it will only provide 24 cars per hour with a capacity of 3,600 riders, generously allowing for 150 per car. The stress on service will be stronger after games when many fans want to leave in a short period. Whether the combined streetcar, bus and GO train service will be able to handle this remains to be seen.
Note the planned access routes to the queuing area on Fleet Street includes fare payment points. This will allow the loading to occur from a fare paid zone without the delay of on board taps, and without the need for fare enforcement in a congested area. This is also shown for access to a contingency bus area at Fort York and Lake Shore, and it is reasonable to assume the same approach will be used at Dufferin Loop.
Aggressive transit priority measures will be needed to keep streets clear. Toronto does not have a good history in restricting motorists to leave the streets for transit service, and the affected areas are not just the downtown business district but residential streets.
Both Bathurst and Dufferin Streets will, by the time of the matches, have RapidTO red lanes south from Bloor. Early plans for Bathurst called for express streetcars and local bus service, but that scheme has been dropped.
I asked Josh Colle, TTC’s Chief Strategy and Customer Experience Officer, about this, and here is his reply:
Earlier iterations of our conceptual service plan envisioned removing intermediate stops along 511 Bathurst to increase the speed of travel along the corridor during the World Cup. Bus service would be provided to serve all existing stops.
With the expected travel time improvements from RapidTO, the implementation of 6-minute or better service, and further service increases during the World Cup period, the express streetcar concept was abandoned. There were also concerns about buses operating in the dedicated lanes and needing to merge in and out of potentially congested curb lanes to serve curbside stops.
This was originally seen as an opportunity to pilot a stop removal program for streetcar while operating a local bus service. However, given the recent priority to improving streetcar operations through other initiatives, our focus remains providing the best service for all customers during the World Cup period.
The TTC intends to provide Blue Night service as shown on the map below beyond the usual level.
Things do go wrong, inevitably, and here are the TTC’s preparations:
Service delivery and performance:
Supplementary supervisors in stations, on-street, and at key locations
Additional standby and change-off vehicles on all modes
Enhanced station staff, customer service and ambassadors
Real-time system oversight and coordinated decision making
Infrastructure readiness:
Streetcar switch duty operators at critical points
Extra janitorial and vehicle cleaning crews
Additional line mechanics, elevator, overhead, subway, signal, and track crews
Standby streetcar support and service trucks
Emergency safety:
Added security personnel on match days
Toronto Police paid duty officers EMS at key locations
Coordinated approach with Station staff, Transit Control and Special Constables
Continued access to social supports and resources through partnerships
This is substantially more than we see for day-to-day operations, and there may be some lessons to be learned about the level of supervisory and support services needed to handle major events and their demand.
(The reference to switch duty operators is a tad embarrassing considering that the planned streetcar routes do not involve any manual switches, and this does not show great confidence in their existing technology.)
There will be “testing exercises” although the exact scale of these is not yet known.
Finally there are plans for enhanced and visible safety and security with the use of Special Constables, Fare Inspectors (Provincial Offenses Officers) and contract security staff. Ideally, as many riders as possible will pass through fare controls at some point in their journey and extensive fare checks on board will not be needed. More important will be visibility of staff who can intervene, if only to report issues and act as a visible deterrent.
Management will bring an updated plan to the June 3 Board meeting.
This article includes reviews of the 29/929 Dufferin local and express services to the end of 2025. The major item of interest is the introduction of “red lanes” south of Bloor Street and their effect on the bus service. Detailed charts are included here for:
November and December travel times in both directions between King and Bloor.
January 2024 to December 2025 historical stats on travel times.
The segment between Lawrence and Wilson that does not have transit priority, but which has much more congestion than at the south end of the route thanks to Yorkdale Mall.
General observations:
The benefit of the red lanes is more pronounced for northbound than for southbound trips, and only at certain times of the day.
There is much more severe disruption of service northbound near Yorkdale Mall, but no transit priority measures are proposed there.
Headways on Dufferin remain widely scattered near terminals (northbound at King, southbound at Transit Road just outside of Wilson Station).
Even on Christmas Day when weather was relatively benign and travel times were lower than normal, headways were not reliable.
Part of the improvement in travel time in December 2025 could be due to seasonal effects. When the data are in for early 2026, we will see how long-lived the saving actually is. I will publish an update to this article in a few months when the pattern is clear.
There are a lot of charts in this article, and I have put them all after the “more” break. Those who are interested in the details can open the full article.
I will turn to a review of 511 Bathurst streetcar and 7 Bathurst bus which both saw recent changes in future articles.
Update: For clarity, the red lanes currently extend only as far north as Dundas. After work up to Bloor is completed in the Spring, I will publish an update showing the effect.
The TTC has a pilot program underway on several routes with increased supervision in an attempt to improve service quality by addressing service gaps and bunching. These are complementary effects in that a gap is often followed by a bunch, although gaps can also occur due to missing vehicles and short turns. See:
The pilot evolved over the year as some of the challenges and resource needs to manage service became apparent.
March 2025
Pilot launched on 7 Bathurst, 24 Victoria Park, 924 Victoria Park Express, 25 Don Mills, 925 Don Mills Express, 29 Dufferin, 929 Dufferin Express, 100 Flemington Park, 165 Weston Road North, 506 Carlton, 512 St Clair. Dedicated staff to manage each route were not used initially and results were poor.
June 2025
The pilot was scaled back to 7 Bathurst, 24 Victoria Park, 924 Victoria Park Express, 506 Carlton, and 512 St Clair. One route supervisor was assigned to each route.
September 2025
100 Flemingdon Park and 165 Weston Road North were added.
October 2025
Pilot “refined” to focus on the weekday peak periods.
The TTC recognizes that delays leading to gaps can be caused by several effects: “including including Operator behaviour, customer incidents, traffic congestion, city events, construction, and operational factors, such as door/ramp operations.” [p. 2]
Later in the report, there is mention of the effect of passenger loads and long traffic signal wait times.
If vehicles are crowded either because service is inadequate for demand, or because a gap creates an extra load, they will take longer at stops. Filling vehicles to the brim can be counter-productive and inefficient. Space limitations onboard can delay passenger movement especially for those with large objects (e.g. strollers, luggage) and mobility devices. Although ramp operations are mentioned, there are many other types of passengers with extra space and boarding time needs.
Transit signal priority is also mentioned, but there is no indication of where or what priority measures were added on the pilot routes.
The remainder of this article reviews the metrics used by the TTC to track the success of the pilot project, as well as problems and actions that might be taken to resolve them.
The City of Toronto has announced that work at King & Dufferin is finished and the intersection will reopen to traffic on Wednesday, October 29 after 7pm.
Regular service will be restored on 29/929/329 Dufferin, and the 503 Kingston Road bus will be extended west from Joe Shuster Way (east of Dufferin) to Roncesvalles at 5am on Thursday, October 30.
TTC will test the new track and overhead during the week of November 3 and will restore 504 King and 508 Lake Shore services from their current Shaw/Queen diversion when the intersection is cleared for streetcar operation.
Meanwhile, the TTC CEO’s Report notes that six minute or better service will come to 505 Dundas and 511 Bathurst from 7am-7pm 7 days/week starting November 16.
There are many diversions coming up in the Fall for streetcar routes. Information on these appears in various places on the TTC site, mainly but not exclusively under Service Advisories. As an aid to riders, this article consolidates the available information in one place.
Updated November 28, 2025
***** This article is only for archival purposes. It has been replaced by a new one picking up from mid-November 2025. *****
Major events pending and in progress include:
Construction on Queen between Davies (just east of the Don Bridge) and Broadview.
Reconstruction of the intersection of College and McCaul, and of overhead in the vicinity.
Reconstruction of track and overhead at and near Parliament and Carlton.
Other short term diversions will last only overnight or for a weekend.
Many of these are complicated by the ongoing Ontario Line work at Queen & Yonge forcing some diversions to be more complex than they might be otherwise.
This article will be updated when changes are announced.
November 21: The 501 diversion via Broadview, Dundas and Parliament around water main and track work west of Broadview will begin on November 22.
November 20: Equipment and material mobilization is underway on Queen west of Broadview.
November 17: The 506 diversion has been changed today to avoid the intersection of Church & Dundas where construction blocks the northeast corner. Maps have been added from the TTC’s site.
Effective November 16: The 503 Kingston Road bus will be cut back from Dufferin, and will now loop at York Street via Richmond and University.
November 15: Diversions announced for two projects on 506 Carlton at Parliament & Carlton, and on Gerrard east of Broadview.
November 9: King & Dufferin reopened for streetcar service. 503, 504, 508 will operate via their normal routes.
October 30: King & Dufferin reopens for general traffic and buses. Streetcars to return following track testing.
October 20: Water main reconstruction on Queen west of Broadview has been delayed until early November. 501 Queen streetcars will continue to operate on Queen Street until further notice.
October 13: 504 King is operating with streetcars today over its full route except for the King/Dufferin diversion.
October 9: Maps for 504 King and 506 Carlton diversions added.
October 8: Construction at Queen & Broadview will not start on October 12, and so some diversions will not be required immediately. Information for 501 Queen and 503 Kingston Road has been updated.
October 5: Nuit Blanch & Run For the Cure info moved to the archive section.
October 1: Diversions of 505/305 Dundas and 506/306 Carlton for Nuit Blance and for the Run For The Cure added for October 3/4/5.
September 23: The King/Dufferin start date has been changed to Sunday, September 28.
September 12: King/Dufferin start date pushed back to September 29 or later. The project will now extend to mid-November.
September 9: College/McCaul and Queen East details added.
August 26: King/Dufferin Project
The start date for this project has been changed to mid-September with the exact date to be confirmed. Although new schedules will be in place providing for diversions, service will continue to operate through on King Street until construction actually begins. This likely means that the project will extend further into October than the originally planned Thanksgiving weekend end date. The delay also means that the Tiff diversions will end before the King/Dufferin diversions begin.
Branch lettering for 504 King A/B corrected.
August 25: King/Dufferin Project
Information about Kingston Road night service added.
304 King and 329 Dufferin confirmed to be diverted on the same routes as the 504A and 29 daytime services.
Several routes in the TTC network are scheduled to operate partly or completely with 18m articulated buses in place of the standard 12m varieties seen on most of the system. A problem commonly found on some of these routes is that although the schedule assumes an 18m bus, what actually shows up is a 12m bus with less capacity.
On some routes, the proportion of shorter buses grows later in the day suggesting that for some reason the longer buses were replaced. The number of buses per hour is fairly consistent from day-to-day, and generally matches the scheduled level of service. This means that few extras (or “run as directed” buses) served these routes even though the capacity was reduced by substitution of smaller buses.
This post looks at how often this problem arises on several routes through the month of July 2025.
The TTC has announced its services for the CNE for 2025 to operate from Friday, August 15 to Monday, September 1.
CNE Express buses will operate non-stop between Bathurst Station and Exhibition Loop, and between Dufferin Station and Dufferin Loop.
Extra service will operate on the 29 Dufferin and 929 Dufferin Express bus routes, and on the 509 Harbourfront and 511 Bathurst streetcar routes.
Other routes will change to accommodate the CNE services and traffic conditions.
63 Ossington buses normally loop at King via Strachan, East Liberty, Liberty and Atlantic. This will change so that buses loop via Fraser, Liberty and Atlantic.
503 Kingston Road streetcars will be extended west from Dufferin to Sunnyside Loop between 2pm-1am weekdays and 9am-1am on weekends.
510 Spadina streetcars will terminate at Queens Quay Loop until 7:30pm daily, and will run to Union Station afterward.
This is the second part of a series showing details of travel times in the Bathurst and Dufferin corridor.
For introductory remarks and a discussion of general issues, please refer to Part I.
The main part of this article contains the charts for the local and express bus services on Dufferin Street in June 2025.
Although the focus of recent debates about transit priority for Dufferin was from Eglinton south, data here show that there are issues with extended running times, particularly in the afternoon, over the full route with northbound trips taking the lion’s share of the delay. Express trips are faster than local trips, but by varying amounts over the route. The least benefit is on the southern portion of the route where red lanes will be installed, and where staying in those lanes could prevent express buses from leap-frogging the locals.
There are some areas where traffic slows in advance of an intersection, but more common is a general slowing down of bus speeds over the route representing overall traffic speed and longer stop service times when the route is busy.
Data shown here are from June 2025 with both the local 29 and express 929 services plotted together for comparison. In many times and locations their speeds are comparable, while in others the express buses have higher speeds than the locals.
The main article contains all of the charts including PDFs with all day sets.
This article continues the analysis of service on routes where the TTC claims to be implementing mid-route headway management. The routes included here are:
24/924 Victoria Park
25/925 Don Mills
29/929 Dufferin
See Part I for a general introduction and details of 7 Bathurst, 100 Flemingdon Park, 165 Weston Road North, 506 Carlton and 512 St. Clair.
A common factor evident in the charts for these routes is that service near the origins of routes is barely within the target range for headways, and more commonly well beyond it. AM peak service might squeeze within the target, but service falls apart from midday onward and does not recover in the evening.
Although the TTC reports performance based on “on time” departure from terminals, they actually have a headway standard, but never report on how well routes meet it. Note that the standard actually is very generous and allows a wider range of headways than the “on time” standard. For example, a bus operating every 10 minutes is allowed a 50% headway deviation either way meaning that the actual headway could be anywhere from 5 to 15 minutes, and 40% of the service can be even worse. This is a standard designed to make management look good to those who don’t peer “under the covers”.
For services that operate between 5 and 10 minutes, passengers do not rely on printed schedules, but expect vehicles to arrive at prescribed headways. Therefore, on-time performance for frequent service is measured by how well actual headways correlate to scheduled headway intervals. Trips are monitored at a location based on arrival time, without regard to whether the trip that arrived was scheduled for that time slot. The vehicle is considered on-time when the headway deviation is less than 50% of the scheduled headway. For example, a service that operates every 6 minutes is deemed on-time if the headway deviation falls between 3 minutes and 9 minutes. TTC’s goal is to have 60% of all trips operated within +-50% of the scheduled headway over the entire service day. [Service Standards at pp 15-16]
The TTC plans a review of its Service Standards in coming months. That review and much-needed reporting on service quality are long overdue.
Express routes can have very wide ranging headways making their benefit to riders dubious. The wait for an express bus can be longer than the travel time saving from skipped stops. Meanwhile riders at “local” stops cannot benefit from the express vehicles. The TTC plans a review of its Express Network later this summer, and service reliability should be a major issue. It is not enough to advertise a faster trip, but the network must actually provide it, including waiting time, reliably.
Another factor that appears in some of these charts (as well as in Part I) is that for some periods there is more service on a route than is scheduled. This is due in part to the assignment of the “run as directed” buses to supplement regular routes. However, the base schedule is not adjusted, and the RADs do not create a uniform combined headway. They can even contribute to bunching by running close to a scheduled run.
TTC still has not deigned to release detailed data from their APCs (Automatic Passenger Counters) and only coarse information (corresponding to the three levels of loading shown on their real time info) is publicly available. I have asked many times, but this request goes nowhere. Without detailed data it is impossible to know the loads on buses or to differentiate between a modest seated load and a partially standing one. Considering that the Service Standards call for at most a few standees in the off peak, this distinction is crucial to evaluating how service matches the standards.
When the use of RADs to supplement service began, the intent was to soak up spare bus operators (not to mention spare buses) without committing to a permanent service improvement. There has been no external report on whether the added service improved ridership, or the effect of its withdrawal.