According to a bulletin from the TTC’s Safety and Environment Department, effective May 24, 2026 some speed restrictions that hobble streetcar operations will be dropped.
At crosswalks and signalized intersections, streetcars are now restricted to entering at 25 km/h. This will change so that cars can operate at up to the posted speed limit.
The 10 km/h speed restriction at intersections on The Queensway will be removed, and cars can operate up to the posted speed limit.
Intersections with special work, or with other explicit restrictions, continue to be subject to slow orders.
Notwithstanding these changes, Operators are expected to drive defensively and adapt to road and weather conditions.
This is a first step in attempting to speed up streetcar routes, but the limits at special work (switches, crossings) remain in place. This will not change, if at all, without a thorough review of factors contributing to that long-standing policy including:
Reliability of electric switch controllers,
Benefits of double-blade switches for Flexity streetcar movement through turns, and
Signaling to provide a positive indication for operators that switches are set and locked to the desired route.
That study is underway, but we are unlikely to see major changes quickly especially if replacement of existing track and controllers is needed. Related issues include:
The number of manually operated switches at locations where streetcars regularly turn for diversions and short turns, and
The degree, if any, of aggressive transit signal priority provided at existing and future switch locations.
Removal of speed restrictions related to trolley pole operation notably at low underpasses.
It is not clear why there is a delay of over three weeks for this change to take effect, but it will be in place before the World Cup games.
The TTC Board agenda for its April 16 meeting includes a pair of reports giving the year-end status for the Operating and Capital budgets, as well as a detailed update on major capital projects.
In this article, I will review the status of major projects to summarize info for readers. In a separate article, I will turn to the 2025 operating results. Those wishing more detail should refer to the full reports.
An important factor with many projects is that they are multi-year efforts, and some of them are not fully funded. This has different implications for various types of projects such as:
A project might still not have full funding, but a portion can proceed with the hope of additional moneys appearing along the way.
A project might have stages, but only be funded for some of them. A new vehicle purchases might have money for part of an order, but not for a sustained rollout.
Projects could be interrelated in that full exploitation of benefits cannot be achieved without completion of both. For example, a new Automatic Train Control cannot work without a fleet that can “talk” to the new signal system. Larger fleets cannot be accommodated without new storage and maintenance facilities.
Although these are large and in some cases quite expensive projects, this is not an exhaustive list. Some parts of TTC State Of Good Repair budget involve areas with many smaller projects (for example, building and structures maintenance) that are quite large in the aggregate. Vehicle overhaul is an ongoing cost, but it is not listed as a “major project” because it is routine work. These items do not appear in the Major Projects report although they comprise a large portion of the capital budget.
The projects discussed here are:
Subway Work Car Fleet and Maintenance
Station Easier Access, Second Exits and Fire Ventilation
New Subway Cars for Lines 1 and 2
ATC Signals for Line 2
Rogers 5G Rollout
Capacity Enhancements for Lines 1 and 2
Bloor-Yonge Capacity
Scarborough Busway Project
New Buses for Conventional and Wheel-Trans Service
Updated April 13 at 10pm: Comments added about line management practices.
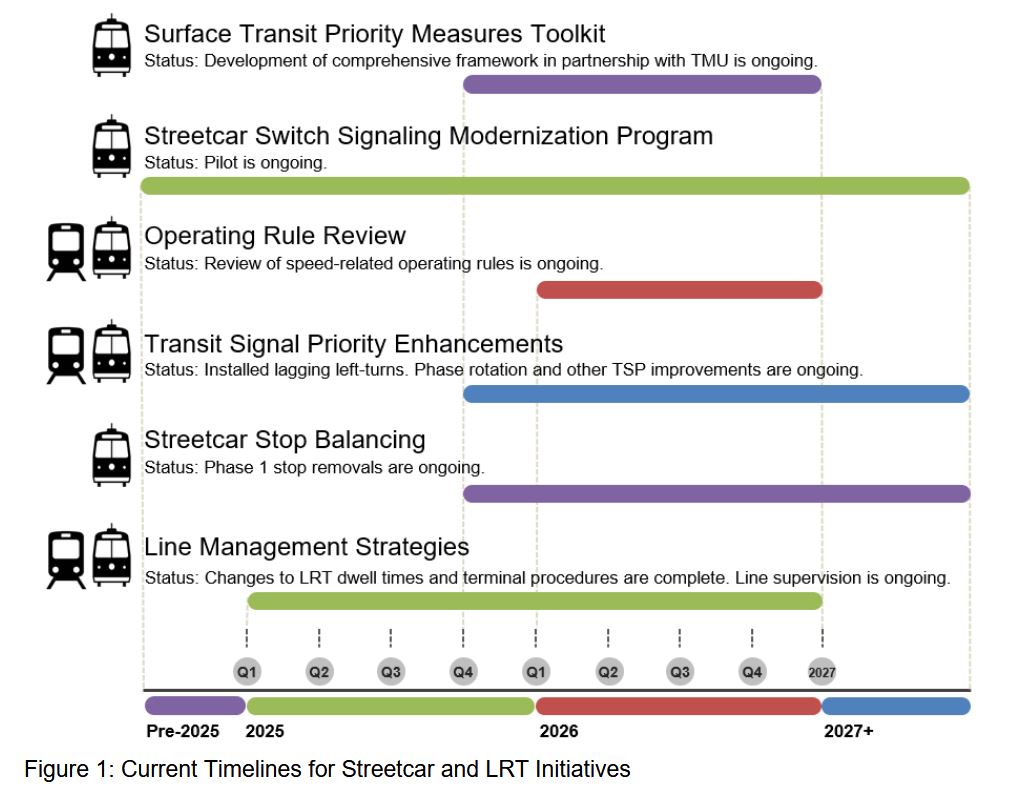
Various tactics are proposed including priority measures and a review of operating practices that can hobble streetcar service. A problem with some of the analysis is a poor or forgotten history of how current arrangements evolved. In some cases, there is a confusion of cause and effect, of equating co-incidence with causality. Some potential solutions have extremely long lead times that will doom riders to slow operation for years if not decades.
A thread running through some issues is slow operation at junctions where streetcar tracks diverge and cross. TTC has a lot of these thanks to its network descending from a dense grid of streetcar lines over a century old. Recently, operating practices from this “legacy” system were exported to the new LRT lines 5 Eglinton and 6 Finch giving these routes, and the technology generally, a black eye. The bad reputation is so severe that new “LRT” proposals face stiff criticism and outright “we told you so” hostility.
The blame for this rests squarely with TTC, Toronto Transportation Services, and Metrolinx who collectively accepted a much-diluted version of “priority” compared to what was promised during project development. This has been partly remedied, but should never have been allowed in the first place. Imagine if a new subway line opened with permanent slow orders. This would have been laughable and unacceptable, but for a “streetcar line”, it’s just fine.
Six areas are proposed for review on the timelines shown below. The troubling part of the chart is the section labelled “2027+” which reaches into the indefinite future.
The TTC’s Audit & Risk Management Committee will meet in the Boardroom at TTC Headquarters, 1900 Yonge Street, on Wednesday, March 11 at 9:30am. Two items on the agenda are of considerable interest:
The review of customer performance, metrics and real-time information covers at length the many problems with passenger information from the TTC including its website and various outlets for notices including social media and apps. This is an unusually candid review and long overdue.
Also included are charts showing the status of various recommendations from TTC and City audits, as well as from outside reviews. However, these are only summaries and there is no link back to source documents to cross-reference specific items, their severity and status.
Two confidential attachments address “The Subway Tunnel Maintenance and Rehabilitation Audit” as well as some findings from the UITP review.
Updated March 11 at 12:45pm:
Much of the meeting was conducted in camera. In the public session, a few concerns arose from the Committee:
There is a large and growing list of outstanding recommendations from both TTC Internal Audit and the City Auditor General, and the Committee was concerned about how, especially, high priority issues are tracked especially when they fall behind previously-promised due dates.
Although there was brief discussion of the issues of public facing information and performance metrics, the primary comments had the sense that finally problems are recognized, but without debate on specifics.
With respect to overtime, the Auditor will concentrate on exceptional cases where payments exceed expectations. Future reports will break down overtime by cause for clarity, e.g. planned work, weather related, special events, etc.
The TTC Board will meet on Tuesday, February 3, 2026 at 9:30am in North York Council Chamber. The agenda is rather thin, and there are several confidential issues that will trigger an in camera session. There is no formal item regarding Line 5 Eglinton, although one never knows what might come up in debate.
Of interest are the following items:
Updated February 2 at 10:10am: Slide decks for the invited presentations have been posted on the TTC site. Links to them are added below.
Narayan Donaldson on “Opportunities to improve Transit Signal Priority in Toronto”. According to the covering report “This presentation will discuss the strengths and weaknesses of the Transit Signal Priority (TSP) system used on Toronto’s streetcar, bus and LRT systems, compare it to a TSP system commonly used in the Netherlands, and suggest areas of improvement.”
Jonathan English on “Developing a Surface Transit Revitalization Plan” According to the covering report “This presentation will discuss steps that can be taken to improve speed and reliability of the streetcar network, as well as new LRT lines.”
After the meeting, I will write up the presentations in an update to this article.
Today, Ontario announced that it would raise the Canadian content in 55 new Line 2 trains from roughly 25 to 50 percent. The provincial capital subsidy for this purchase will rise from $758-million to $950-million, and the increase will be matched by the federal government who are also funding this purchase. There is no change in the Toronto share.
It is not clear whether the federal contribution is net new money, or merely a reallocation within Toronto’s share of the ten-year transit funding program.
Updated January 16, 2026: According to the federal government announcement, the funding will come from an existing allocation stream and is not net new money.
This project is part of the previously announced 10-year funding commitment under the Baseline stream of the Canada Public Transit Fund (CPTF). Beginning in April 2026, the Toronto Transit Commission will receive up to $1.2 billion in CPTF funding over 10 years from 2026 to 2036.
A related question is which government(s) will be on the hook for the extra CanCon in future transit vehicles including those for the Scarborough and Richmond Hill extensions, and for added capacity to deal with expected growth. Collectively these account for a potential 57 more trains, doubling the size of the eventual order.
What the announcement did not address is a list of questions about the Toronto subway fleet overall:
When will the cars be delivered, and how much work is needed to keep the old Line 2 trains operating in the interim?
When will Metrolinx place the add-on orders to provide trains for the Line 2 Scarborough and Line 1 Richmond Hill extensions?
How will delivery of the add-on trains affect opening dates for the extensions?
Will complete replacement of Line 2 trains be delayed because new trains are needed to provide service on these extensions?
Will the extensions have enough trains to provide full service to the new terminals, or will some trains have to short-turn in peak periods?
How soon does the TTC project it will require more trains to improve capacity on Lines 1 and 2, and how will these be funded?
What is the status of funding and timing for new maintenance facilities on Lines 1 and 2 to hold and service the additional trains?
Will the Automatic Train Control (ATC) technology for Line 2 be the same as the existing system on Line 1, or will the two lines (and their fleets) be limited to use only their “own” trains?
The TTC produces a quarterly report on all its major capital projects with the intent of showing all planned work, but it does not produce a unified chart or timetable showing how everything fits together and where critical links might be in the overall plan. The TTC has a “Strategic Planning Committee”, and this is a complex piece of strategy that badly needs detailed, public review.
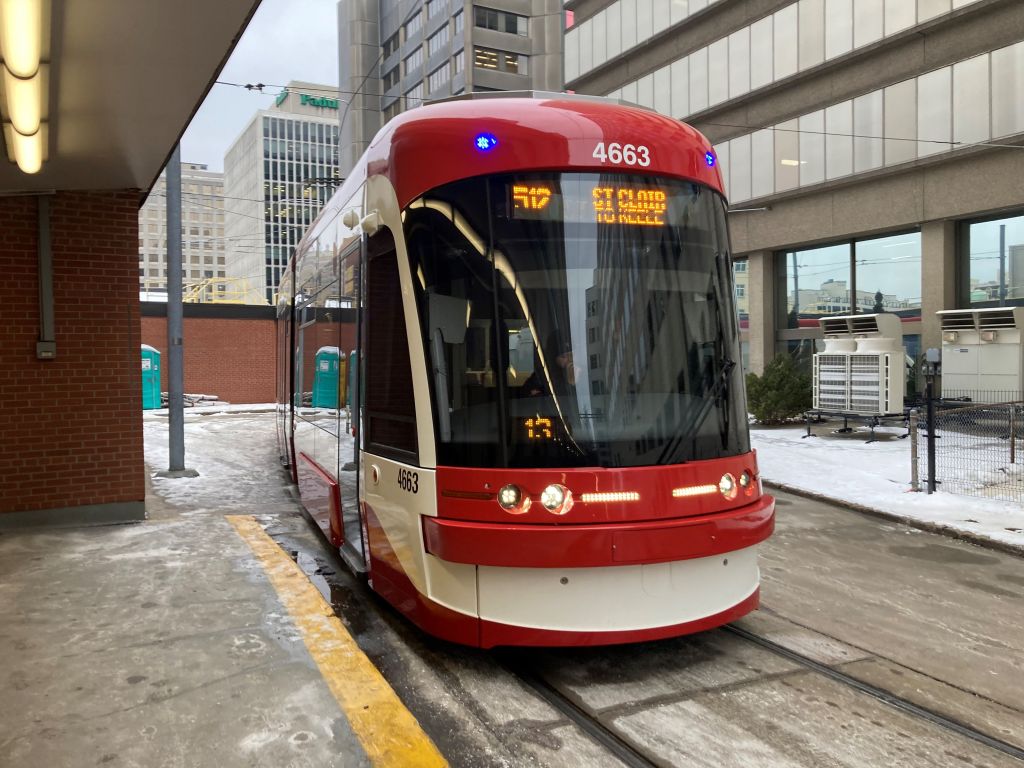
The last of the TTC’s 60-car add-on streetcar order arrived in Toronto recently, and entered service on December 16, 2025. This brings the streetcar fleet to 264 vehicles.
4663 at St. Clair Station Loop, December 16, 2025. Photo by Jeffrey Kay.
With so many streetcars, the real shame is that the service is so poor on many routes through a combination of 10-minute headways and erratic operation, not to mention the effect of never-ending diversions, construction projects and bus replacements.
The TTC began a shift to a 6-minute headway standard with 512 St. Clair earlier in 2025, and this was followed by 505 Dundas and 511 Bathurst in mid-November.
Due to construction at Queen & Broadview, the 503 Kingston Road car is operating with buses, and will continue to do so at least until April 2026. There are moves afoot within the TTC to kill off the all-day operation of the 503 downtown, but one of its biggest challenges comes from irregular service on the 503 itself, and the total absence of headway blending where the 503 joins the 501 Queen car westbound at Kingston Road and Queen. Pairs of 503 buses are a common sight today, and 503/501 pairs were common when streetcars plied both routes.
The TTC simply does not take seriously the effect of unreliable service on ridership.
As we see a move to a new 6-minute standard, the question is just how far the 264-car fleet will stretch. The table below shows all of the streetcar routes with headways and PM peak car requirements. Toronto has not seen every streetcar route active at the same time for a very long time thanks to equipment shortages during the later days of the CLRV fleet, and the omnipresent construction projects that always managed to keep a route running with buses. One might think that the TTC overextended its route closures simply to save on streetcar operations.
In fact, a big shortage lies in operating staff and in budget headroom to field more cars on a scheduled basis.
If all streetcar routes were operating with streetcars today, the TTC would need 172 cars for service. A 20% provision for spares would raise this to 206 leaving a substantial pool of cars on the sidelines.
The right-most column below shows the current peak requirements scaled up for routes that now run on headways above six minutes. For example, getting 501 Queen down from a 9-minute to a 6-minute service would require 14 more cars. The total for an all-streetcar operation would be 215 cars, plus 43 spares for a total of 258, only slightly below the fleet size.
Until we see details of the 2026 budget, we will not know if any more routes will join the 6-minute network in the coming year.
Route
Headway
Peak Cars
Cars Required for 6-Minute Network
501 Queen
9’00”
28
42
503 Kingston Road to York (April 25)
10’00”
12
20
504 King (April 25)
5’00”
27
27
505 Dundas
6’00”
25
25
506 Carlton (Sept 25)
10’00”
19
32
507 Long Branch
10’00”
8
13
508 Lake Shore
Trippers
5
5
509 Harbourfront
9’00”
6
9
510 Spadina
5’00”
14
14
511 Bathurst
6’00”
14
14
512 St. Clair
6’00”
14
14
Total
172
215
The 60 new cars were intended both to handle growth and to provide for the Waterfront East line that is still only a faint hope for better transit there. An update on this project is expected at Council early in the new year, but a projected opening date lies in the 2030s.
The TTC is also short carhouse space. Thanks to the arrival of all 60 cars well before planned work completes to expand storage and maintenance capacity at Russell and Hillcrest. Part of the main shops will be converted as a streetcar barn serving 512 St. Clair and possibly 511 Bathurst. Several Blue Night streetcar routes operate with improved headways simply to reduce overnight storage demands on the carhouses.
The streetcar system always pulls up the rear in reliability stats, and recovery of pre-pandemic demand is not as strong on that part of the network as elsewhere. This is due in part to a shift in travel and work patterns in the area streetcars serve, but one cannot help wondering how much the erratic service deters riders from returning.
An ironic side-effect of a move to 6-minute service is that this makes “on time” an easier target, but with bunching as a daily event. The reason is that TTC vehicles can be up to 5 minute late and still count as “on time”. On a 6 minute headway, this easily leads to pairs of “on time” vehicles every 12 minutes. The real condition of service is hidden by a too-easily attained “target”.
The bus network also has fleet utilization issues, but these are a mixture of scheduled service levels, vehicle reliability, budgeted headroom for growth and the use of “Run As Directed” buses. The “RADs” are a relic of the Leary era that were routinely cited as a catch-all alternative to addressing specific problems. The vehicles were not well-used and their numbers dwindled as the pool of spare operators moved to other duties, notably on Lines 5 and 6. I will turn to the bus fleet in a future article.
For 2026, streetcar routes face many challenges:
Provision of enough budget to allow improved utilization of the streetcar fleet.
Service management that actually brings evenly spaced streetcars on dependable headways.
Addressing the validity of operating practices that hamper streetcar speeds everywhere, rather than just at locations with problems such as badly worn track. This includes sorting out constraints that really do relate to “safety” as opposed to using that as a catch-all excuse for padded schedules.
Addressing track switch controller issues that have plagued the streetcar network for decades.
Providing real transit signal priority for streetcars including at locations where diversions and short turns see streetcars fight through traffic attempting turns with no signal assistance at all.
An end to construction diversions scheduled for longer periods than actually needed to complete road, water, track and overhead repairs or upgrades.
Getting City projects that are supposed to be co-ordinated with streetcar track and overhead repairs to actually start and end when they are planned.
The last of the 60-car add-on order of Flexitys arrived at TTC Hillcrest on November 18, 2025.
This brings the fleet to 264 cars, although one long-time out-of-service car remains offsite for repairs.
Current peak requirements are for 165 cars. About a dozen more would be needed to reactivate 503 Kingston Road, now bus route due to construction diversions, to its traditional terminus at York Street, more to continue further west to Spadina or Dufferin.
Allowing for spares at 20%, the TTC will still have roughly 50 surplus streetcars. Some of these will be soaked up by the move to 6-minute headways on all routes (subject to budget approval, as always), and some by the Waterfront East route if that is ever built. The next WELRT status report is to come to Council early in 2026.)
Work is underway to convert part of Harvey Shops (the building behind 4663) into a carhouse to operate 512 St. Clair and at least part of 511 Bathurst, in effect restoring the function once performed by St. Clair Carhouse on Wychwood. With the longer Flexitys, the transfer table at Hillcrest cannot be used, and tracks must be converted to through-running across the transfer table runway. This work is expected to complete in two phases with storage for 25 cars and temporary pre-servicing facilities in Q4 2028, and with permanent facilities in Q3 2029.
The TTC has an open RFP on the Bonfire site for a Triennial Contract for design services for its streetcar overhead contact system. Much of this document is boilerplate legalese, but the scope of work shows that the TTC plans to address key issues with systems related to streetcar overhead. Five specific tasks are listed in the RFP and more might be added over the term of the contract.
Overhead/Traction Power Supply Study
This involves a review of the existing system that supplies power to streetcars and the demands placed on it as vehicles move through the network. There is no mention of modelling the effect of increasing service, but this should obviously be part of the study to determine where constraints might exist to service growth. (The recent suspension of streetcar service on Bathurst during the busy CNE period thanks to a power supply failure is an obvious incentive for this work.)
Overhead Design for Interections
This task would review existing intersections with a view to improvements where appropriate.
Overhead Design for New and Existing Lines
The title is self-explanatory but it begs the question of why a new design is needed for the existing system, much of which has been rebuilt once for dual-mode trolley pole and pantograph operation, and again for a pantograph-only configuration. The latter work is still in progress, and is responsible for some of the extended bus-streetcar substitutions in recent years. Also notable is the absence of any reference to eBus charging infrastructure.
Streetcar Track Switch
Although track switches are not part of the power supply to streetcars, historically they were controlled through hardware mounted on the overhead wires. The current system uses antennae in the pavement and on streetcars, and responsibility for the system rests with the Streetcar Overhead section.
Streetcar Signal System Alterations
The definition of this task is unclear in that there are almost no signals anywhere on the streetcar system. Moreover, there is no reference to the interface between streetcar operations and traffic signals.
In this article I will address only the last two items as they are both related to issues of streetcar operating speeds, a topic raised in a recent UITP review of the streetcar system. (See The UITP Peer Review: What is the TTC Trying to Hide?) Details from this review might become public at the November TTC Board meeting.
The TTC Board met on October 6, 2025. Many items on the agenda were confidential in whole or in part, and the meeting immediately recessed into private session. Four hours later, the public session resumed.
Extended private sessions have been a “feature” of recent Board meetings, and this is a major inconvenience for people who have taken the trouble to travel to City Hall for deputations, or remained available online. In years long past, the Board scheduled an in camera session before the public session so that, usually, the public part started on time. They should reconsider this practice, or at a minimum advertise a long, planned private session in the agenda so that public attendees can plan accordingly.
Items of interested included:
The CEO’s monthly report including an updated format for bus fleet and route performance metrics
The Peer Review of asset management by the International Association of Public Transport (UITP)