Travel Times on RapidTO Corridors – Part II – January 2024

This article continues the review of the evolving travel times on current and proposed RapidTO corridors that started with Travel Times on RapidTO Corridors – December 2023 Update – Part I.

The routes covered here are:

  • 60/960 Steeles West
    • Finch Station to Pioneer Village
    • Pioneer Village to Kipling
  • 86/986 Scarborough
  • 116 Morningside
  • 905 Eglinton East Express

Introduction

These charts are intended to show how travel times in many cases have been growing since the early days of the pandemic in March 2020. Where I have them, there is a small amount of pre-pandemic data for comparison.

In most cases, there is a notable drop in travel times in Spring 2020, with gradual growth thereafter. Drops for the year end holidays are common, but this was small in 2020 because isolation was still in effect. In 2021, there was a recovery followed by a combination of the drop for the holidays and the omicron wave. 2022 and 2023 saw bigger declines at the holidays. In some cases, the travel times in January 2024 are higher than the pre-pandemic values.

The Spring 2020 values are likely as good as one can expect from any transit priority scheme as they show the travel times of buses unencumbered by either traffic or heavy passenger loads.

Where the 85th percentiles (orange) spike well above the medians (blue), this shows the day to day variability in travel times that are particularly strong on Steeles West.

An important distinction lies in the location of time savings. Transit priority might not be present over an entire route, and a more detailed review of these data will show the locations of the critical segments. I have not included them here to avoid making an over-long article, but I will bring out more of that analysis as the City gets more deeply in route-specific studies.

A challenge for planners and traffic engineers is that the problem locations are likely to be the hardest to “solve” in the sense that they have the lease spare capacity, if any, to reallocate to transit. Conversely, there are areas where transit priority will make little difference because the road is uncongested most of the time, and signals are not a source of delay. Fine-grained study is essential to any new RapidTO plan.

In the first article of this pair, the charts ended at December 2023, but by the time I was working on this piece, the January 2024 data were also available and have been included.

In the case of routes already operating on red lanes in Scarborough (86/986 Scarborough, 116 Morningside and 905 Eglinton East Express), travel times have grown since 2020, but it is impossible to know how much they might have grown in the absence of transit priority measures other than by analogy to other corridors where conditions might not match.

Updated February 7, 2024: The charts for 116 Morningside have been updated to include data from late October to December 2020 that was omitted from the original version.

Continue reading

Evolution of Bus Route Travel Times, 2020-2023, Part II

This article is the second half of a review of the change in travel times for a selection of major bus routes, many of which are part of the RapidTO “red lane” proposal, from 2020 to May 2023.

See also: Evolution of Bus Route Travel Times, 2020-2023, Part I

My purpose is to show the drop in travel times in March 2020 co-incident with the pandemic lockdown, and the gradual recovery over the past three years. The minimum times seen in 2020 establish what we would see in the absence of road traffic, not to mention a lower passenger demand, and probably show the best case for improvement with transit priority.

Depending on when I began to track various routes, there are cases when I have some pre-pandemic data from 2018 or 2019.

The situation varies from route to route and by time of day. In many cases, travel times have returned to pre-pandemic levels or higher, and some uptick is particularly notable in 2023. An important characteristic of these routes is that they do not serve the core area, but run in Toronto’s suburbs where bus ridership is strong and work-from-home had considerably less effect on demand than it does downtown.

Routes in this article include 86 Scarborough, 116 Morningside and 905 Eglinton East Express which already run on the Eglinton-Kingston-Morningside red lanes, as well as 39/939 Finch East, 54/954 Lawrence East and 25/925 Don Mills.

Note that the charts here track travel times, not service reliability. I will turn to that issue in future articles.

Continue reading

Charting Service Frequency: A Request for Comment (Updated)

Updated May 26, 2023 at 5pm: In response to a reader’s suggestion, I have added a sample chart that includes average wait times for would-be riders in place of the count of vehicles. To jump directly to this update, click here.

In the many articles I have published trying to review service quality on the TTC, one topic has eluded presentation: how to chart service quality over a long period while preserving the hour-by-hour, day-by-day character of the data? That question has several dimensions because a quality metric is not simply a matter of pooling stats and saying that overall things are not too bad, or even worse that service meets some sort of standard on average.

In the past I have published charts showing headways, and others showing how organized (or not) service on a particular day might be, but it has been more difficult to condense months of data for multiple times and locations.

The TTC standard for surface routes is:

On-time performance measures vehicle departures from end terminals. Vehicles are considered on time if they depart within 59 seconds earlier or five minutes later than their scheduled departure time. (-1 to +5)

CEO’s Report, May 2023, p. 18

The intent is to hit this target 90% of the time, but the TTC does not achieve this with values typically falling in the 70-to-85 per cent range. At an individual route level results can be considerably worse. Streetcar routes fared worse with a 50-to-85 per cent range, and the higher end was achieved during the pandemic era when traffic and demand were light. The numbers have fallen since then.

The TTC’s metrics have big credibility problems because they bear little relation to what riders actually experience.

There are three major reasons:

  • Quality is measured on an all day basis, or worse on longer periods such as months. Variation by day and time is completely obscured by this approach. Reliable service at 10 pm is cold comfort to a rider whose bus has not shown up for 15 minutes in the peak period.
  • Quality is measured only at terminals, not along routes where various factors can degrade service that might begin well, but quickly deteriorates with bunching and gaps.
  • Service is measured relative to schedule on the assumption that “on time” performance will automatically be reliable. However, there is considerable leeway in that standard allowing irregular service to be considered “on time”, and the TTC does not even hit their target levels in many cases.

The CEO’s Report tries to work around the limitations of the metric by noting that some routes do farly well while others encounter a variety of problems. With respect to the bus network, the report notes:

Network performance was negatively impacted by the inclement weather the weeks of February 20 to March 10, where over 60 centimetres of snow fell on the city during this time. Weekday On-time performance was 88% for Weeks 7, 11 and 12. During weekends for the period, OTP was 82%. During February, 32 of 159 weekday routes were impacted by construction for at least three weeks of the period. Overall weekday OTP was 88% for the 127 routes not affected by construction:

  • 48 routes were “On-Time” (90% OTP or better).
  • 53 routes were “On the Cusp” (85-90%).
  • 26 routes were “Not On-time” with OTP less than 85%. In summary, 80% of the routes not affected by construction scored 85% or better.

This still does not address reliability issues at the level riders experience. Moreover, for frequent service, riders do not care if a bus is “on time”, only that service is reliable. TTC assumes that on time service will, by definition, produce reliable service, but they don’t actually operate on schedule and fail to measure service as riders see it.

Irregular service also affects crowding because passenger loads are not evenly distributed. If most riders are on full buses, the following half empty vehicles are not part of their experience (except possibly their frustration with a long wait for the advertised “frequent” service). Average crowding stats do not reveal typical riding conditions. (Analysis of crowding is complicated by the limited availability of automatic passenger counter data outside the TTC. I have tried for a few years to obtain this without success.)

The charts show that bunching (headways of two minutes or less) and large gaps (20 minutes or more) are common, and that they exist across the four months of data here. They are not occasional effects, but a basic feature of TTC service. The stats at terminals, where the TTC takes its on time performance measurements, are less than ideal, but the service degrades as buses and streetcars move along their routes. Most riders do not board at terminals.

This article presents a proposed method of charting service quality on routes to provide both the detail of day-by-day, hour-by-hour conditions and a broader overview. The charts are an experiment in condensing a lot of data into a manageable size, but I am not wedded to the format. Comments are welcome. Regular readers will recognize the format from a previous attempt, but I hope this is an improvement.

The goal is to produce something that can track the quality of service over time so that the decline or recovery of TTC routes is clearly visible along with the effectiveness (or not) of any changes to schedules, transit priority or route management.

There are a lot of charts in this article, and it is a long read for those who are interested. Feedback on this method of presentation is most welcome.

Continue reading

Evolution of Travel Times on RapidTO Bus Routes 2020-2022 (Part 1)

This article and one to follow is an update of an earlier review of the effect of pandemic-induced changes in traffic levels on the running time of buses. The target routes are those that already have “red lanes”, exclusive lanes for buses at all hours, and on the first group where red lanes were proposed.

Originally, the list of possible routes was shorter, and it is those routes whose vehicle tracking data I have collected over the past years:

  • Eglinton-Kingston-Morningside (implemented fall 2020)
  • Lawrence East
  • Finch East
  • Steeles West
  • Dufferin
  • Jane

A City study is underway to prioritize routes for detailed study and implementation under the RapidTO program.

An important premise behind RapidTO and bus priority is that service can be improved both because travel times are shorter and because they are more reliable leading to more regularly spaced and predictable service. Indeed, on the King Street transit project, the benefit was far more that variation in travel was reduced and reliability was increased, as opposed to reducing the average speed of travel under day-to-day conditions.

Too often, “priority” has been sold on the basis that it would reduce operating costs when the real goal should be to improve service with resources already in place, and to ensure that any additional buses or streetcars do not simply disappear into a “black hole” of unreliable service.

With the pandemic, we have an unexpected chance to see how much time is saved when traffic is, for a period, reduced from normal levels. This gives an indication of what we might expect from red lanes, or putting it another way, the best we are likely to achieve.

Continue reading

A Dashboard for Scarborough Red Lanes

Recently, I published an article about the evolution of travel times and service quality on the Eglinton-Kingston-Morningside corridor since the installation of the transit priority “red lanes”, a project which has been branded RapidTO by the City. See: Red Lanes, Express Buses and Service Reliability in Scarborough

For clarity, although I have done work for City Planning as part of the King Street Priority project, I was not involved in the City/TTC Scarborough project. Analysis presented in my previous articles is my own work separate from the official reports.

One of the challenges of presenting this material is that there is a lot of data between transit vehicle tracking, ride counting and general traffic monitoring. In my articles, I only deal with the transit tracking component and even that is a lot. The City and TTC have boiled down the data further to present the major issues.

The City’s project page contains an overview and links to various resources including the TTC’s RapidTO page. The heart of reporting on the project is in the Project Dashboard which summarizes data showing effects on transit and general road user travel times as well as service reliability.

The High Points

The RapidTO lanes in Scarborough were the low-hanging fruit of potential transit priority projects. Much of their length already had peak period diamond lanes. The streets were not dependent on parking to serve commercial properties along the route, and they were mostly wide enough to leave two traffic lanes in each direction even after dedication of the curb lanes for transit.

Travel time changes were modest, and the savings cannot all be ascribed to the red lanes because other changes were made concurrently or after implementation, notably the elimination or relocation of stops.

Traffic and ridership volumes have not yet returned to pre-pandemic conditions and so we are not yet seeing either the roads or transit service stressed to previously-normal levels. Whether the red lanes will limit transit times from rising back to or above 2019 levels will probably not be known until sometime in 2022.

Service reliability continues to be the bugbear of TTC operations, and we are finally seeing figures to support this in a report from the TTC. When only half of service can achieve a rather generous target range of headways (time between buses), the service is not very reliable.

Update: Of particular note is the high reliability factor shown for the express routes, particularly 905 Eglinton East. The metric is defined as ±50 percent of scheduled headway, and the express routes have much larger headways than the 86 and 116 local Scarborough and Morningside services. Therefore, service on the 905 can be much more erratic because there is a wider acceptable window of values using the 50 percent rule. This is not necessarily better service, only a side-effect of a poorly-chosen metric.

The City and TTC present this metric as an “improvement” relative to October 2019, but the change is only a slight improvement on appallingly bad service. If this were a report card, it would generously have changed from an “F” grade to “E”.

External, physical changes to the route environment such as reserved lanes and stop consolidation will not, by themselves, produce reliable service, and the TTC has yet to address headway reliability management as a core function.

Continue reading

Red Lanes, Express Buses and Service Reliability in Scarborough

Four routes in Scarborough benefit from the introduction of reserved lanes on Eglinton Avenue East, Kingston Road and Morningside Avenue.

  • 86 Scarborough
  • 186 Scarborough Express
  • 116 Morningside
  • 905 Eglinton East Express

In previous articles, I looked at the change in travel times with the onset of covid-era drops in traffic levels beginning in Spring 2020, and the effect of the “red lane” implementation in mid-October 2020. This is an update to bring the review to the end of June 2021.

On five other corridors (Jane, Dufferin, Finch East, Steeles West, Lawrence East), there are plans for reserved lanes, although the proposals have not met with universal acclaim. In future articles I will bring the review of their routes’ behaviour up to date. The map below shows the affected routes as proposed in the Service Plan. Lawrence Avenue East was added to this list by the TTC Board.

My underlying premise is that pre-pandemic conditions are a reference point for travel times. Across the entire transit network, traffic congestion and boarding delays fell with the onset of covid. This has been building back gradually, but the effect varies from route to route. There are also external events such as the LRT construction on Finch Avenue West that affect intersecting streets. Finally, the transit red lanes were introduced concurrently with two other changes: the removal of some local stops and the restoration of express service.

This makes identification of the actual cause of shorter travel times more difficult to isolate, and the answer is probably “all of the above”. Each street and route is different, and the benefits, such as they are, of the red lanes should not be assumed to apply on every route segment in the city.

A concurrent issue for transit riders is the dependability of service. It may well be that five minutes is shaved off of their journey with a reserved lane, but if the service is erratic and the wait time for a bus is unpredictable, this benefit can be sabotaged. The situation is further complicated by a mix of local and express buses. If an express can serve a rider’s planned trip, it might save time thanks both to the red lanes and to the fewer stops enroute. However, if the likely wait for an express bus exceeds the time saving (and desire for certainty), a local bus could prove “faster” if it shows up first.

The TTC forever talks about optimization of service and schedule adjustments to make things work better. Problems should be “solved” with schemes like reserved lanes and express buses, so they say. However, headways (the time between buses) continue to be irregular leading to rider frustration and complaints, some of which are due to overcrowding caused by irregular service.

The TTC is good at getting the City to make changes to roads to “improve” service, but not so good at managing the service it has.

The short version of this article is that the red lanes on Eglinton/Kingston/Morningside improved travel times somewhat although we have not yet seen the real test of whether they prevent a return to pre-pandemic, pre-red lane conditions. The benefit varies from route to route, time of day, and day of the week. In spite of the claims that transit priority would lead to more reliable service, gapping and bunching remains a problem on most of the route using the red lane corridor.

This is a key issue for expanding the program: transit priority on its own does not guarantee regularly spaced and, by extension, evenly loaded vehicles.

A Note About Data

Since the idea of the red lanes first appeared, I began to collect data on the proposed routes. This was complicated by a few factors:

  • The red lanes, aka RapidTO, were proposed in the Service Plan issued in December 2019, before the pandemic. In anticipation of studying their benefit, I began collecting vehicle tracking data for the affected routes in 2020.
  • In some cases, because I was already tracking major routes, I had data from April 2018, but there is a big gap until late 2019 because this was the conversion period from the old CIS tracking system to the new Vision system. Data extracts were not available from Vision until late 2019. Therefore, I have very little pre-2020 data that is recent enough to be used for comparison.
  • With the effects of the pandemic on traffic and riding levels in 2020, the travel times are no longer representative of worst case conditions. A silver lining is that for the period when traffic was very light, this gives a best case situation for transit travel, in effect setting a bound on the improvement we could expect if we could just make the traffic disappear.
  • Almost all 900-series Express routes were dropped in Spring 2020, and they have only slowly been returning (more are planned later in 2021 or early 2022 including a few new routes). Therefore an express-vs-local comparison is not available on all corridors.
  • Before the Express network existed, express trips (typically the “E” branch of a route) ran with the same route number and their data are mixed together with the local trips. It was not practical to attempt to fish the express trips out of the tracking data in part because local and express runs did not always make their trips as scheduled, and this varied from day to day. Some buses alternated between making express and local trips. Therefore, data from 2018 represent a mix of times for local and express trips. This understates the time needed for local trips and overstates the value for express trips.

I will not burden the reader with a discussion of the methodology for converting CIS and Vision data to the format used in my analyses. There are two articles on this:

Continue reading

116 Morningside: The Effect of BRT Lite

This is a companion post to the article on the 86/986 Scarborough bus services and the effect of the Eglinton-Kingston-Morningside BRT corridor on them. It follows the same general layout and readers will be able to compare charts for the two routes.

116 Morningside shares with 86 Scarborough the portion of the BRT corridor from Brimley & Eglinton east to Guildwood & Kingston Road. From that point, route 116 turns south and then east through the Guildwood neighbourhoods, then north via Morningside. The route extends to north of Finch, but the BRT corridor ends at Ellesmere.

As with the 86 Scarborough bus, the travel time savings occur at locations where stops have been removed. The routes share this effect on Eglinton Avenue. Only one minor stop was removed on Morningside.

Unlike the Scarborough route, 116 Morningside has no express service, and so the speeds for all vehicles both pre and post-Covid are for local services.

The travel time savings on 116 Morningside are smaller than those on 86 Scarborough because it spends less time on the portion of the BRT segment where stops have been removed.

Continue reading

The Problem of Scheduled Service Irregularity

In a series of articles, I reviewed the quality of service on many bus routes during a period, the lull in traffic and demand during the pandemic, when it should have been relatively easy for the TTC to operate reliable service.

A consistent factor on almost every route was that buses are running in bunches with wide gaps between them. Those gaps translate to crowded buses followed by lightly-used ones, and riders rightly complain about long waits and an uncertain arrival of the next group of vehicles.

The TTC argues that service is not really that bad because they have a large number of unscheduled extras (aka “RAD” or “Run As Directed”) buses that do not show up in vehicle tracking records. Leaving aside the obvious need to track all service, not just the scheduled buses, this does not explain why buses run so close together so much of the time. These are tracked vehicles that have a schedule that should keep them apart.

Or so one might think.

TTC Service Standards include provisions for headway quality (the reliability of spacing between vehicles), but this is fairly generous, and it is never reported on as an official metric of service quality.

However, another problem is that on some routes, the service is actually scheduled to come at uneven headways. This arises from three issues:

  • Some routes with more than one branch have different frequencies on each branch. This makes it impossible to “blend” service with, for example, alternating “A” and “B” destinations.
  • In response to the pandemic, the TTC quickly adapted schedules by cancelling all express buses, and selectively cancelling individual runs as a “quick fix” to avoid complete schedule rewrites across the system. Where local trips were cancelled, this created gaps in the scheduled service.
  • On many routes, notably those that formerly had express service, the TTC scheduled “trippers” to supplement the basic service. However, these trippers were generally not scheduled on a blended basis leaving riders with scheduled, but erratic service.

In some cases, the September and October schedules corrected some of these problems, but many persist. This article looks at a number of routes where the summer (August) schedules had uneven headways to see what, if anything, has changed by mid-October. (The most recent set of schedules went into effect on October 11, 2020.)

All of the data presented here were taken from the TTC’s schedules as they are published in GTFS (General Transit File Specification) format for use by travel planning apps. This almost exactly matches information on the TTC’s online schedule pages.

Continue reading

BRT Lite Comes to Scarborough

Updated October 12, 2020 at 6:20 am: Travel time charts originally published with this article included data for April 2018 for Saturdays as well as weekdays causing a dip in values at the end of that month. The charts have been corrected.

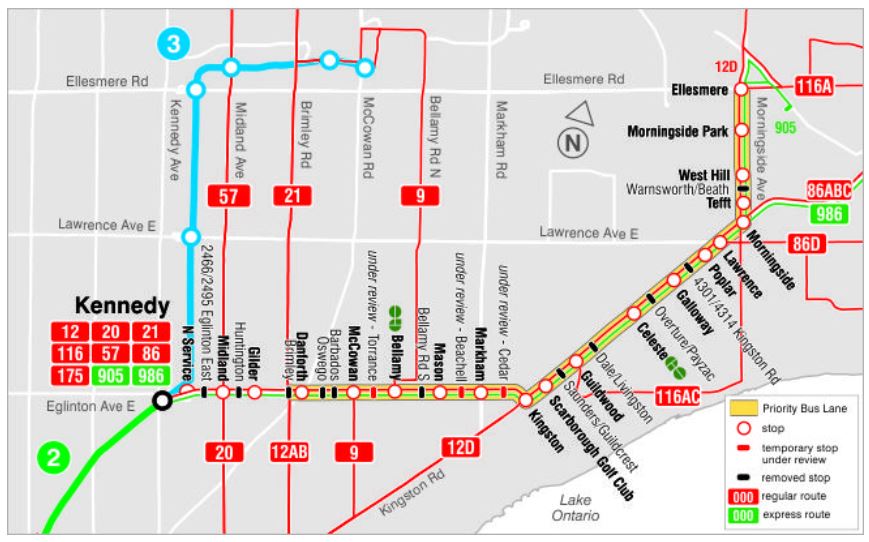
With the gradual appearance of red pavement, a reserved lane for buses is appearing on Eglinton Avenue East, along Kingston Road to Morningside, and up Morningside to Ellesmere. This lane has no physical constraints on use by other vehicles and therefore is not really a full BRT implementation, but rather “BRT-Lite”.

Like so much recently in our town, it has acquired a moniker “RapidTO”. I will leave it to readers to concoct a name for the really rapid service provided by the subway.

For reference, here is a portion of the TTC route map showing the affected area (click to enlarge).

Four routes leave Kennedy Station:

  • 86 Scarborough local buses
  • 116 Morningside local buses
  • 905 Eglinton East express buses
  • 986 Scarborough express buses

The reserved lane begins at Brimley and then continues along Kingston Road. At Guildwood, the 116 Morningside route splits off, but the other services continue on reserved lanes.

At Morningside, the reserved lanes turn north along with the 905 Eglinton East Express buses and the 116 Morningside locals which have come up from Guildwood. The various 86 and 986 Scarborough service continue east and north to their destinations without a reserved lane.

The reserved lanes end at Ellesmere near the University of Toronto Scarborough Campus (UTSC).

The lanes on Kingston Road and Morningside will also be used by the 12D service from Victoria Park Station to UTSC, but this is a peak-only operation that I have omitted from this discussion because it is so infrequent (roughly two buses per hour).

This has been announced with much fanfare, but it will be important to track what actually happens with service in this corridor. The TTC has an uncertain attitude to the benefits of reserved lanes, and this goes back years to (at least) the St. Clair right-of-way project.

Reserved lanes can reduce travel times by keeping motorists out of the way assuming, of course, that someone makes the effort to keep the bus lanes clear. The TTC uses this saving in two different ways:

  • Running the same number of buses on a shorter scheduled trip time means that more frequent service and capacity can be provided at no extra cost. This is the approach taken with route 116 Morningside.
  • Keeping headways (the time between buses) the same but reducing the trip time allows a route to be served with fewer vehicles while maintaining but not improving service. This is the tactic used for 86 Scarborough, offset by express service on the 986.

Over the years, there have been many service reductions on the TTC through the reverse of the second point above. Traffic congestion might become a problem, and TTC management wants to guarantee that fewer or no buses are short-turned. To achieve this, travel times are increased so almost all buses will arrive on time or early at terminals with a generous provision of recovery time before their next trip.

This has usually been implemented by running buses less often so that the trip time can be longer. The downside, however, is that scheduled service is reduced and this becomes a “new norm”. Service increases to deal with capacity problems are often held hostage to budget limitations.

Two other changes will happen on the Eglinton-Kingston-Morningside corridor concurrently with the new bus lanes (effective Sunday, October 11):

  • The 905 Eglinton East and 986 Scarborough express buses will resume to operation
  • Some stops will be moved or consolidated.

The service to be provided on the express routes is comparable to that provided in March 2020 before much of the express network shut down in response to the pandemic. This will substantially increase service for those who travel between express stops.

Express service stops:

  • Eastbound 905 buses stop only at Kennedy Station, Midland Avenue, Brimley Road, McCowan Road, Bellamy Road, Markham Road, Kingston Road and Eglinton Avenue East, Guildwood GO Station, Galloway Road, Lawrence Avenue, Morningside Avenue and Kingston Road, Ellesmere Road, Ellesmere Road and Military Trail, University of Toronto at Scarborough Loop.
  • Westbound 905 buses stop only at University of Toronto at Scarborough Loop, Military Trail and Pan Am Drive, Morningside Avenue and Ellesmere Road, Kingston Road, Kingston Road and Lawrence Avenue, Galloway Road, Guildwood GO Station, Eglinton Avenue, Eglinton Avenue East and Markham Road, Bellamy Road, McCowan Road, Brimley Road, Midland Avenue, Kennedy Station.
  • Eastbound 986 buses operate express from Kennedy Station to Celeste Drive (Guildwood GO Station), stopping only at Markham Road and Celeste Drive; 986 buses then operate local from Celeste Drive to Meadowvale Loop.
  • Westbound 986 buses operate local from Meadowvale Loop to Celeste Drive (Guildwood GO Station); 986 buses then operate express from Celeste Drive to Kennedy Station, stopping only at Markham Road and Kennedy Station.
Continue reading

The TTC 2021 Service Plan

The TTC Service Plan for 2021 is still in draft, but the TTC wants public feedback on their proposals. The deadline for comments is October 9, 2020.

See:

In earlier stages of public participation, the focus was on implementation of the RapidTO bus lanes, notably the one on Eglinton-Kingston-Morningside that has just been installed.

Now the TTC has added material about other proposals and there is a 24-minute video overview on the presentation page linked above.

Continue reading