
This article continues a series reviewing the quality of service scheduled and operated over the COVID-19 era in summer 2020 that began with an introduction and continued with Part I looking primarily at Scarborough. Part II moves further west looking at north-south trunk routes between Victoria Park and Jane.
There is a pervasive problem across the network shown in these data. Because of the need to quickly implement new schedules in May and June, two actions were taken:
- Selectively crews were cancelled to reduce the number of vehicles and drivers. This produced gaps in the scheduled service.
- Trippers were scheduled on many routes starting on June 22 to replace the ad hoc operation of standby buses. These trippers are in service in two seven-hour long waves with a break from midday to the start of the PM peak. In most cases, the headways of the trippers do not blend with those of the regular service causing scheduled bunching and gaps.
The TTC could manage its service to smooth out the schedule problems on the fly, but the actual vehicle tracking data suggests that little of this happens. The result is that vehicles on many routes operate at erratic headways and therefore with uneven wait times and vehicle loads.
Moreover, the schedules have not been adjusted to smooth out their problems, possibly because the TTC expects to go to revised schedules sometime in the fall based on resumption of some demand such as school trips.
In two cases, Dufferin and Keele, articulated buses are supposed to be operating, but in practice the trippers, which might account for half of the service, use standard sized buses thereby reducing capacity and adding to crowding.
Technical Note
There are a few gaps in the data exported from the TTC’s VISION tracking system because of outages.
On Monday and Wednesday, June 22 and 24, there were outages from late morning to early afternoon. This causes very long headways to be calculated for the first bus crossing a screenline (the point where headways are measured) after the system comes up again.
From midday Wednesday, July 15 to midday Friday, July 17, there was an outage and no data are included in the charts for this period.
For each route discussed here, there are sets of charts displaying headway data in various formats including:
- Averages and standard deviations of headways on a weekly and monthly basis.
- Raw data including trend lines showing the overall shape of the data.
- Quartile charts in block-and-whisker format showing how tightly or loosely the data values are clustered around the mean.
- Charts for Saturdays and Sundays.
In the interest of space, only the weekly averages, standard deviations and raw data charts are shown in the article, but the full sets are available in linked PDFs at the end of the section for each route. An illustration of the quartile chart format is included in the discussion of the Dufferin Bus.
For a complete description of the various charts produced for these analyses, see Understanding TTC Service Analysis Charts: A Primer.
24 Victoria Park
Route 24 Victoria Park operated north from Victoria Park Station to Steeles with various branches in March 2020:
- 24A to Steeles provided most of the local service
- 924 Victoria Park Express also ran to Steeles in peak periods at the same headway as the local service
- 24B operated to Don Mills Station on Sheppard via Consumers Road weekdays until the end of the PM peak
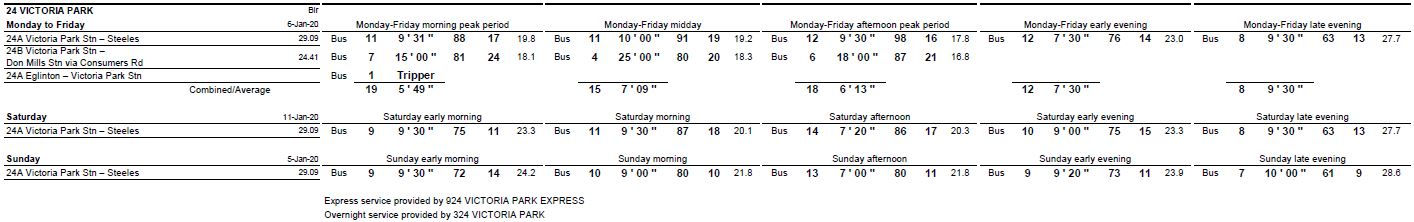

In June 2020, there is no 924 Express, but the 24B Consumers Road service runs more frequently than it did before. This does not compensate fully for the absence of the express bus.
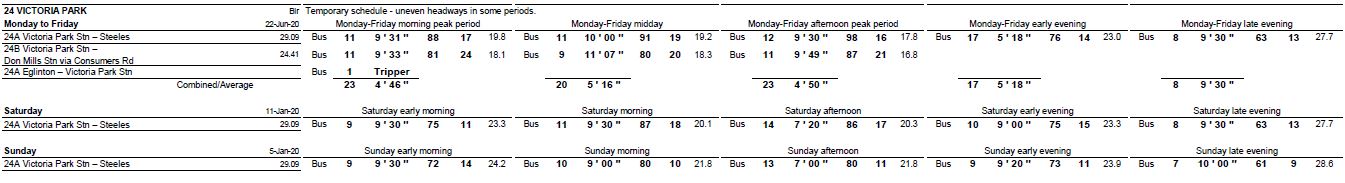
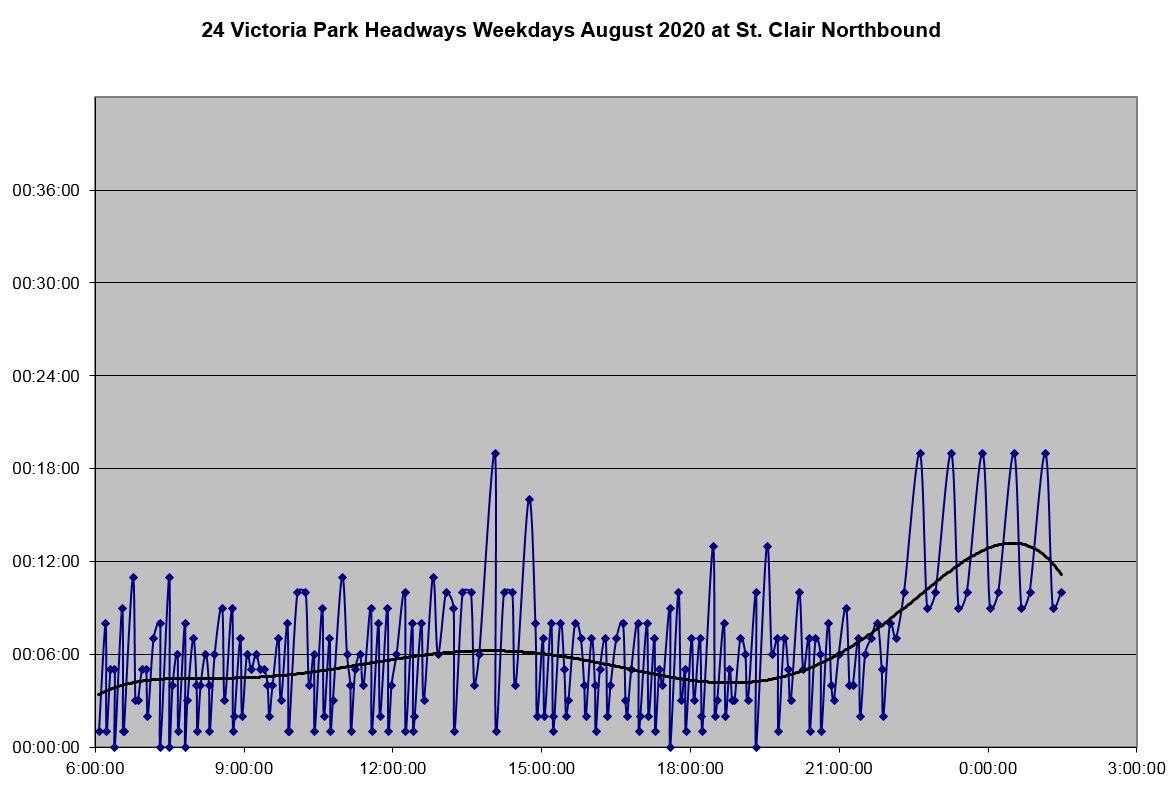
Although the combined service on the two branches is under five minutes the Steeles and Consumers services are not blended, and on occasion are scheduled to leave together northbound. Here is a chart of the scheduled headway at St. Clair.
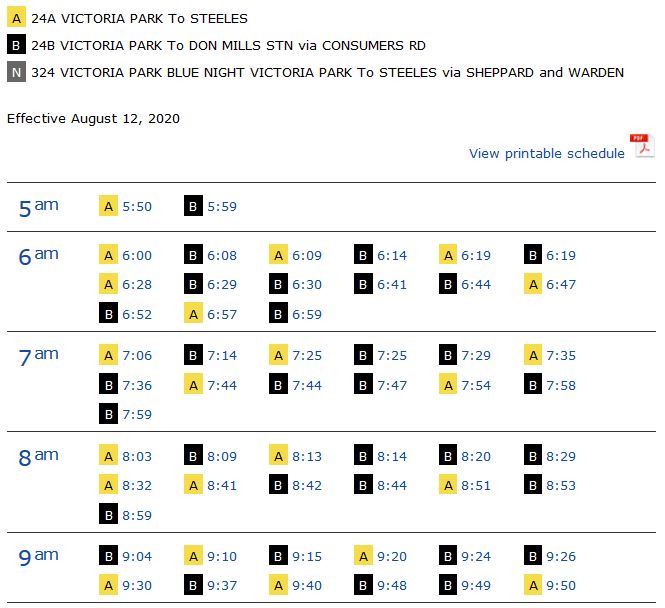
Here is a snapshot of the TTC’s posted schedule for the same service leaving Victoria Park Station. Note in particular the departures at 7:25, 7:35/6, 7:44, 7:58/9, 8:13/4, 8:41/2 and 9:48/49/50. The service is scheduled to run bunched even if it leaves precisely “on time”.
The service at Sheppard is erratic because of the selective cancellation of some runs. The off peak headway is supposed to be every 10 minutes, but scheduled gaps of 20 are common. In theory, this can be adjusted on the fly by drivers adjusting their times to close up the gaps, but as we will see, the actual headways bear little evidence of this.
The service to Consumers Road is itself erratic. The reason for this is that the schedule (unlike the Scheduled Service Summary) includes trippers that operate without being blended into the underlying headway. The scheduled headways are consistent only in the early afternoon, between the end of the morning “trippers” and the onset of the afternoon ones, and in the early evening when only the trippers remain in service.
Southbound from Steeles, the scheduled service is erratic as it was northbound at Sheppard.
At Ellesmere southbound, the Consumers Road branch has rejoined the route, and the same scheduled service pattern as northbound appears.
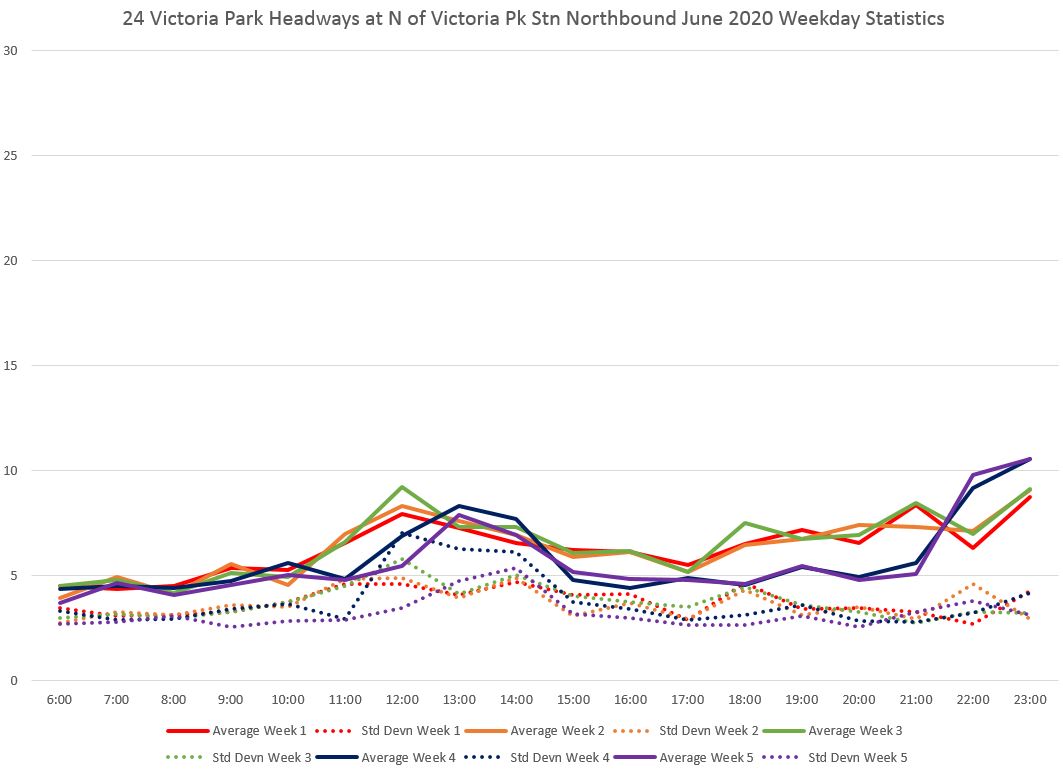
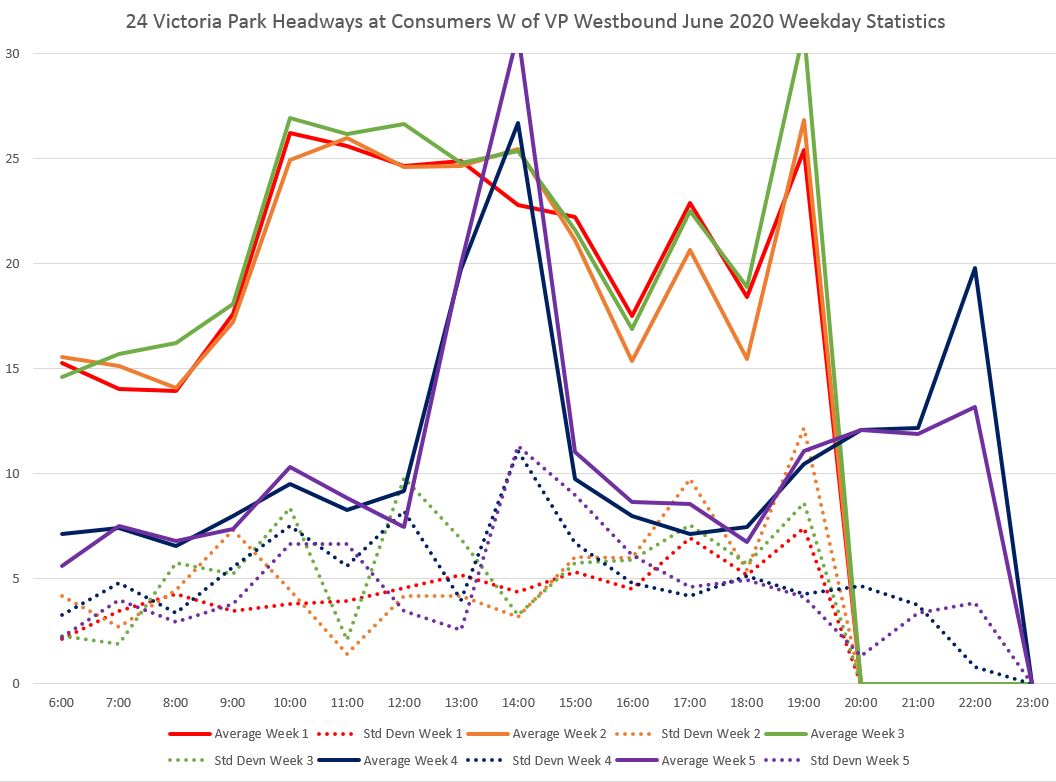
The service leaving Victoria Park Station northbound in June shows two distinct patterns. During the final two weeks (starting Monday, June 22), the average headway is shorter during some periods than in the first three weeks. The reason for this is that the trippers have become an official part of the schedule and are included in the tracking data.
The standard deviation of the headways is close to the average reflecting bunching of vehicles leaving the southern terminus. However, these buses are likely “on time” by TTC standards.
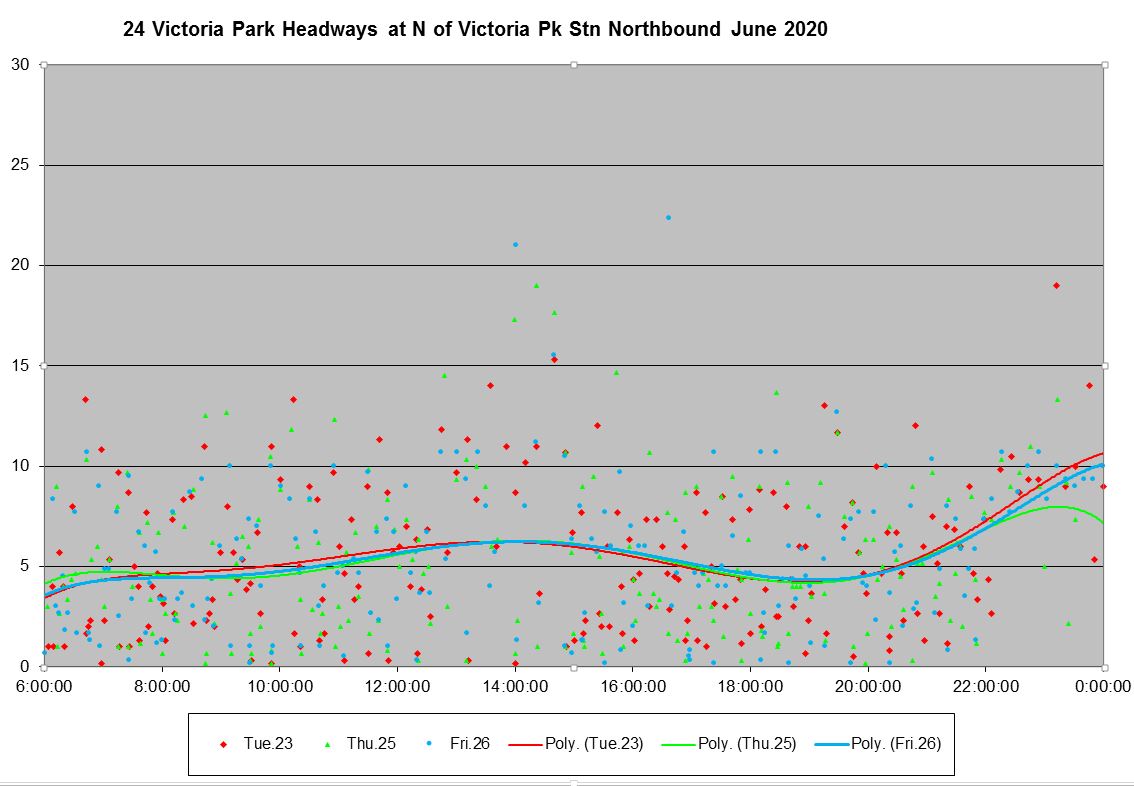
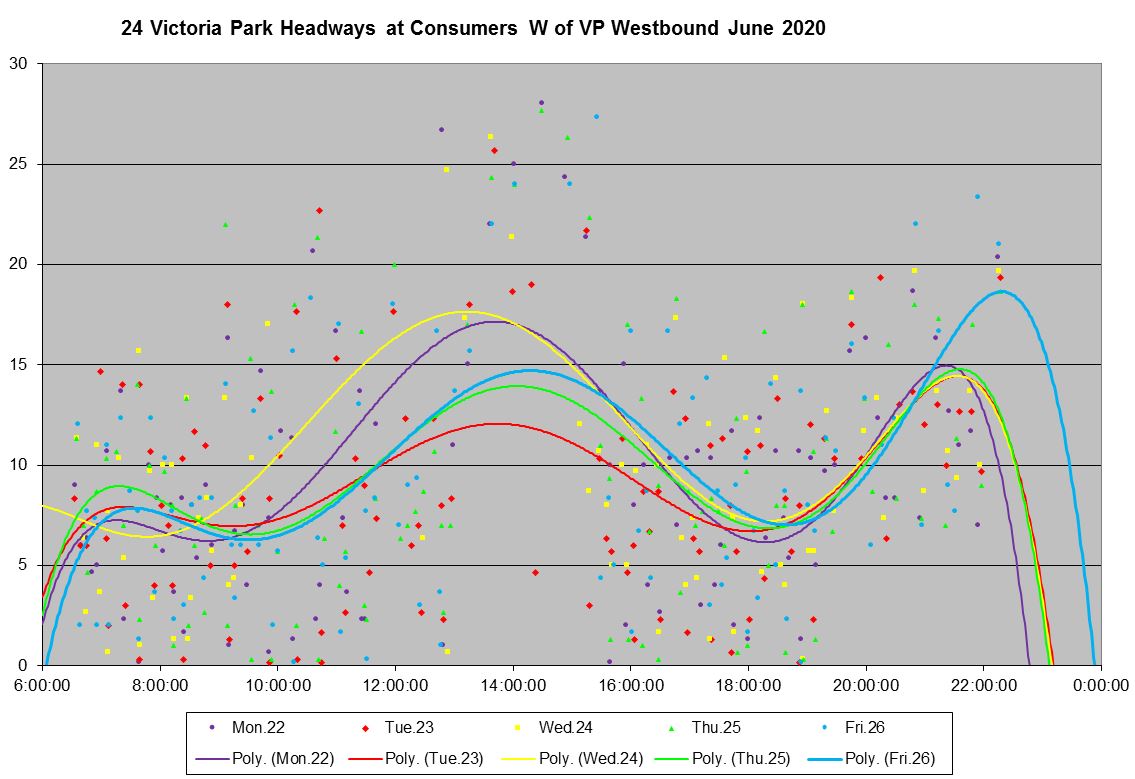
Here is the service actually operated (and tracked) for three days in week 4 of June. I have removed June 22 and 24 because the missing data cause the trend lines to show a swing in values that is a side-effect of omitted vehicles. Note that for the three remaining days, there are many headways close to zero at the x-axis.
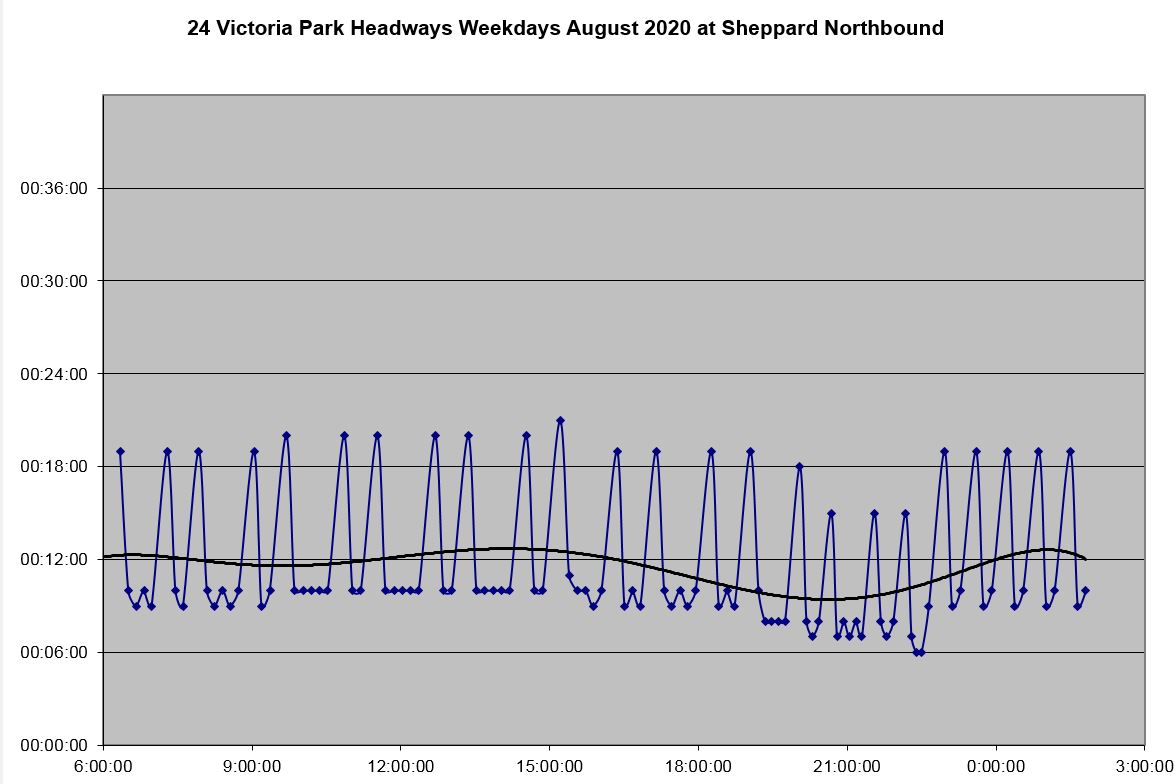
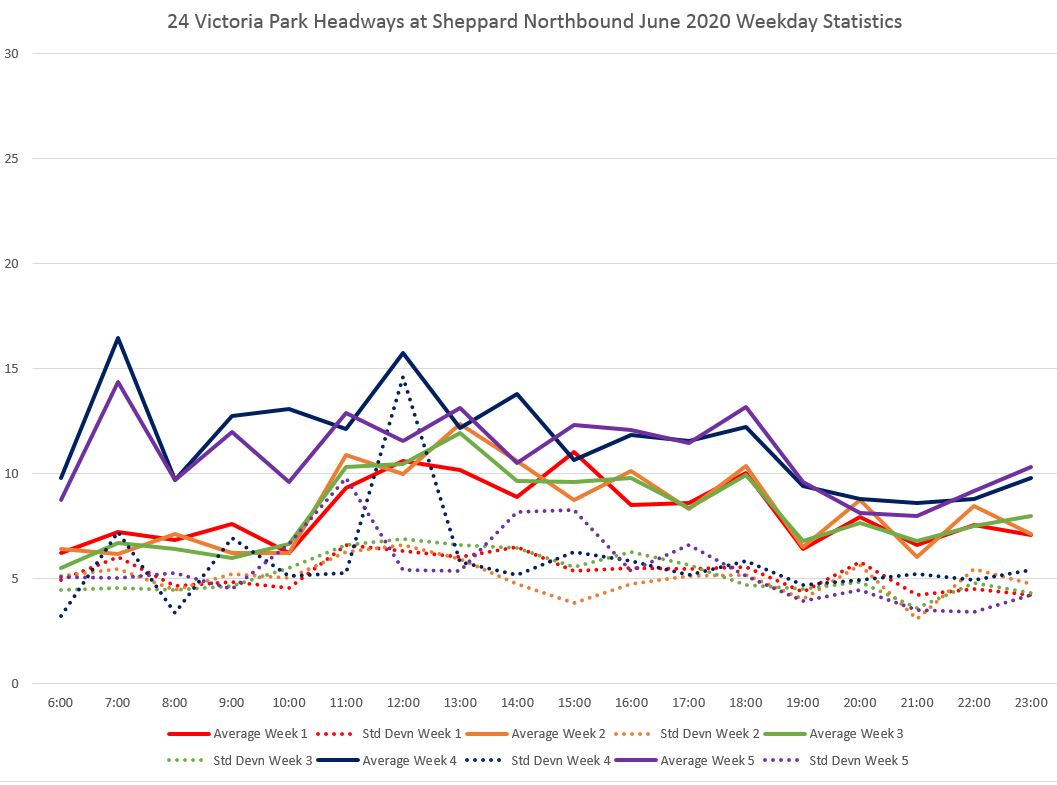
At Sheppard northbound, the scheduled headway in weeks 4 and 5 is longer than in the first part of the month although on paper there was no change in the level of local service shown on the schedule summary. The difference comes from the cancelled runs which leave gaps in the service and increase the averages.
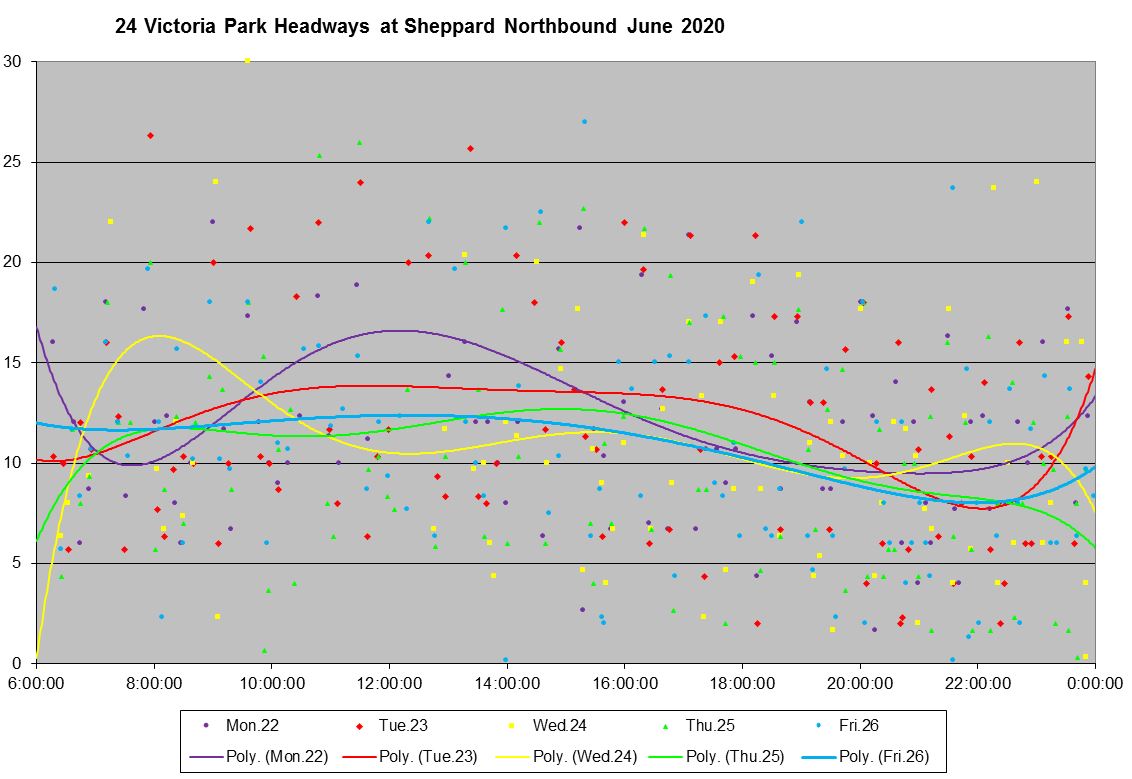
The service that was tracked shows a wide spread in headway values. I have left June 22 and 24 in this chart as an illustration of the effect of the missing data. Although the trend lines do belly up above the other days, the range of values spans 20 minutes on all five days. This is not a question of missing data, but of missing service with no effort by the TTC to smooth out the peaks and valleys.
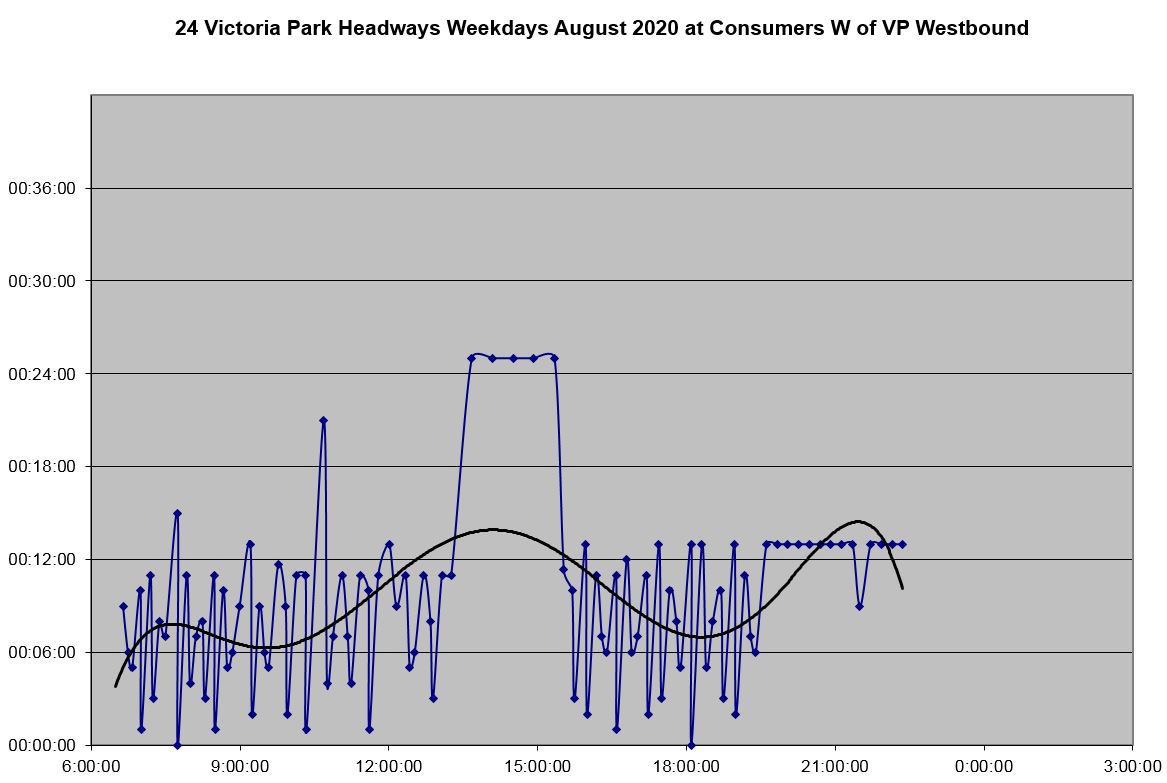
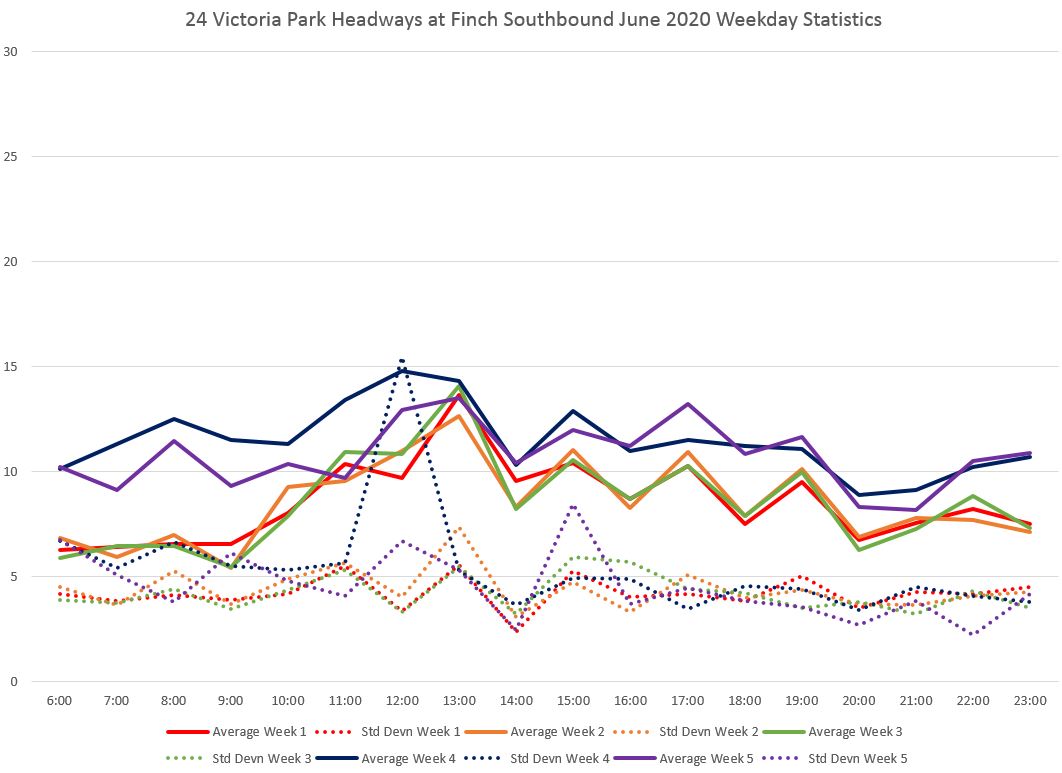
The Consumers Road service is also erratic. With the addition of the trippers in weeks 4 and 5 that short turned here, the average headway is lower during the period when trippers operated. However, the standard deviation of the headways is often over five minutes due to the wide swing in actual service.
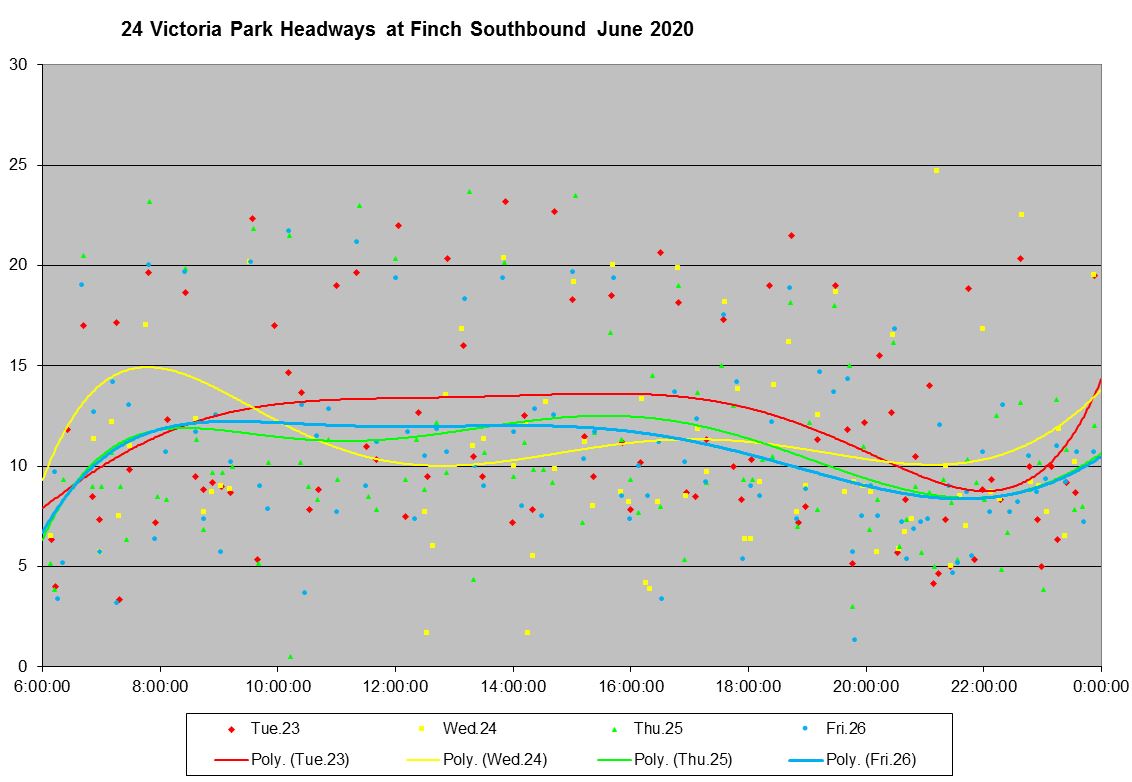
Here are the data for week 4. June 22 and 24 have a slighly larger bulge in their trend lines due to missing data, but the pattern of widely scattered headways is evident for all days and periods.
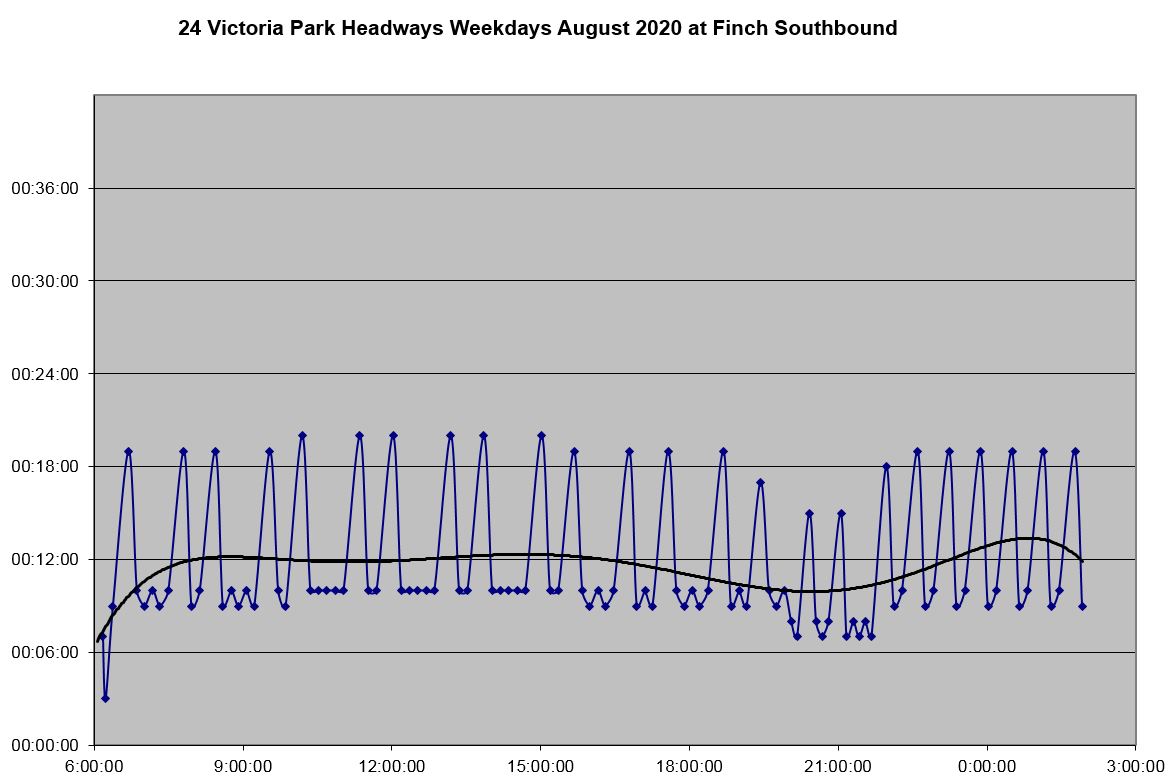
Southbound from Steeles, as noted earlier, the service is scheduled to be erratic. The average headway is longer in weeks 4 and 5 because of cancelled runs and the operation of trippers only to Consumers Road.
The data for week 4 (with June 22 omitted) show headways ranging mainly from 5 to 20 minutes with some outliers beyond these values.
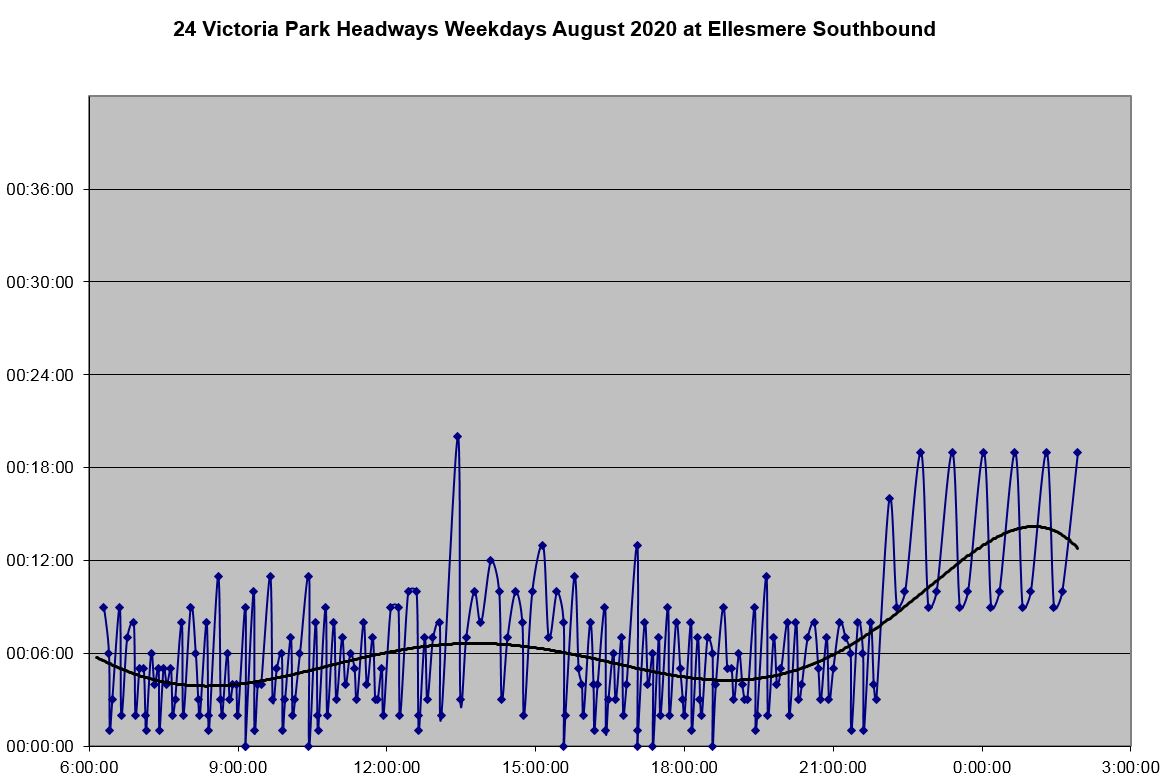
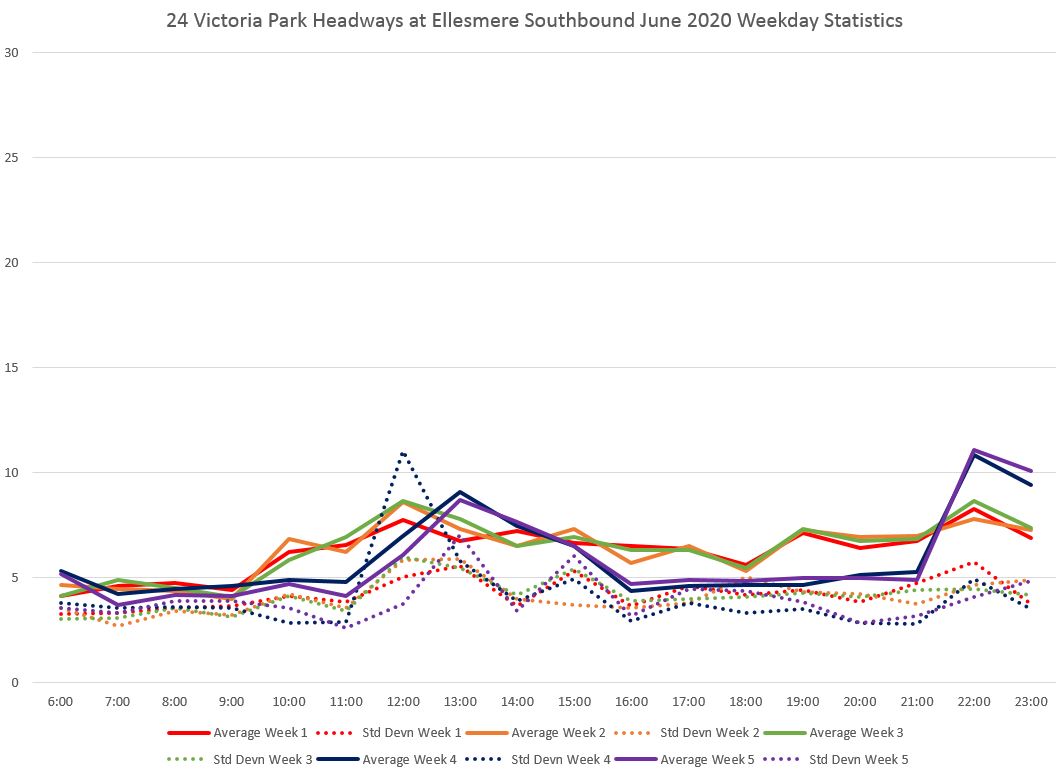
Southbound at Ellesmere with the Consumers Road service included, the average headways are generally better in weeks 4 and 5, but the high standard deviation value reflects a lot of bunching.
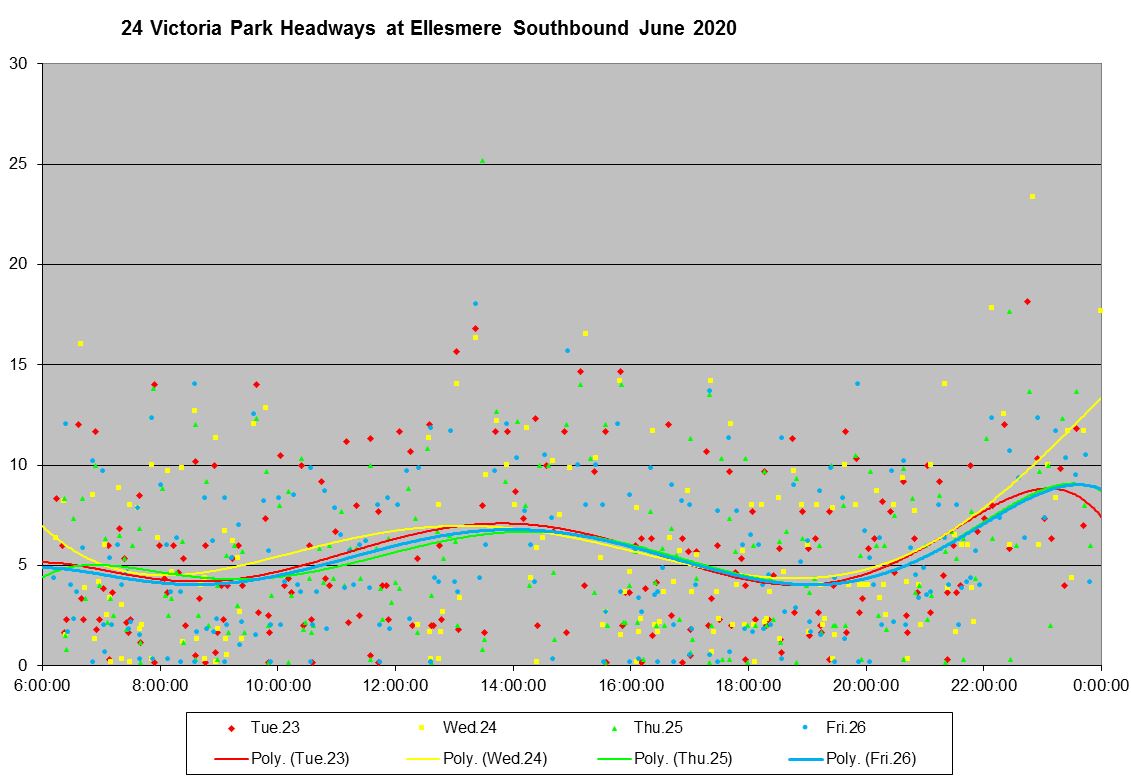
Here are the data at Ellesmere for week 4 with June 22 omitted. The range of headways is shorter than north of Sheppard because there is more service, but the values show that riders can have a wait anywhere from zero to 15 minutes most of the day. This irregular service also contributes to crowding, completely opposed to the standard the TTC claims to be avoiding.
For the locations cited above, the full chart sets are linked below. Note that the set for Consumers Road includes only weekday charts as this branch does not run on weekends.
25 Don Mills
Route 25 Don Mills operated north from Pape Station to Steeles with various branches in March 2020. During the weekday daytime, the local service was split at Sheppard with a separate service running between Don Mills Station and Steeles. Evenings and weekends, all local service runs through from Pape Station to Steeles.
- 25A Pape Station to Steeles local (evenings and weekend only)
- 25B Pape Station to Don Mills Station (weekday daytime)
- 25C Don Mills Station to Steeles (weekday daytime)
- 925 Pape Station to Steeles Express
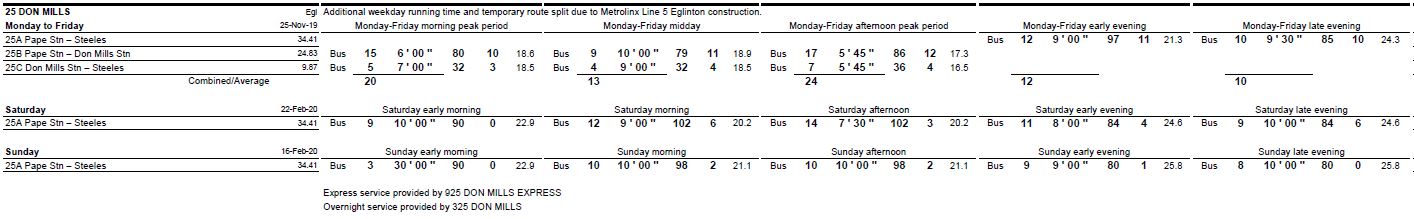

In the schedule effective on May 11, 2020, the express service has been removed, but the split operation during weekday daytime remains. Local service headways are generally less frequent on the May schedule than in March, and so there is a compound cutback to both local and express service according to the schedule summary.
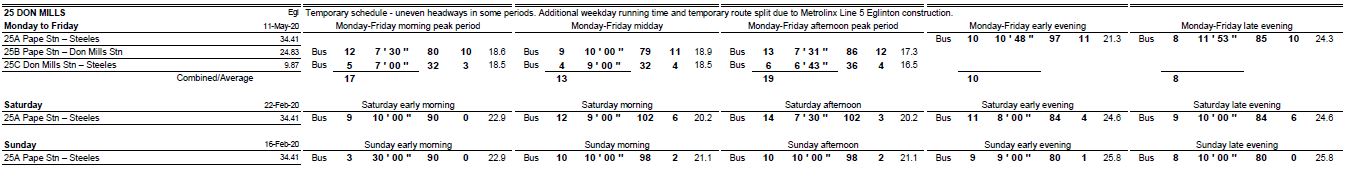
However, the peak service on the actual schedule is roughly 6 minutes, the value for the March schedules, with some runs missing due to cancellations. Note the legend about a temporary schedule with uneven headways in some periods. The schedule summary, above, reflects the average effect of the missing runs which is shown graphically below.
Daytime service is planned at an even headway, but at other times, notably the evening, there are wide scheduled gaps.
The service north of Don Mills Station runs on its own schedule. During the AM peak and midday, it was planned to operate at a constant headway, but run cancellations starting at about 3 pm produce scheduled gaps of double the prevailing headway.
Southbound from Steeles, the pattern in scheduled service is the same as northbound from Don Mills Station.
South of Sheppard, the pattern is the same as for the northbound service.
The tactic of cancelling runs as a quick fix to reduce service without changing the underlying schedule is easy to understand with the circumstances of a system-wide trimming of service. However, this only really works for riders if the gaps in the schedule are not reflected in service that they see on the street.
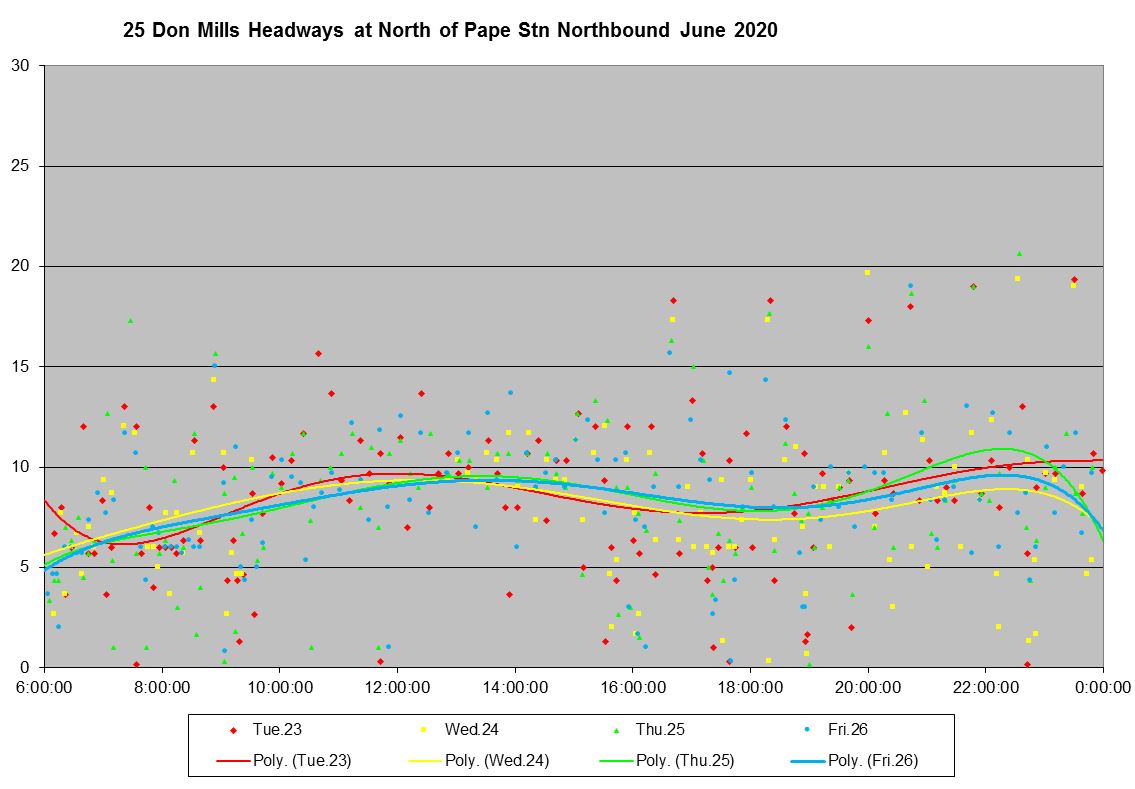
The actual average headways leaving Pape Station northbound in weeks 4 and 5 of June are longer because of the run cancellations. However, the standard deviation of values is also high indicating bunching.
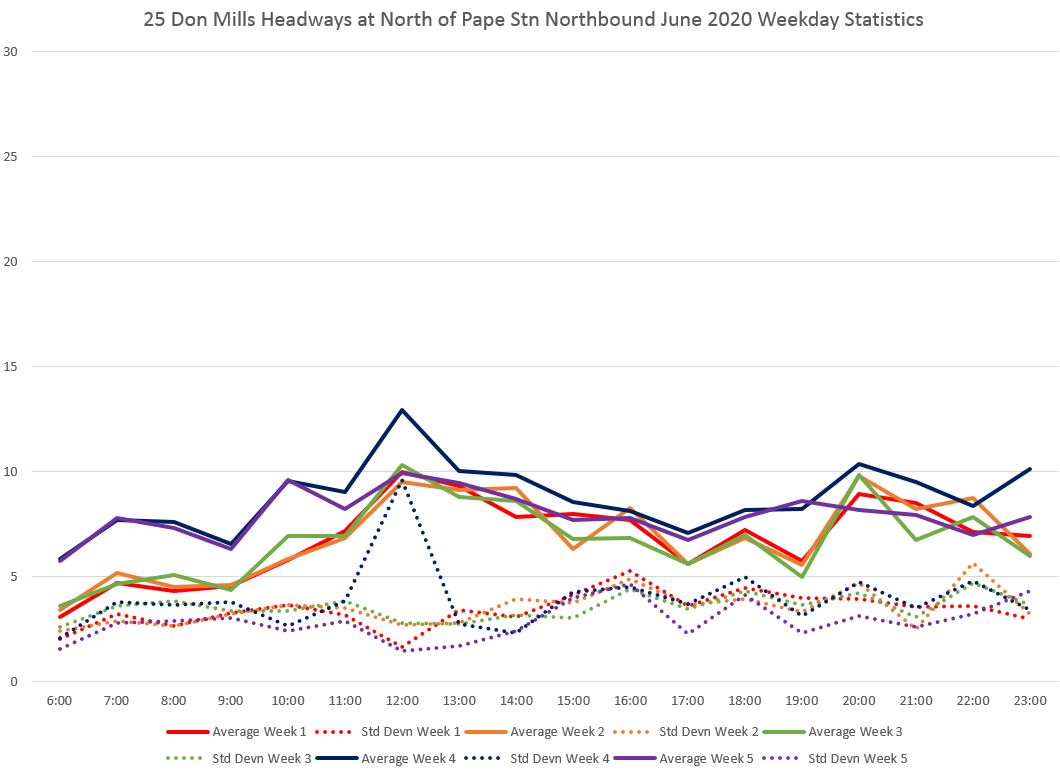
Bunching is evident, especially in the PM peak and evening with a mixture of short and wide headways. June 22 is omitted because the missing data from that day distort the trend line.
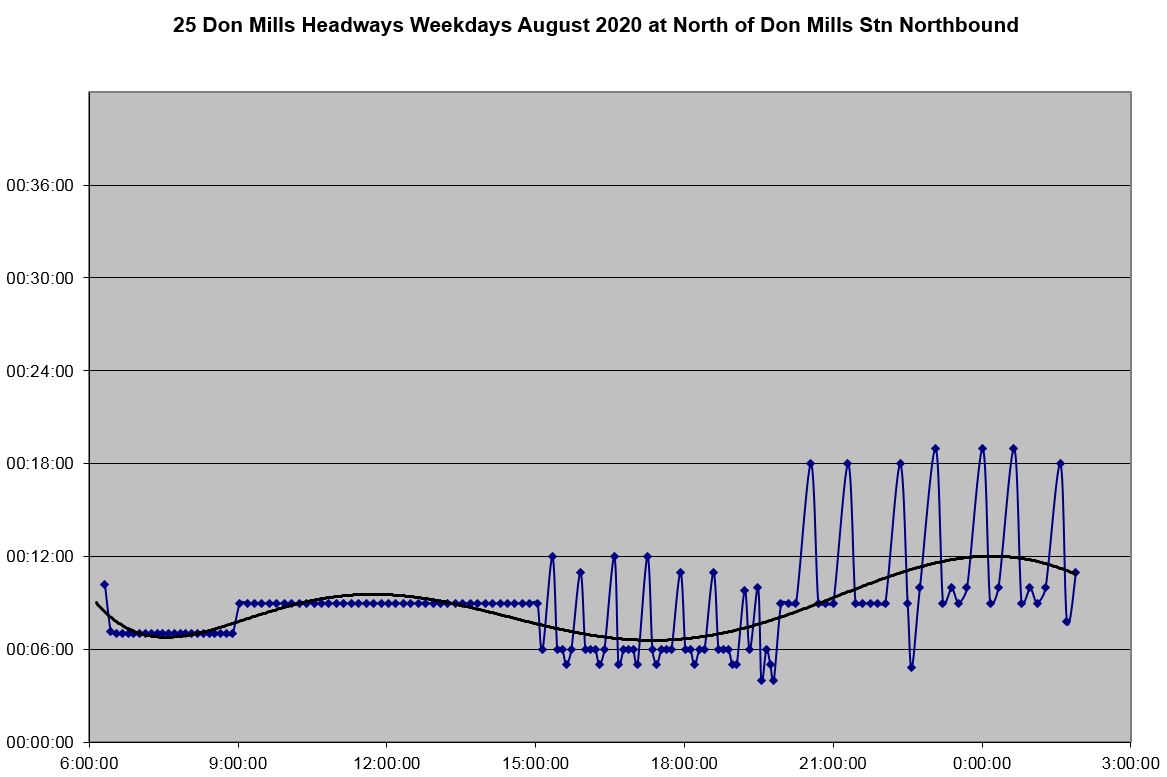
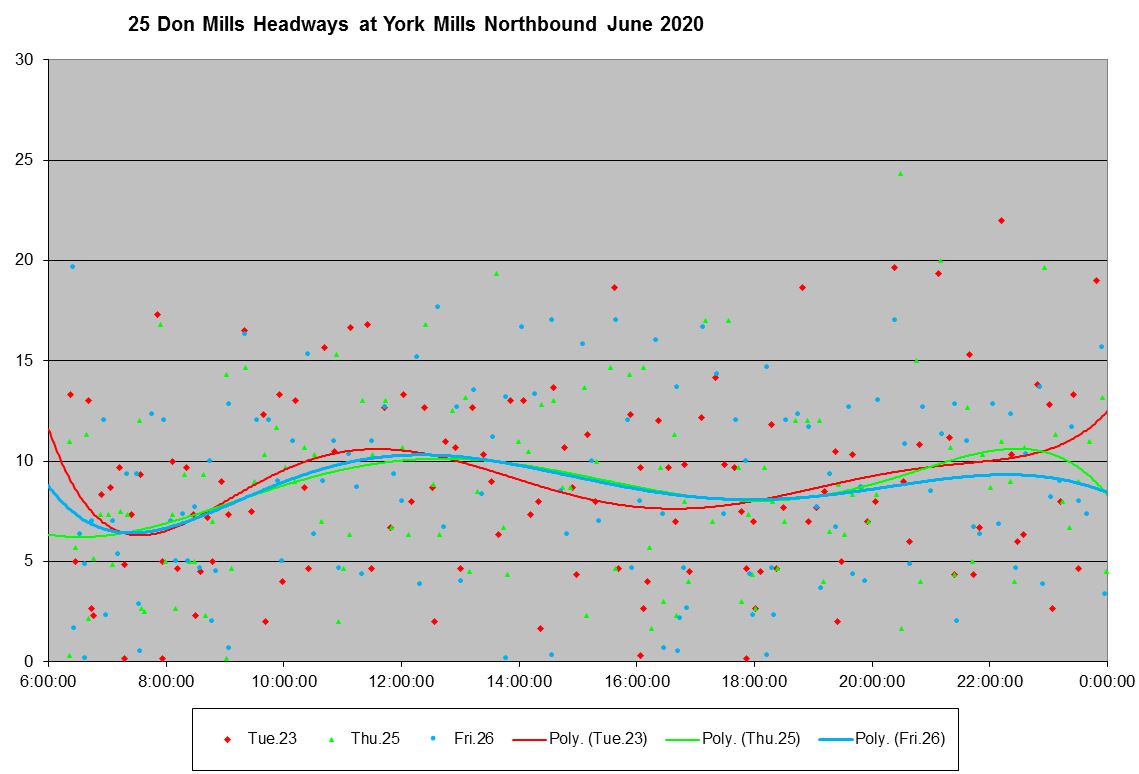
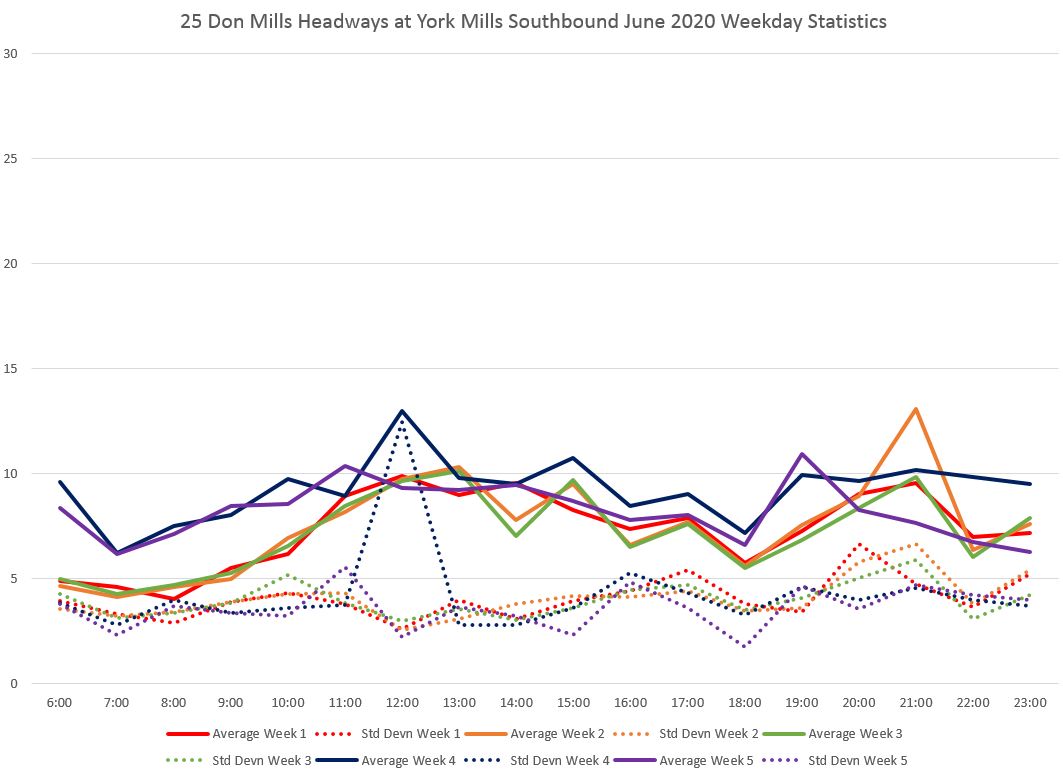
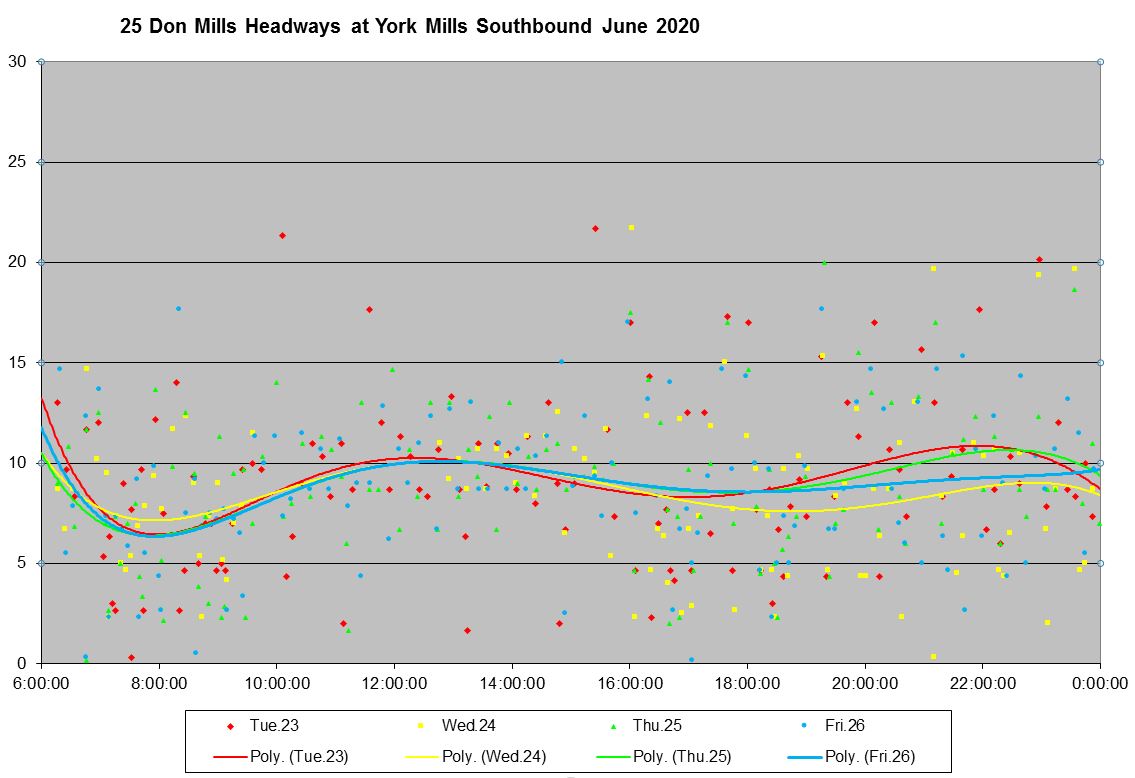
Further north, at York Mills, the pattern is similar to the one at Pape Station, but the standard deviations are higher and actual service runs at more scattered headways.
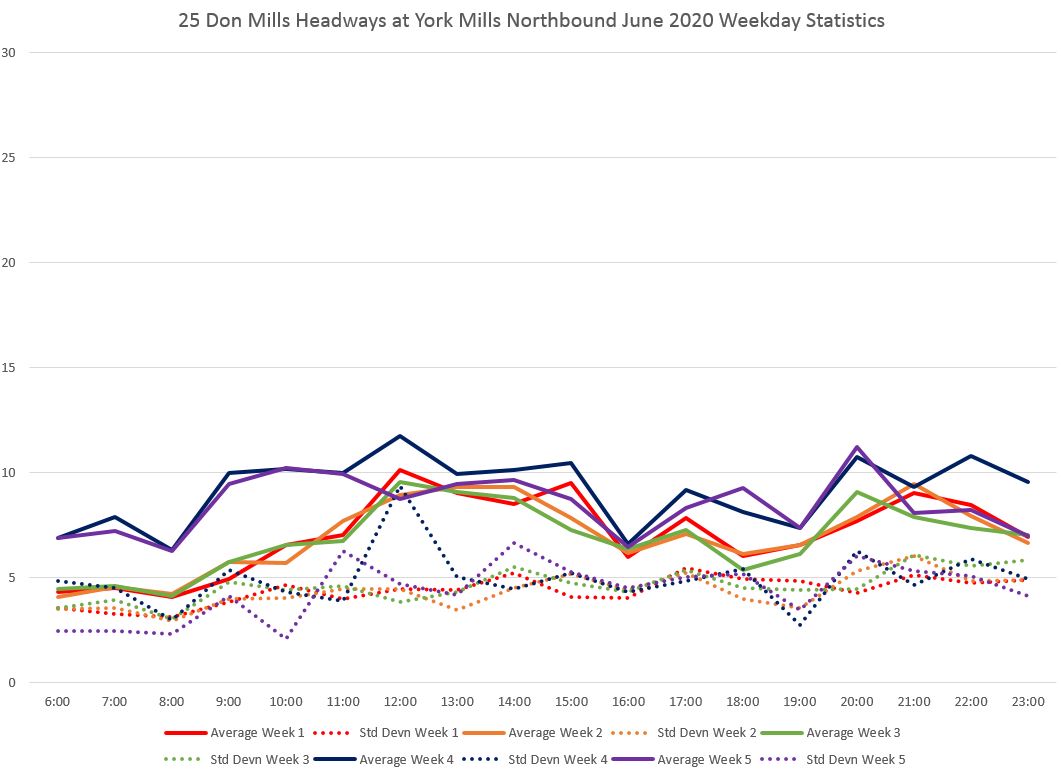
By the time buses reach York Mills, headways lie over a range from zero to 20 minutes all day. June 22 and 24 have been omitted because of the missing data problem noted earlier, but where there are data, they show a similar pattern. (The chart in the full set linked below includes these days.)
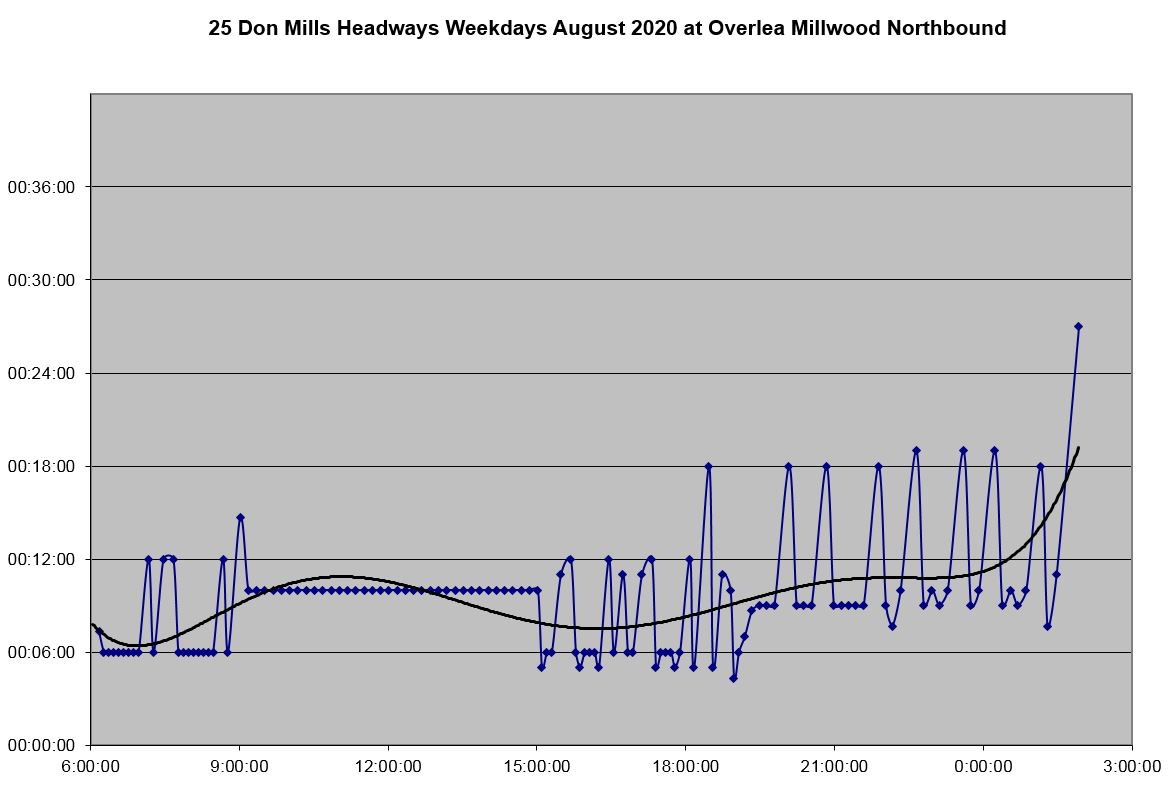
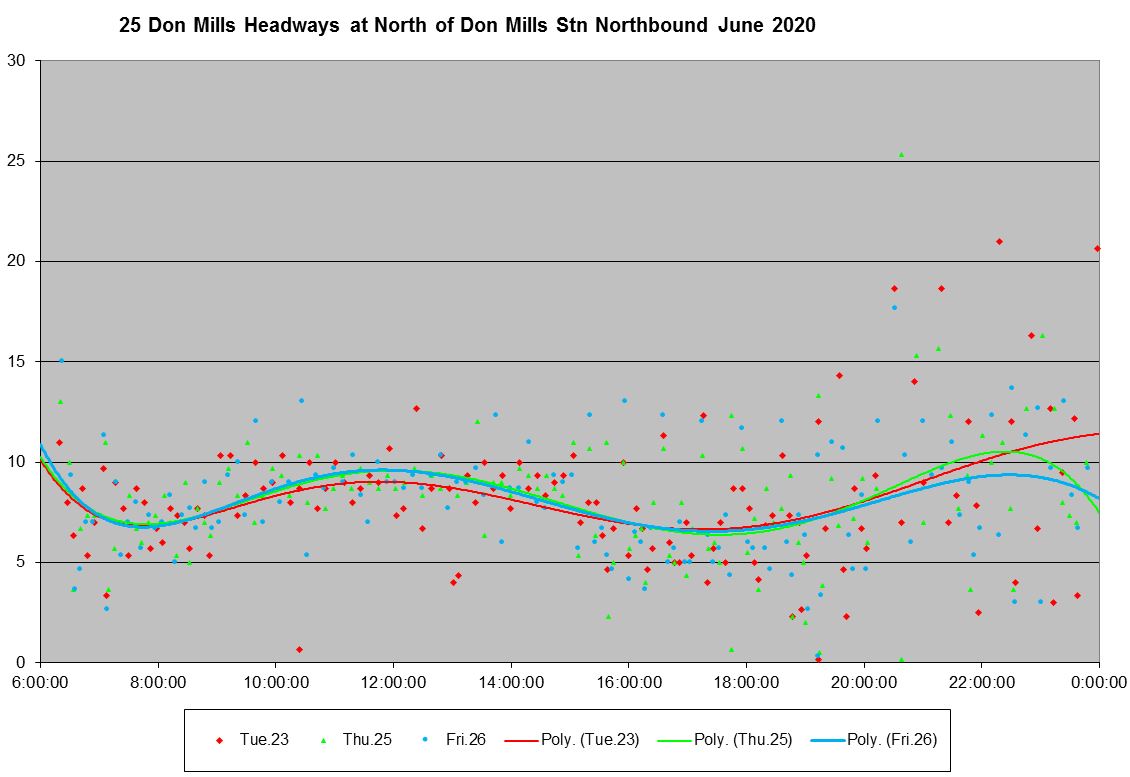
Leaving Don Mills Station nortbound, we see the same pattern with less frequent service in weeks 4 and 5 and a high SD value thanks to scheduled irregular headways later in the day.
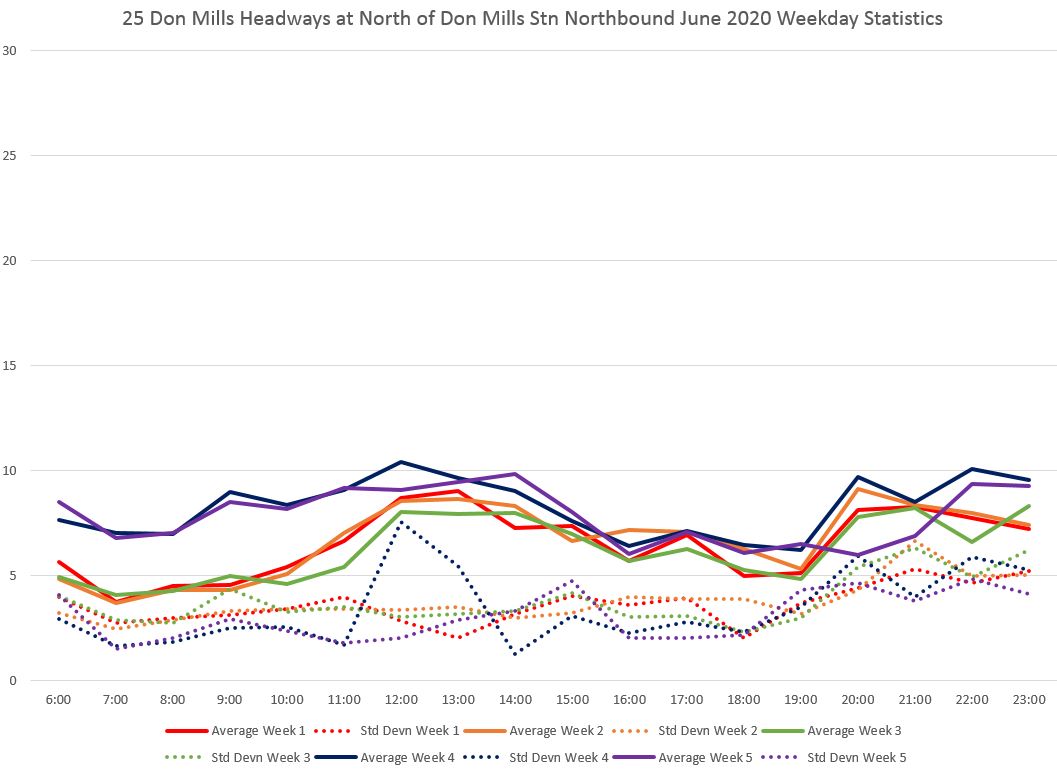
The actual headways leaving the station lies in a fairly narrow band until the PM peak when the scheduled gaps begin to take effect. This chart shows quite clearly that the TTC is not compensating for the missing runs.
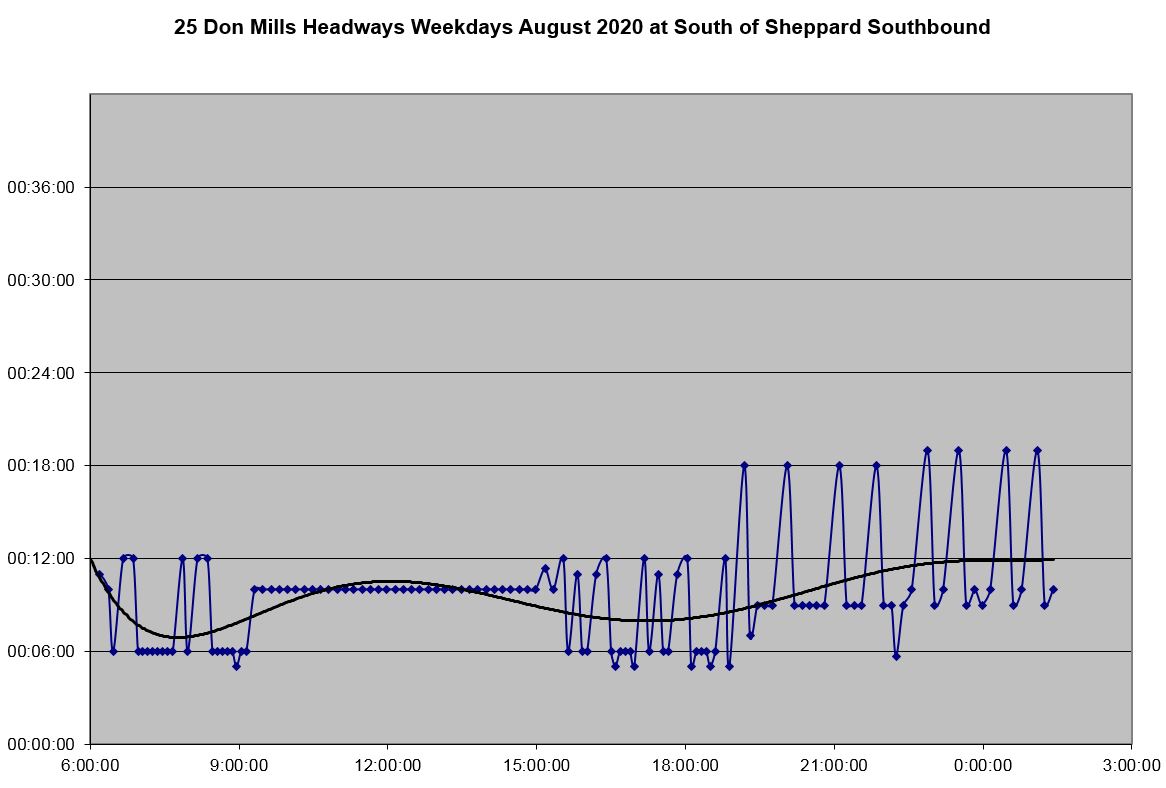
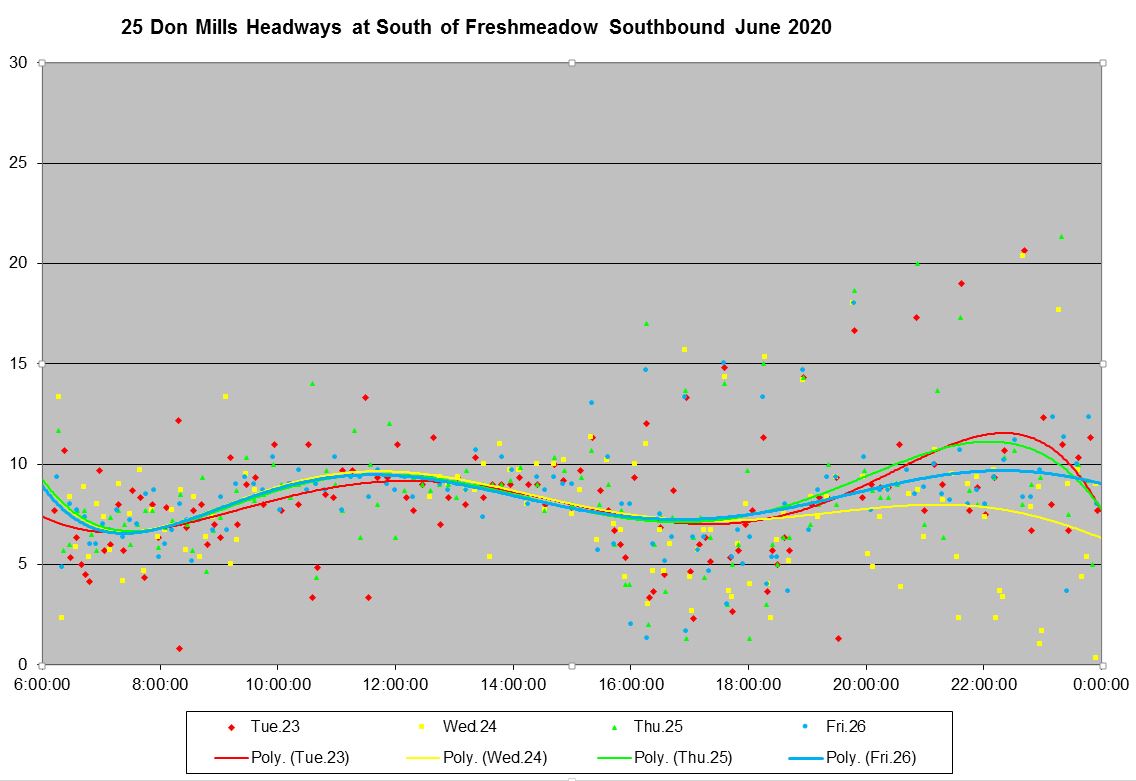
The situation southbound is similar to northbound with less service starting in week 4, and scheduled gaps due to cancellations from the PM peak onward.
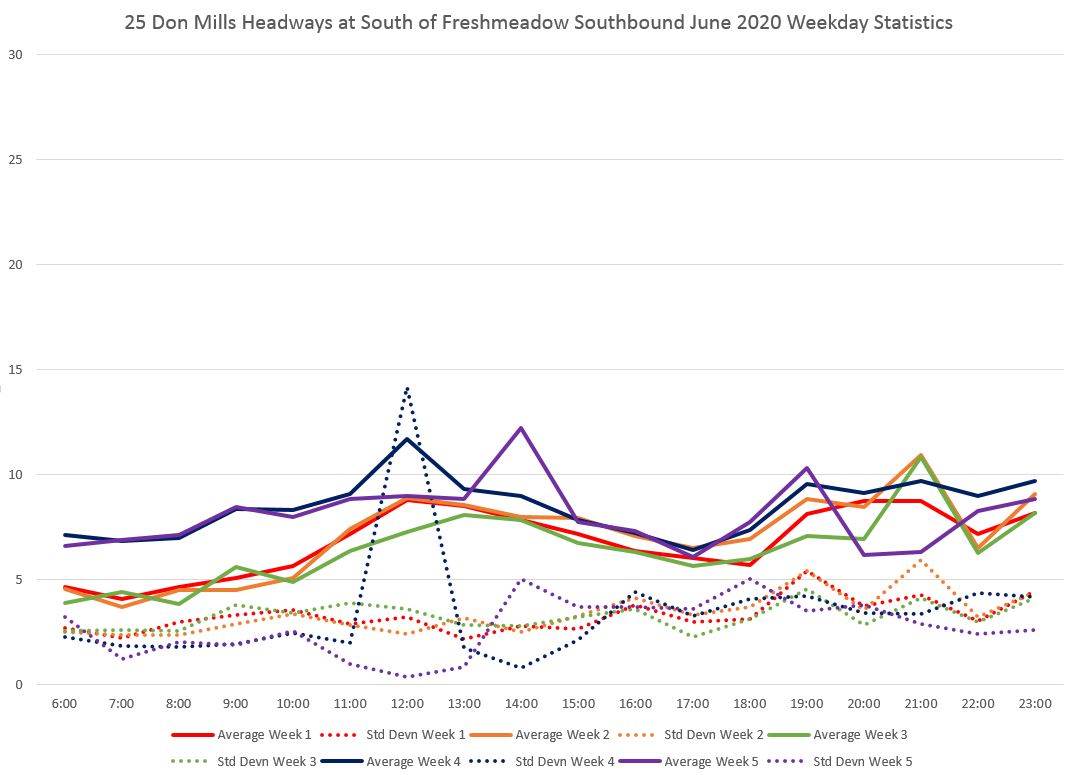
As with the northbound service, the headways are more tightly grouped in the AM peak and midday, but the service becomes erratic from the PM peak onward.
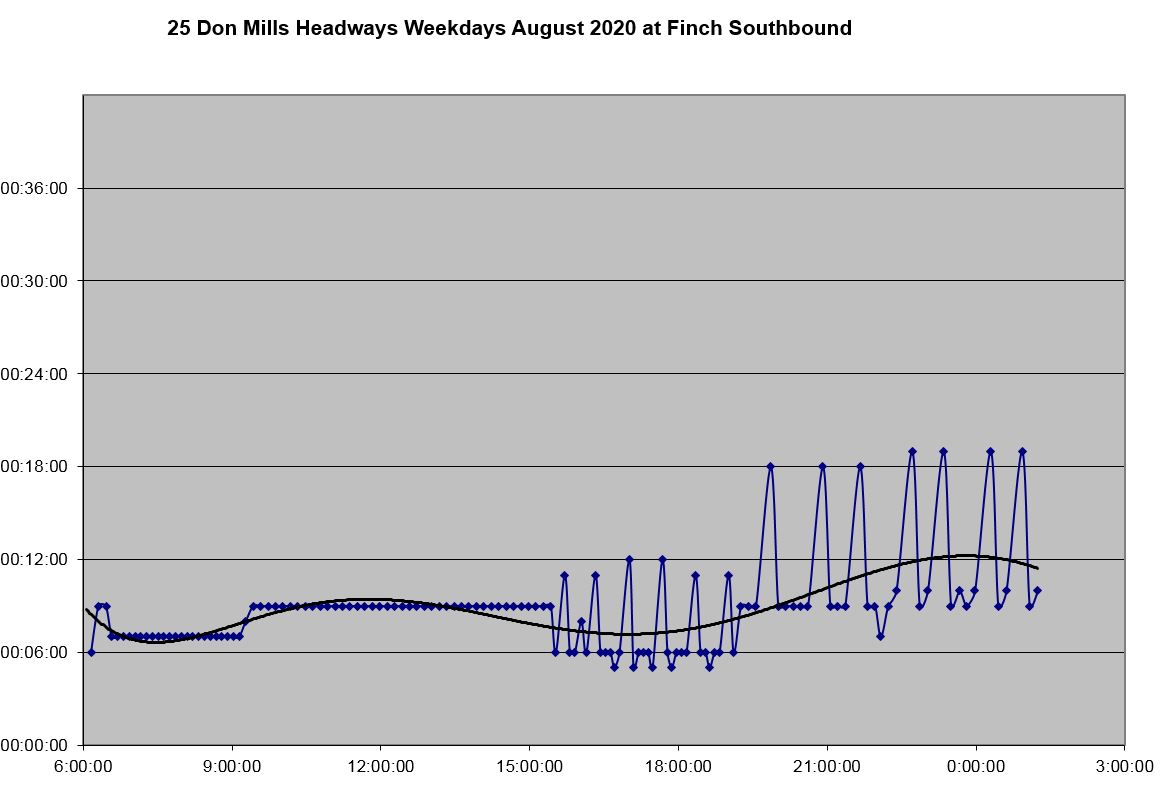
At York Mills southbound, headways are scattered over a wider range than on the north end of the route because there are more scheduled gaps south of Don Mills Station.
Headways at York Mills range from zero to 20 minutes.
For the locations cited above, the full chart sets are linked below.
7 Bathurst
The Bathurst bus operates from Bathurst Station north to Steeles, although for a period in June and July, it was diverted to Spadina Station to avoid track and roadway construction at Bathurst. There are no branches on this route, nor is there an express bus.
A separate 160 Bathurst North route operates from Wilson Station via Wilson and Bathurst to Centre Street in York Region. It is not included in this review. The only change to that route has been a slight reduction in AM peak service.
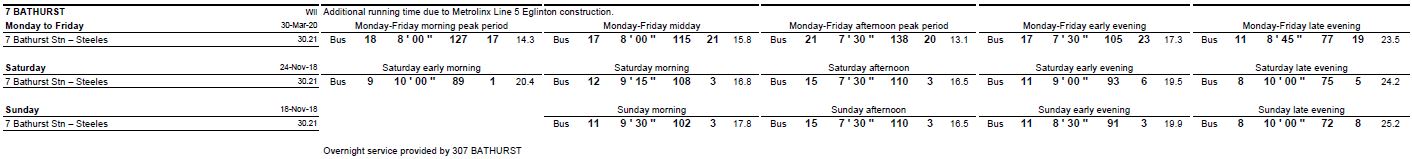
Weekday service in June was improved during weekday peaks and early evening, but reduced during midday and late evening.

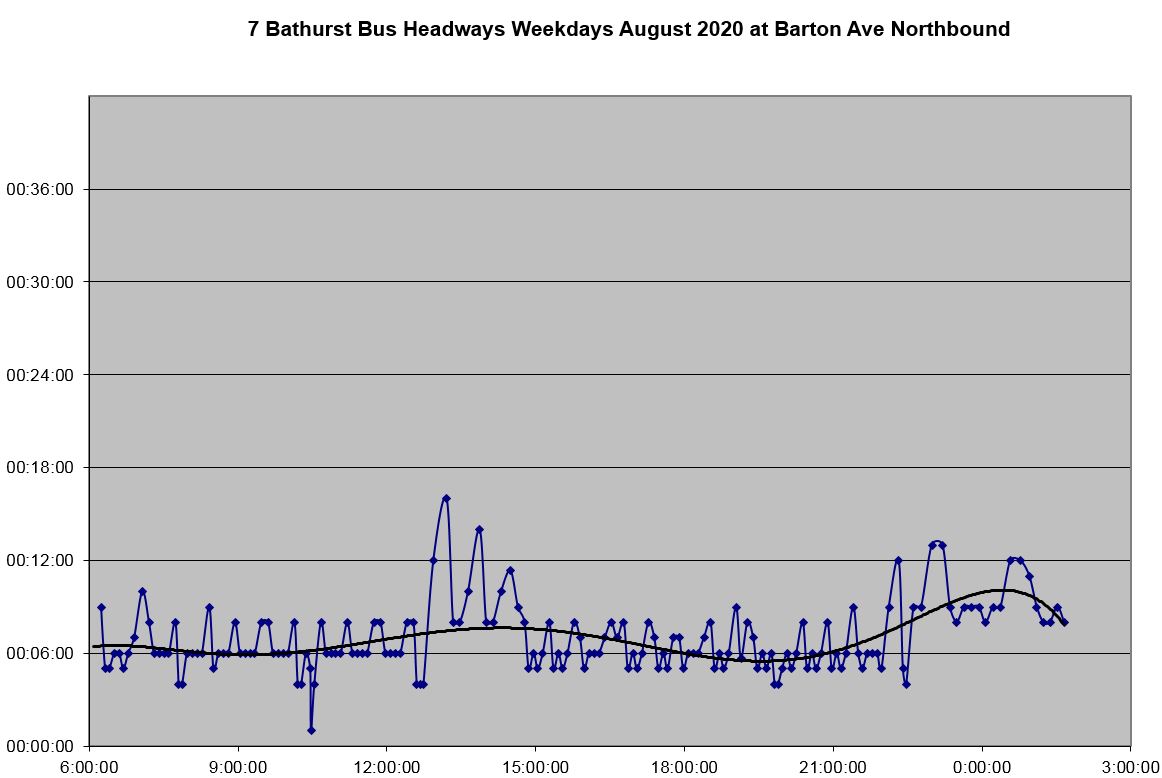
Although they are not shown on the service summary above, Bathurst has trippers which supplement the morning service until just after noon, and from the PM peak through to late evening. Although they operate separately from the basic service, the headways blend tolerably well with a smaller swing between lows and highs than seen on other routes.
The chart below shows the scheduled service at Barton Avenue, the first stop north of Bathurst Station.
The scheduled service south from Steeles shows a similar pattern.
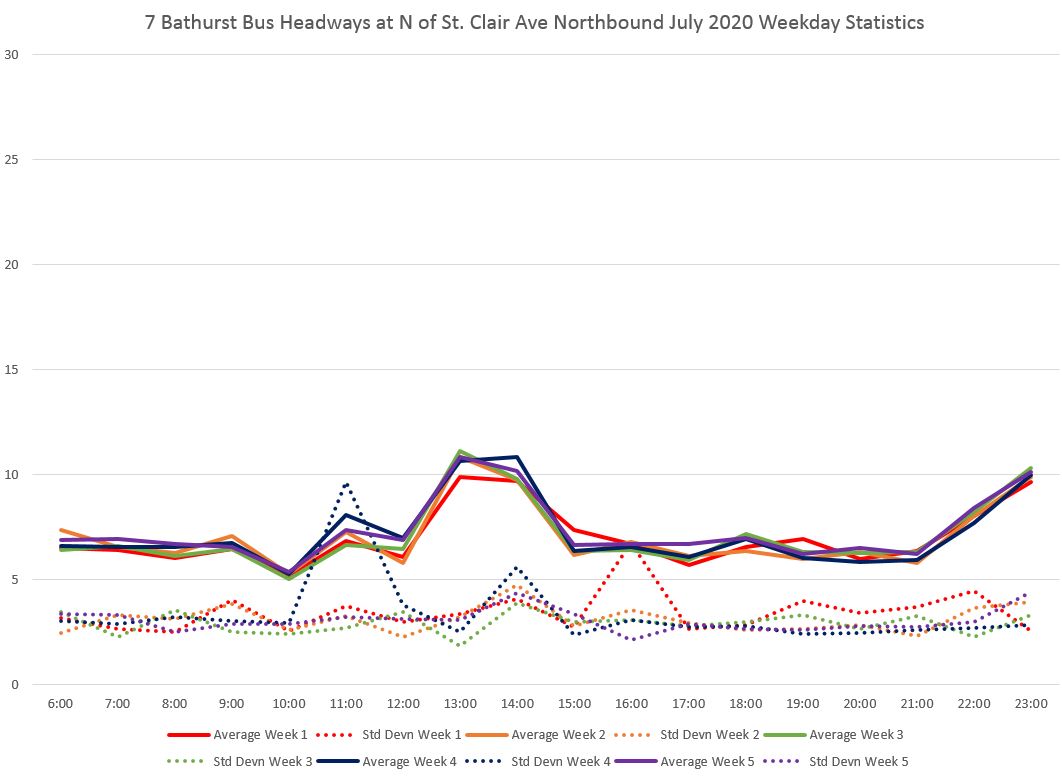
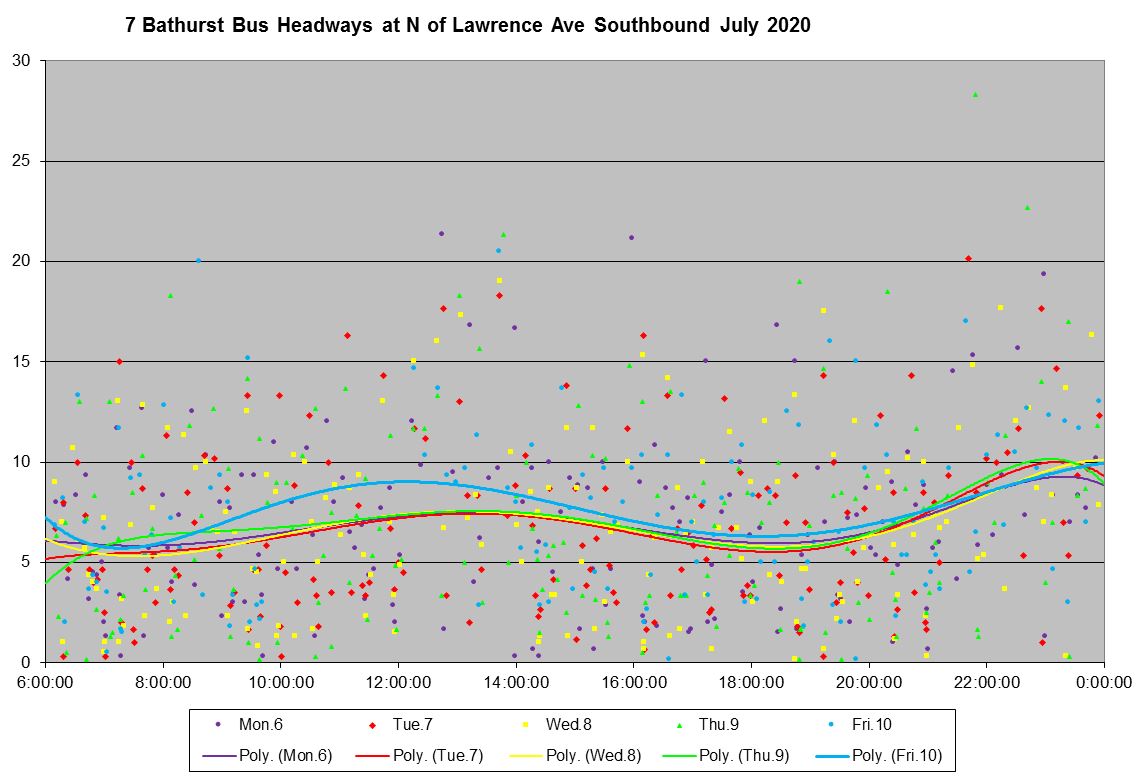
The northbound service is shown for July 2020 at St. Clair. This picks up the service regardless of its southern origin, either Bathurst or Spadina Stations depending on the state of the diversion the was used for part of the month.
The standard deviation of the headways is lower than seen on some other routes reflecting the less scattered values on the schedule sitting consistently at the three-minute mark.
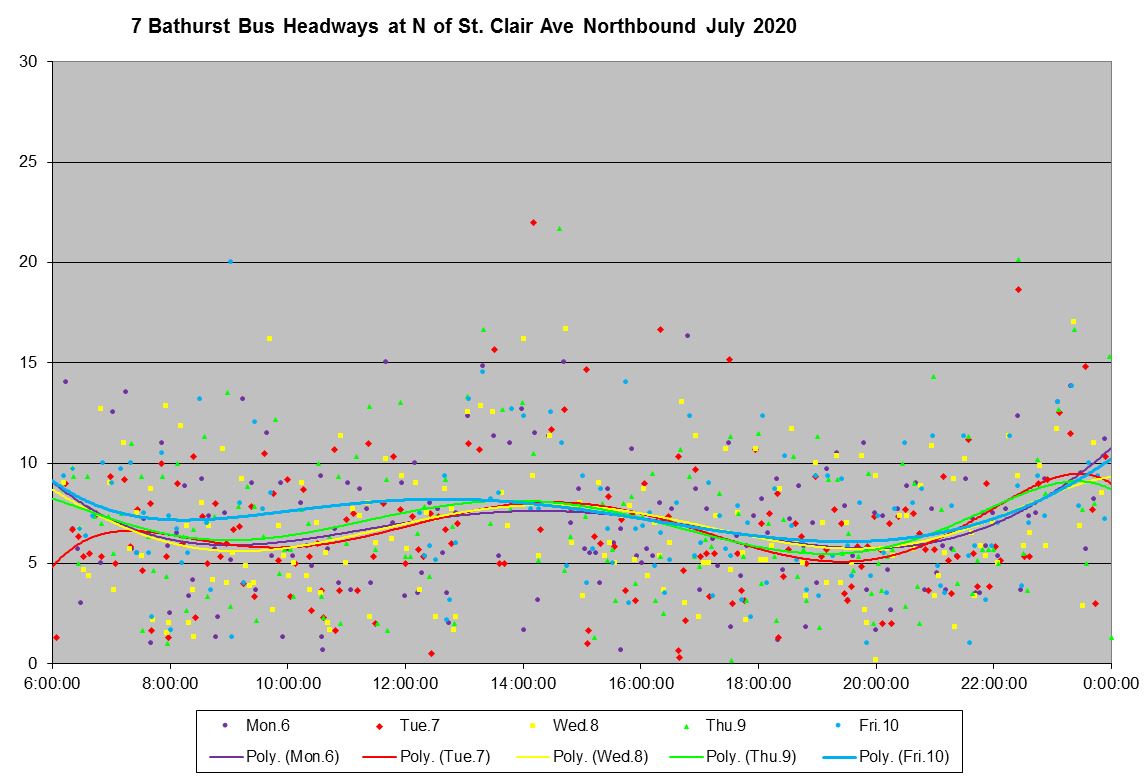
The detailed data show that the headways lie in a band from zero to 15 minutes, although for parts of the day most points are below the 10 minute line.
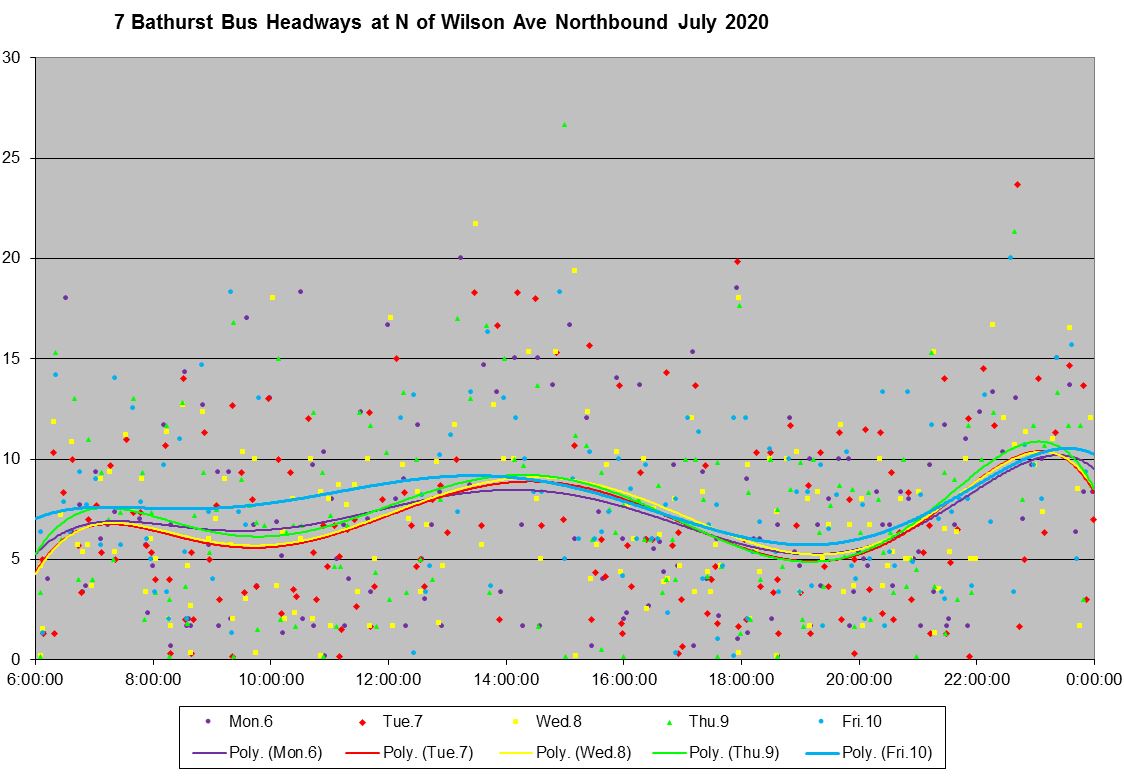
By the time this service reaches Wilson northbound, the headways are more scattered, and the SD value is higher even though the averages are similar to those at St. Clair.
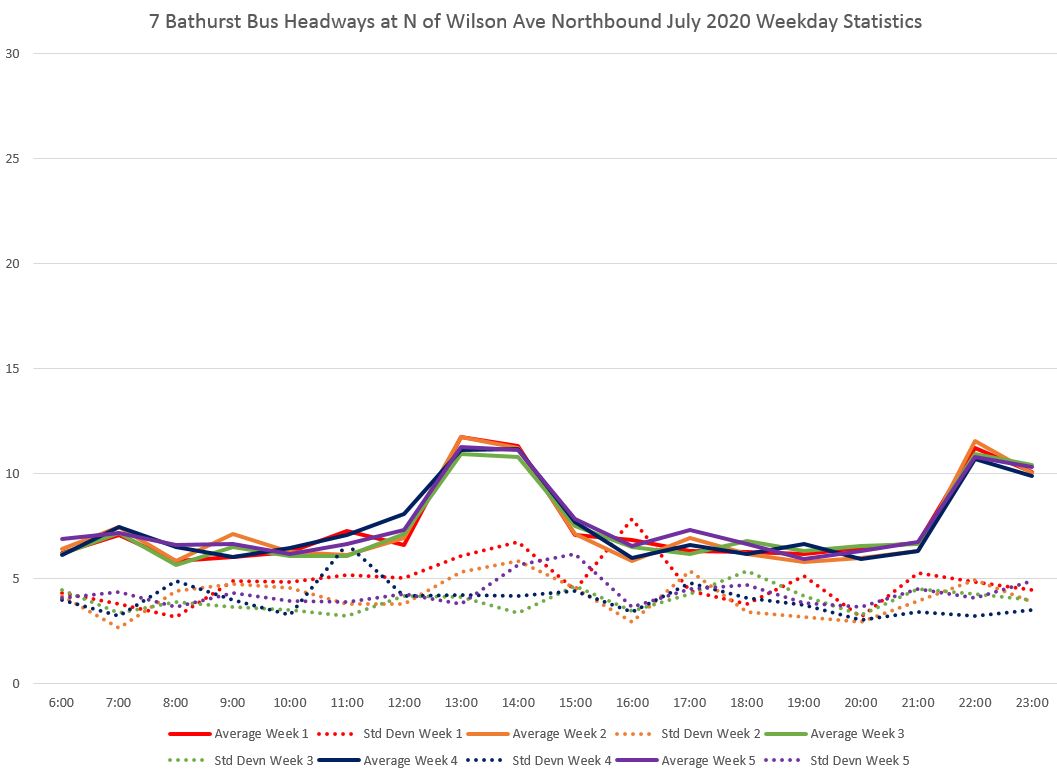
The detailed data show that the range of headways is wider at Wilson reflecting a typical problem that service becomes more uneven as buses move along their route. A bus on a short headway carries fewer passengers and tends to catch up to its leader, but leaves a wider gap in its wake.
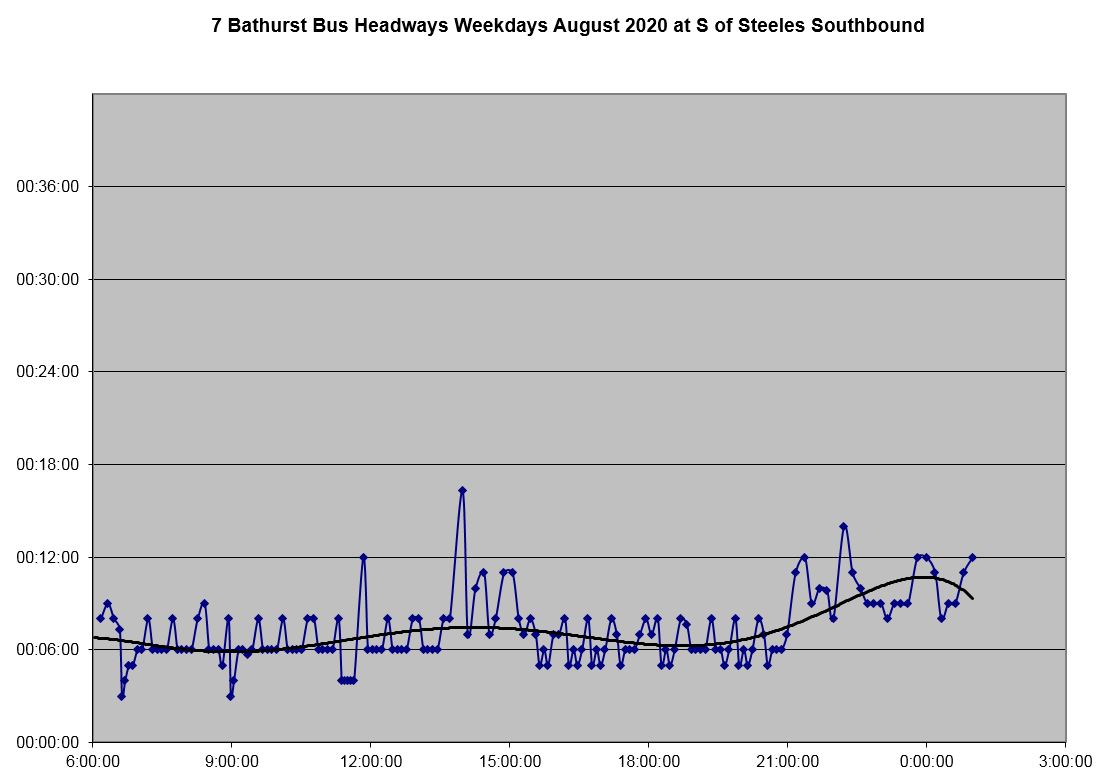
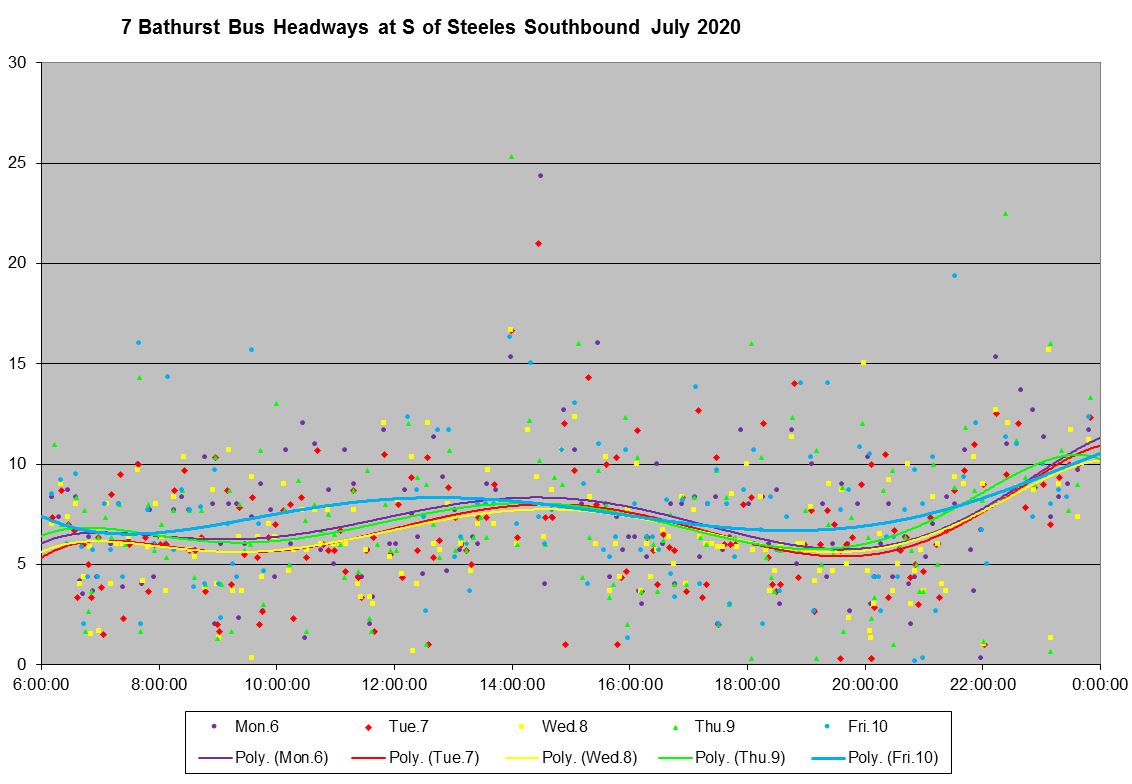
Southbound from Steeles, the headways are back to a narrower band with a lower SD value for much of the day.
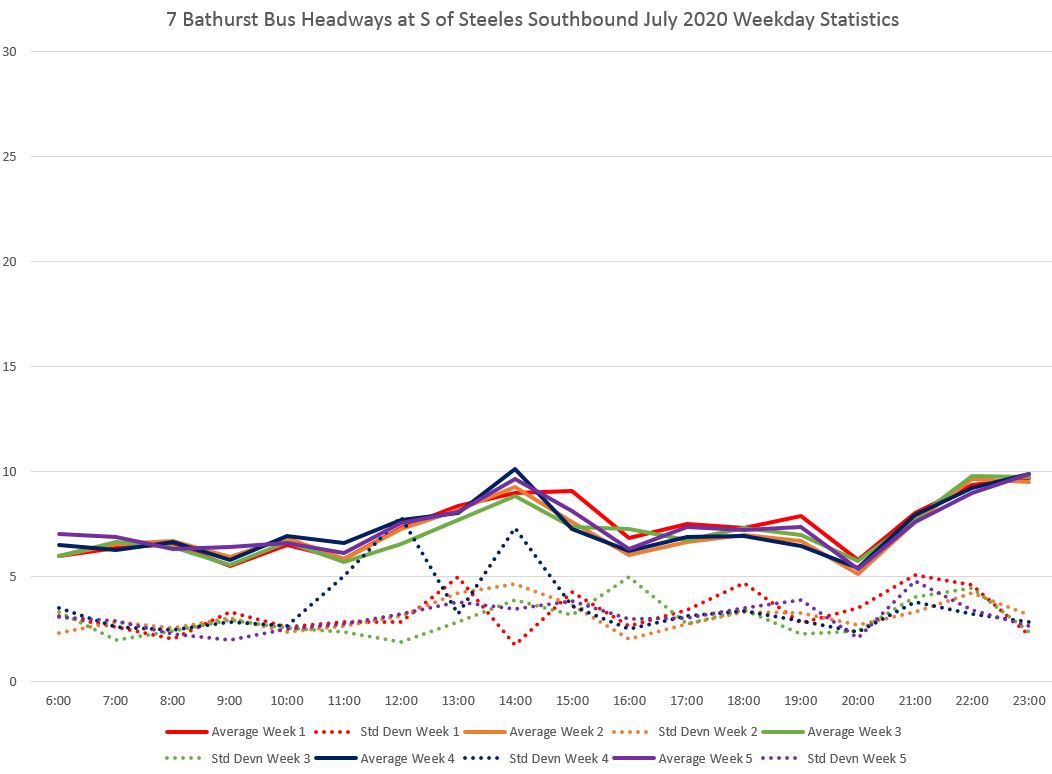
As at Barton Avenue, service near the terminal has more closely clustered headways, although some that are only a few minutes are evident.
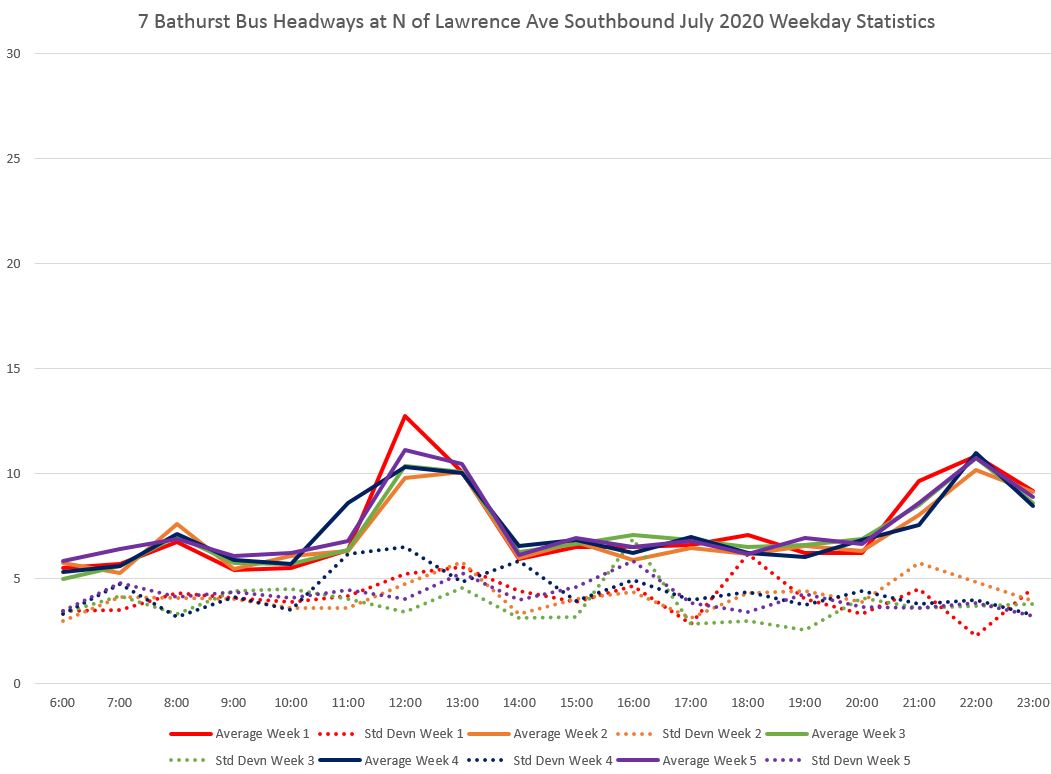
When the service has reached Lawrence, the SD value is larger, and the values are spread over a wider range. This route is an example of how service at terminals does not reflect what most riders actually see. This is particularly important when crowding is an issue and uneven headways can lead to buses that have more riders than an average value would suggest.
For the locations cited above, the full chart sets are linked below.
29 Dufferin
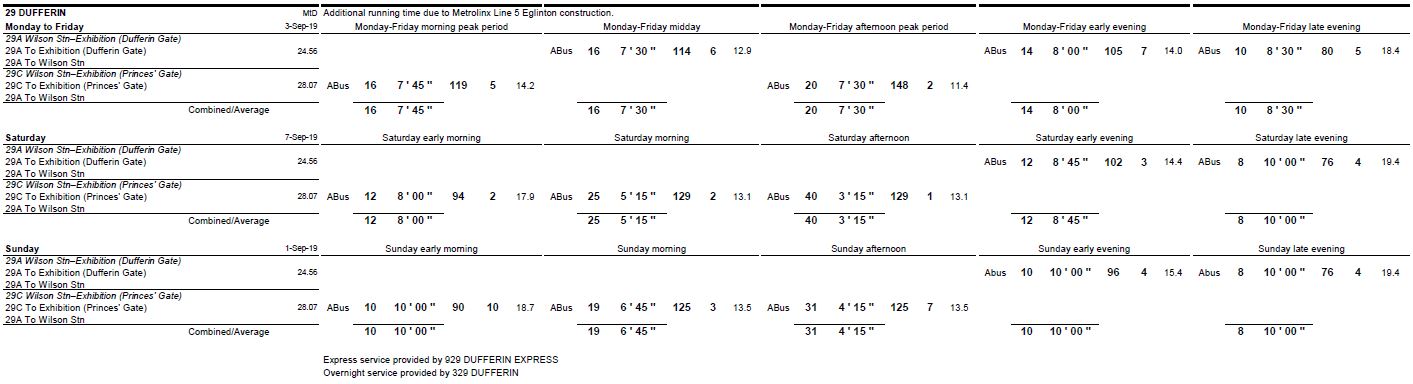
In March, service on Dufferin included both local and express branches with all service planned for articulated buses.
- 29A Wilson Station to Dufferin Gate (weekday midday, and evenings all days)
- 929 Wilson Station to Dufferin Gate Express (weekdays until mid-evening)
- 29C Wilson Station to Princes’ Gate (weekday peak periods and weekends daytime)
Although the schedule summary specifies articulated buses, in fact some of the service is operated with standard sized vehicles thereby reducing capacity and increasing crowding. This affected mainly peak period trips in March 2020, but the problem grew when the “peak” vehicles became trippers that operated for much of the day.

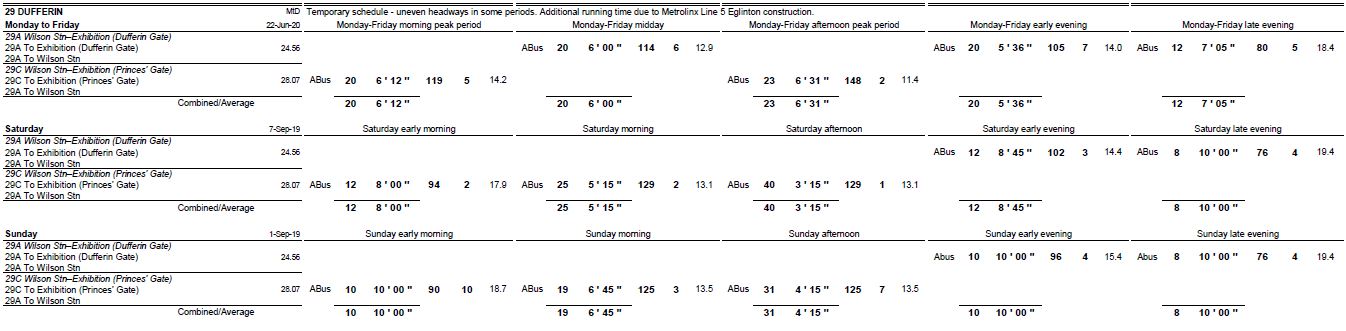
In the June schedule, there is no express bus, and the local service runs less frequently at peak, more frequently offpeak on weekdays. As in March, all service is planned for articulated buses.
The “tripper” vehicles operate for much of the day, except between roughly noon and 3 pm, and most of these are standard sized buses which do not provide the planned capacity and lead to crowding.
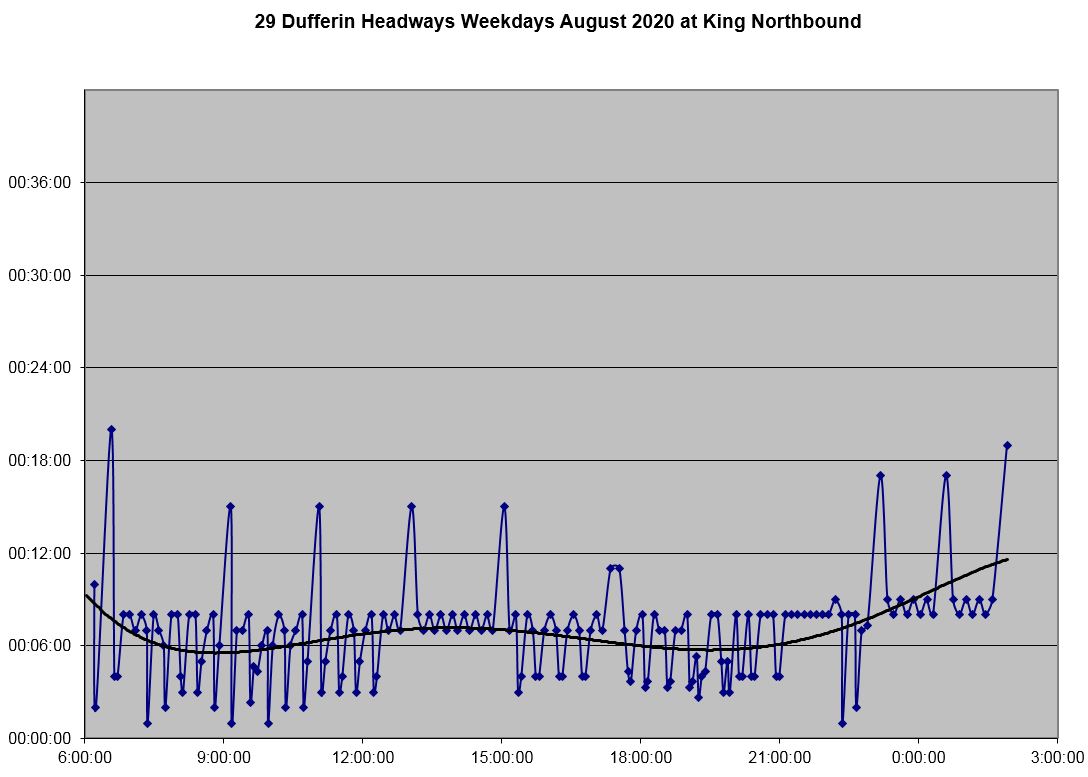
The scheduled service northbound at King shows two effects. One is the occasional wide gap caused by cancellation of a run, and the other is the uneven headways caused by a mismatch between “tripper” and regular services.
The same pattern is also evident southbound because there are no short turns on this route, and the same service operates over its entire length.
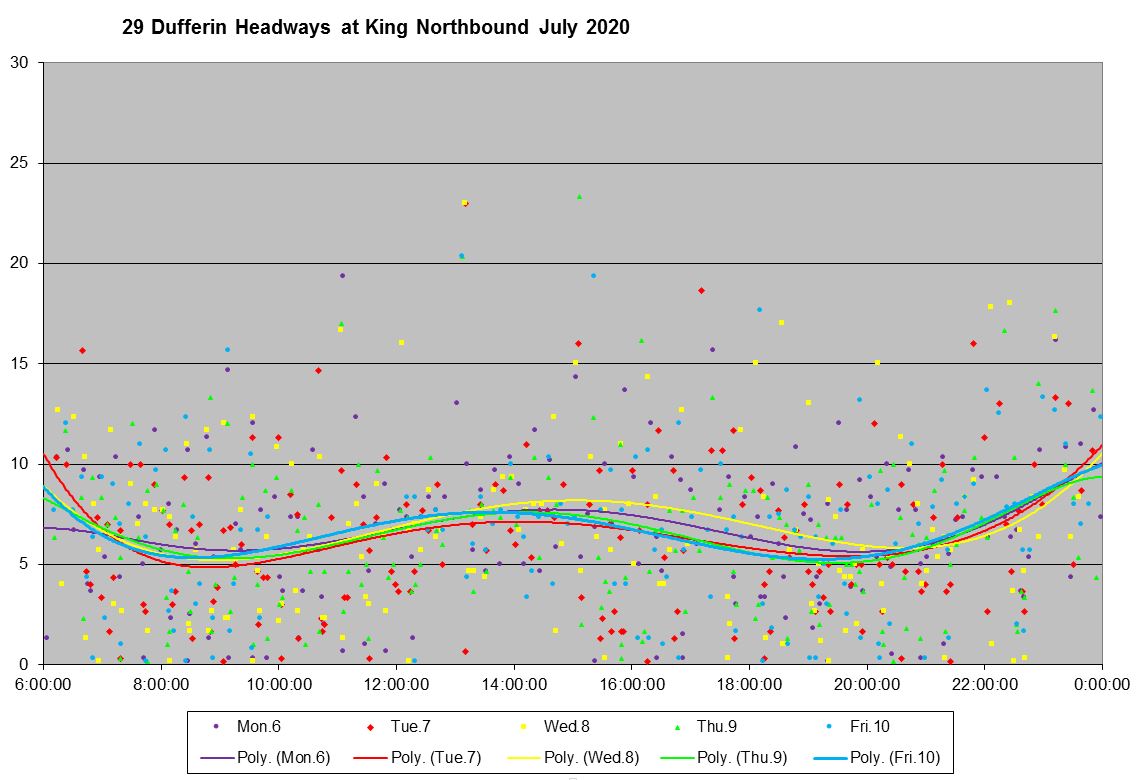
The service northbound at King has a standard deviation of four to five minutes thanks to the uneven scheduling of the trippers.
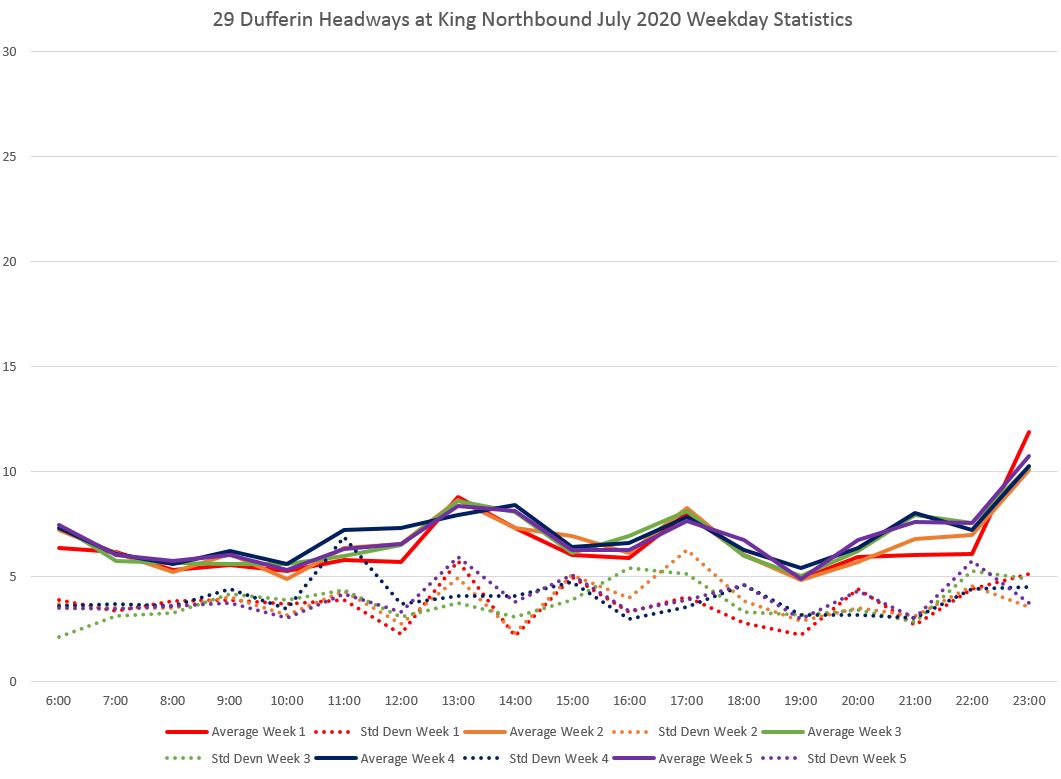
However, this is not just a scheduling problem but one of uneven departures northbound where headways range from zero to over 15 minutes, and there are many closely spaced vehicles.
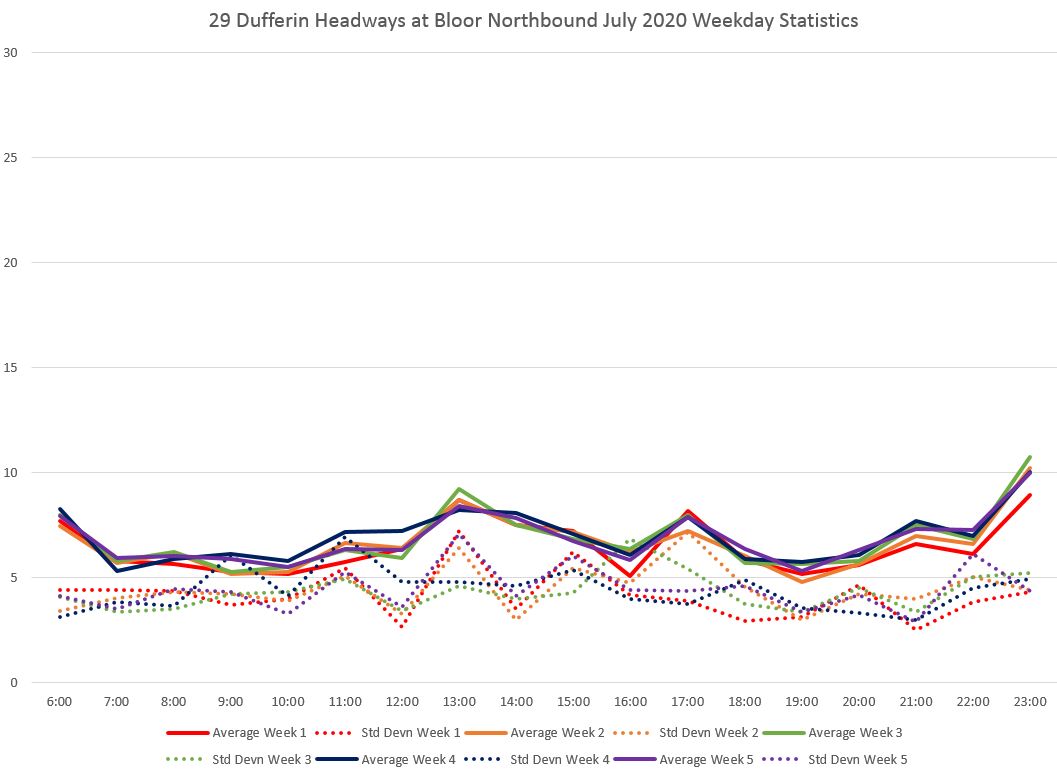
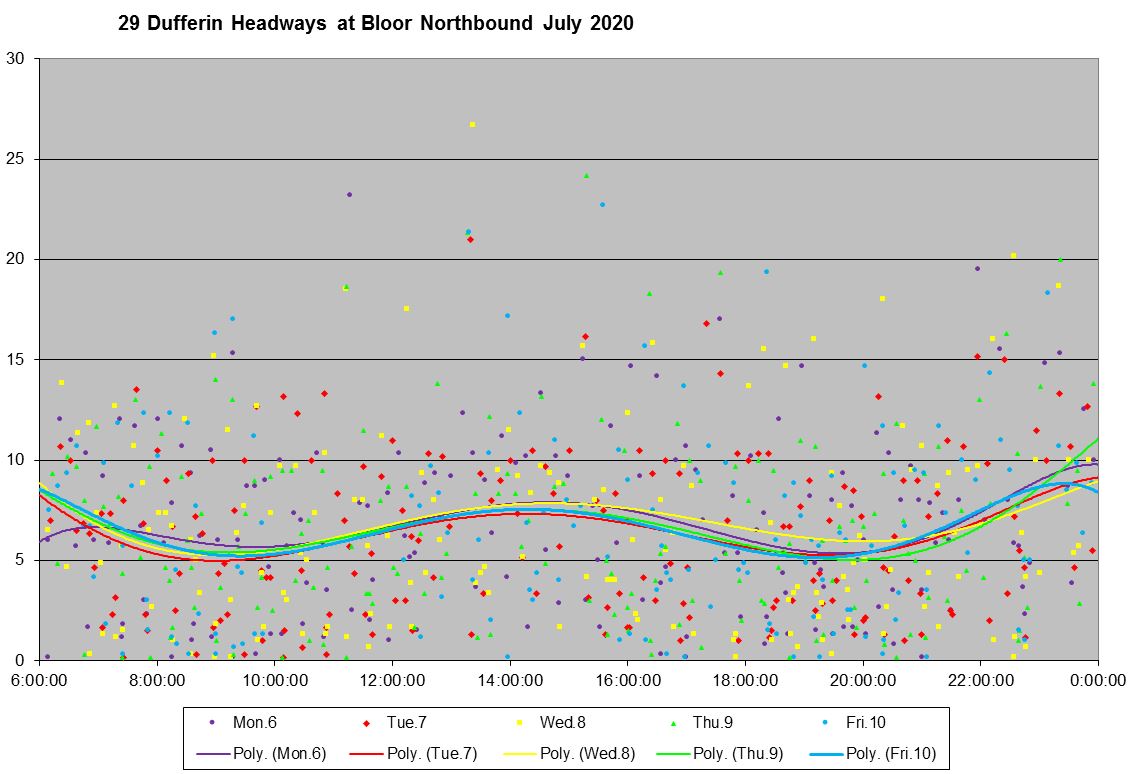
By the time the service reaches Bloor, the SD value has increased slightly and headways remain scattered between zero and 15 minutes with a few higher values.
Southbound from Transit Road, the service is very close to the terminal and the headways are not as scattered as they were northbound. The SD value here sits a a lower level than northbound at King or Bloor.
However, very short headways do occur showing that buses regularly leave the terminal close together.
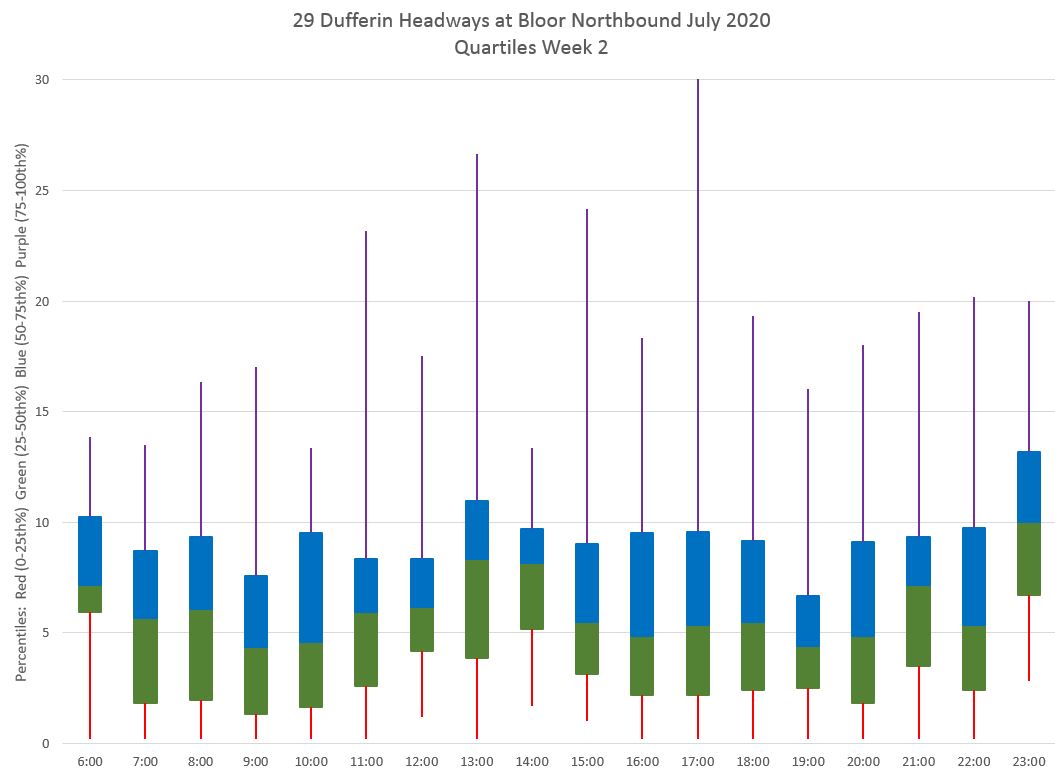
There are additional charts in the sets below that illustrate the data in different ways although I have not included them in the article. Among these are charts that break down the data by quartiles. Here is the chart for week 2 of July northbound at Bloor corresponding to the raw data illustrated above.
The blue and green blocks contain the second and third quartiles (25th to 75th percentiles) of the data, with the mean (50th percentile) marked by the colour change. This shows the range over which headways are scattered for half of the service. The remaining quartiles are shown by the whiskers. The lower red ones include the first quartile while the upper purple ones hold the fourth quartile.
Ideally, the box should be as short as possible with a limited range of values, and the whiskers should not extend far. However both very short and very long headways are common enough that the lower quartile almost always starts close to the axis, while the upper quartile can reach the 30 minute mark or beyond.
For the locations cited above, the full chart sets are linked below.
41 Keele
The Keele bus operates from Keele Station to Pioneer Village Station, and included a peak peak period express branch terminating at Finch West Station. Although the southern terminus is shown as Keele Station, the route actually operates south to Howard Park during construction at the station.
Weekday service is planned for articulated buses while weekend service is planned for standard sized vehicles.

There was no change in June 2020 for the local service which continues to operate on the March schedule, but the express service has been removed.

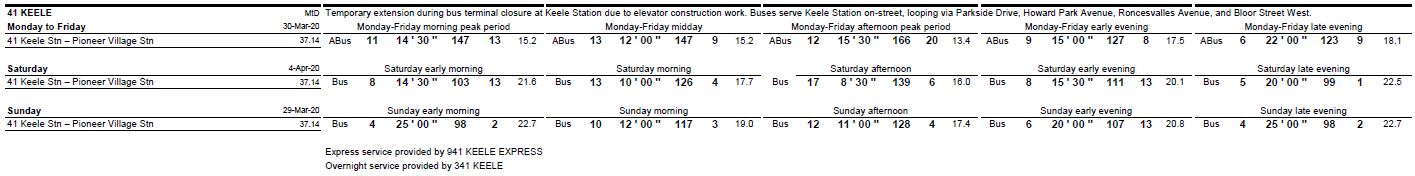
Although the schedule summary specifies articulated buses on weekdays, as with 29 Dufferin, the Keele bus actually runs with standard sized buses as trippers. The frequencies shown above do not match the schedule published for external services as shown below.
Leaving Keele Station there is a consistent headway only during the early afternoon and late evening when the trippers are not running. Otherwise the service alternates between shorter and longer headways.
The southbound service shows a similar pattern.
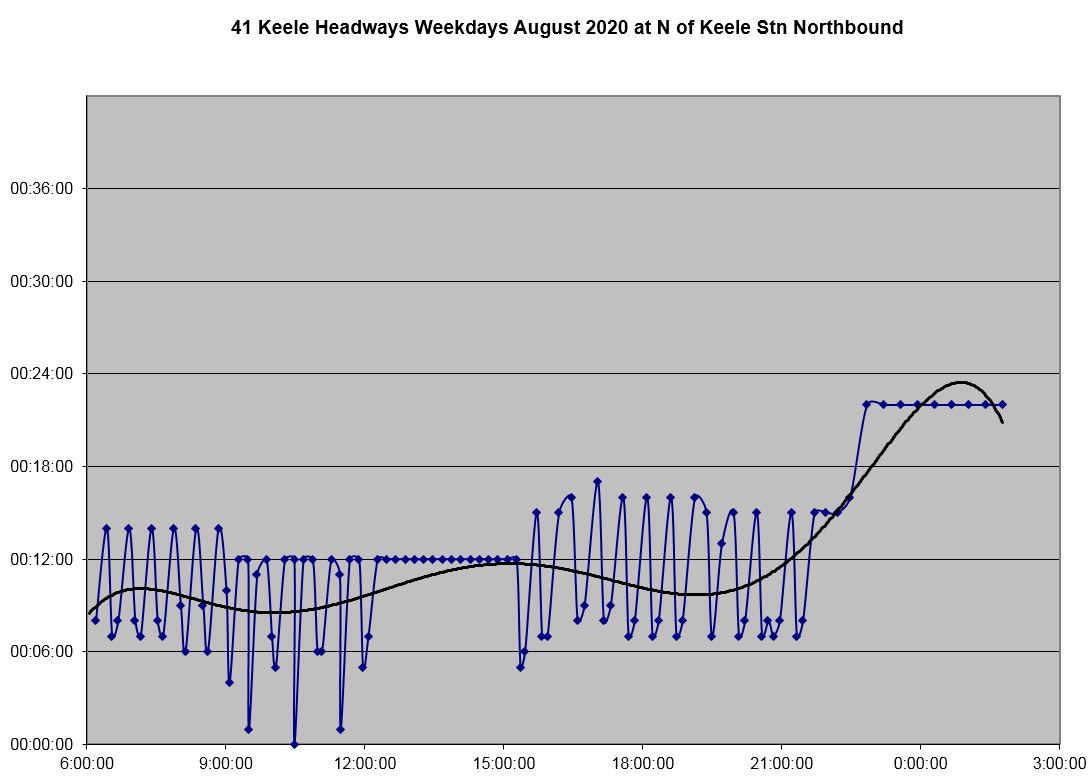
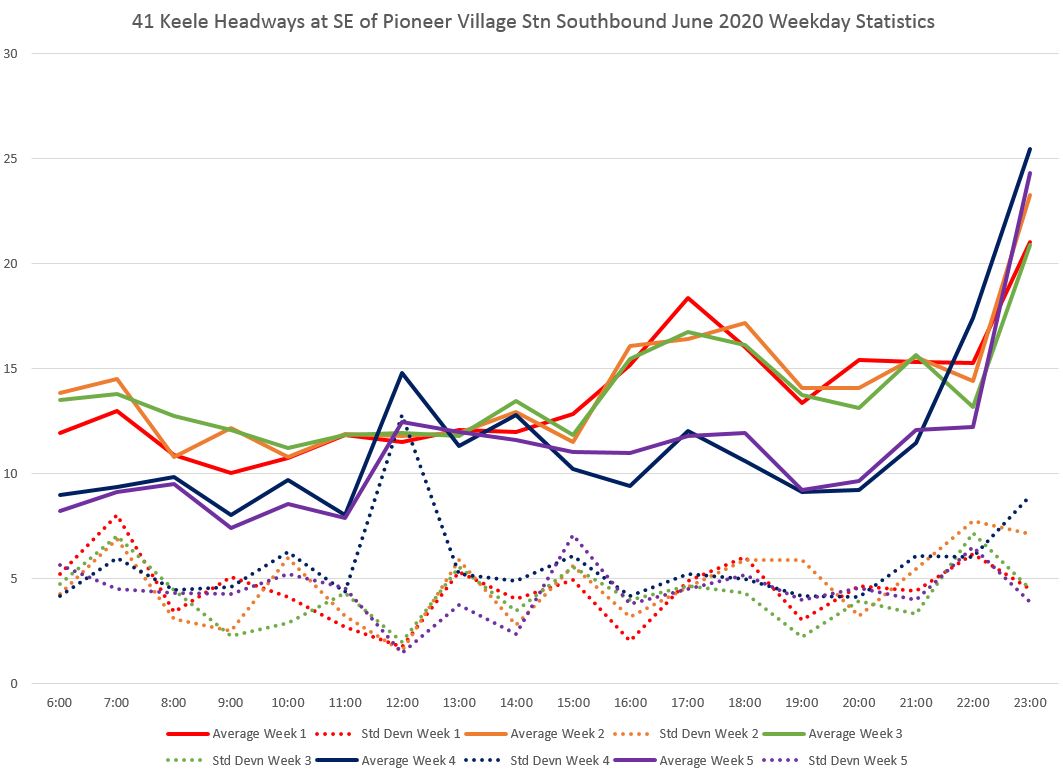
The average headways actually tracked show more frequent service in weeks 4 and 5 of June when the trippers were included in the schedule, and therefore were tracked. However, the standard deviation is high due to the large swing in headways.
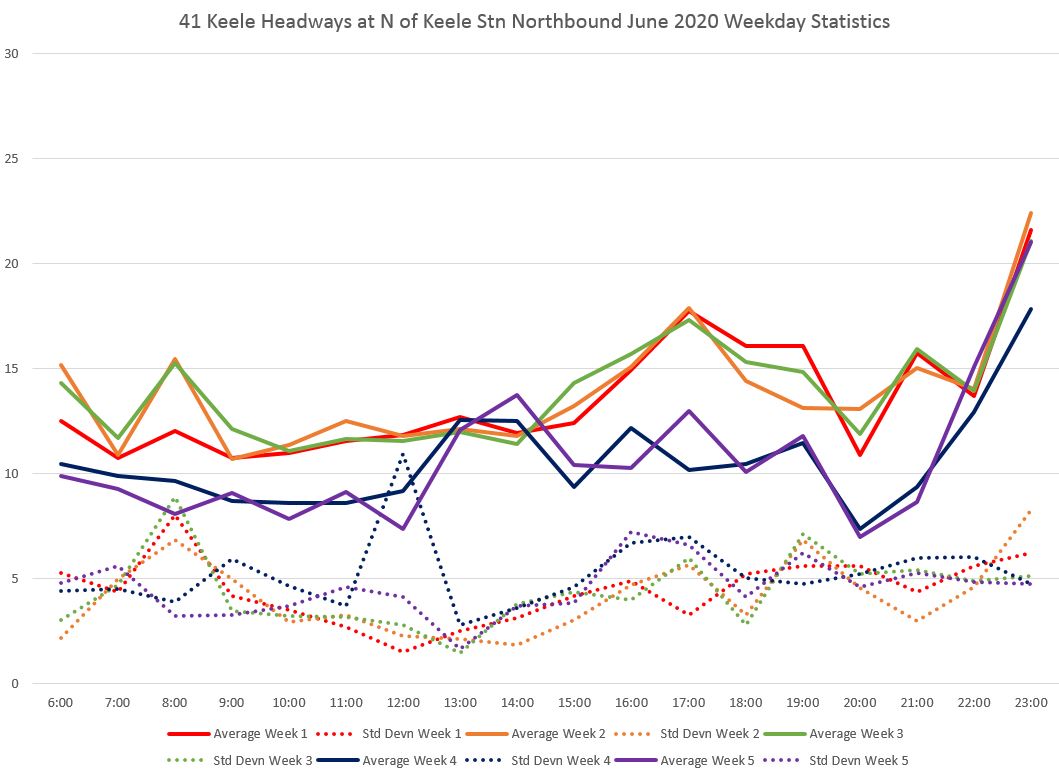
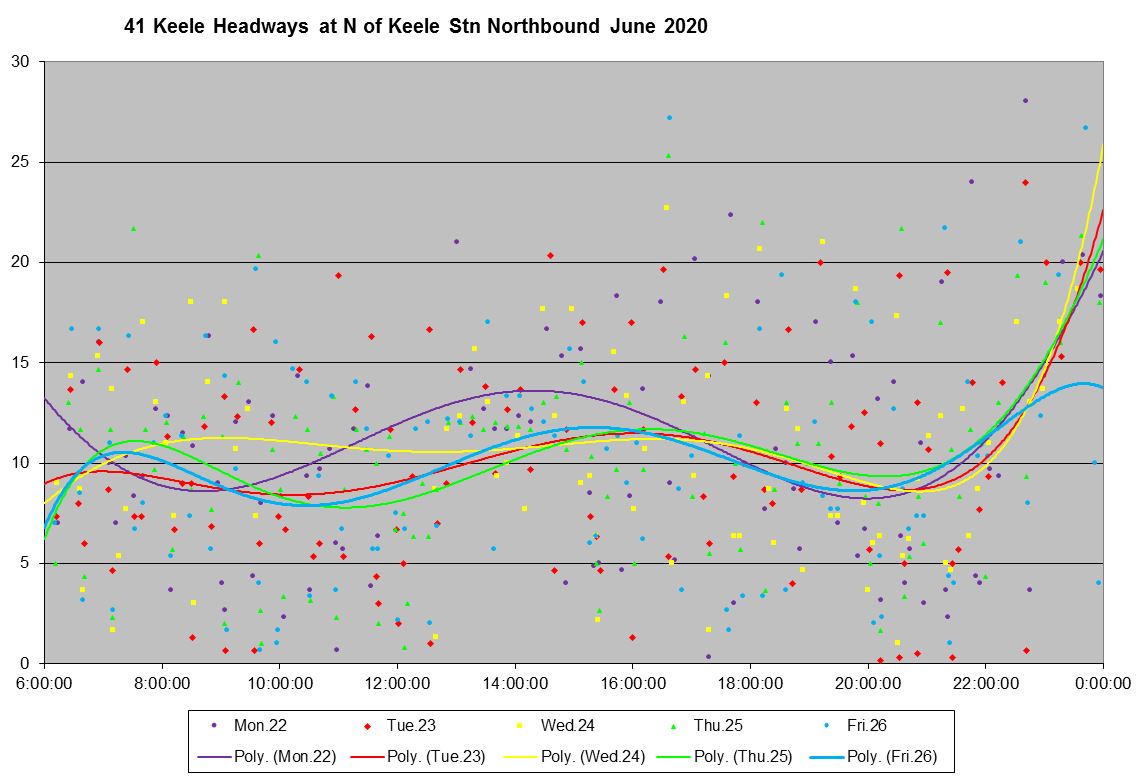
Week 4 of June shows that headways from Keele Station vary over a wide band from zero to about 20 minutes.
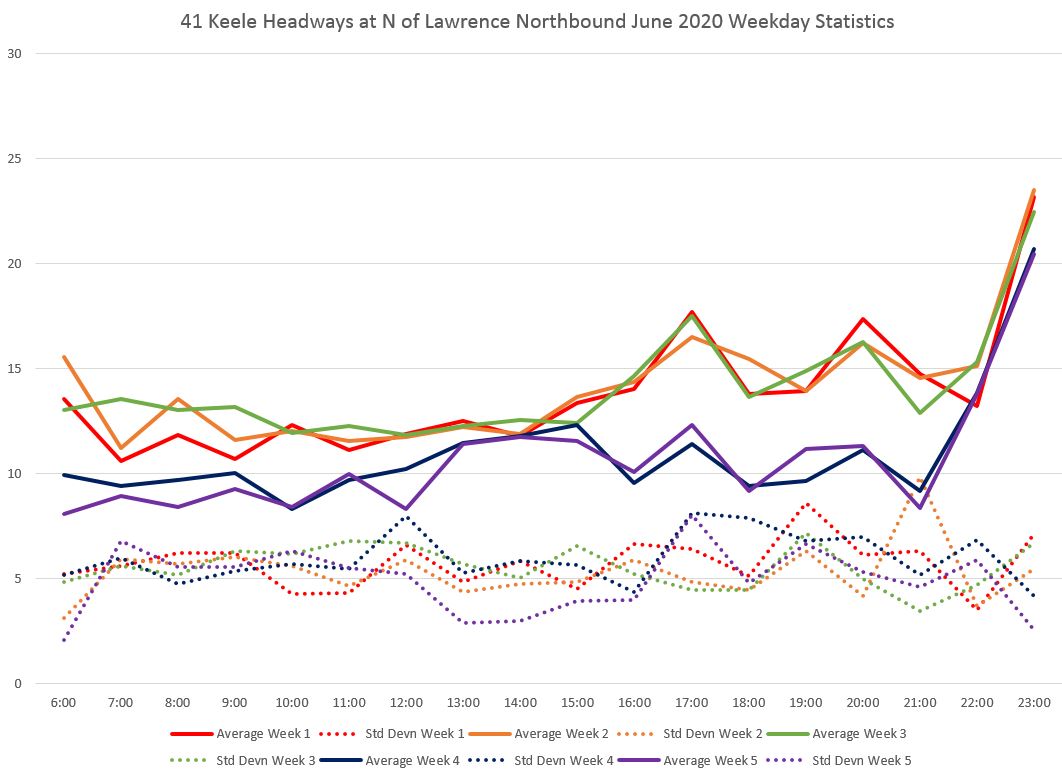
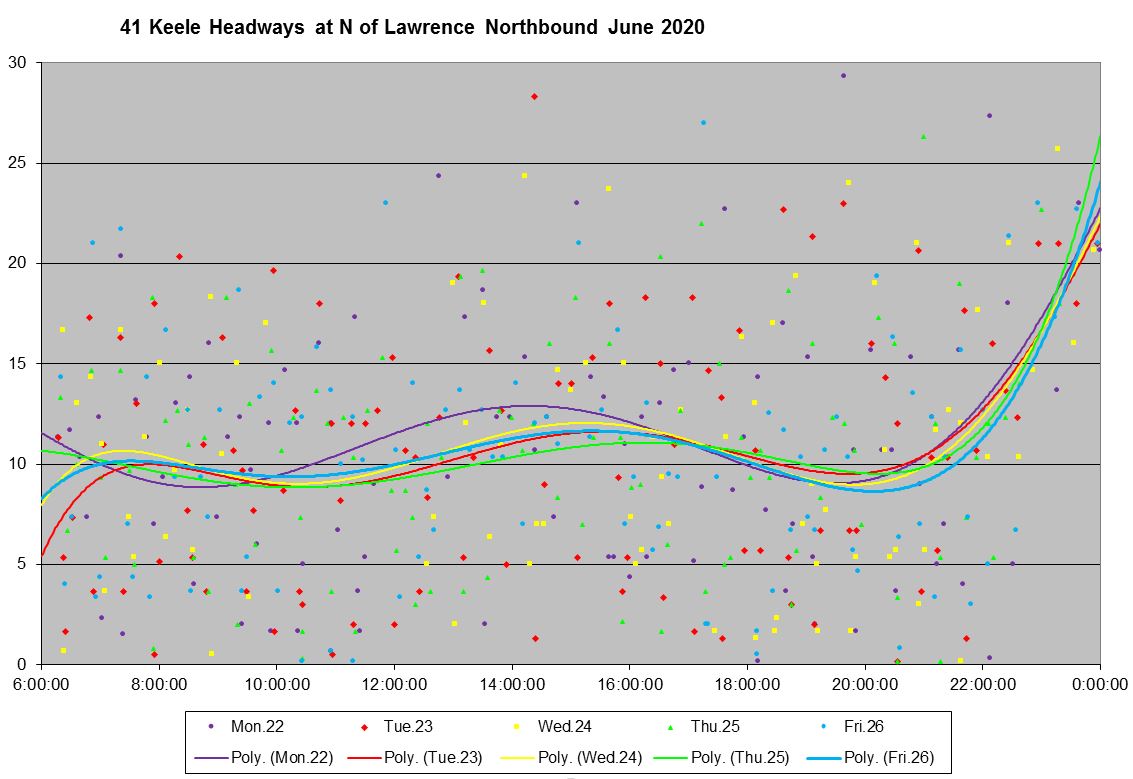
By the time the service reaches Lawrence, the SD value is higher and the scatter of headways is greater than at Bloor Street. Riders waiting for a bus face headways well over 15 minutes quite regularly. This does not make for even loading and most riders will see a crowded bus.
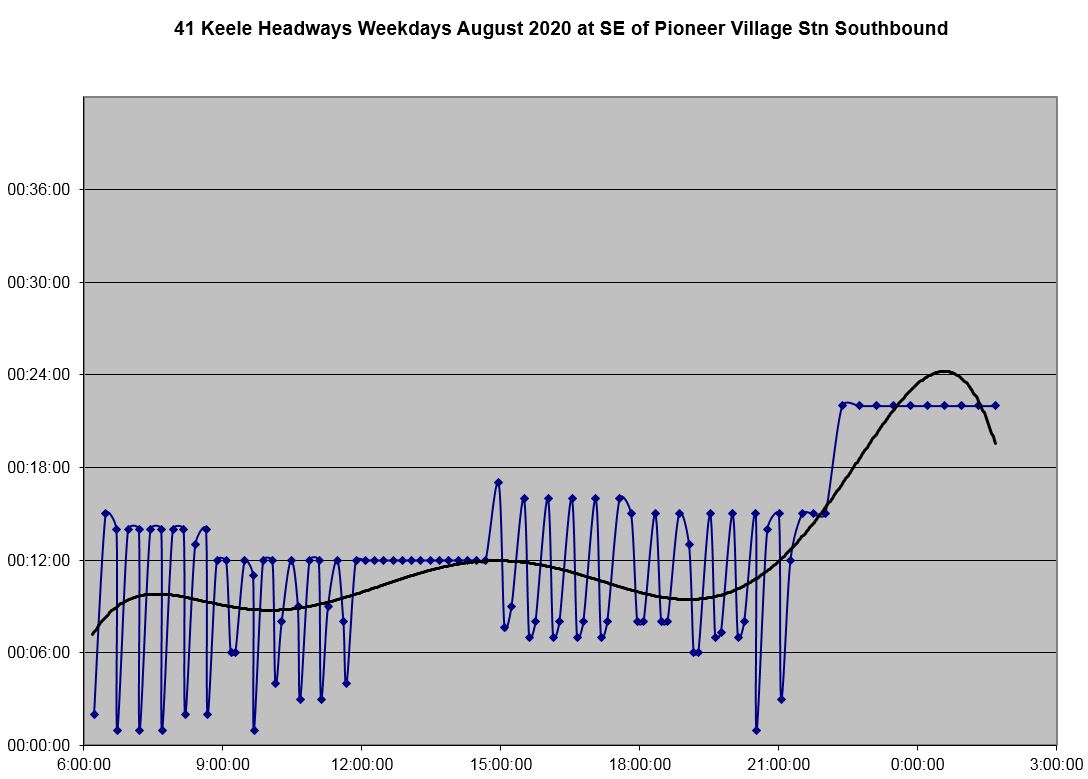
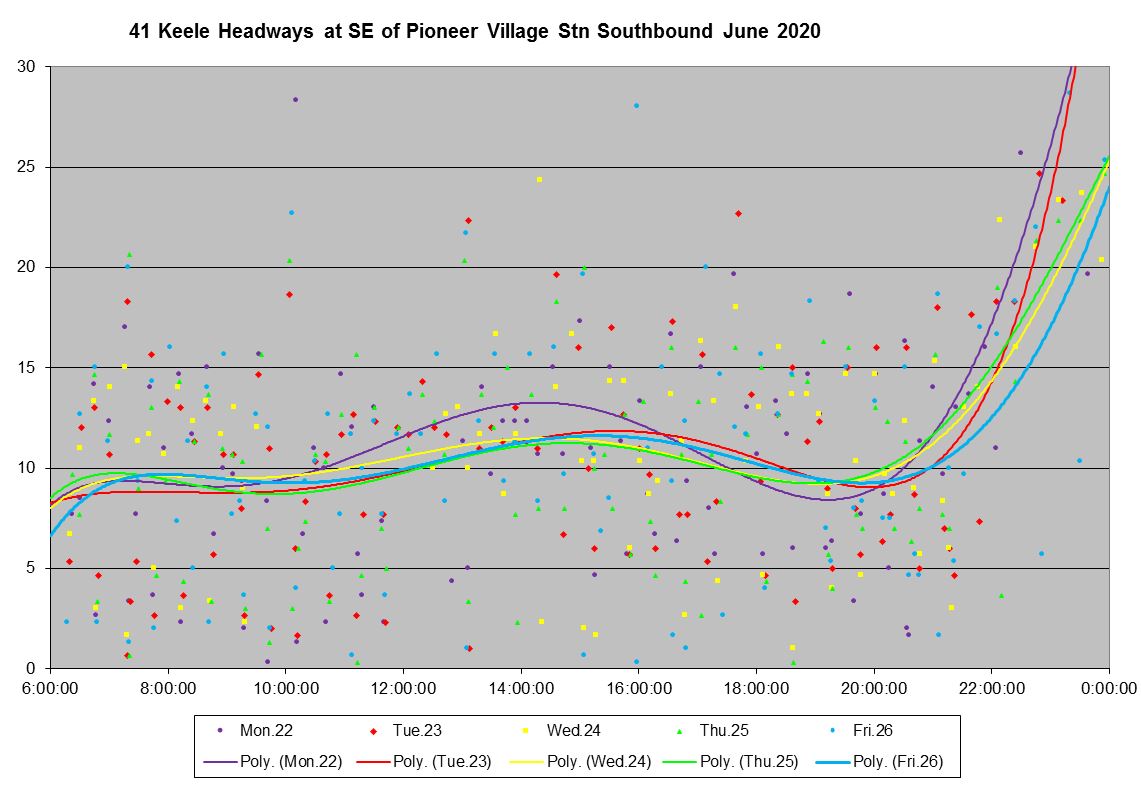
Leaving Pioneer Village Station, the SD value is already at or above 5 minutes thanks to the uneven schedule.
Headways from Pioneer Village Station lie in a range from zero to 20 minutes with some even higher. The Keele bus under normal circumstances had very erratic service, and the situation has not changed. If anyone is supposed to be managing vehicle spacing, there is little sign of it here.
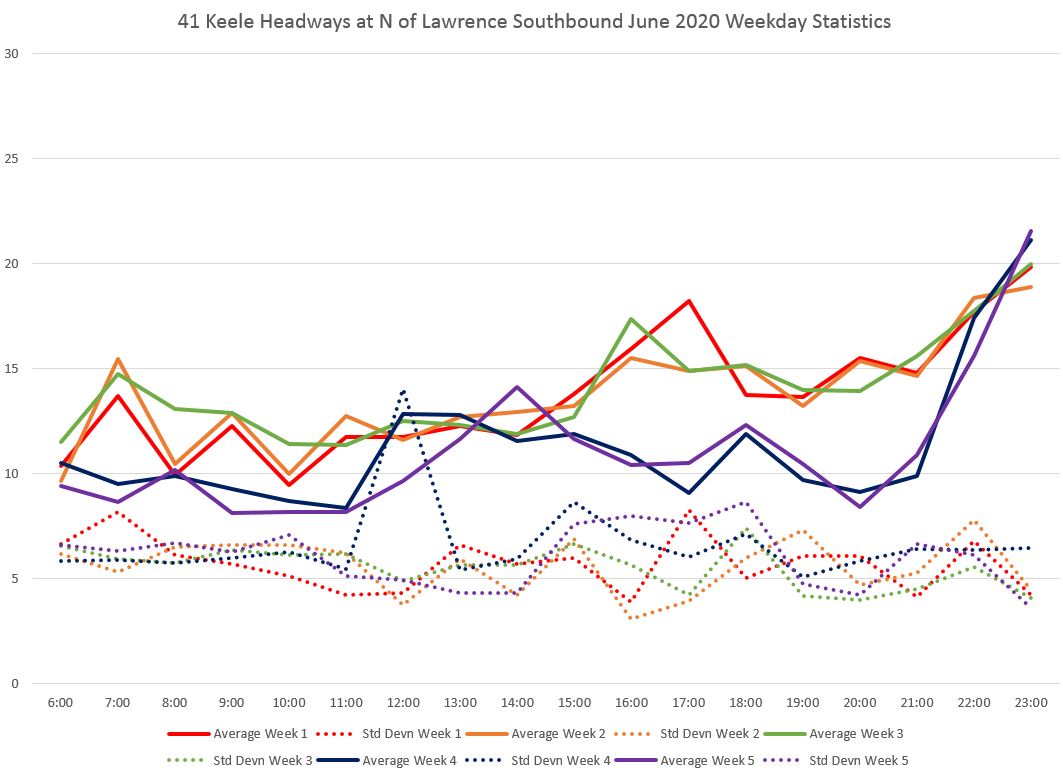
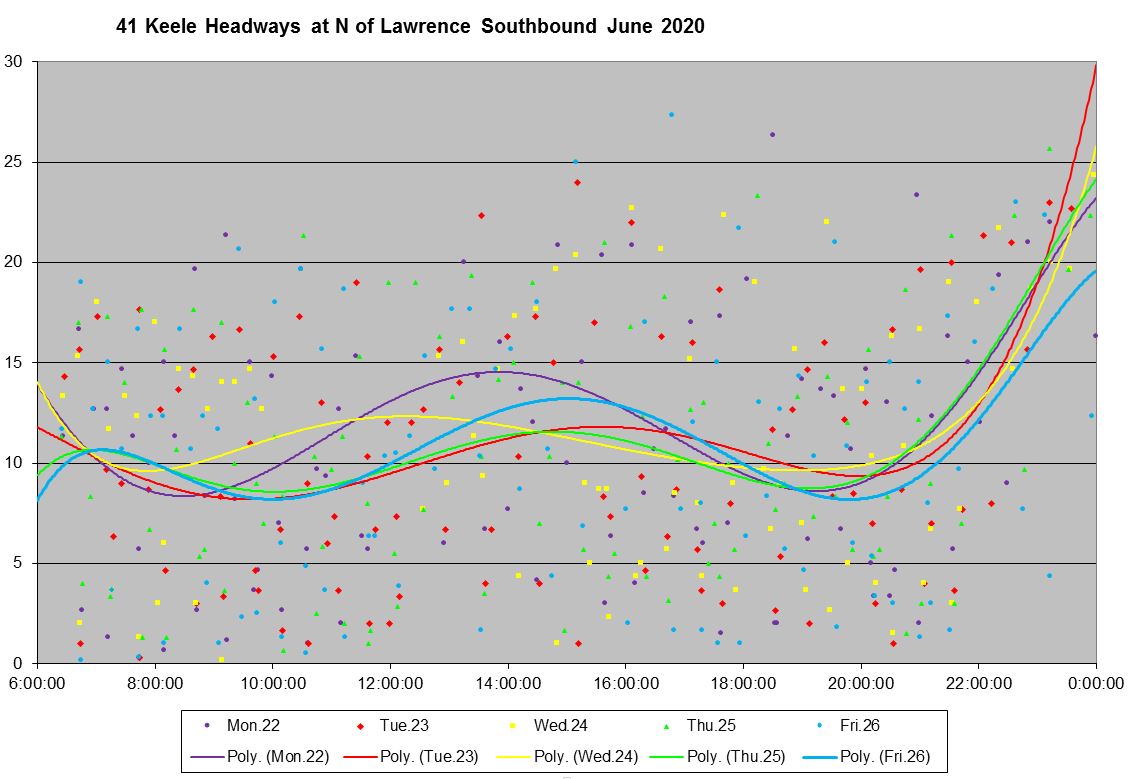
When the service reaches Lawrence Avenue southbound, the SD value is even higher than at Pioneer Village, and the headways span a range from zero to 25 minutes.
For the locations cited above, the full chart sets are linked below.
35 Jane
The Jane route operates between Jane Station and Pioneer Village Station with a peak-only split in the north end of the route via Hullmar. The express service operated in March supplemented the local service.
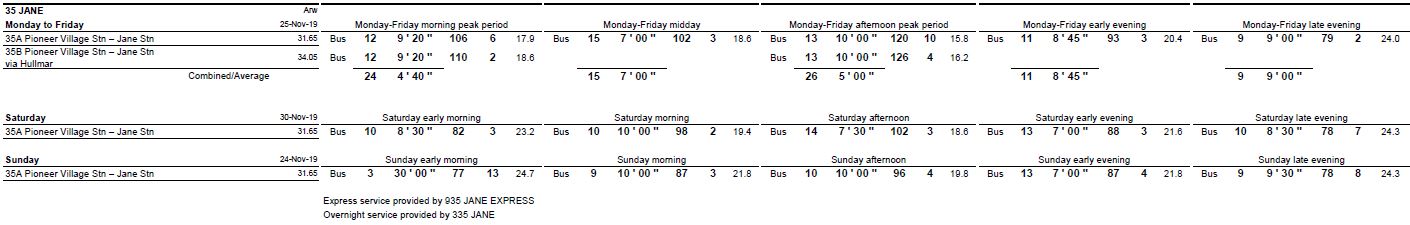

In June, there was no express service, but the local service was improved during some time periods, although not proportionately to the service that had been removed.
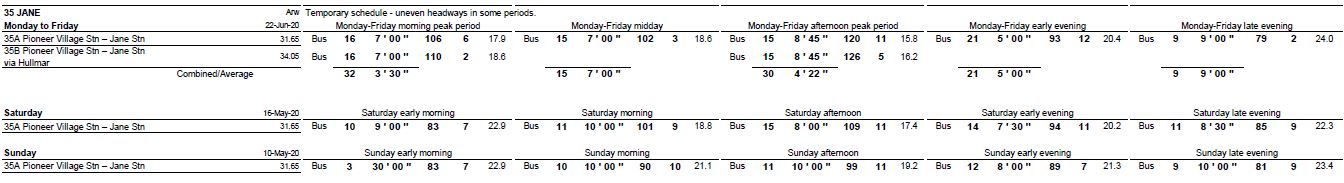
The effect of trippers on the Jane service is evident in the scheduled headways northbound at Jane Station. Until noon, and then from 3 to 10 PM, headways between zero-to-one and four-to six minutes. During the periods without trippers, the headway is consistent.
The scheduled service southbound from Pioneer Village Station is similar because there are no short-turns enroute.
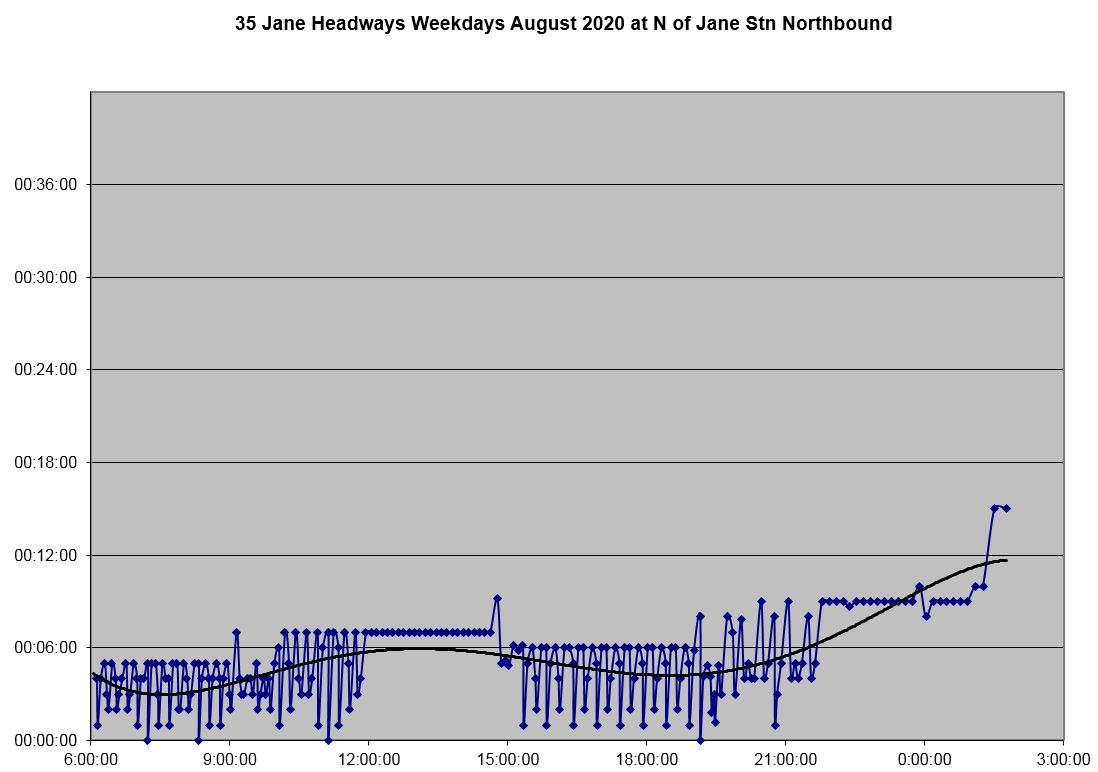
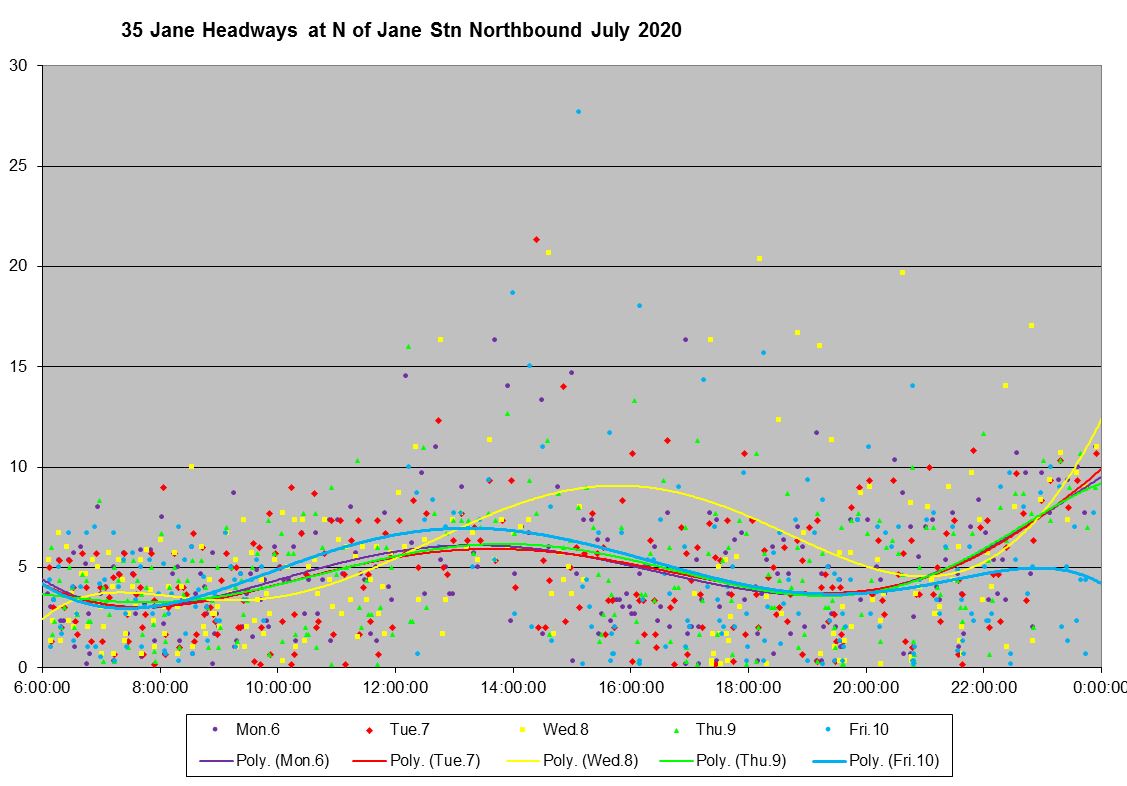
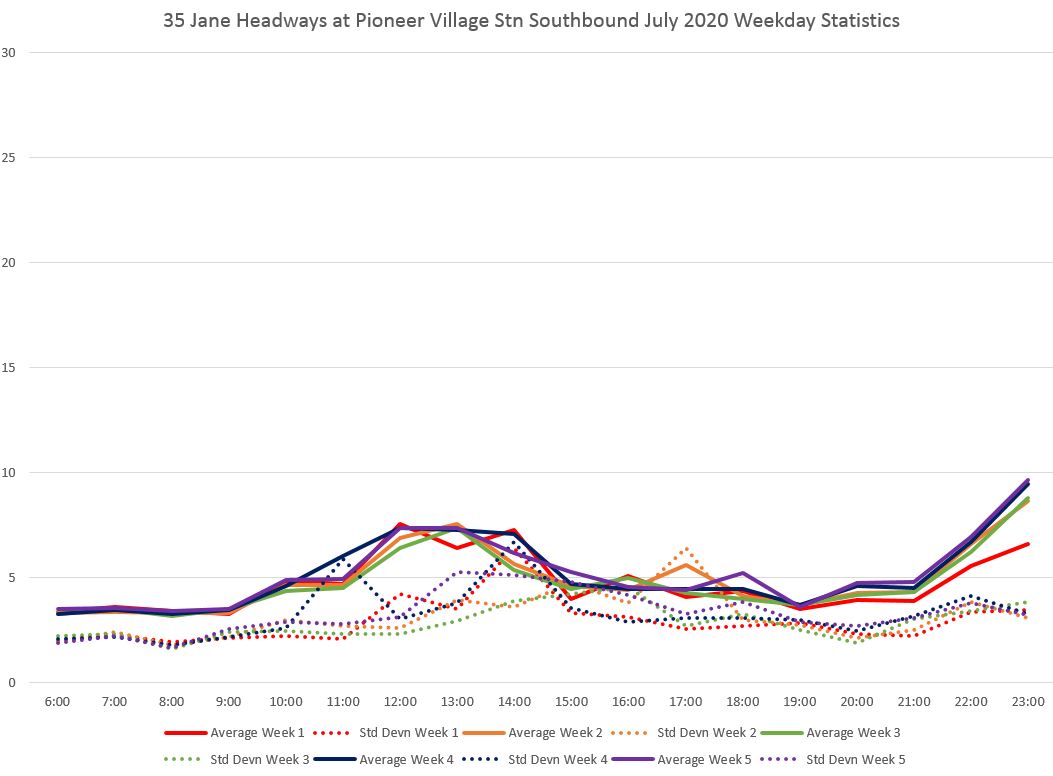
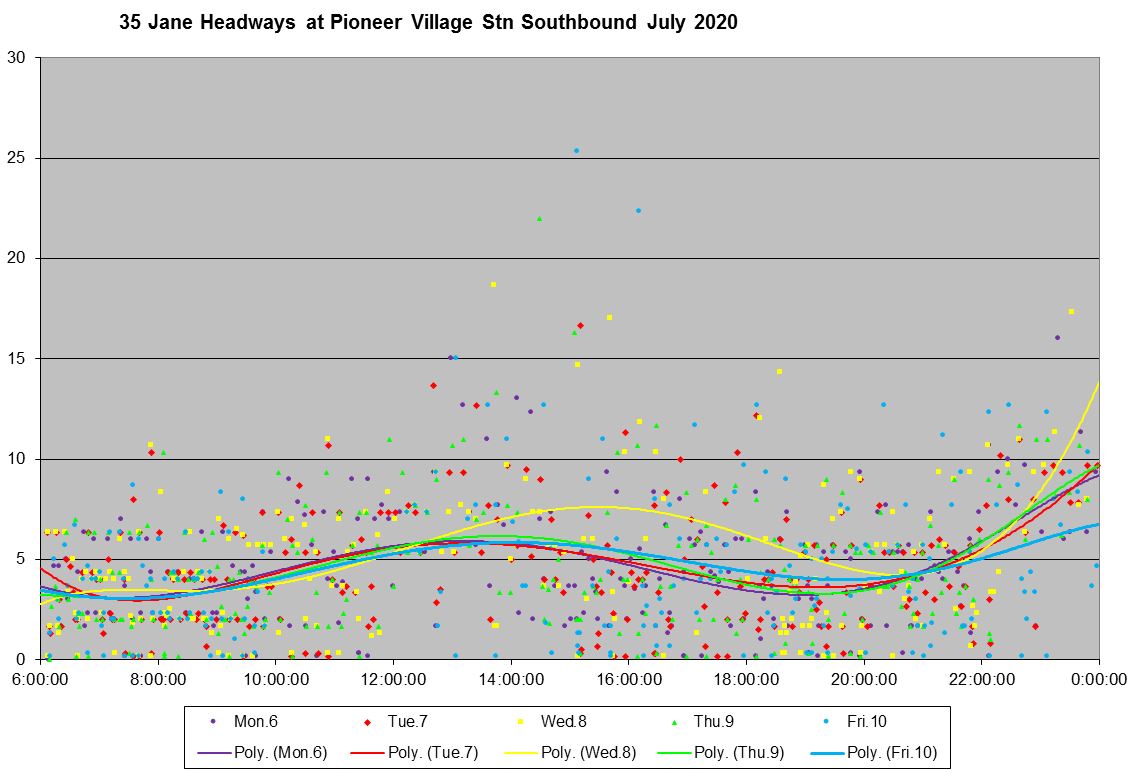
Leaving Jane Station northbound, the erratic scheduled service is reflected in the actual headways observed in late June when the trippers were part of the official schedule and, therefore, were tracked.
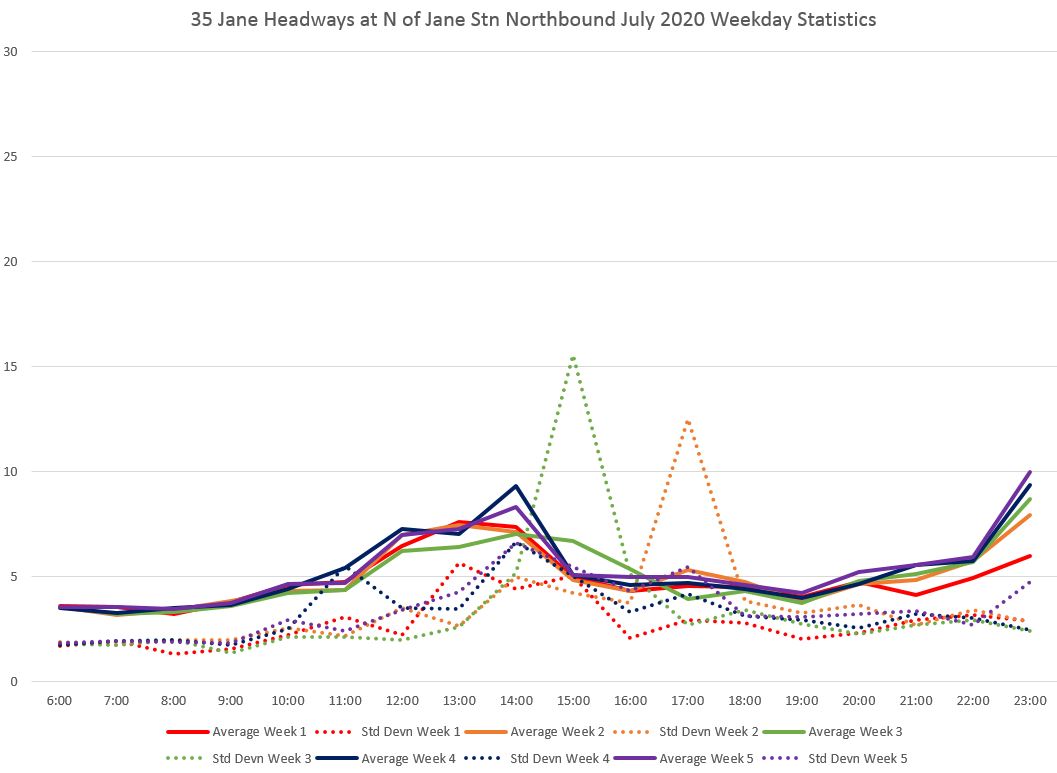
Actual headways stayed generally beow 10 minutes until the afternoon when the range opened up. Very short headways persisted through the afternoon and evening.
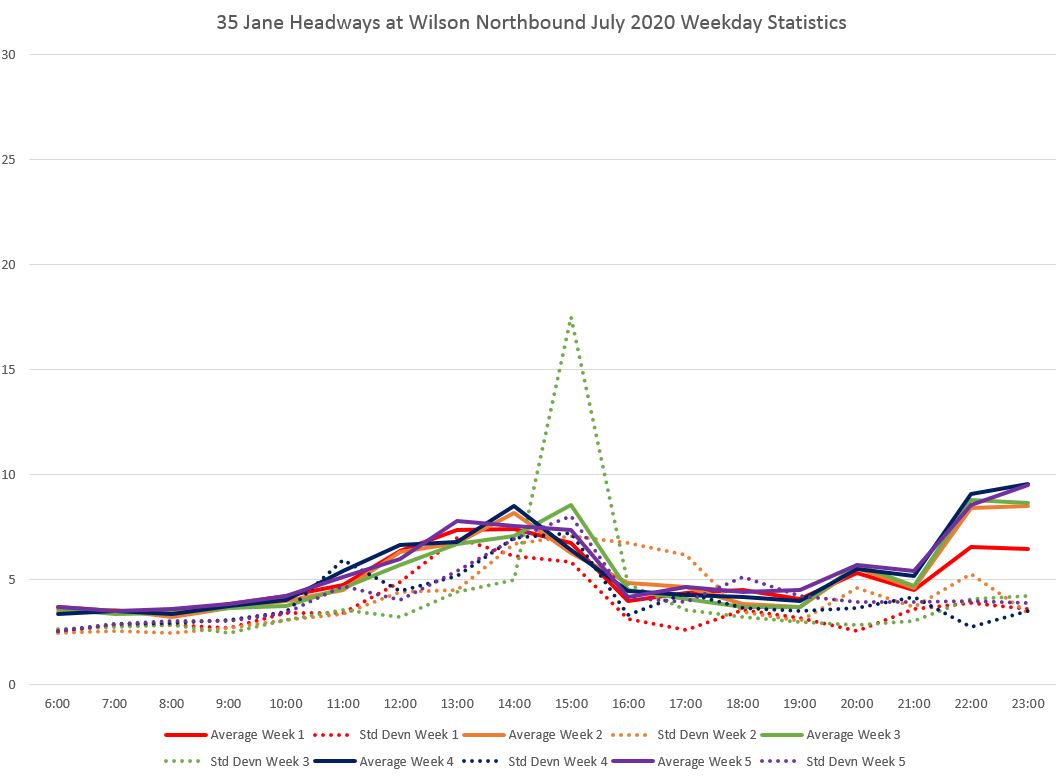
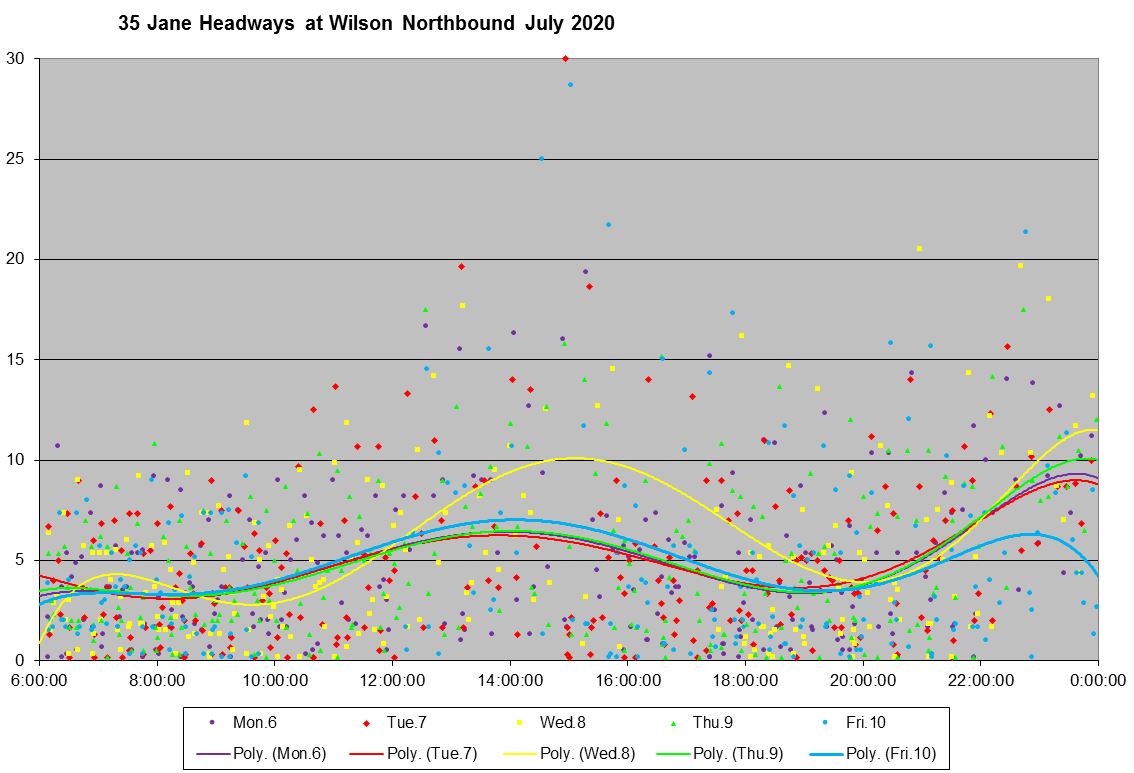
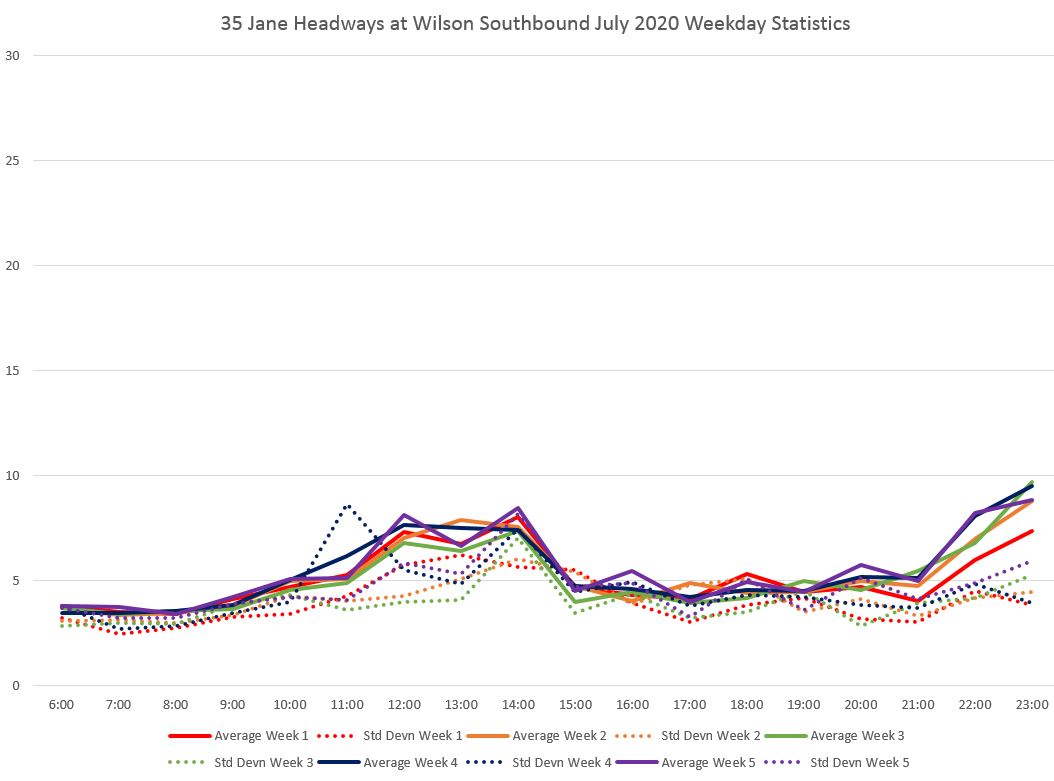
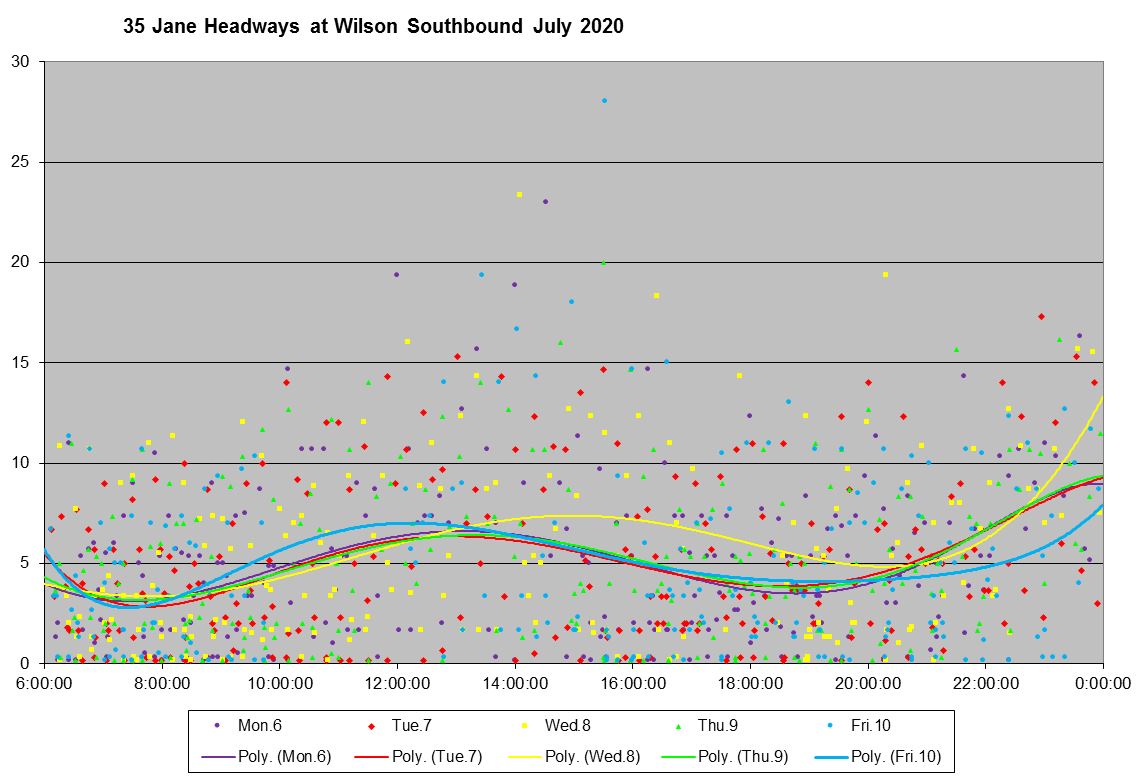
By the time the service reaches Wilson, the typical problem with uneven service shows up. The SD values have converged with the averages showing a large amount of bunching, and the actual headways are scattered over a wider range than at Jane Station.
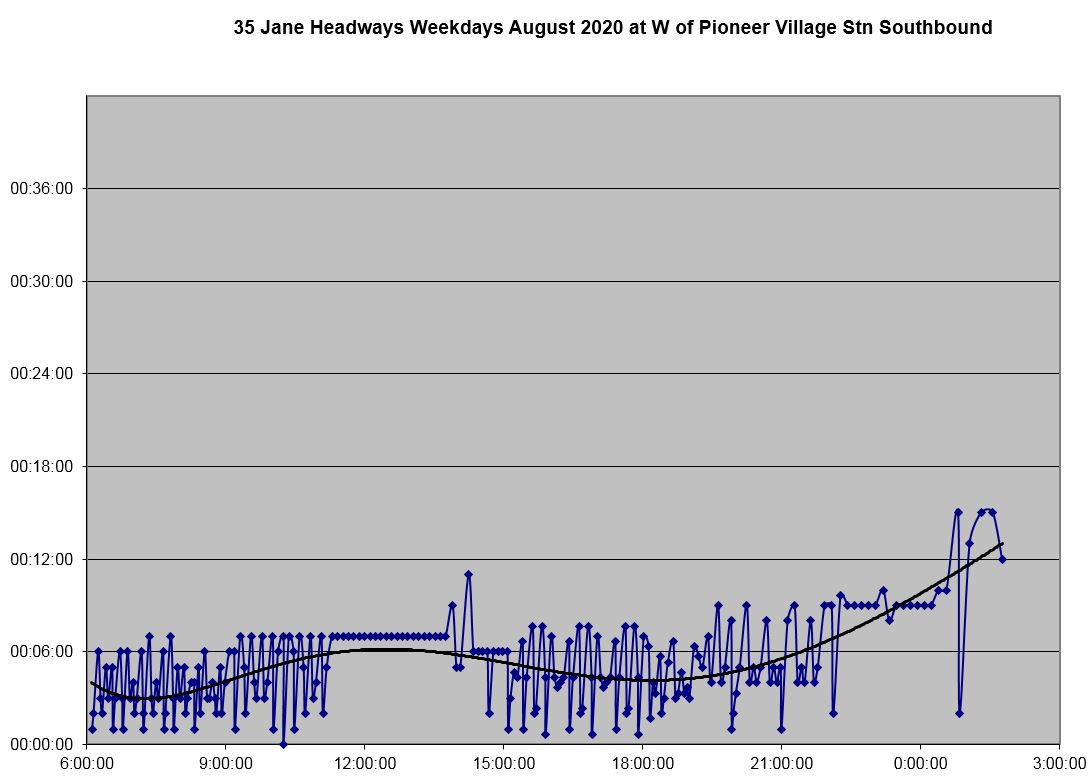
Southbound, the same patterns appear. At Pioneer Village Station, the headways are clustered below about six minutes, but this gets worse as the day goes on.
By the time the service is at Wilson Avenue, the SD values are close to the averages, there is more bunching and headways are spread over a wider range.
For the locations cited above, the full chart sets are linked below.

It seems like TTC is *institutionally* incapable of *conceiving* of headway-based operation, even though you have been advocating for it (on high-frequency routes during high-frequency times of day) for decades, and even though it is standard (on high-frequency routes during high-frequency times of day) on many other systems.
I wonder how to change the attitude?
Steve: I think that this is a compound problem. The first component comes from the TTC corporate tendency to treat any issue as “not our problem” and find some external explanation that excuses their own inaction. For years, “traffic congestion” was a catch-all explanation, and this is now compounded by “budgetary constraints”. Recently, there has been a focus on elimination of short turns. This is a noble goal, but the implementation pads schedules with running and recovery time that many trips do not actually require giving drivers a lot of flexibility, and removing the need for a lot of fine tuning of service.
There was some interest in headway based operation, and the new vehicle tracking system included the ability to show drivers their position relative to vehicles ahead of and behind them. However, operating to headways brings the need for a complete rethink of crews and work hours. The idea that a vehicle, and hence its driver, will always be at exactly the same place every day at the same time, including provision for crew changes and breaks, puts an emphasis on being “on time”. Labour relations were poisoned years ago on this issue to the point that the contract includes stiff penalties (double time) for a failure to get drivers off work on time.
The TTC only measures “on time” performance at terminals, and even this metric is fairly generous with a six minute window (+1 to -5 minutes of schedule) in the definition. Obviously, vehicles are not going to leave “on the dot”, but uneven service compounds as vehicles travel down the route. This is never measured to determine service quality where most riders actually use it, nor is there any regular reporting on bunching, gaps and crowding. Stats are typically reported on an all day, all route average which buries day-to-day, hour-to-hour problems. Any move to a more detailed measurement will inevitably make things “look worse”, and this is not in the organization’s interest.
A shift to headway-based operation requires a recognition that service must be managed, as well as definition of labour rules that balance evenness and reliability of service with a reasonable expectation by staff of their work hours. I doubt that even in “normal” times the TTC was prepared to address this type of challenge, let alone during an era when the future of transit is threatened by shifts in riding behaviour. The irony, and my great concern in writing all of these analyses, is that if budget cuts do force service cuts, problems will be magnified as the remaining service becomes even more unpredictable and unreliable than it is today.
LikeLike
In plain English, Steve’s work is showing that wait times between buses varies greatly. He picked a few intersections that proves what we are all feeling. When we see bunches of three buses, we know that means a longer wait because the buses are not spaced out. Those TTC supervisors with their notebook, ticking off buses as they enter the subway station are a waste of money. They are not fixing the spacing of buses.
If the number of passengers on the buses were combined with this data, we would see that delays happen at rush hour and affect the most people. The poor service is robbing time from a lot of passengers.
TTC management claim there is no problem because the TTC does not measure the spacing of buses, they do not see what the passengers are experiencing.
Steve’s hard work is chipping away at the problem. His computer skills have shown the TTC, that there are ways to measure spacing, using their own data. It is likely the blind senior management, who are preventing analysts and the TTC’s own IT department, from generating this information.
As much as Byford appeared progressive, Steve’s data is where the rubber meets the road, and I don’t think Byford’s proposals address the base issue.
The TTC has the data to manage bus spacing, it doesn’t have Senior Management’s will to do it.
Steve: At some point I hope to gain access to the Automatic Passenger Counter data so that I can combine this with headway information, but that’s a future project. Byford hired Leary to make the buses run on time, but that was a simplistic view of the problem.
LikeLike
With data that scattered, the trend lines don’t have much meaning. Yes, the average headway would be where the line is, but the individual values are all over the place. (Well, unless you’re a TTC manager, where the smoothed line looks like everything is running tickedy-boo.)
It would probably be more intuitive to have a coloured band, that say encompasses 60% of the observed headways. Or maybe one standard deviation on each side. Not sure if excel or whatever graphing package that’s being used could do this easily.
Steve: Yes, it’s excel, and there is a way to get it to graph bands. One reason I show two charts, one with average and SD, and another with the details and trend lines, is that each gives a different view, and in the latter case especially of the outliers.
Note that there are also bar-and-whisker charts in the full sets, and these achieve a similar goal showing how narrow or wide the quartiles are. I didn’t include them in the main articles because there is already a huge amount of things to look at there. I have added a general note and example about these to both Part I and Part II of the article to alert readers to their existence and explain what they show.
Over the years, these charts have evolved as various readers have suggested other ways to look at the data. Each format tells its own story, or maybe a separate chapter. The trick is to avoid the “unreliable narrator”, a chart that superficially looks reasonable, but hides or misrepresents too much sometimes without its designer being aware of the problem.
LikeLike
Have you heard anything regarding recall of laid-off staff yet?
Steve: No. Also, given that plans to resume full service depend on getting to 50% of normal riding, and we’re not there yet, I doubt we will see a recall much before year-end. Also, the adjusted budget for the rest of 2020 does not include a provision for return to 100% of former service levels. Then there is the challenge of what 2021 will look like. We might see a preliminary budget in late September, although I have a nagging sense that it will be rather vague.
LikeLike