In addition to the Queen West diversion I wrote about yesterday, the TTC has announced other changes affecting streetcar routes. These are hidden on the “Construction Notices” page which does not automatically link articles to the route schedule pages. Riders used to looking under “Service Changes” would not find these.
501 Queen Update
While the Queen cars are diverted to King for Hydro work in Parkdale, track repairs will occur on Queen at Brock and at Sorauren during the week of September 21 to 28.
Effective November 1, 501/301 Queen cars will divert both ways via Coxwell, Gerrard and Broadview for rail and water main reconstruction on Queen between Leslie and Vancouver (west end of Russell Carhouse, east of Greenwood).
512 St. Clair Update
The Metrolinx work on the rail bridge at Keele Street is complete, streetcar overhead restoration is in progress.
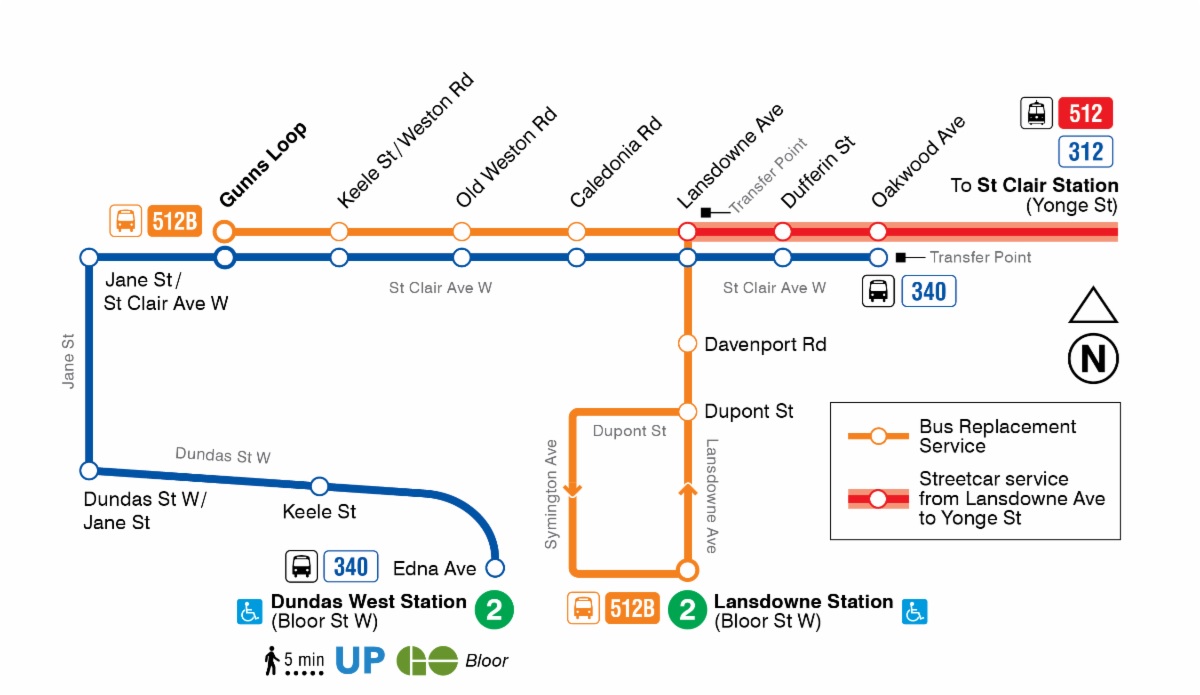
Track repairs on St. Clair between Bathurst and Vaughan will require a complete replacement of streetcar service for the period from September 28 to October 3.
From September 28, buses will operate on 512/312 St. Clair from Gunn’s Loop to St. Clair Station streetcar platform.
Streetcar service over the full route will resume on October 3.
The 512B shuttle from Gunn’s Loop to Lansdowne Station, and the extension of 340 Junction to Oakwood Loop will continue to October 31.
Two sets of route changes have been announced by the TTC to take effect on September 6, 2026.
This is a preliminary version of the September 6, 2026 changes. Full service change details will be published in a separate article when they are available.
Updated September 12, 2026: A map of the temporary extension of 72 Pape at the south end of the route has been added.
St. Clair West Rail Bridge Reconstruction
The rail bridge over St. Clair Avenue West between Keele Street and Old Weston Road will be rebuilt to accommodate the new St. Clair West GO station.
During this work, 512/312 St. Clair streetcars will turn back from Earlscourt Loop at Lansdowne, and a 512B shuttle bus will operate from Gunn’s Loop (west of Keele) east to Lansdowne and south to Lansdowne Station.
Night service on 340 Junction will be extended east to Oakwood Loop.
Partial Reopening of Pape Station Loop
Ontario Line construction at Pape Station has progressed to the point that a partial re-opening of the bus loop is possible. The following routes are affected:
100 Flemingdon Park will now terminate at Pape Station rather than at Broadview Station.
8 Broadview and 62 Mortimer will resume use of Broadview Station as their western terminus and they will no longer run south to Gerrard & Broadview.
72 Pape buses will loop through the station southbound, but will continue to load on the street outside the station northbound.
25/925 Don Mills and 87 Cosburn services will continue to operate to Broadview Station.
Updated September 12, 2026:
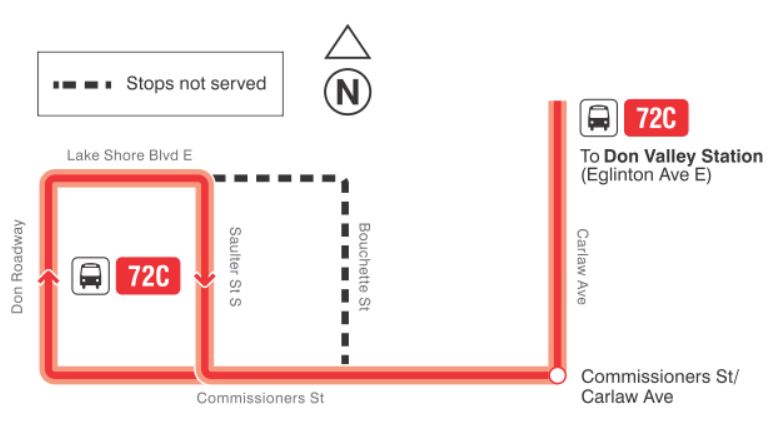
The 72 Pape route has been extended at the south end “to operate via Don Roadway, Lake Shore Blvd E, and Saulter St instead of Saulter St, Lake Shore Blvd E, and Bouchette St to provide an accessible connection to the 114 Queens Quay East”.
This article compares travel times for the 512 St. Clair streetcar for June 2026 and June 2019. It is part of a series setting out the changes in operating speed of streetcar routes since the introduction of the new Flexity streetcars in the past decade.
Three sets of charts here show the operational behaviour of the route from different points of view:
Comparisons of travel speeds over segments of the line show broadly how, when and where travel speeds have changed.
A fine-grained speed profile of the line compares 2019 and 2026 data showing specific locations of changes, and in particular that speed differences lie across the route.
Charts of dwell times show locations and times where streetcars are held for passenger service and traffic signals. Congestion generally does not play a role because almost all of the route is on reserved lanes.
“Double stops” at traffic signals before farside loading islands remain a problem with streetcars not always getting a clear run through intersections. This is often discussed in transit and social media circles, but more work is needed to get true transit priority for streetcars on 512 St. Clair.
St. Clair also has very high terminal recovery times compared to travel time along the route. It is not clear that this time is needed, or if it is a relic of an era when TTC made service run “on time” by padding schedules so that it would never be late.
I hoped to get through the system fairly quickly with a separate detailed article for each route. After a few of these it was obvious that there was too much detail and not enough overall analysis. Readers quickly let me know that something else was needed.
Hence a pause during which little has happened on this site beyond editing of comments. Behind the scenes I have pulled together the route-level articles, for which this intro provides an overview and general comments. Readers interested in specific routes can refer to the articles below:
505 Dundas is a special case because it was not operating with Flexitys prior to the retirement of the CLRV fleet, but ran with buses thanks to a shortage of working streetcars. In place of a 2026 vs 2020 comparison, the Dundas article looks at 2026 vs 2023 before transit priority changes were implemented in 2024 and 2025.
Through all of the route analyses there are several consistent observations:
Travel speeds in many locations and time periods are slower in 2026 than they were in 2019/20 with the same vehicles (new Flexity streetcars) operating on the system.
Slower operation occurs not just at intersections but along routes. Any program to speed up streetcars has to include the “in between” areas.
Transit signal priority is absent or ineffective at many locations including streets where there is no transit stop, but streetcars can be held anyway.
Farside stops often entail extra delay with streetcars held nearside before they can cross to and serve the stop.
This article includes a section on the methodology behind the charts, a brief review of proposals to improve streetcar operations published by Fast-Track.to, and comments on TTC special track maintenance (junctions) and technology.
In all the debates about streetcar operation and lack of speed, there is little by way of an overview of where the problem locations and times really are. There are discussions of track switching technology, signal priority (or the lack of it), whether stops are too close together, and operating practices such as standing slow orders at various locations. Much less so a line-by-line review to see where the worst problems lie, and where the greatest opportunities for improvement might be found.
Some advocates claim that an improvement of as much as 40% might be achieved in streetcar speeds, although this has too often been misinterpreted as an absolute number, not a best case target. It is worth noting that some routes, segments and times of day already achieve much higher average speeds. The question then is what prevents this from being standard operation across the system.
This post uses vehicle tracking data to plot average vehicle speed, by hour, over segments of each streetcar route for June 1-5, 2026. This interval was chosen because it was just before the onset of special services and conditions related to the World Cup, but during the moratorium of works and diversions that could have distorted the data.
In Part II, I will take a deeper dive into specific problem areas on some lines, and look at comparative data from pre-covid times.
In response to the “Toronto has the world’s slowest streetcars” meme floating around on line and among some transit advocates, various proposals were floated to speed up our system.
One of these is the idea that there are too many streetcar stops, and if only cars didn’t pause so often for passengers, we could have faster streetcar service. The TTC’s euphemism for this is “stop balancing”.
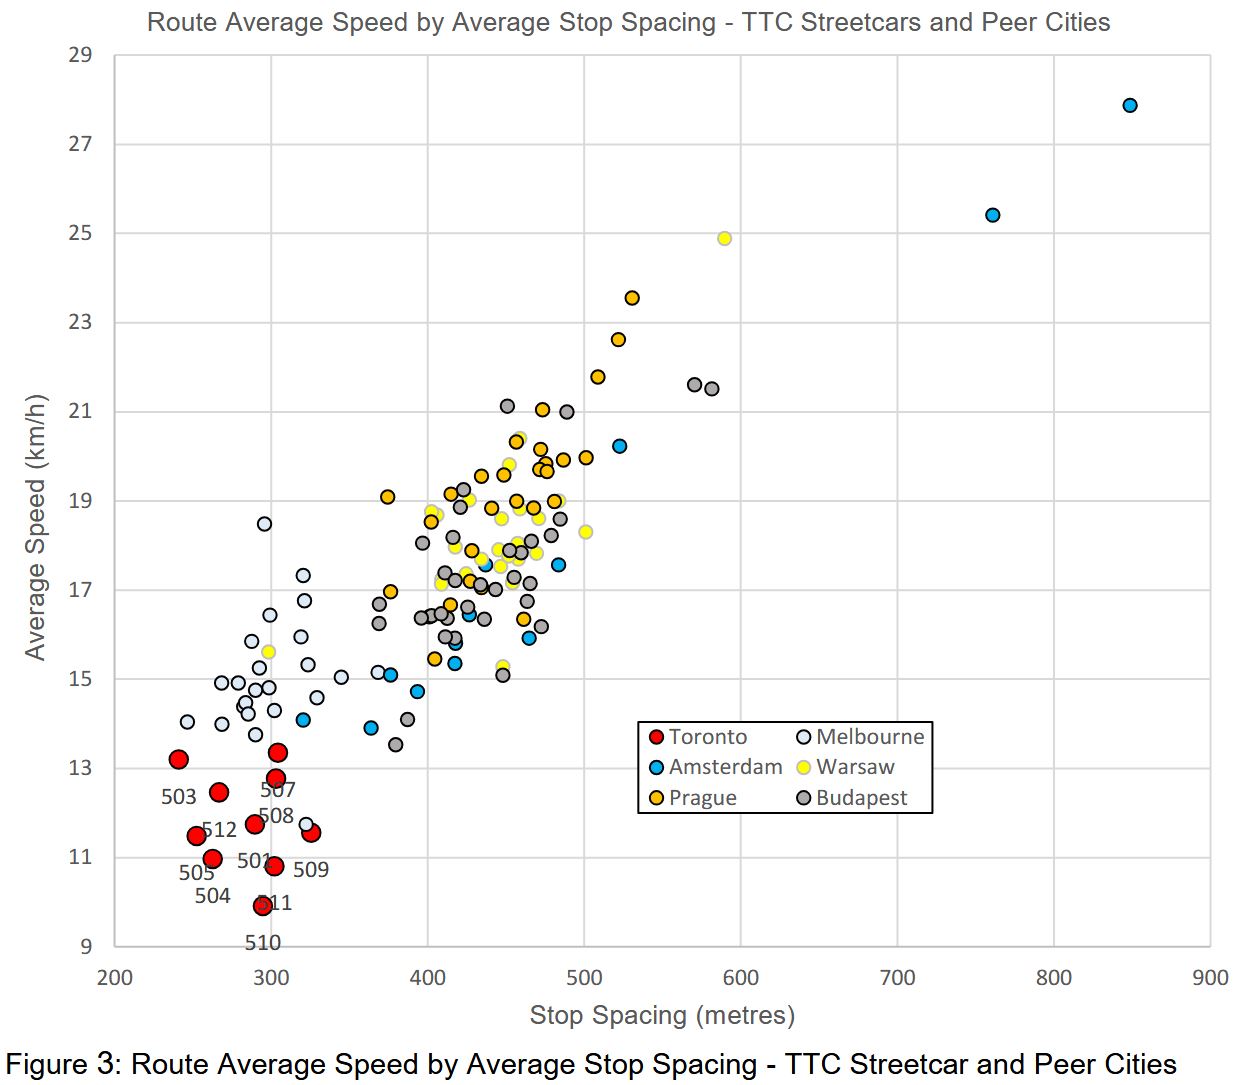
A chart accompanying the TTC report shows the speed and stop spacing values for several transit systems. Toronto is down in the left bottom corner with the closes stops and the slowest speed. However, Melbourne’s trams are in the same range as Toronto for stop spacing, but they operate faster. Nowhere does the TTC examine what differences might apply to Melbourne lines, nor for the other systems that are both faster and with wider stop spacing.
Although there are some outliers, the bulk of the data points are in the 400-500m range, but this does not examine route characteristics. The original study of slow Melbourne streetcars by Dr. Jan Scheurer commented about Toronto that “CBD-typical speeds seem to extend across the entire city” [p. 8]. Riders who sit in traffic jams on King or Queen Street West, or on Queen Street in the Beach are quite familiar with this problem. Toronto streetcars do not emerge from the core to fly into nearby suburbs.
There is also the issue that Toronto streetcars used to move faster both with the CLRV fleet and the PCCs that preceded them. Something beyond stop spacing is at work even on routes with dedicates rights-of-way. It is easy to go after stops as a source of delay because this would not require an examination of TTC operating practices and the City’s lack of aggressive transit signal priority. Indeed, during the last round of major works on St. Clair, it was discovered that TSP was not actually working in many locations.
Source: TTC
For the sake of argument, assume that the delays to TTC streetcars come from closely spaced stops. Any rider knows that there are other factors including slow operation through junctions, traffic signals that do not give streetcars priority and congestion both in the core and the outer parts of many routes.
The premise is that fewer stops will speed service benefiting those already on streetcars at the expense of those who have to walk further to a stop. This is a bogus argument regardless of stop spacing. There will almost always be more riders passing any individual stop who would “benefit” from its elimination than riders who use the stop. The same argument could be made for some subway stations.
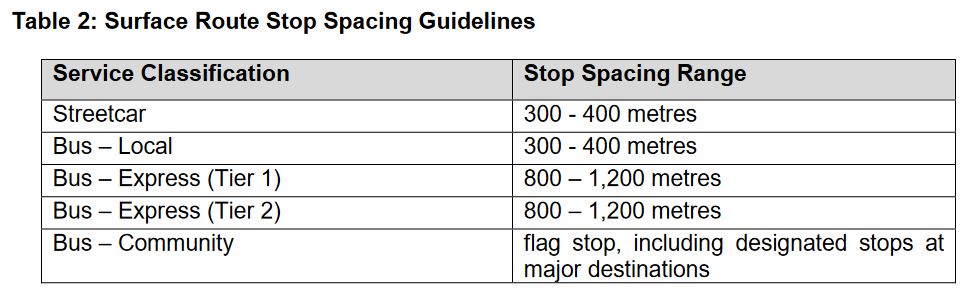
Here are the TTC’s Board-approved stop spacing standards. The target range of 300-400m for local surface routes implies an average stop spacing of 350m giving some leeway to adjust to conditions.
(To give readers a sense of distance, a subway station platform is about 150m long, and so a 300m walk is from one end of a station platform to the other and return.)
Streetcar route averages lie roughly in the 250m-325m range below the standard’s midpoint of 350m. Some stop trimming has already occurred to eliminate very closely spaced stops.
Note that 508 Lake Shore shows the same average as 507 Long Branch even though the 508 travels into the core. The reason is that the stop spacing between Humber Loop and Roncesvalles is quite wide, and this offsets the closer spacing on King Street in the average.
Route
Termini
Stop Spacing (m)
501 Queen
Neville-Roncesvalles (*)
241
Roncesvalles-Humber
448
503 Kingston Road
Victoria Park-York
284
504 King
Dundas West Stn-Distillery (*)
283
Dufferin Loop-Broadview Stn (*)
280
505 Dundas
Dundas West Stn-Broadview Stn (*)
278
506 Carlton
High Park-Main Station (*)
260
507 Long Branch
Long Branch Loop-Humber Loop
312
508 Lake Shore
Long Branch Loop-Distillery
306
509 Harbourfront
Exhibition-Union Station
373
510 Spadina
Spadina Station-Queens Quay
293
511 Bathurst
Bathurst Station-Exhibition Loop
328
512 St. Clair
Gunns Loop-St. Clair Station
270
Source: Calculated from TTC GTFS Schedule Data
Notes:
501 Queen stop data are taken from the pre-Ontario Line construction with service running directly across Queen from Church to York.
Stops near Dundas West and Broadview Stations that are used primarily by overnight services have not been included in the stop counts for 504 King and 505 Dundas.
506 Carlton stop data are taken from the through route before construction diversion around Bay & College.
Some Basic Math
If one wants to achieve a major saving from stop time, many stops have to be cut on a route. One or two will annoy their regular users, but the change in travel time, if any, will be quite small and disappear into the background noise of other variations.
The basic calculation is simple: if a route now has an average spacing of 300m, and you want to raise this to 400m, then one quarter of the stops must vanish. The bigger the change in stop spacing, the more stops must be eliminated.
The numbers of stops for various spacings per 1km are shown below:
250m: 4.0
300m: 3.3
350m: 2.9
400m: 2.5
450m: 2.2
500m: 2.0
With the TTC standard of 300-400m, 350m falls half way along, or 2.9 stops/km. Just to bring routes now at a 250m spacing (4.0/km) to that level would require a reduction of about 1.1 stop/km, or about 12 stops each way on a route the length of 505 Dundas (11km).
If the goal is to move to a 400-500m standard, this means the new target average would be 450m. A route whose average is now 250m would lose almost half its stops. This would be extremely difficult as routes do not have that many “unimportant” closely-space stops to begin with.
The effect would not be on a few riders at a few minor stops, but on many riders all along the routes. They would face extra walking distance lengthening overall travel times, not to mention accessibility issues for those with mobility challenges.
A simple, but important, number is not the space between adjacent stops, but the space that would result if any stop were removed. (In other words, the space between stop N and stop N±2.) In some cases, the existing TTC standard would still be met, but in many the gap between stops would be well outside the standard. For example, if three stops are each 300m apart, getting rid of the middle one creates a 600m gap, well above the standard.
Stops cannot simply be re-spaced to maintain uniformity or iron out problems with stop elimination. For pedestrian safety, stops are almost always at signaled intersections or at least at pedestrian crosswalks so that riders can cross safely to/from stops on the opposite side of the street. The existing street layout, signal patterns and major destinations such as transfer points determine where stops might go. Toronto, unlike Manhattan, does not have a repeating grid as a base for designing standards.
In the sections that follow, I will turn to a few sample routes. There are occasional closely-spaced stops, some with good reason, but not many are ripe for plucking without adopting a considerable increase in the standard and substantial cut to the number of stops. This should be a conscious policy debate, not a change buried in a wider review of Service Standards without a clear indication of the effects on routes across the city.
Readers with long memories might recall the early days of plans for a new streetcar order including discussions about how large a vehicle should be purchased. A major concern at the time was the possibility that the TTC would change schedules and run less frequent service with the larger cars just as they had when the articulated version of the CLRV (the previous generation of cars) arrived in the late 1980s.
That concern was softened by a TTC claim that service would actually improve. Peak periods would see slightly less frequent service, but a net increase in capacity, while off-peak periods would see little change in frequency effectively doubling the capacity of service. At the time, crowding was a big issue and this persisted right up to the pandemic in 2020, by which time all of the old cars had been retired. The management proposal was approved in July 2013.
As the CLRV/ALRV fleet aged, there were problems with reliability of older cars and the need to operate buses on some lines thanks to a shortage of working vehicles. Some repairs were done at considerable cost, but these were more cosmetic than a true life extension.
Moving forward to 2026, there has been a lot of talk of restoring pre-pandemic service levels. TTC fudges the numbers on this in many cases citing vehicle hours operated, not actual service frequencies which have been degraded by longer travel times.
(For example, if a round trip, including terminal layovers, takes two hours or 120 minutes, then 20 cars will provide a 6-minute service. If the round trip gets longer but no cars are added, the service is less frequent, but the number of vehicle hours stays the same. From a rider’s point of view, service is worse, but from a budget outlook, there is no change. This is at the heart of the discrepancy between TTC service claims and rider experience.)
After years of changing service levels and demand, the TTC’s Five Year Plan foresees a return to six minute headways, at most, as a new standard for daytime service. This has been rolled out on some routes over the past year, but not all.
Already at 6 minutes or better: 504 King, 510 Spadina
Improved to 6 minutes: 512 St. Clair (Sept/25), 511 Bathurst (Nov/25), 505 Dundas (Nov/25)
Pending, but with no committed date: 501 Queen, 503 Kingston Road, 506 Carlton, 507 Long Branch.
The Five Year Plan (at p. 4) includes provision for extra spending in 2027 and 2028, but this is not tied to specific routes. There is nothing in the Plan for 2026.
A related issue is the size of the streetcar fleet. Leading up to 2020, the issue was how many cars were actually available, and some service cuts flowed directly from this. With the recent delivery of 60 additional cars, fleet availability should not be an issue although service can still be limited by a lack of operators. The TTC currently schedules 163 cars at peak out of a fleet of 264. If services now operating with buses due to construction were also using streetcars (503 Kingston Road and the Broadview branch of 504 King), the peak requirement would rise to 178. Allowing for maintenance spares this would drive the total requirement to 214 leaving 42 surplus for service improvements (allowing for 8 spares).
February 2026 Schedule PM Peak
Full Streetcar Service
Possible Service
Peak Requirement
163
178
220
Spares at 20%
33
36
44
Total Requirement
196
214
264
Fleet
264
264
264
Surplus
68
50
0
The problem, of course, is that the TTC barely has budget headroom to operate existing services let alone increases.
In theory, some of the surplus cars will eventually operate the Waterfront East LRT extension, but that service is at least 8 years away even assuming Toronto finds the money to build it. In any event this will not require anywhere near all of the current surplus fleet. Another issue is that the “streetcar network” has not operated with 100% streetcar service for a few decades thanks to various construction projects and vehicle shortages.
There are parallel issues with the bus network, but they are complicated by issues of vehicle reliability and the need for a spare pool to cover the unreliable LRT service primarily on Line 6 Finch West. I will turn to the bus fleet in a separate article.
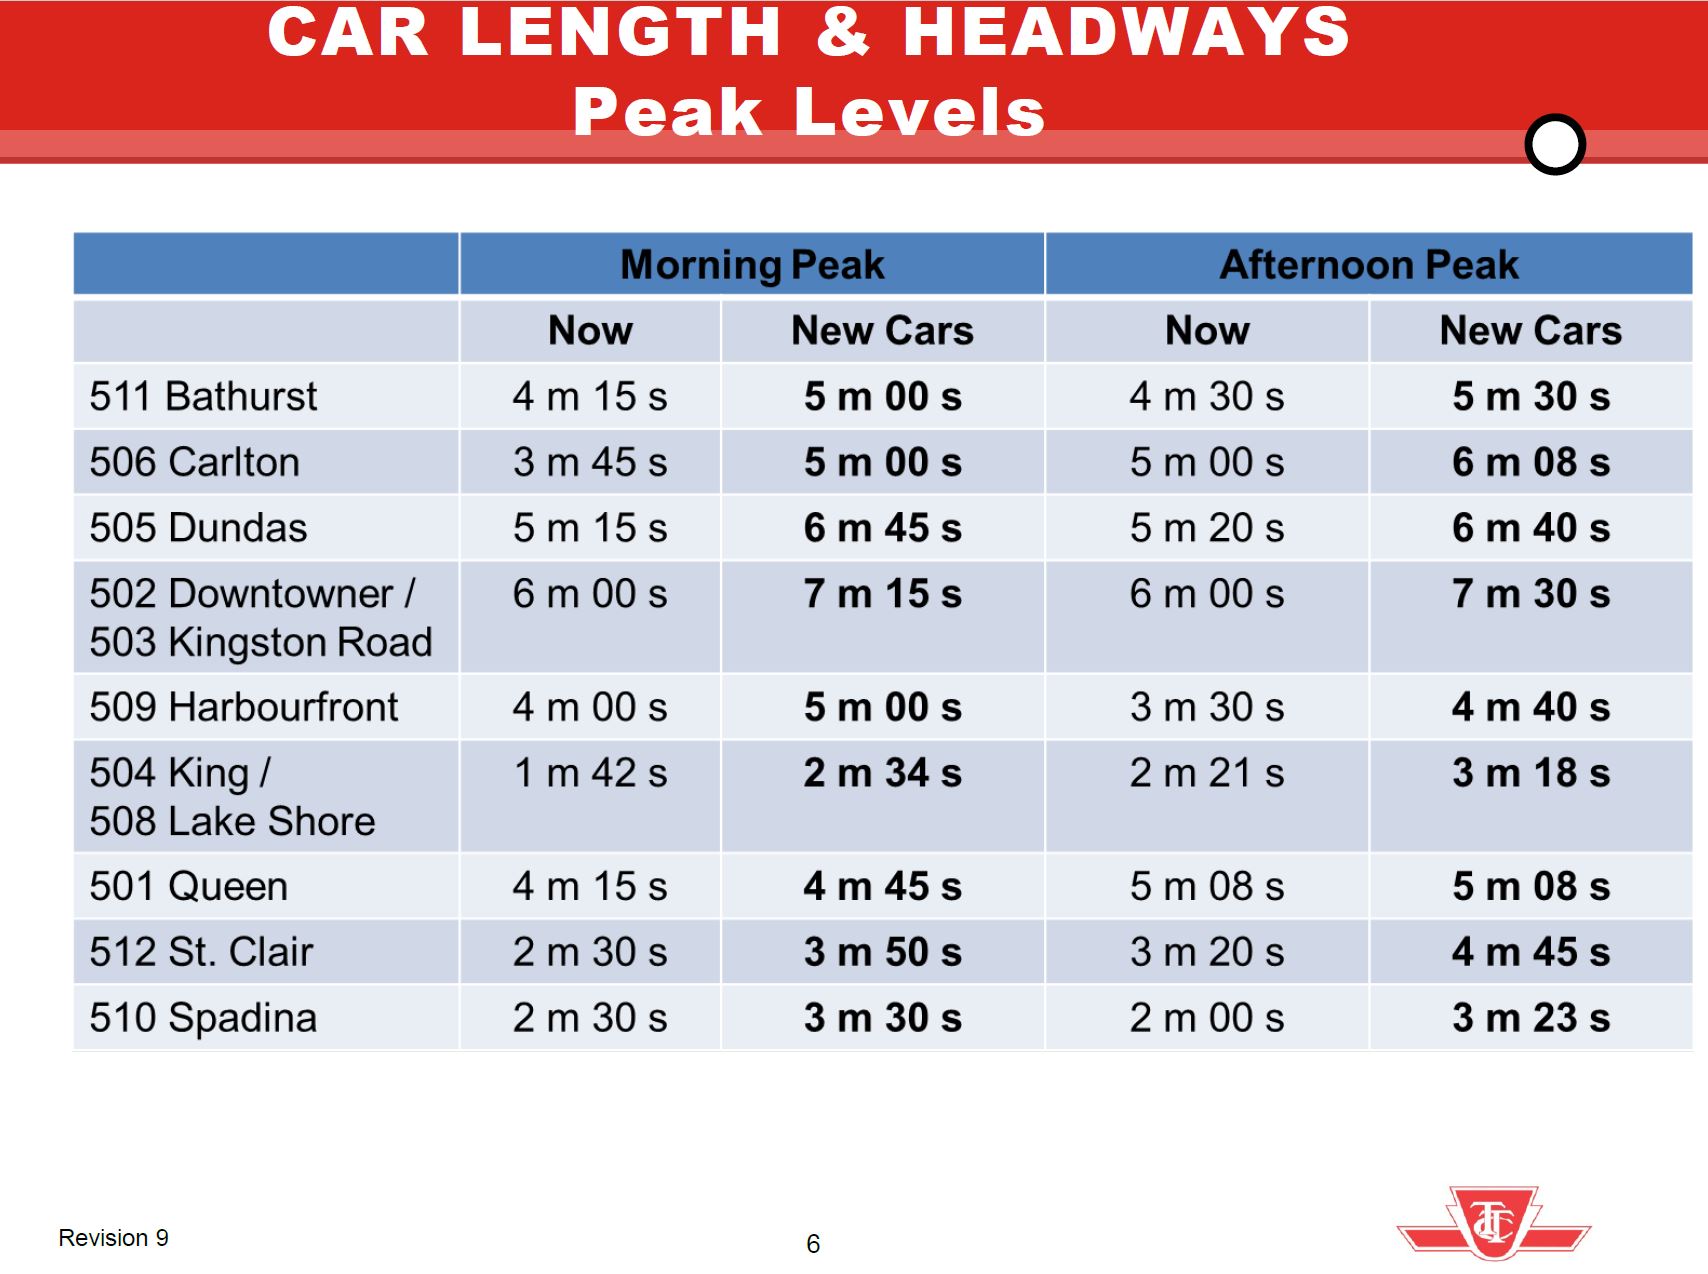
Back in 2013, the TTC proposed how it would operate with the new streetcar fleet. During peak periods, headways would widen particularly where existing service was very frequent. Notably on 501 Queen, there would only be a slight widening of the time between cars in the AM peak and no change in the PM peak. This reflected the fact that Queen was already running with the 75-foot long ALRVs and needed more capacity.
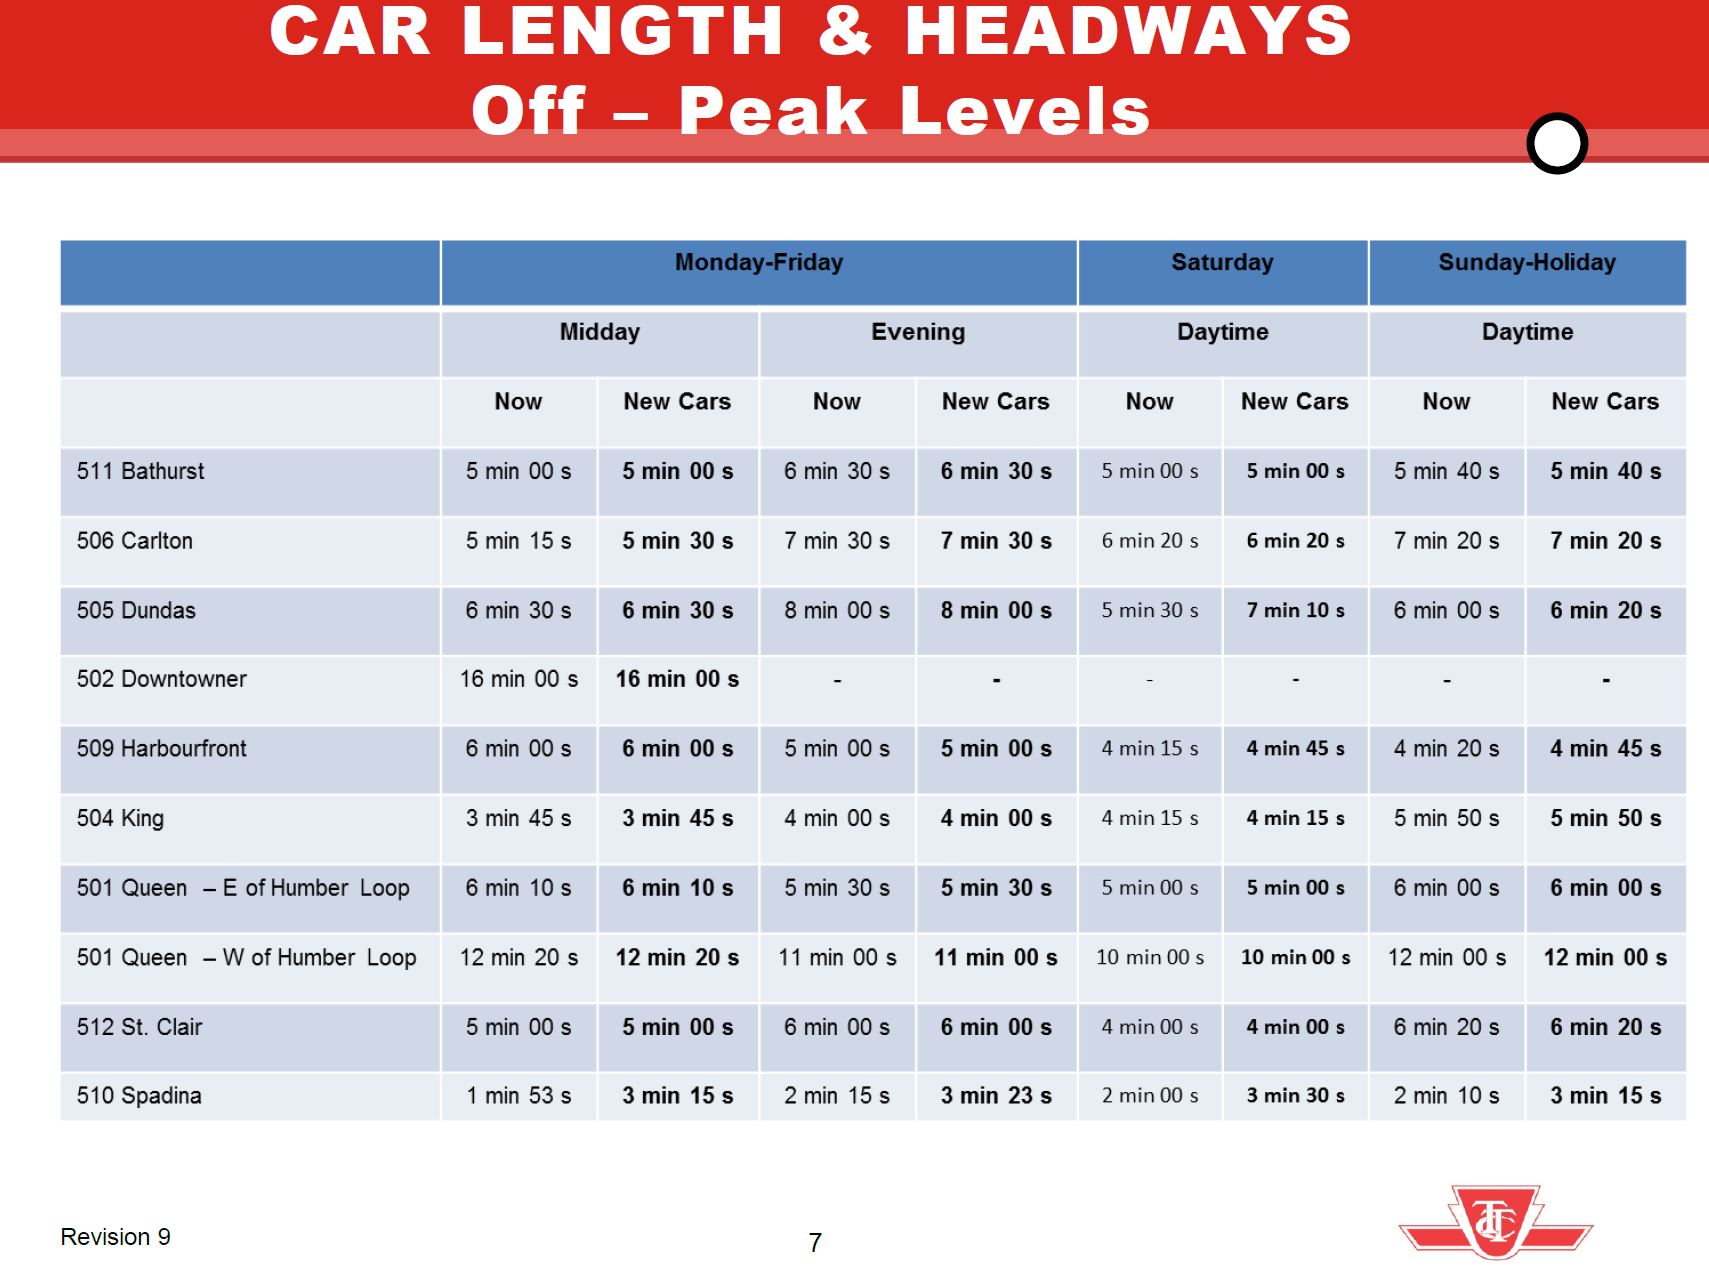
In the off peak, most routes would see no change in service level except for 510 Spadina due to its already frequent service of 50-foot CLRVs that could not be sustained at terminals with the larger new cars.
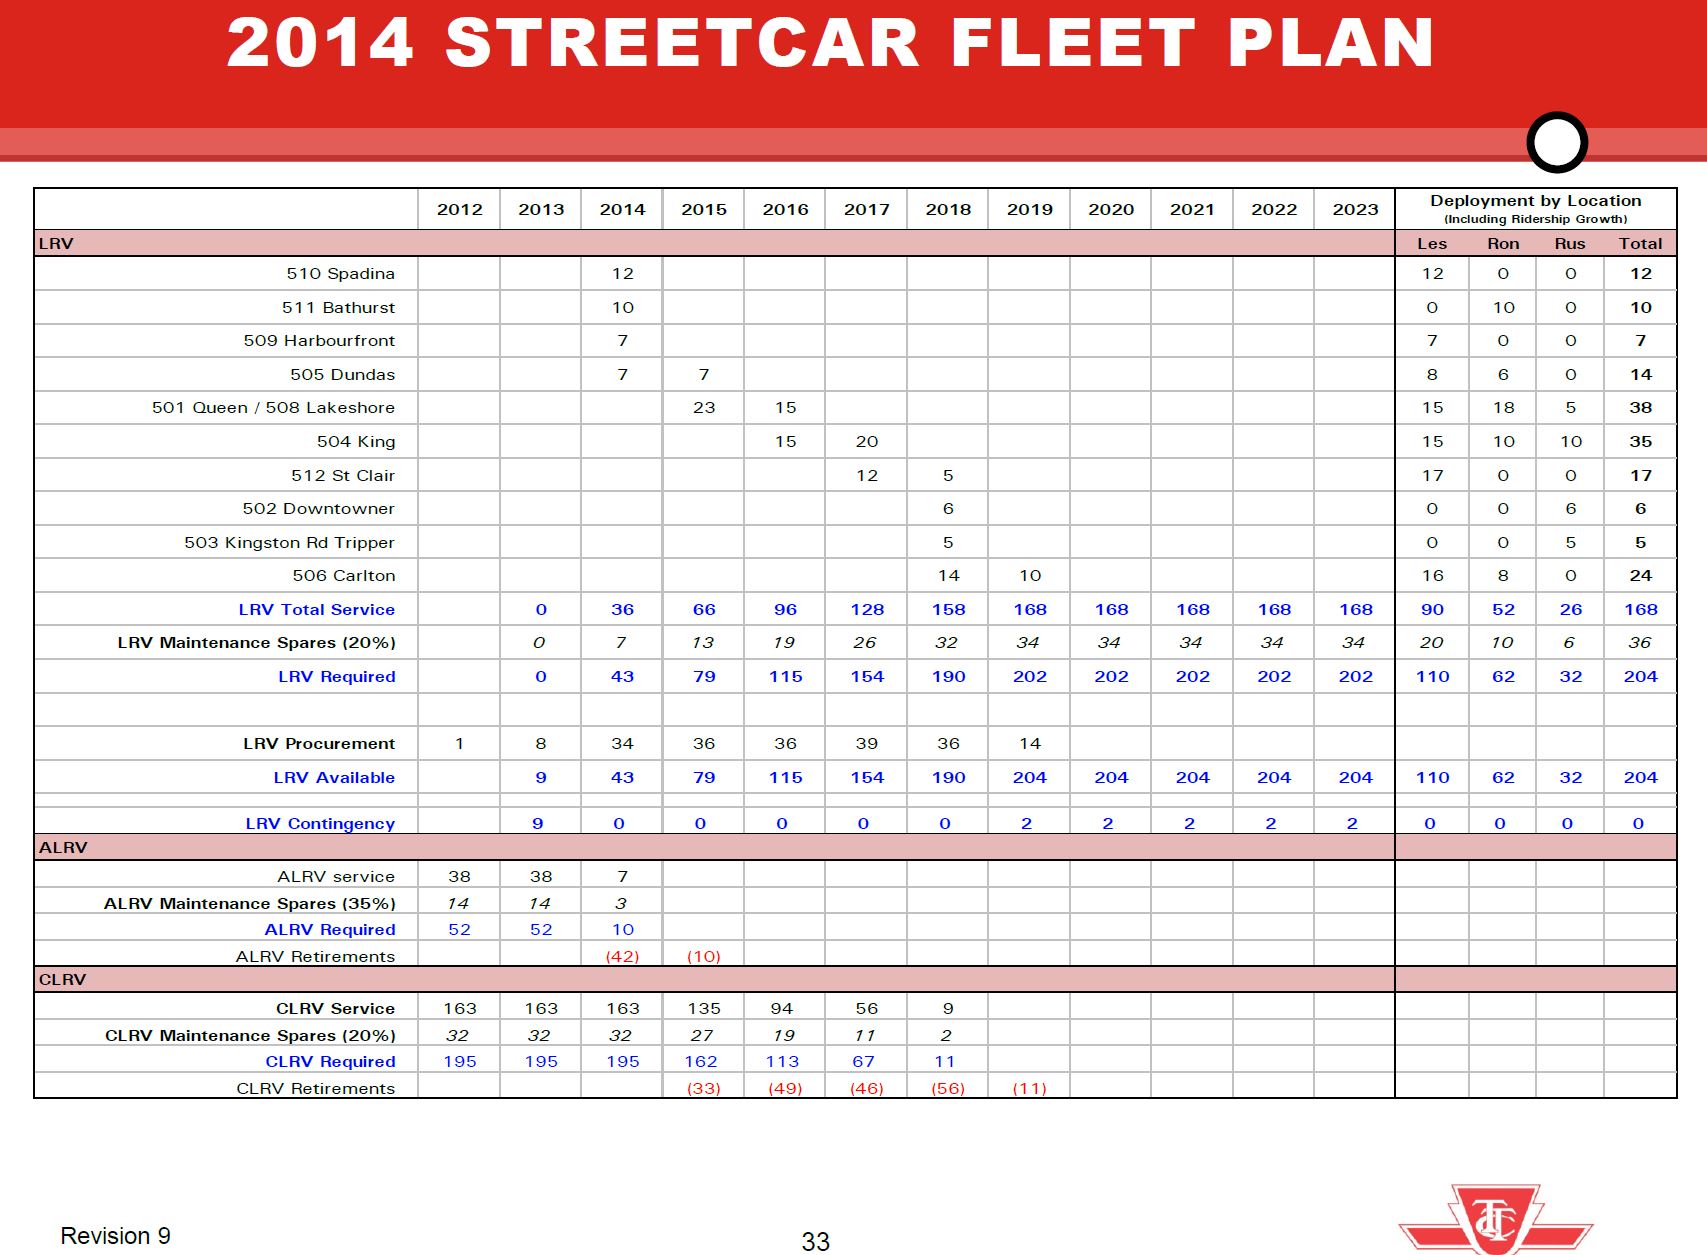
The overall fleet plan showed a buildup to a peak requirement of 168 cars plus 20% spares.
This plan gave a bright future for streetcar service and capacity growth, but things did not work out that way. Service today is generally lower than originally projected for the new fleet, and part of this reduction is due to slower operating speeds and greater provision for terminal recovery time even on routes with reserved lanes.
A related question is the effect that less frequent service has had on ridership. There is a post-pandemic slump on the streetcar system in part due to work-from-home for office jobs and remote learning for post-secondary students. However, even allowing for the pandemic era drop, the problem remains in attracting riders back to transit when streetcars are less frequent and slower, compounded by chronic problems with service reliability. Charts tracking streetcar ridership from 1976 to 2024, the last year published by TTC, are at the end of the article.
These routes are in the part of Toronto where transit riders should be easy to win, but a long decline in service frequency discourages those who have the option to use another mode including private autos, ride hailing or cycling. Service cuts during economic downturns do not magically get reversed as times improve, and ridership that might be wooed back to transit instead faces less reliable service and a political attitude that favours big spending on subway projects, not surface transit.
The remainder of this article looks at each route in detail to see how the actual service changed from the 2014 plan through the 2020s to today comparing:
The 2014 headways for AM Peak, Midday and PM Peak in the management proposal.
The proposed headways after routes converted to Flexity streetcars.
The actual scheduled service in January 2014, January 2020 (just before the pandemic) and February 2026. Driving times are shown separate from terminal recovery times to illustrate how each component has evolved.
Quite notable on many routes is the growth in both scheduled driving and terminal times. Although it is common in the mid-2020s to regard extended travel times and traffic delays as a recent, post-pandemic phenomenon, this pattern started earlier and is evident in 2014:2020 comparisons. Surplus time, it was argued, would prevent short turns, a claim that is demonstrably false as most riders know on a daily basis, but it slows service, wastes resources and forces wider headways.
With the constant changes in route diversions for various construction projects, water and sewer repairs and overhead reconstruction, the previous Fall 2025 edition was getting cluttered and unwieldy. This version consolidates the current and planned work for late fall and winter 2025-26.
Updated April 30 at 2:45pm
Current and pending diversions:
Effective May 3 to May 8:
Although regular operation of 506/306 cars through Bay & College resumes on May 3, the diversion via McCaul, Dundas and Parliament will continue between 11pm and 4am to allow completion of overhead maintenance.
Effective April 30 to May 3:
504/304 King streetcars will divert between Spadina and Church Streets for track work between 10pm and 4am. Eastbound cars will run via Spadina, Adelaide and Church. Westbound cars will run via Church, Richmond, York, Queen and Spadina.
Effective April 27:
Normal service along Queen Street between Broadview and Parliament will resume on 501 Queen, and 503 Kingston Road buses will return to King Street from the Don Bridge westward.
The split operation of 504 King with streetcars running to Distillery Loop, and a 504D shuttle bus from Parliament to Broadview Station will continue until the schedule change on Sunday, May 3 when streetcars will return to the full route.
April 26 to May 3, 2026, 10pm to 4am:
511 Bathurst streetcars will divert north of College to Spadina Station for red lane painting on Bathurst. Buses will run on Bathurst from Bathurst Station to Exhibition Loop.
Ongoing:
501 Queen cars divert both ways via Church, Richmond/Adelaide and York.
Beginning June:
Long Branch Loop will be rebuilt. Streetcar service will be partly or completely replaced by buses from June 7 to October 31. Dates are tentative.
This article reviews the change in travel times and speed profiles on 510 Spadina, 511 Bathurst and 512 St. Clair between October 2019 and October 2025 (pre- and post-pandemic). In almost every case, streetcars are slower today than they were six years ago even though two of the three routes have reserved lanes.
511 Bathurst will soon have red lanes from Fleet to Bloor (except for a section north of Dundas), and I will publish updated charts for that route when the lane changes are in place.
By October 2019, streetcar service was almost completely operated with the new Flexity cars, and so the change over time is not explained with a comparison between the sprightlier CLRVs and the newer cars. (For 512 St. Clair, I have also included a comparison with the CLRV era to show the effect of the vehicle change separate from the pre/post pandemic change in traffic conditions.)
TTC is overly fond of laying blame for transit vehicle speeds on “traffic congestion”, but that is too simplistic an analysis especially for routes with reserved lanes. They also have a bad habit of presenting data without the granularity needed to identify patterns and problems by time of day and location. There are many charts in the main part of this article, but they are intended to show each route in detail.
One important point is that it is impossible to know how much change in speed comes from a more cautious operating philosophy as opposed to traffic conditions. There is, of course, the slow operation through junctions, but that does not explain slower travel on straight track with no special work. Traffic signal effects also show up, particularly in time spent holding nearside at intersections and then again at farside stops. Some areas are inherently slower than others such as Spadina from Queen south with many close-spaced intersections and signals that generally favour east-west traffic. The situation is particularly bad between Front and Queens Quay where the primary job of signals is to handle traffic to/from the Gardiner Expressway.
Any move to speed up operations on streetcar routes requires more than quick fixes like stop eliminations, and detailed block-by-block reviews are needed. In some cases there will be trade-offs between transit and other road users. Arguments for better priority will fare better if and when the TTC improves service so that there are actually transit vehicles to prioritize.
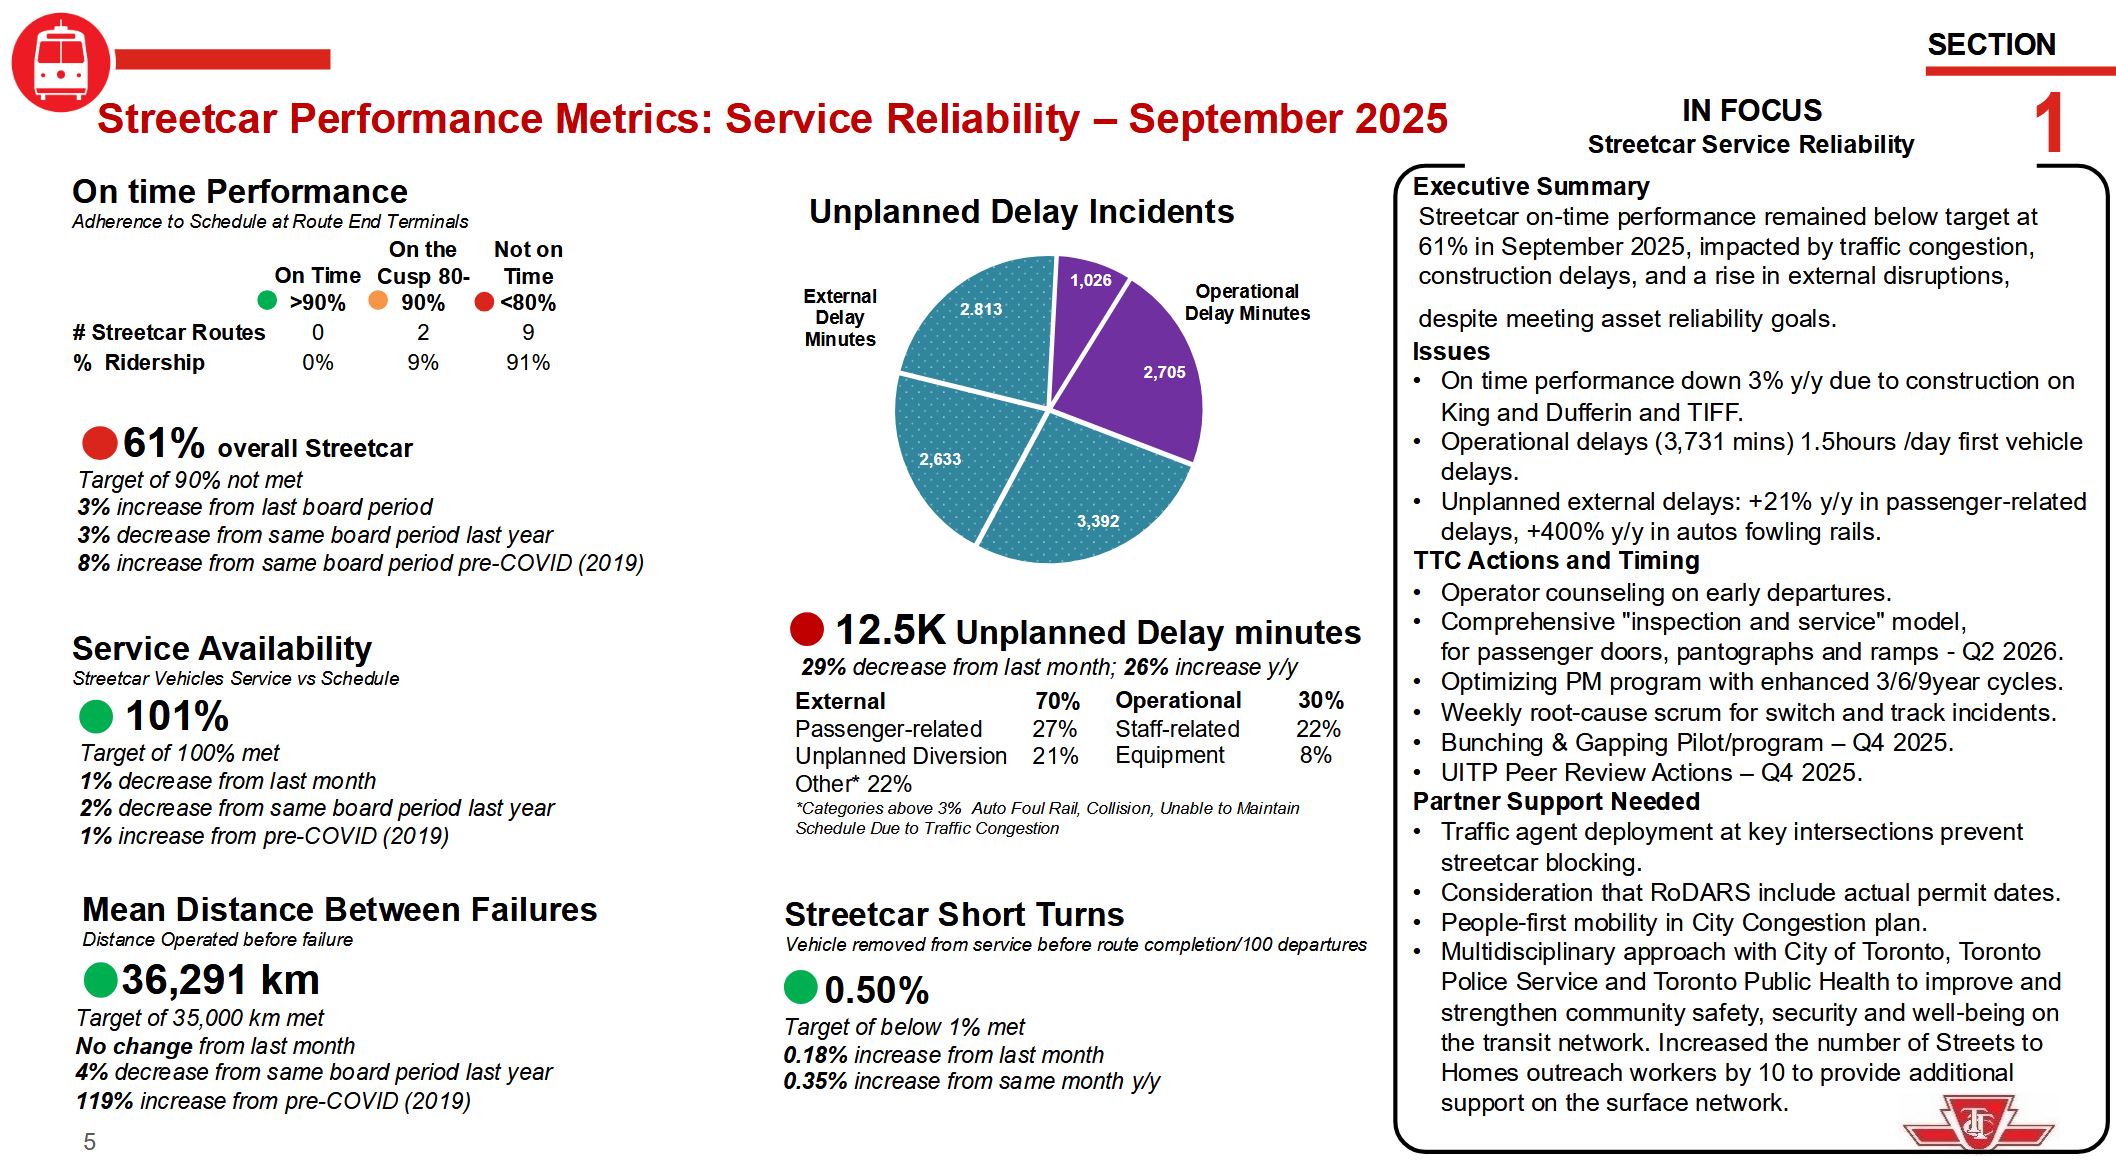
At the TTC Board meeting on November 3, management presented statistics on streetcar delays broken down by type of incident. TTC is quite fond of portraying external incidents, especially those related to congestion, as the root of (almost) all evil. The following page is from the CEO’s Report.
Note that external delays (turquoise) occupy the majority of the chart. During discussion of the problem of autos fouling rails, a passing remark by the Interim Chief Operating Officer piqued my curiosity when he said that there were many delays due to the winter storm.
This sent me to the TTC’s delay statistics which are available on the City’s Open Data site. There are codes for many types of delay including “MTAFR”, short for “Auto Fouling Rails”.
According to the “In Focus” box above there has been a 400% year-over-year increase in these delays, although they are styled as “fowling” implying a flock of chickens might be responsible for service issues.
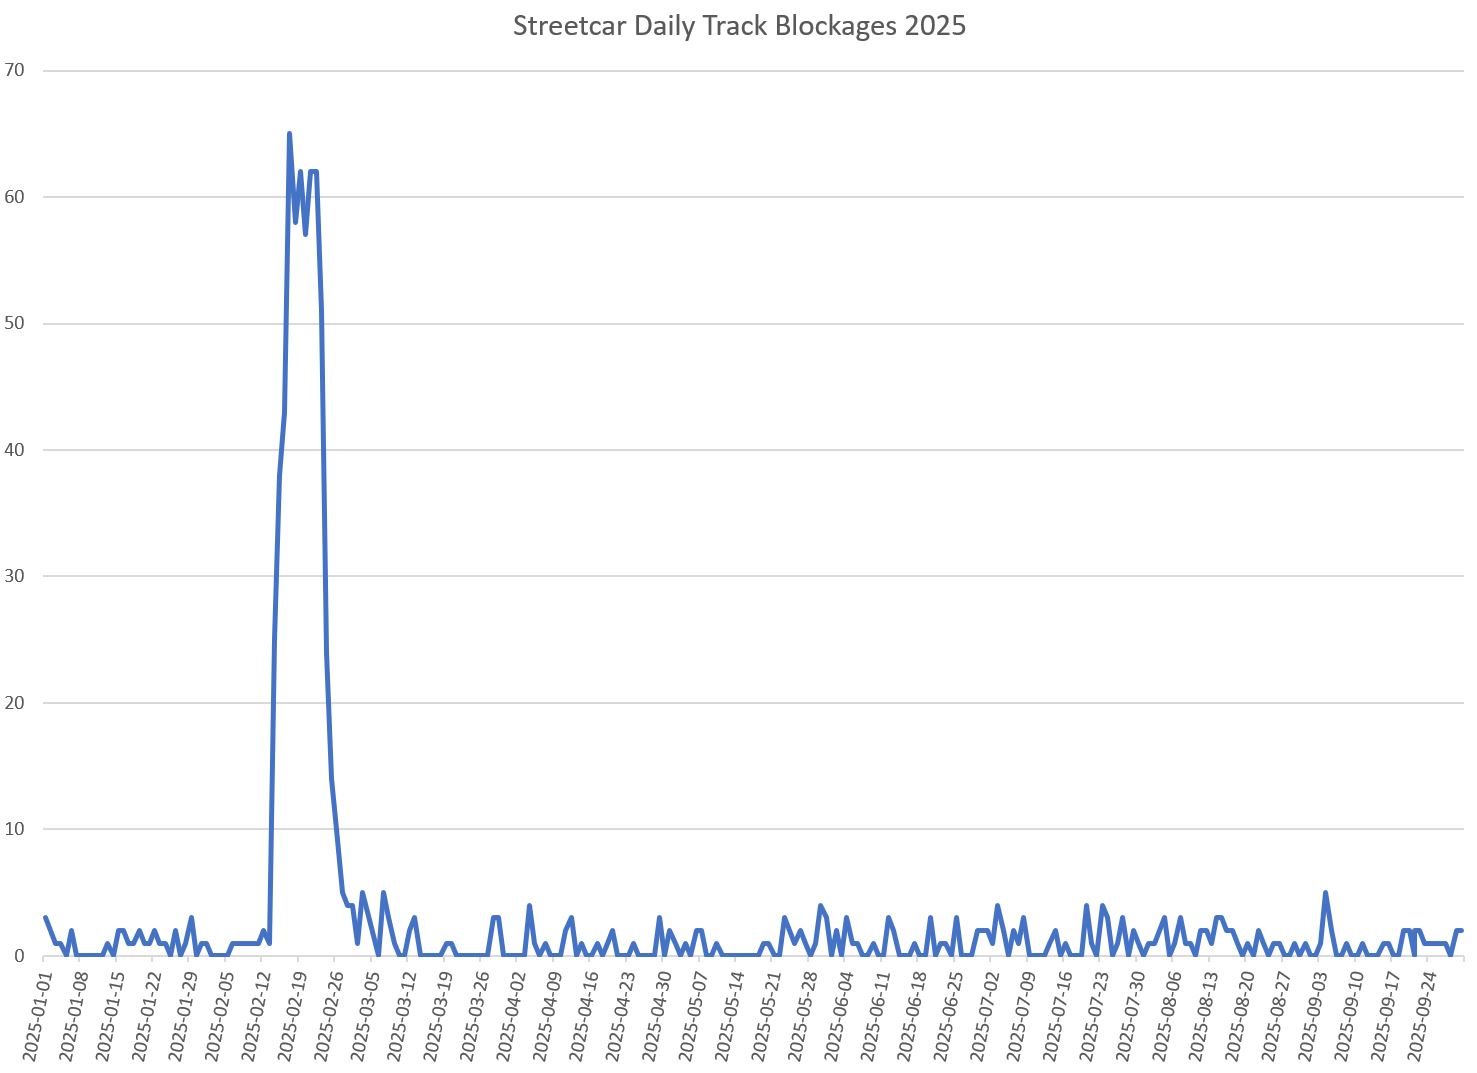
Sorting the data by code and summarizing by date produces interesting results.
Between January 1 and September 30, 2025, there were 843 MTAFR events logged.
Of these, 586 fall between February 14 and 26 hitting a daily high of 65 on February 17.
These blockages were not caused by the typical traffic congestion, but by the City’s utter failure to clear snow on key streets.
105 were on 501 Queen
42 were on 503 Kingston Rd.
84 were on 504 King
93 were on 505 Dundas
186 were on 506 Carlton
3 were on 507 Long Branch
1 was on 508 Lake Shore
2 were on 509 Harbourfront
None were on 510 Spadina or 511 Bathurst
6 were on 512 St. Clair
A few dozen were on various night cars
The pattern here is quite clear: routes on wide roads or rights-of-way were not seriously affected, but routes on regular 4-lane streets were hammered. (How 511 Bathurst was spared is a mystery. At the time it was running with streetcars from Bathurst Station to King & Spadina, and with buses on the south end of the route.)
To claim that the 400% increase from 2024 is some indication of worsening traffic problems is gross misrepresentation of what actually happened. Although this is the CEO’s report and he almost certainly did not assemble the information himself, he wears this issue for having reported misleading data to the Board and public.
Direct comparison with published 2024 data is difficult because until 2025 the TTC used a much coarser set of delay codes that lumped many types of events under generic headings. There was a category “Held by” in which there were 625 incidents from January to September in 2024. The 843 MTAFR codes in 2025 are quite clearly not a 400% increase over 2024.
Whenever there is a discussion of unreliable service, we hear endlessly about traffic congestion. This definitely is a problem, but not the only one, and certainly not in the way presented by the CEO.
A question arose during the debate about the problem that performance stats are consolidated across all routes. Route-by-route service quality is presented in detail in the second part of this article for all streetcar routes. This shows that problems are widespread in the system, even on routes with reserved lanes.
As for the delay stats cited by the CEO, it is clear that we are not comparing September 2025 to one year earlier as the text implies, but using events from the entire year to date including a major snowstorm that had no equivalent a year earlier. The so-called 400% jump in delays from blocked tracks is due to snow and poor road clearance by the City.
TTC management owes the Board and the public an apology for blatant misrepresentation of the delay statistics.