TTC’s 2026 Network Plan: Round Two

The TTC is into the second round of its consultation for service changes and construction projects in 2026. There is a general page on the 2026 Network Plan and a Survey for feedback.

If you comment here, be sure to also complete the survey so that your feedback goes into the official record.

Updated August 14, 2025 at 1:20pm: This article was written based on information in the customer survey as it existed about 4:00 pm on August 13 when the link to it went live on the TTC site. This included a reference to a minimum 5 minute time saving for express buses which did not match the TTC’s own service standard. The survey now contains the correct information. Text in this article has been updated accordingly.

Updated August 22, 2025 at 2:40pm: The City of Toronto has confirmed that widening of the St. Clair underpass east of Keele Street will not be part of the Metrolinx/TTC project planned for 2026.

Public Pop-Ups

  • August 13
    Pioneer Village Station near express route bus bays
    7:30-9:30 a.m. 
  • August 14
    Kipling Station near express route bus bays 
    7:30-9:30 a.m. 
  • August 18
    Kennedy Station near express route bus bays (Platform A and B)
    7:30-9:30 a.m.
  • August 19
    Don Mills Station near express route bus bays 
    4-6 p.m. 
  • August 20
    Yonge and College 506 Carlton, Eastbound stop
    4-6 p.m.

Note that almost all of these relate to the review of express bus services, and only one of the construction proposals (College/Carlton) is covered. More consultation in affected neighbourhoods is definitely required.

Continue reading

Does TTC Mid-Point Route Management Work? (Part I)

In February-March 2025, the TTC added on-street supervisors on eleven routes in an attempt to reduce the incidence of gaps and bunching. This is described in the June 2025 CEO’s Report and the associated Metrics Report containing performance stats for the system.

Bunching and gapping of TTC service

Last March, the TTC expanded a pilot to improve service reliability on 11 key bus and streetcar routes. Working through the Transit Control Centre, uniformed Supervisors have been deployed mid-route to ensure our service frequency meets customer expectations and that we reduce the bunching and gapping of our buses and streetcars, which is a source of frustration for riders.

The pilot involves the following routes: 7 Bathurst, 24/924 Victoria Park, 25/925 Don Mills, 29/929 Dufferin, 100 Flemington Park, 165 Weston Rd North, 506 Carton, and 512 St Clair.

Starting in July, the CEO’s Report will include a Hot Topic that will provide news and updates on the progress – and challenges – related to this important issue. [CEO’s Report, p. 9]

Also:

TTC expanded a pilot to improve service reliability on key bus routes. Mid-route Field Supervisor presence on the nine priority bus routes was increased throughout the February and March Board Period, where the focus is on reducing bunching and gapping, in order to improve the reliability of service. Bunching and gapping is measured by “Headway Adherence”: the vehicle is considered on-time when the headway deviation is less than 50% of the scheduled headway. [Metrics Report, p. 15]

Mid-route Field Supervisor presence on the two priority streetcar routes continued throughout the February and March Board Period, to reduce bunching and gapping and improve the reliability of service. Bunching and gapping is measured by “Headway Adherence”: the vehicle is considered on-time when the headway deviation is less than 50% of the scheduled headway. [Metrics Report, p. 16]

Although there is a Service Standard for headway adherence, this is not measured and reported publicly, and results are never cited in ongoing service quality reports. For many years, the TTC clung to the concept that if routes were on time at terminals, the rest of the line would look after itself. However, the “on time” standard is sufficiently lax that badly bunched and gapped service can meet the target. That, combined with reporting only average results, hides the real character of service that riders experience day-to-day.

At the June 23 Board meeting, management gave the impression that they would not report on all routes in July and might have to farm some of the analytical work out.

This is a sad admission considering the years of articles I have written on service analysis showing what could be done with the hope that the TTC would develop internal tools to perform similar tasks. Sadly, however, I have been told by some at TTC they have what they need, and, in effect that I should run along and not bother them.

Partly to hold their feet to the fire, and to provide the type of information that should be routinely available to the Board, management and the public, this article will do the work the TTC claims they cannot. Here are headway reliability analyses for the routes involved over much or all of the period from January 1, 2024 to June 30, 2025.

In a very few cases, it is possible to see a change in service quality (measured as a smaller spread between minimum and maximum headways, or gaps between vehicles) around the beginning of March 2025. These are rare, and short-lived. February was a really bad time to try to implement any new practice as the city was digging out (or not depending on where you live) of a huge snowstorm. (The extended effect of the City’s poor snow clearing on transit routes is evident in the multi-day peaks in irregular service on some routes.)

I have presented 18 months of data to show that problems with headway reliability have existed for some time. There is more data going further back, but 18 months makes the point. Moreover, a consistent pattern is that headways might be well-behaved in the AM peak and Midday, but evening service does not fully “recover” from PM peak conditions, and erratic service is common.

Quite bluntly, service on all of these routes was poor, well beyond the TTC’s own Service Standards, for 2024 and early 2025, and showed little sign of improvement through to mid-year. It will be interesting to compare whatever stats TTC comes up with to the performance shown on charts here.

Part I of this series includes data for 7 Bathurst, 100 Flemingdon Park, 165 Weston Road North, 506 Carlton and 512 St. Clair. Part II will include 24/924 Victoria Park, 25/925 Don Mills and 29/929 Dufferin.

There are a lot of charts and this is a long read. I will put the “more” break here. Those readers interested in specific routes can soldier on. Thanks for reading!

Continue reading

512 St. Clair Traffic Signal Delays

With Toronto’s Congestion Management Plan in the news, we hear about various ways to improve the movement of cars and, oh, by the way, maybe speed transit vehicles too. Toronto talks a lot about “transit priority” but this more often means giving transit vehicles the leftovers, the spare time that can be shaved at some locations from competing traffic, not absolute priority for transit vehicles.

This shows up particularly where transit vehicles have a dedicated lane, but they must wait patiently while other traffic, typically left turns, gets out of the way. This has the perverse effect of making transit slower particularly when combined with the “double stop” effect of farside stops. At these locations, the nearside space a stop would normally use is occupied by a left turn lane, and traffic in that lane has first claim on a green cycle.

Two routes with this as a near-standard stop configuration are 510 Spadina and 512 St. Clair. The Spadina car only recently returned, and I will leave comparative analysis of bus and streetcar operation there until more data have accumulated. A preliminary look is not complimentary to the streetcars because, unlike them, the buses are able to combine waiting for green signals with loading passengers.

On St. Clair, streetcars returned in Fall 2024. This article reviews tracking data for March 2025. In brief, a common situation along the route is that streetcars spend more time waiting at intersections than they do serving stops once they cross to a farside platform. The traffic signals are not organized to favour streetcar movements, and the configuration with farside stops is counterproductive.

To be fair, one cannot simply throw a red signal in front of cross traffic every time a streetcar appears as this will affect both auto and pedestrian crossings that require a minimum time. When both the St. Clair and Spadina lines were designed, a concern was the frequency of streetcar service and the high probability that there would always be a streetcar demanding priority. However, the larger Flexity cars combined with TTC service cuts makes this claim less valid.

Pre-emptive streetcar signals could be challenging at some locations, but there is the separate issue of timing of the phase for left turning autos. Should it come before or after streetcars are allowed to cross the intersection? Streetcar-only phases are only provided at some locations on Spadina where cars are turning across traffic lanes, but not for through movements. There is a streetcar-only phase at Lansdowne and St. Clair westbound, but otherwise left turning auto traffic always has priority.

A related problem lies in TTC’s glacial streetcar speeds through special work which would require a lengthy transit phase to allow streetcars to clear intersections on Spadina with streetcar junctions. With streetcars crossing on the shared north-south green, this does force motorists to wait for streetcars to get out of their way.

The data on St. Clair show a common pattern: streetcars spend more time waiting to cross intersections than they do serving the farside stops. They may operate in their own lane, but the combination of farside stops and signal design works against transit operations. This has implications for the soon-to-open “LRT” lines on Eglinton and Finch.

If we are not prepared to give transit vehicles true priority over cars, how do we expect to attract more riders to the system and, in theory, reduce overall road demand?

The remainder of this article describes the methodology behind my analysis and shows the behaviour at individual intersections along St. Clair.

Continue reading

Service Analysis of 512 St. Clair: January-February 2025

This article reviews the behaviour of service on 512 St. Clair during the first two months of 2025. This period was marked by an intense snow storm in mid-February that left many transit routes in disarray thanks to poor snow clearing.

Updated Mar. 21, 2025 at 10:30pm: The service chart for February 12, 2025, the first of the two major snow storms, has been added to this article.

Updated Mar. 22, 2025 at 1:00pm: Detailed charts of headways and travel times for February 12, 2025, have been added showing the consistency of travel times along the route even though headway quality deteriorated through the evening due to bunching.

The typical problem on four-lane roads was that snow was not removed to the curb causing parked cars to foul the streetcar tracks. Despite streetcar lines being “Snow Routes”, the signs were little more than decorations. The oft threatened but rarely practiced removal of cars for proper clearing did not occur, and some snow/ice banks remained until they eventually melted. Delays for blocked service occurred repeatedly well after the storms.

Another common problem was the absence of breaks in windrows (ploughed snow banks) at stops that lasted weeks after the snowfall. A few special cases had problems that were not addressed:

  • Where a street had permanent curb lane installations such as bump-outs for loading zones at stops, a windrow would be ploughed separating the streetcar lane from the waiting area making entry and exit from cars difficult, dangerous and in some cases impossible.
  • Where a bike lane occupied the curb lane, there would be a windrow between the streetcar and bike lanes blocking transit access.

While the City is officially responsible for snow clearing, the TTC was noticeably silent on a critical issue of operational reliability and passenger safety. They talk a good line about “safety”, but here, in a real crunch, the TTC did nothing beyond pleading by press release with motorists to not block the tracks.

The 512 St. Clair cars run in reserved lanes on a wider-than-usual Toronto street, and snow clearing was much less of an issue for them. Looking over the two-month period, we can see the benefit of a clear, protected right-of-way when many other routes were snarled or inoperative thanks to parked cars.

St. Clair is a relatively short route running between Yonge Street (St. Clair Station) and Keele Street (Gunn’s Loop). It loops through St. Clair West Station underground. In theory, this should provide four points — the two termini and the midpoint at St. Clair West both ways — where service could be regulated easily. Actual headway data show highly erratic service even during the pre-snow period.

By contrast, travel times along the route were consistent, with only small variations thanks to the storm, indicating that the snow was not a major problem. Of course, with a reserved lane, the TTC’s favourite chestnut about “congestion” could not be blamed for headway problems.

The charts in this article show both the travel times and headways (spacing between vehicles) for 512 St. Clair in January and February 2025, as well as detailed charts for specific days.

Continue reading

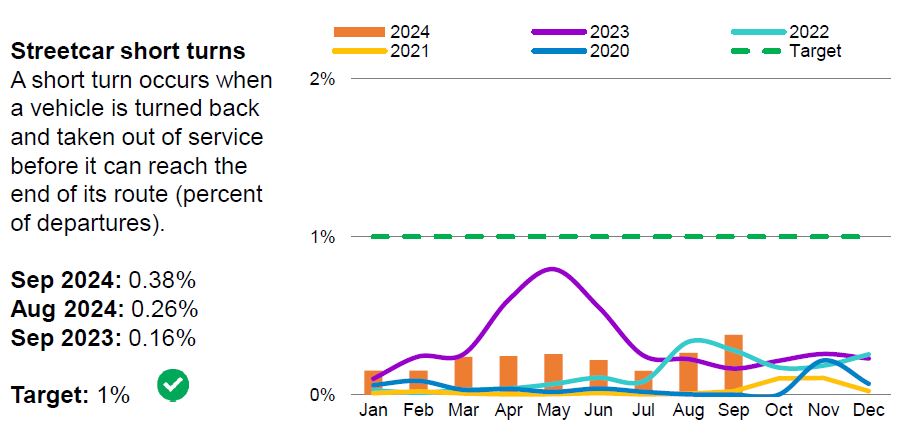
TTC’s Dubious Short Turn Statistics

In the monthly CEO’s Report, one of the KPIs (Key Performance Indices) is a measure of the number of short-turned streetcars. This used to be reported as an absolute count, but is now expressed as a percentage of all trips.

Here is the most recent version:

This chart is a fiction born of the Rick Leary era when, in theory, all short turns were banned and the stats were made to fit the objective. Like many KPIs, this suffers from a combination of system-wide consolidation across all routes and time periods, as well as under-reporting of what is really happening.

An easy way to get the true count is to look at tracking data and compare two points on either side of a short-turn location. For example, Woodbine Loop at Queen and Kingston Rd. is a favourite spot for 501 Queen and some 503 Kingston Road cars to turn back. Counting the number of vehicles crossing Coxwell (west of the loop) with the number at Woodbine Avenue (east of the loop) shows how many cars did not travel east of Kingston Road and, therefore, were short-turned.

The TTC claims that they better their 1% target for trips short turned, but it is clear that they rarely achieve this. In some cases, the value rises above 20% indicating that although much service does get to the terminal, there is a good chance that a rider will encounter a short turn. This is separate from frustrations caused by gaps and bunching.

Short turns happen for many reasons including traffic congestion, too-tight schedules, service blockages for collisions, medical problems, parades … it’s a long list. Riders really don’t care. The basic point is that service they expected to receive is not there, and usually with no advance warning.

The table below summarizes the statistics from the vehicle tracking records in November 2024 for the period from 6am to midnight. It is clear that even on an aggregated level, the proportion of short turns is much higher on these routes that the TTC KPIs indicate.

Updated Dec. 6/24 at 1:30pm: Short turn counts for 504 King eastbound, 507 Long Branch and 508 Lake Shore westbound trips added.

Note: The legends on the original charts in this post were misleading. They have been changed to better reflect what the columns and lines on the charts represent..

RouteLocationTotal TripsShort Turns% Short Turns
501 QueenWoodbine Loop EB35471985.6%
Roncesvalles WB35372477.0%
503 Kingston RdWoodbine Loop EB32521364.2%
504 KingSpadina WB64532564.0%
Roncesvalles WB327536411.1%
Church EB63191262.0%
Parliament EB61982043.3%
Dundas EB2943712.4%
505 DundasParliament EB30402127.0%
Lansdowne WB306239713.0%
506 CarltonCoxwell EB30312939.7%
Lansdowne WB325657217.6%
507 Long BranchKipling WB2074883.0%
508 Lake ShoreKipling WB193199.8%
512 St. Clair (*)Lansdowne WB206824912.0%
Oakwood WB21131225.8%

(*) For 512 St. Clair, only data from November 14 onwards when streetcar service was restored are included.

Continue reading

Temporary Replacement of 512 St. Clair Streetcars

Starting at 11pm on Friday, November 1 until 5am on Thursday, November 14, streetcars will be replaced by buses over the entire 512 St. Clair route. Buses are already covering the east end of the route due to a sinkhole near Avenue Road and streetcars are diverting south to Bathurst Station.

This substitution will allow various works including completion of reconstruction at St. Clair West Station.

The 10 streetcars assigned to the line will be replaced by 15-30 buses.

Full streetcar service will resume on November 14, subject to completion of construction work.

Bus service on 33 Forest Hill, 90 Vaughan and 126 Christie will return to St. Clair West Station on Sunday, November 17, the next schedule change.

512 St. Clair Streetcars vs Buses: June 2024

With the June 23, 2024 schedule change, buses were replaced with streetcars running from St. Clair Station at Yonge to Gunn’s Loop west of Keele Street. Buses operated mostly in the regular traffic lanes, not on the streetcar right-of-way.

This article reviews the travel times on the 512 St. Clair bus and streetcar services to compare travel times over the route.

Although the streetcars in week 4 of June (beginning on June 23) are overall faster than the buses they replaced, the degree of this advantage varies by location and direction.

This is a companion piece to my review of the streetcar-to-bus change on 510 Spadina that happened at the same time.

The overall observation here is that although travel times are now shorter for many riders, headway reliability is very poor and gaps can undo the benefit of a faster trip.

Continue reading

Streetcars Return to St. Clair

The TTC has announced that streetcar service will be restored on St. Clair with the June 23, 2024 schedule changes. This follows a long period of reconstruction at several points along the route:

  • Upgrade of overhead power systems for pantographs along the route, at loops and junctions.
  • Worn rail replacement at some stops.
  • Improved lubricators for Oakwood and Earlscourt loops to reduce wheel squeal.
  • City of Toronto work at the Barrie corridor west of Caledonia.
  • Toronto Water construction.

Reconstruction of St. Clair West Station loop will continue through the summer and fall, and streetcars, like the interim bus service, will not enter the station. Riders connecting to/from the subway will have to walk to nearby stops at Bathurst or Tweedsmuir.

This chart gives an overview of the various projects along St. Clair. For complete description of the project, see the TTC’s project page.

Full details of the service changes planned on June 23 have not yet been released, but the electronic version of schedules used by trip planning apps were posted recently.

WeekdaysSaturdaysSundays
AM Peak M-F
Early Morning S-S
8′10′11′
Midday M-F
Late Morning S-S
8′8′9′
PM Peak M-F
Afternoon S-S
8′8′8′
Early Evening8′9′9′
Late Evening10′10′10′

Night service will also change. Streetcars will operate as 312 St. Clair from Yonge Street to Gunn’s Loop west of Keele matching the daytime service. A separate 340 Junction night bus will operate from Gunn’s Loop to Dundas West Station via St. Clair, Jane and Dundas.

How Slow Is My Streetcar: Part I

At its November 2023 meeting, Council passed a motion proposed by Councillor Chris Moise whose ward covers the east side of downtown, and who also sits on the TTC Board:

1. City Council direct the General Manager, Transportation Services, in consultation with the Toronto Transit Commission, the Toronto Police Service, and the City Solicitor to review and report back to the Executive Committee in the second quarter of 2024, including:
a. an update on streetcar performance over the last five years;
b. suggested improvements to the public realm along King Street until the permanent capital project can be delivered; and
c. the feasibility of implementing automated traffic enforcement on the King Street Transit Priority Corridor, including details on what legislative amendments would be required to provincial legislation including, but not limited to, the Ontario Highway Traffic Act.

This article addresses point “a” with a review of streetcar lines over the past five years. It is important to go back to 2019 before the pandemic fundamentally shifted traffic and transit patterns downtown as a point of reference.

From time to time, there are calls to expand a “King Street” redesign to other parts of the network, but there are two “cart before the horse” issues to address first:

  • Figure out how to make King Street operate as it was intended and return at least to its pre-pandemic behaviour, if not better, as a model.
  • Understand how other streets operate including where and when problems for transit performance exist.

An update on transit priority will come to Council in February 2024, although this will look more widely at the city, not just downtown. In previous articles I have reviewed the growing problem of transit travel times as traffic builds on the proposed RapidTO corridors, some of which exceeded pre-pandemic levels some time ago. In future articles I will refresh these analyses with data through to the end of 2023.

An important distinction between most RapidTO bus corridors and the downtown streetcar system is the design of suburban vs downtown streets. In the suburbs, the streets are mostly wide, have relatively few points of access (e.g. driveways) or pedestrian oriented uses (e.g. shops), and travel distances tend to be longer. In the core, streets are narrow, mostly four lanes with no possibility of widening, access points are more frequent, there is a strong pedestrian orientation, and trips tend to be short. Even if buses were running, express operations would be almost impossible and would save very little time on the downtown routes.

There are exceptions such as some older parts of the inner suburbs that bring physical challenges for transit priority, but also the political challenge that the transit share of road use is lower as one moves outward from the core. King Street is a very different place from Steeles, and Dufferin is somewhere in between depending on which section one considers.

An important message in all of this is that “congestion” (put in quotes because it is so often cited as a get-out-of-jail-free excuse for all transit woes) varies from place to place and time to time. Simply putting transit priority everywhere will not solve all problems and could even be overkill (even assuming that it is true “priority” and not a sham to keep transit vehicles out of motorists’ way). It is simple to colour a bunch of key routes end-to-end on a map, but much harder to identify changes that will actually make a difference. Meanwhile, a focus on “priority” could divert attention from badly-needed improvements in headway reliability and more reliable wait times.

This article begins with a comparison of scheduled travel speed on each route, and then turns to actual travel speeds by route segment. In the interest of length, I will leave a discussion of headway reliability to future articles. This is an important component of total travel time, especially for short trips or trip segments.

I have also included tables showing the constant change in route configurations on the four major east-west corridors thanks to a never-ending procession of track and water main work, rapid transit construction, and overhead changes for pantograph operation. Some of this work was accelerated to take advantage of lighter traffic conditions during the pandemic, and some to bring forward work to keep staff employed.

However, the rate of route changes persisted well beyond the heart of the pandemic and threatens the credibility of transit service on major corridors leaving riders constantly wondering where their streetcar or replacement bus might be. Some changes occurred without the planned work actually taking place, or work started and ended later than announced (sometimes much later as in the never-ending KQQR project).

An important change over recent years, separate from the pandemic, has been the move to larger streetcars on wider headways. What might have been a tolerable unevenness in service when streetcars arrived every 4 or 5 minutes simply does not work for scheduled headways of 10 minutes with much wider swings. Bunching when it occurs leaves much bigger gaps between vehicles. A laissez faire attitude to route management, and especially the assumption that routes under construction cannot be managed, has led both to unreliable service and basic questions of how or if the TTC can recover the quality riders expect.

For all the talk of project co-ordination, the last people who seem to count are the riders. Simply studying raw travel times be they scheduled or actual does not capture the frustration, delay and despair from the ever-changing and unreliable services, be they by streetcar or bus.

Continue reading

Analysis of 512 St. Clair Service: Part III

This article continues my reviews of bus operations on 512 St. Clair in September 2023 and of streetcar operations in the preceding months.

One aspect of any route’s operation is the degree to which vehicles have time for a layover at terminals. If this time is too small (or worse, none at all), service can be disrupted by the simple need for drivers to answer calls of nature and just decompress for a few minutes.

There is no formal break built into schedules in Toronto as can be found in some other transit systems, but a quick look at the TTC’s schedule summaries will show that most routes have built in “recover time”. This is intended to compensate for random events during a trip, although sometimes it is simply a mechanism to make the round trip time come out to a multiple of the scheduled headway.

Some of the “service reliability adjustments” the TTC advertises with schedule change are nothing more than shifting time from “recovery” to “driving” time without actually changing the round trip time. In other cases, time is added or removed without changing the total number of vehicles causing the service headway to get longer or shorter.

When schedules have excessive travel and/or recovery time, vehicles queue up at terminals causing congestion on the approach if there is no place to park off-street.

In the case of 512 St. Clair, the time spent at St. Clair Station (the eastern terminus) was fairly consistent up to the end of June 2023, but things got really messy. This corresponded to the point where service on the line as a whole became considerably worse as we saw in earlier articles.

This was caused by two competing factors in route operations.

  • In July and August, the TTC extended streetcar service to Gunn’s Loop west of Keele even though it was only scheduled to run to Earlscourt Loop at Lansdowne. This made keeping “on time”, the TTC’s holy grail of service management, impossible.
  • The approaches taken in July and August were quite different, but a common factor was that streetcars spent more time sitting in St. Clair Station Loop to get back on time at the expense of providing the advertised service on the route.
Continue reading