Updated December 4, 2025 at 11:40am
The TTC has issued a press release confirming the times for start of service on December 7:
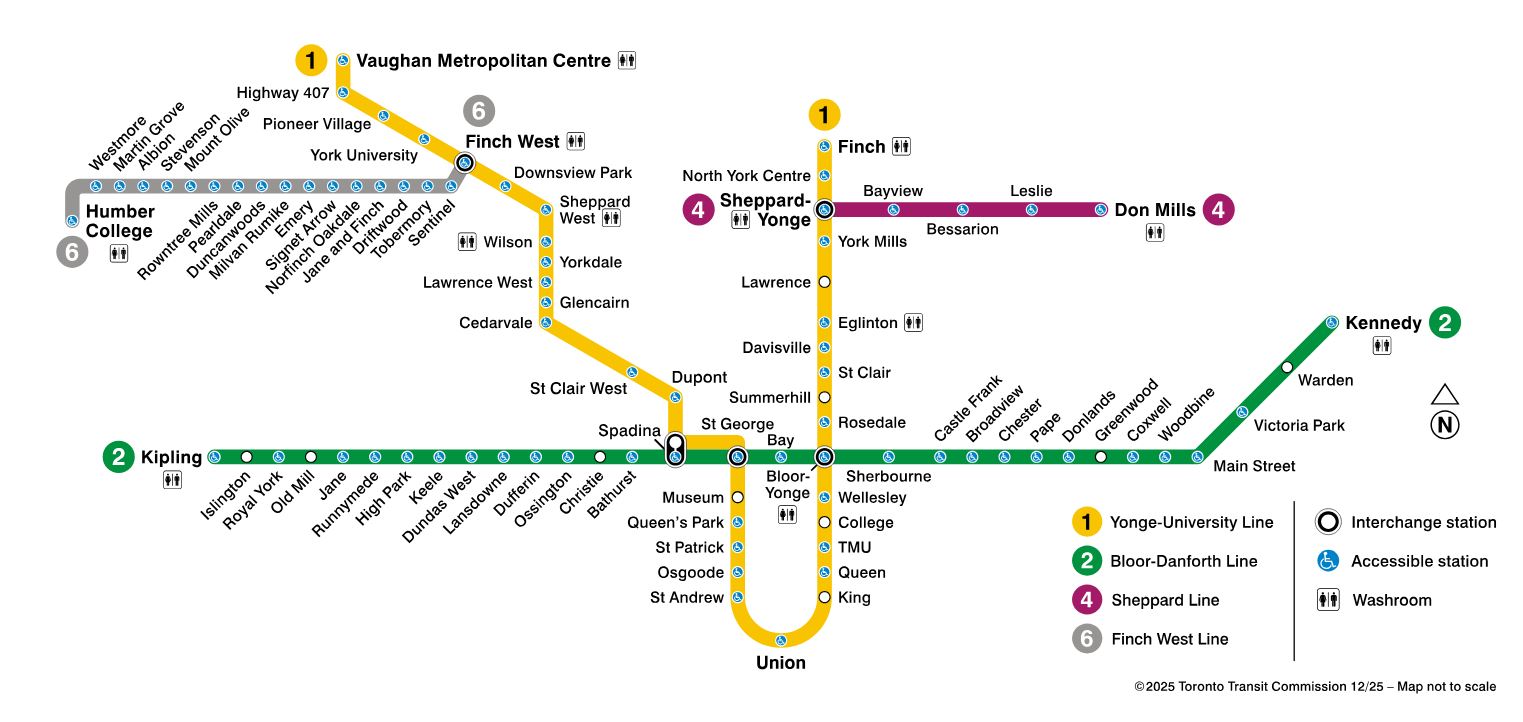
Line 6 Finch West – Toronto’s newest transit line – will officially open to customers on Sun. Dec. 7. The first westbound train will depart from Norfinch Oakdale Station at 7:33 a.m., while the first eastbound train will leave Jane & Finch Station at 7:47 a.m.
For detailed first train times at each of the 18 new Line 6 stations, customers are encouraged to visit the official TTC schedules page: https://www.ttc.ca/routes-and-schedules.
Before regular service begins, two ceremonial trains will depart from Finch West Station.
Opening day is expected to be busy, and the TTC has organized special activities to mark the occasion. Customers will have the opportunity to collect exclusive Line 6 souvenirs, including special-edition ride guides, vehicle cutouts, and limited-edition commemorative coins and buttons.
[…]
Opening day schedule
On Sun., Dec. 7, the TTC will host a celebratory opening at Finch West Station. The planned opening day schedule is below:
• 7:00 a.m. – Brief remarks from dignitaries.
• 7:20 a.m. — A ceremonial first train will depart Finch West Station. This trip will be reserved for media and invited guests.
• 7:27 a.m. — A second train will depart Finch West Station. Members of the public are welcome to board and join the celebration. This train will be travelling to Driftwood Station and returning to Finch West Station. It will not be picking up customers at other stops.
• 7:33 a.m. — The first in-service train will depart Norfinch Oakdale Station, heading west.
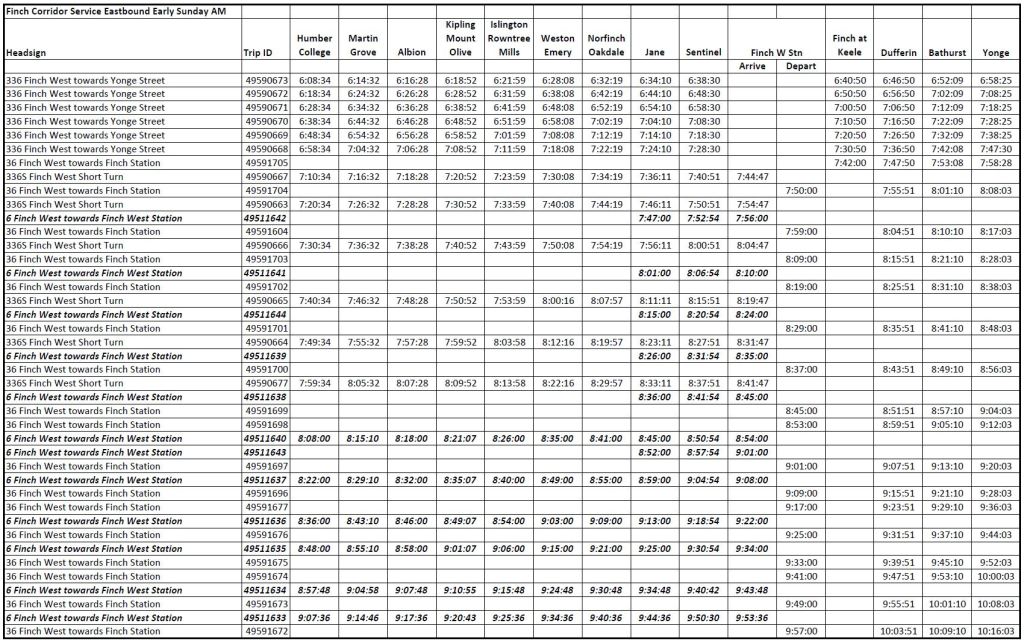
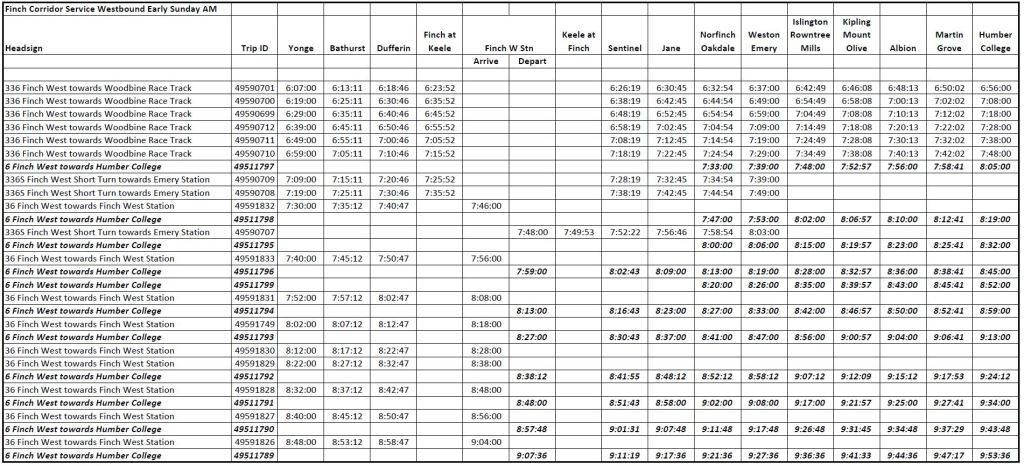
Note that the schedule pages for Line 6 have not been loaded yet, but you can see the early Sunday morning service on the Finch Corridor below, and the full schedule for 6 Finch West in this pdf. The schedules should go live on the TTC’s site when they flip over to the December 7 versions on the weekend.
Original article:
This post contains a consolidated view of schedules for:
- 6 Finch West LRT
- 36 Finch West Bus
- 336 Finch West Night Bus
The period covered is 6 to 9am on Sundays, and these timetables show the transition from the night bus covering the entire route to the split bus/LRT operation east and west of Finch West Station during the daytime.
The information is taken from the GTFS version of the schedules for these routes published on the City’s Open Data site recently. My intent in producing this is that the new schedules will not go live on the TTC site until December 7, and many eager transit aficionados will want to know the times of service at various locations on the route in time to plan to ride early trips.
The TTC’s web page about Line 6 gives a generic start time of 7:30am for the route on Sundays, but actual times vary along the route.
In the timetables below, the LRT trips are in bold italics. Only major stops are shown to save space.
For those unfamiliar with the new line, the carhouse is located between Jane and Norfinch stations, and some trips originate there during the build-up of service.