
In a recent article, I reviewed the TTC’s Service Standards Update. These standards included targets for headway reliability which are extremely generous and allow the TTC to claim that services operate “to standard” when actual rider experience is less than ideal.
Reliability of service is a top concern for TTC riders, and it has also been identified by TTC staff. Where the problem lies is that the targets offer little incentive to improve or measurement of just how bad the situation really is.
When the TTC talks about reliability, they inevitably trot out excuses about traffic congestion and the difficulty of operating service in mixed traffic. This has been a standard response to issues with streetcar routes for as long as I can remember. However, the typical TTC rider is a bus passenger, and this group has flagged service reliability, frequency and crowding as issues just as important as for streetcar riders.
Regular readers will know that over the years I have published many analyses of route performance looking mainly at the streetcar system, but also at selected bus routes. Recently, I decided to expand this to a number of routes in Scarborough where the quality of bus service often comes up in debates about the Scarborough subway extension, and to revisit some of the routes affected by construction on the Spadina extension which has now pretty much wrapped up. Apologies to readers in Etobicoke because this gives a central/eastern slant to the routes reviewed here, but I have no doubt that route behaviour in our western suburb is similar to that on the rest of the network.
This post may give some readers that dreaded sense of “TL;DR” because of the amount of material it contains. It is intended partly as a reference (readers can look at their favourite routes, if present), and partly to establish beyond any doubt the pervasiveness of the problem with headway reliability facing the TTC. This problem exists across the network, and setting performance targets that simply normalize what is already happening is no way to (a) understand the severity of the problem or (b) provide any measurement of improvements, should they be attempted.
The data here are taken from January 2017. The analysis would have been published sooner but for a delay in receiving the data from the TTC, a problem that has now been rectified. As always, thanks to the TTC for providing the raw material for this work.
Although January is a winter month, the level of precipitation, and particularly of snow, was unusually low for Toronto, and so weather delays do not lead to anomalies in the data.
Toronto Precipitation and Temperatures for January 2017
The TTC’s current attitude to service reliability is to focus on conditions at terminals with the premise that if service leaves and arrives on time, then there is a good chance it will also be in good shape along the route. This is a misguided approach on two counts.
First and most important, there is little indication that service from terminals is actually managed to be reliable, and the “targets” in the standards provide a wide margin by which unreliability is considered acceptable. In particular, it is possible for services to leave termini running as bunches of two or more vehicles and still be considered “on target”.
Second, any variability in headway from a terminal will be magnified as buses travel along a route. Buses carrying larger headways (gaps) will have heavier loads and run late while buses closely following will catch up. The result can be pairs of buses operating at twice the advertised headway, and with uneven loads. Without active management of service at points along a route, the problems become worse and worse the further one progresses away from a trip’s origin. Again, the generous standards allow much of this service to be considered acceptable, and so there is no need, on paper, to actually manage what is happening.
TTC operators are a great bunch of people, overall, but the laissez faire attitude to headways allows those who prefer a leisurely trip across their route to run “hot” with impunity. The worst of them are, fortunately for riders, only a small group. The larger problem is the degree to which irregular headways are a normal situation across the system.
The balance of this article looks at several routes primarily for their behaviour near terminals as this matches the point where the TTC sets its targets, such as they are. To recap the Service Standards:
The TTC standards vary for very frequent (less than 5′), frequent (5′ to 10′) and infrequent (above 10′) services.
- Very frequent services target a band of ±75% of the scheduled headway.
- Frequent services target a band of ±50% of the scheduled headway.
- Infrequent service aims for a range of 1 minute early to 5 minutes late.
The charts which follow look at actual headways, not scheduled values, and it is clear throughout that the typical range of values exceeds these standards.
[For information on the methodology by which the TTC’s vehicle tracking data are analyzed, please see my article Methodology For Analysis of TTC’s Vehicle Tracking Data.]
Scarborough Routes
116 Morningside
For this route, I will go into more detail to establish the pattern and explain how the charts work for new readers.
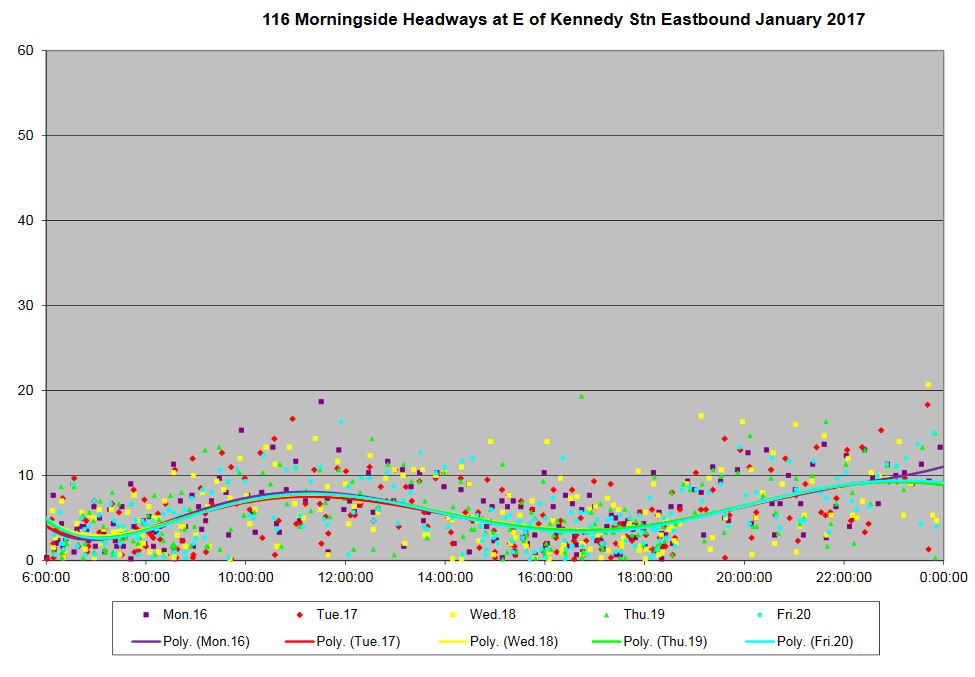
The MonthHeadways charts linked here illustrate the range of values of headways and the degree to which day-to-day values follow a similar pattern. Here is the chart for service leaving Kennedy Station in the third week of January.
- Each dot represents one bus, and
- the colours indicate the day of the week.
- The position of the dots shows the headway (vertical) and
- time of day (horizontal) of the vehicle.
- Trend lines are interpolated through the data to show the overall movement of values up and down through the day.
The source data come from the TTC’s vehicle tracking system (CIS) and include all vehicles on the route.
Generally speaking, the trend lines follow the scheduled headway through the day, and with all of these lines resting more or less on top of each other, it is clear that overall the service follows the same pattern through the week even though some days can show different patterns than others. Note in particular that if the headways become more spread out, but all buses are present, then the average will stay the same and so will the trend line. For example, Wednesday January 18 (yellow dots) shows more spread out values particularly in the afternoon and evening.
During all hours of service, the scheduled headway is 10 minutes or better, and by the TTC standards, this allows a variation of up to 50% of the scheduled value (even more in periods when it is below 5 minutes). The lion’s share of the data lie within these bounds, the service riders will experience is affected by the up and down of headways. All of the dots near the zero line are buses operating immediately behind their leader, in other words, a bunch.
This is the service as it originates from the terminal, and it is clear that buses leave more or less when they feel like it with little regard for the schedule. This is permitted by the lax nature of the standards.
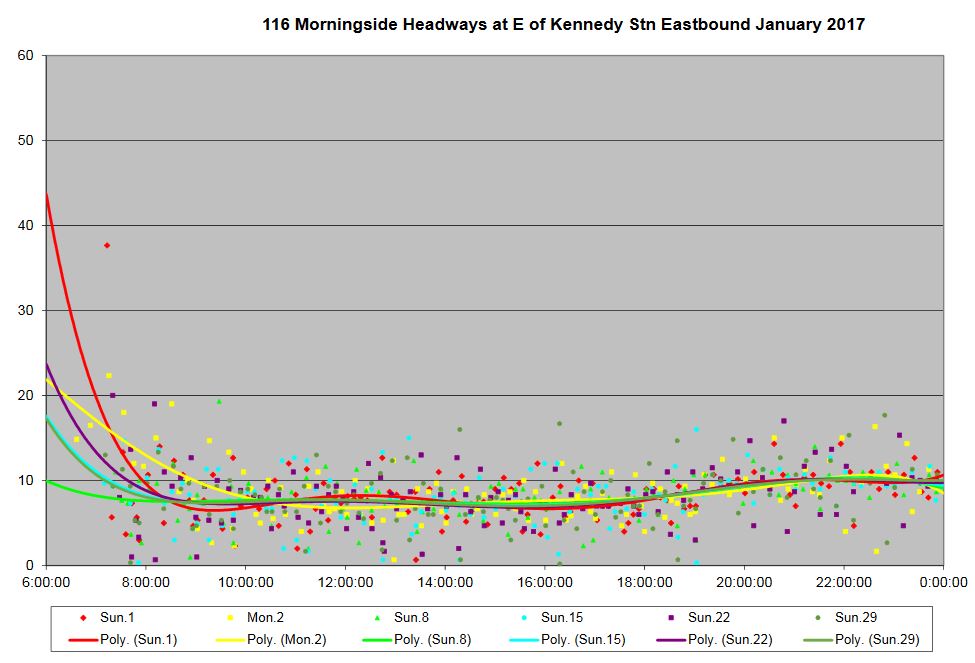
Similar charts are provided for Saturdays and Sundays, with the New Year’s Day holiday (Monday the 2nd) included as a Sunday. In the Sunday charts, the trend lines swing up at the left because frequent service does not start until after 7:00 am. Although the values here stay clustered around the average, many still lie well away from it and very short headways are not uncommon. The problem, as it relates to the standards, is a dual one: the acceptable window of headways is too wide, and the goal of achieving this only 60% of the time provides plenty of room for exceptions. Over one third of the service can be completely off schedule, but the line meets the “standard”.
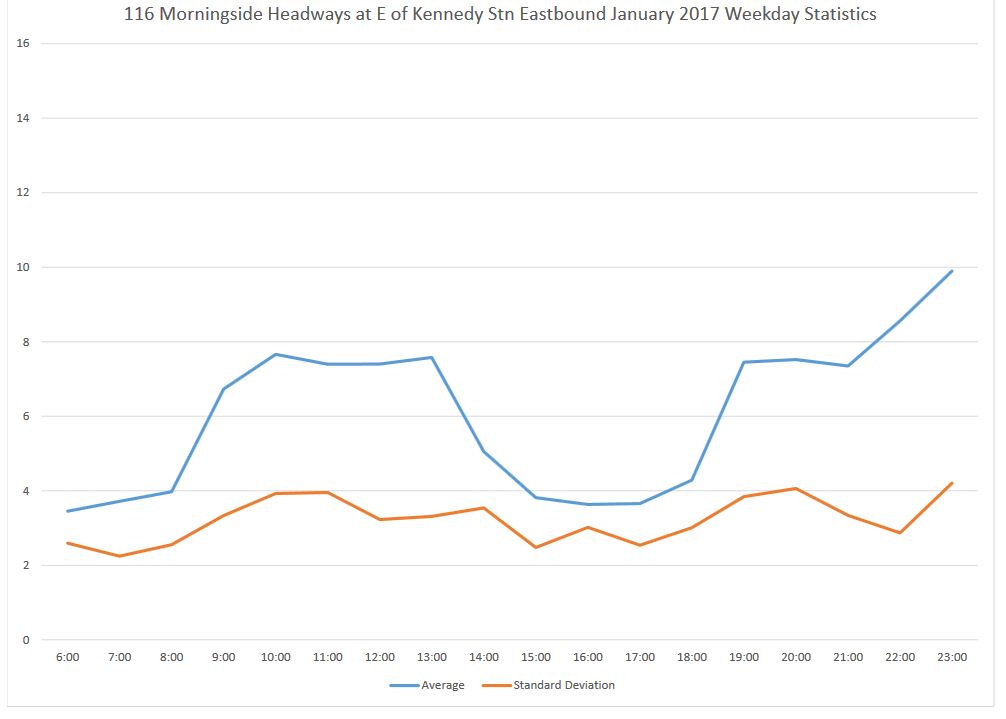
Also included in the sets of charts are mean and standard deviation (SD) values for the monthly data, subdivided by weekdays, Saturdays and Sunday/Holidays. The SD gives an indication of the dispersion of the values around the mean, and in most cases, two-thirds of the values lie within one SD of the mean value. If the SD value is, say, 3 minutes, then 2/3 of the headways lie ±3 minutes of the mean.
This is not the same as the +1/-5 range used in TTC standards for infrequent services, nor is it the same as the percentage variation allowed for frequent routes. However, it does give an indication of how closely a service actually operates to the mean headway which, except for very unusual circumstances, will equal the scheduled headway.
In the chart below, the average headway during peak periods sits at about 4 minutes, while for off-peak it is about 8 minutes. The scheduled headways in January actually were:
- AM peak: 3’33”
- Midday: 7’30”
- PM peak: 3’24”
- Early evening: 7’30”
- Late evening: 10’00”
Note that these values apply to a range of hours, and the point where a route will transition from one period to another depends on the schedule design.
When the SD and the mean are close together, there is a very good chance that service will be bunched. In the chart below, when the headway is supposed to be 3’30”, there is a good chance that this will actually be pairs of vehicles running close together on a wider spacing.
116_201701_SB/WB_EofStaines_MonthHeadways
116_201701_EB_EofKennedyStn_MonthHeadways
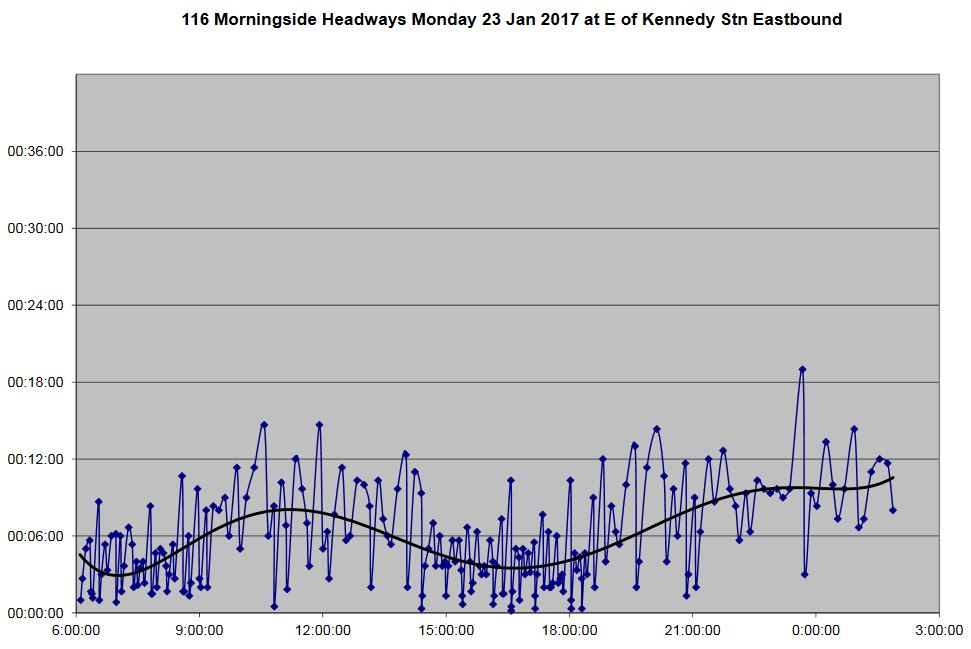
One can look at the data in greater detail to see how headways evolve along a route. I have omitted these charts for this article but wanted to include a few to demonstrate the problem arising from irregular service right at the route’s origin.
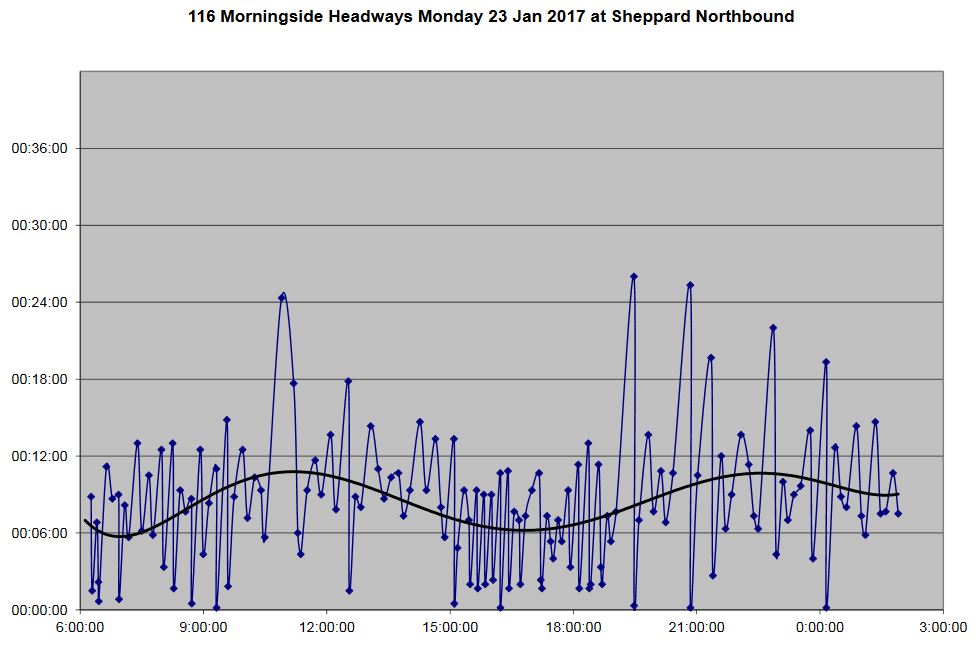
The chart below shows the data for buses leaving Kennedy Station on Monday, January 23, 2017. This is not a service that riders would deem to be “reliable” considering how often buses run close together with correspondingly wide gaps. Bad as this looks, it is a typical chart of this type for TTC service. If one steps through the pages of charts within the Headways files, one can see how the peaks and valleys evolve along the route, and the effect as short turns (scheduled or otherwise) drop out of the mix.
The chart below shows the same day by the time buses arrive (if they do) at Sheppard and Morningside northbound. Waiting over 24 minutes for a bus, especially when two are running as a pair, is simply unacceptable.
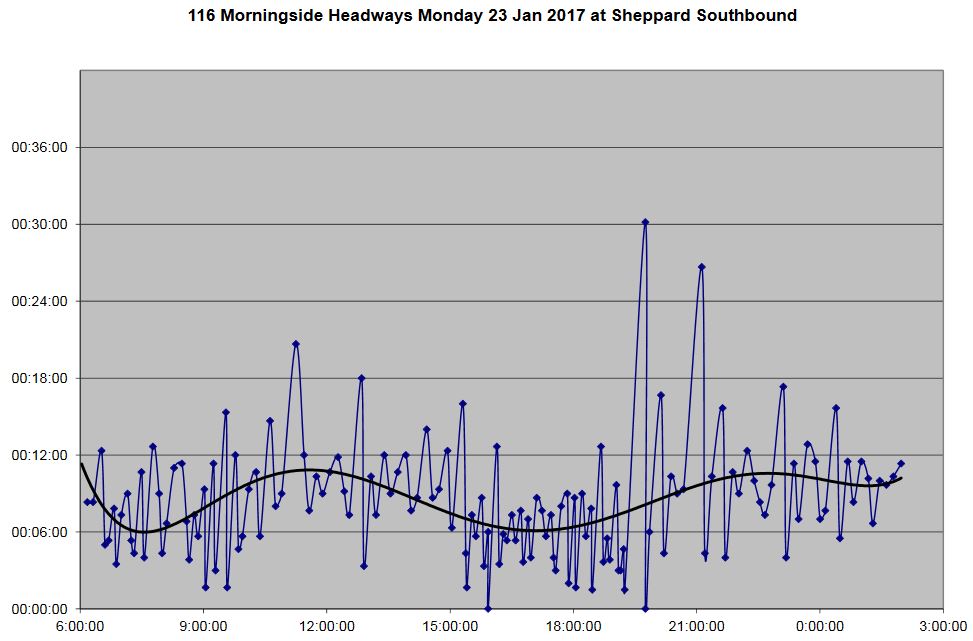
Lest there be any delusion that all this gets fixed out at the terminal and service is beautifully close to schedule inbound, here is the southbound service returning from the loop at Staines Road.
86 Scarborough
Scarborough is a twin of Morningside in that they share the inner part of their route and are scheduled to have blended headways during the less frequent periods of operation. Like Morningside, Scarborough runs with erratic headways, and this makes any true blending impossible. I will explore this in more detail in a separate article on these two routes.
Service eastbound from Kennedy Station shows the same pattern of dispersed headways and much bunching, except on Sundays when the headways stay tightly clustered around the mean value. This is reflected in low SD values for these days. It is possible to have properly spaced service, just rare.
Service southbound from Sheppard is similarly erratic, although again with better behaviour on Sundays than other days of the week.
86_201701_SB_Sheppard_MonthHeadways
86_201701_EB_EofKennedyStn_MonthHeadways
54 Lawrence East
Service westbound from Starspray Loop shows the same characteristics seen above, but at a grander scale because this is a branch at the outer end of the line. Weekend service is appalling, notably on Sunday when gaps of half an hour or more are common, and the SD values lie in the eight minute range.
By the time the westbound service reaches Markham Road, it has been joined by the Orton Park short turns. Headways are still scattered over a wide range, but not as severely as at the east end of the line. The weekday SD value runs close to the mean, particularly during peaks, indicating that buses tend to run in pairs. An important issue for branching routes is that they merge together with truly “blended” services, but there does not appear to be much attempt to make this actually happen.
Eastbound service at Midland (east of Lawrence East Station) also shows erratic headways even though the RT station would provide a convenient point to dispatch buses and “reset” headways arriving from further west on the route. Similarly, westbound at Kennedy (the other side of Lawrence East Station) shows headways that indicate no effort at bringing back some regularity.
54_201701_WB_Starspray_MonthHeadways
54_201701_WB_MarkhamRoad_MonthHeadways
54_201701_EB_Midland_MonthHeadways
54_201701_WB_Kennedy_MonthHeadways
95 York Mills
York Mills shows all of the characteristics seen on other routes, and it has particularly bad Sunday service particularly outbound from York Mills Station.
95_201701_WB_MorningsideAve_MonthHeadways
95_201701_EB_EofYorkMillsStn_MonthHeadways
85 Sheppard East
Sheppard East has two separate segments, with the major one running east from Don Mills Station to Rouge Hill Station. Meadowvale is a turnback point for some service with the through runs continuing to Rouge Hill GO.
Service from Rouge Hillis infrequent. Although it can be well-behaved at times, at others there are very wide gaps and occasional short headways. By the time we reach Meadowvale and pick up the more frequent service, headways are better (although not ideal) on weekdays. On weekends, particularly Sundays, they are badly scattered. This could well be due to the problem of poorly blended services, but I will leave that to a more detailed review of the route.
Eastbound service from Don Mills Station is better behaved with SD values regularly in the 2-3 minute range. This is not ideal, but far better than the westbound service.
85_201701_WB_NofRougeHillStn_MonthHeadways
85_201701_WB_WofMeadowvaleRd_MonthHeadways
85_201701_EB_FairviewMallDr_MonthHeadways
West from Don Mills to Yonge is a surface bus intended to supplement the subway for local stops and for riders who find getting to a subway station difficult. The service does not operate frequently, and tends to be more reliable eastbound from Yonge than westbound from Don Mills.
85_201701_WB_WofDonMillsRd_MonthHeadways
85_201701_EB_EofYongeSt_MonthHeadways
39 Finch East
Finch East runs a split service with some runs going through to Morningview Trail, but most turning back further west. The charts below show service at the outer end of the line, and at Markham Road inbound. From the terminal, headways are badly scattered, and SD values of five minutes or greater are not uncommon. Further west at Markham Road, the service is a bit better, although Saturday evenings are something of a mess with erratic headways.
Outbound from Finch Station, off peak headways are somewhat better behaved, but the peak period sees many buses operating in bunches. With a scheduled AM peak headway of 3′ and PM peak of 4′, the 75% target factor leaves a fair amount of room for “acceptable” bunching. On a 3’00” headway (180 seconds), a deviation of 2’15” (135 seconds) is allowed. On a 4’00” headway, the deviation can by up to 3’00” and still fall within the target.
Having said that, there is a point below which dispatching “on the clock” (even assuming there is any dispatching at all) will not do much to prevent buses from running together if only because the traffic signal system will marshall them into multiples of the cycle time.
39_201701_WB_WestofLittlesRoad_MonthHeadways
39_201701_WB_MarkhamRoad_MonthHeadways
39_201701_EB_FinchStation_MonthHeadways
Downsview Routes
7 Bathurst
Bathurst buses leave Steeles southbound on an already-erratic headway with SD values typically of four minutes. For a route that is supposed to be part of the “ten minute network”, the headway leaving the terminal is smeared out over a wide range. The situation is not quite as bad northbound from Bathurst Station where the weekday offpeak has an SD running at about 3 minutes. The service, however, is hardly running like clockwork.
There is a particular irony in the behaviour of this route because TTC staff at Hillcrest are subject to this service every day.
Note that the lower-than-normal headway on the weekend of Jan 21-22 is due to the extra service operated in parallel to the Spadina subway which was closed for signal testing. Note that even with (or possibly because of) the extra service, there is a fair amount of bunching.
7_201701_SB_SofSteeles_MonthHeadways
7_201701_NB_BartonAve_MonthHeadways
29 Dufferin
There is little new in the Dufferin charts compared to previous analyses of this route. Buses leave from both terminals over a range of headways that fit with the standards, but which produce erratic service with a lot of bunching right from the ends of the line.
29_201701_SB_TransitRoad_MonthHeadways
29_201701_NB_King_MonthHeadways
41 Keele
The Keele bus has been subject to a great deal of disruption during the TYSSE construction, and to a lesser extent by the Crosstown work at Eglinton. Headways from both ends of the route vary substantially from the average with bunching and wide gaps common.
41_201701_SB_SouthofYorkBlvd_MonthHeadways
41_201701_NB_NorthofKeeleStn_MonthHeadways
36 Finch West
Finch West, as we have seen in previous analyses, typically runs with varying headways and a lot of bunching, particularly in the latter part of weekdays. This situation applies to service in both directions.
An important issue for both Finch and Keele is that these routes are coming out of a period where construction delays would have been used to justify simply making do with whatever service happened to operate. This can easily become an accepted practice even as conditions improve, and the results for January suggest that nobody is minding the store to ensure service reliability on these routes.
36_201701_EB_HumberwoodNofLoop_MonthHeadways
36_201701_WB_Yonge_MonthHeadways
Downtown
6 Bay
I included the Bay bus here because this route was plagued with congestion during the reconstruction of Front Street and Union Subway Station. That work is now completed, but headway reliability from both ends of the line is unreliable particularly in the offpeak and on weekends.
For years, this route carried heavily mainly between Bloor Street and the government/university area north of College. South to the lake was a comparatively sleepy run. Now, with George Brown College on Queens Quay (the bus loops at the building), there is a new demand that previously did not exist. However, the quality of service actually provided to the campus is at times not an encouragement to use transit.
(Note that for both ends of the line, I have measured headways at a point far enough from the terminal loops that the effect of varying locations used for layovers by operators do not skew the numbres.)

I’d be interested in the following numbers for each route…% of busses at a terminal that arrive before they should, and then leave before/after they should….this should be impossible, and the number should be close to 0…if a bus arrives before it should, then it should leave on time…no matter what…
Maybe to map all these into bands arrived early and leaves (-3, -2, -1, 0, 1, 2, 3, 4, 5+) minutes later than it should….I’d say a measurement of good management would be that it’s a bell curve on 0….but I doubt we’d see that.
Steve: The problem for me is that to produce such a report, I would need the schedules of all of the runs. Being “on time” is a simplistic view of actual headway management, especially on routes where service routinely runs off schedule (streetcar lines) and headway is far more important to riders than on time performance. When a bus is scheduled to arrive every 3 minutes, do you care which one it is?
My interest is far more in headway regularity than schedule adherence. Something that does show up in a different plot not included in this article is the length of time spent at a terminal. It is not uncommon to see vehicles leave on varying headways after layovers of varying lengths. To put it coarsely, “I’ve had a long enough break and suppose it’s time to go”. This behaviour is aided by the padding in schedules that means ops either have to dawdle to stay on time, or know they can take extra layovers and then get back “on time” enroute. Given what is considered an acceptable variation from schedule and headway, this means the behaviour does not trigger any flags.
LikeLike
Exactly, and if we are looking at a route like that – departing on time, should be based on the minutes after a previous run. I have an easier time understanding why this would not be the case on a route where the buses are scheduled at 15 minute + intervals, where there are specific times they are supposed to be at a stop. However, when you are supposed to have a headway of 7 minutes, and you are looking at times where it is nearly 3 times this. The impact on the perceived viability of service must be extreme. There needs to be a system that both tracks the time of departure of the previous bus, and communicates this. There should not be situations where you have 3 buses leave in 10 minutes on a 7 minute headway, unless it is to address a known load.
LikeLike