
Among the reports to be considered by the TTC Board at its May 18, 2017 meeting is one titled Update to TTC Service Standards.
[Note: Page numbers cited in this article refer to the PDF containing the report as a whole. Individual sections have their own pagination which does not necessarily correspond to the page numbers of the overall document.]
This is something of a misnomer because the report does not actually propose many new standards, but merely consolidates in one place practices that have evolved over past years. Some of those standards are are self-serving in that they codify “business as usual” practices including some “targets” that produce laughably inferior, but “acceptable” service.The report contains no discussion of the potential shortfalls in the standards it asks the Board to endorse. Absent is any sense that things should be better, and that actively understanding and managing how routes operate is required. Better service quality is what riders demand, and a laissez faire approach is the last thing the TTC needs.
The current standards arise from an extended period dating back to the Ford era in which pro-active service improvements based on better standards simply stopped, a sacrifice to the gods of “efficiency” and “saving taxpayer dollars”. The standards have been fiddled with to minimize the worst of Ford’s cutbacks, and more recently to implement revised performance standards intended to lead to better service. The constrained environment in which the TTC still operates is clear:
This update to the TTC service standards took a no cost approach. The updated service standards reflect existing conditions with the goal of continuous improvement over time. [p. 1]
Although leaving standards as they are might be a “no cost approach”, what is missing from this 100-page document is any review of the degree to which the system actually achieves the standards it claims to follow. Recently, the TTC has acknowledged that both the King and St. Clair routes are running 25% above standard thanks to the streetcar shortage and resultant crowding, and of course the large number of buses diverted to streetcar routes could be used to improve conditions on the bus network. However, absent a system-wide view of the shortfall, the TTC Board, City Council and the general public have no idea of just how bad the situation is except, of course, for those riders jammed into vehicles or who give up on the TTC. As to route performance data, the TTC has not published any for two years even though this item is part of their Customer Charter.
Running more service costs money, and yet with fleet constraints, the TTC has been able to keep its demands for added subsidy lower than they might have been otherwise. Only about half of the “investment” in better service announced with great fanfare by Mayor Tory early in his term actually appeared in the TTC budget.
The last system-wide review dates back to April 2008 near the end of Mayor Miller’s term.
The context for “standards” is quite clear in the following statement:
The TTC currently makes use of a number of standards to plan new service and monitor and adjust existing service. These standards have been in place for a number of years and some are updated frequently. For example the TTC applies vehicle crowding standards to define the upper limit of what is an acceptable level of crowding for each type of vehicle at both peak and offpeak times. This standard is often updated based on fiscal realities. [p. 5]
Fiscal realtities may affect what the TTC can afford, but they should not alter what the TTC aspires to be. If there is a shortfall, then the effect of that shortfall should be known. This informs both the decision to make budget cuts (what are the effects) and lays out for future planning where and how much the system should be improved. We have rapid transit plans stretching decades into the future, but don’t know how short Toronto falls in providing day-to-day service on its bus and streetcar network. We have endless touch-feely “customer service initiatives”, but the most important of all – service – falls by the wayside. This is not to downplay good customer service, but riders might be forgiven for taking little comfort in spiffy new maps when the services they illustrate are overcrowded and unreliable.
The report claims that the TTC conducted a peer review of standards in other major cities. None of the information from such a review appears in the report.
Internal discussions among various TTC departments yielded the following observation:
All stakeholders noted that the most important improvement the TTC could make is improving service reliability on all modes. [p. 8]
This leads to revised metrics for productivity and reliability, but it is unclear whether these will actually improve service on the street.
Although the lion’s share of the report deals with a rider survey of attitudes to service quality, I will leave that topic until later in this article so that the nominal purpose of the report, Service Standards, is more than the afterthought it appears to occupy in the TTC’s report.
Service Standards
To put this discussion in context, here are the purposes of the Service Standards as set out by the TTC.
Service standards are the process by which the TTC plans and evaluates transit services. The TTC has two major objectives in planning transit services:
- to maximize mobility within the City of Toronto by ensuring that public transit is provided in the right places, at the right times, to satisfy the changing travel needs within the community
- to ensure that all transit services operated by the TTC are as efficient and cost effective as possible and, therefore, affordable to both TTC customers and citizens
…
The service standards provide a formal mechanism for measuring trade-offs in an objective and equitable way. The service standards are decision rules and guidelines that are:
- grounded in business logic and principles
- transparent, quantifiable, reproducible
- applied consistently, fairly and equally
The service standards provide a systematic and objective means of planning, monitoring, adjusting, and evaluating conventional transit services throughout the City of Toronto. [p. 71]
In the context of overall TTC planning, the matters of cost-effectiveness, business principles and consistency should merit a combination of laughter and despair, but we will take this at face value. The bitter irony is that the say-to-day service is subject to a level of scrutiny that the megaprojects evade.
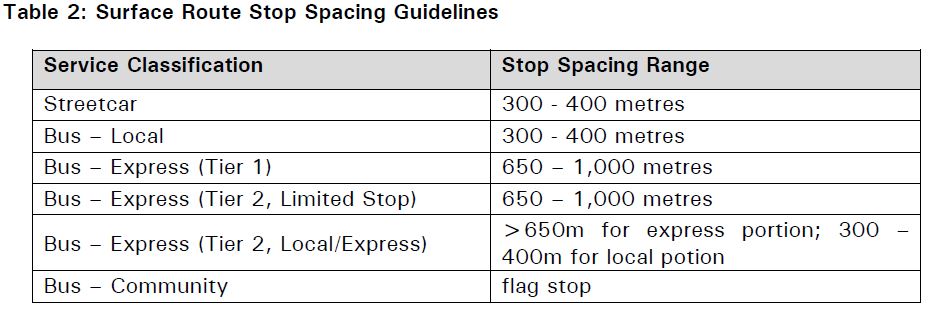
Network Design
The TTC operates a network of subways, streetcars and buses, and within the latter group there are four subdivisions:
- local service,
- tier 1 limited stop services operating from 6:00 am to 10:00 pm at least every ten minutes,
- tier 2 limited stop services operating during peak periods at least every fifteen minutes,
- community buses.
Key design principles include:
- Accessibility: This is less a “principle” than a case of waiting for vehicle procurement and station reconstruction to catch up with mandated requirements. It is self-evident that no new infrastructure would be placed in service without this.
- Grid network: Long a precept of TTC planning, a grid avoids the creation of point-to-point routes gerrymandered around specific local (and sometimes political) desires. This principle is routinely broken where many routes converge on a subway terminal.
- Network connectivity: Transfers between routes are an inevitable effect of the network structure, and these should be made as seamless as possible.
- Directness: Routes should be as direct as possible except in cases “where the benefit to customers of the diversion exceeds the inconvenience to all other customers”. See “grid network” above.
- Duplication: Generally speaking, multiple routes will not serve the same corridor except where this is a side-effect of routes feeding into a subway station or branched routes converging.
Coverage and Access principles set out the general rules for where transit service should be provided. Different factors apply to regular and “blue night” services.
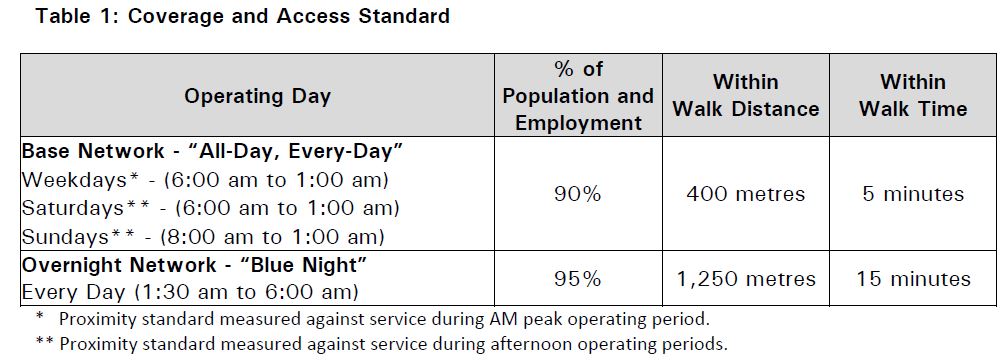
Finally there is a standard regarding Early/Late Connections that surface routes will be scheduled to connect with first/last rapid transit services. This is generally the case, but there is also a reference to “core service hours”, and not all routes operate until the end of subway service. The “base network” as described above runs until 1:00 am although rapid transit services continue for some time afterward. This “standard” is out of sync with the network as it actually operates.
Quality of Service
The TTC sets a minimum frequency of service for its routes, although few services actually operate as infrequently as these values might suggest. The “standard” is intended to allow marginal services to operate at a low cost.
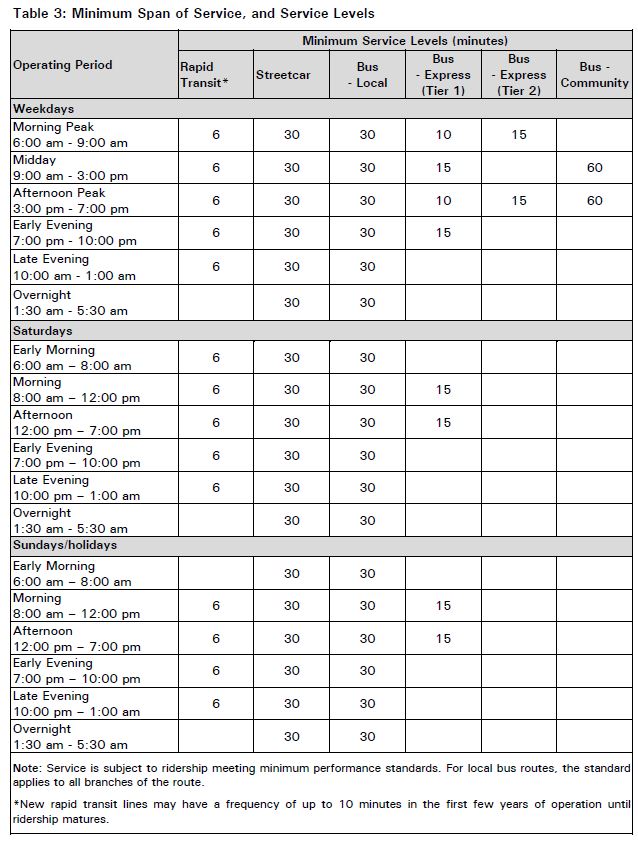
The footnote about “new rapid transit lines” is particularly interesting in light of the impending opening of the TYSSE. Whether this implies that service to Vaughan might not be as frequent as riders are accustomed to within the City of Toronto remains to be seen. Other future services include the LRT lines, notably the Crosstown. An important issue here is that wide headways, even if they are operated on a reliable basis (something well beyond the TTC’s abilities on many routes), can add substantially to travel times and offset the perception that a new service is as convenient as hoped for.
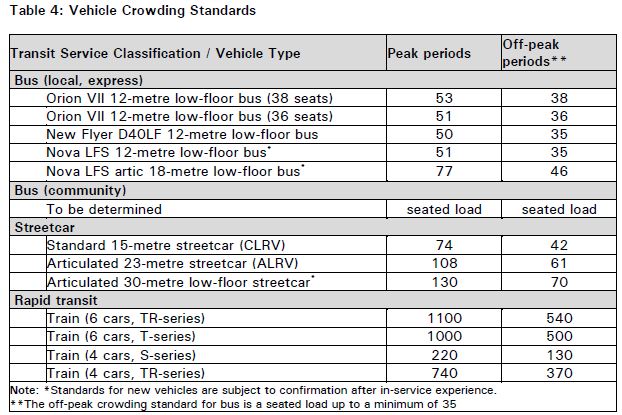
The loading standards vary by type of vehicle and time of day. These are supposed to be averages, and so the effect of bunching and gapping which concentrates passengers in certain vehicles does not trigger a breach of the standards even though it gives the “average” rider a very different view of service quality than the standards imply.
On the subject of Service Reliability, the TTC has been tweaking the targets by which it measures “reliable” service, a not-unreasonable task considering that reliability ranks very highly as a bugbear for riders (see the survey results later in this article).
The standards rightly observe:
Passengers using high-frequency services are generally more interested in regular, even headways than in strict adherence to published timetables, whereas passengers on less frequent services expect arrivals/departures to occur as published. [p. 81]
The standards look at on time departures and arrivals at terminals with the premise that service in between these points will look after itself. In fact, as any rider knows, this is not true. The standard is that within a window of 1 minute early and 5 minutes late, 90% of trips should depart and 60% should arrive “on time”. The fundamental problem here is that with six minutes’ leeway, service can be badly bunched and still rank as “on time” making a mockery of the concept of a “standard”.
Headway performance is a related topic, and there are different goals depending on the scheduled frequency of service.
The TTC proposes that the standard vary for very frequent (less than 5′), frequent (5′ to 10′) and infrequent (above 10′) services.
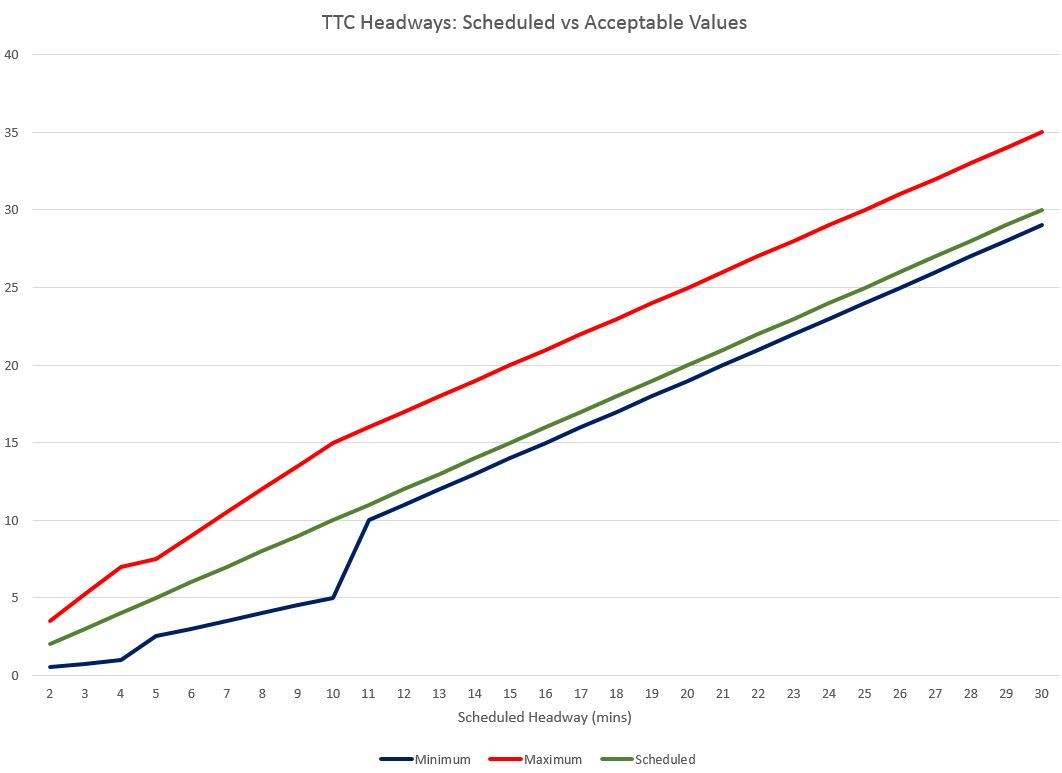
- Very frequent services would target a band of ±75% of the scheduled headway.
- Frequent service would target a band of ±50% of the scheduled headway.
- Infrequent service would use the same -1’/+5′ standard as the “on time” performance metric.
This produces rather strange results when one charts the effect. The charts below are my own based on the values set out in the TTC’s standards.
The first chart shows the allowable range of headways based on the TTC standards. Of particular note is the widening range of “acceptable” headways for services up to every 10 minutes. It is considered perfectly within target to have two buses 5′ and 15′ minutes apart on nominally a 10′ service. When the headway goes above 10′, the tighter six-minute window applies. This is a ludicrous situation where frequent services would be allowed to operate less reliably than infrequent ones. In the chart below, the acceptable range of headways lies between the red and blue lines, with the green line indicating the target value.
Another way of looking at these numbers is the ratio of permitted minimum and maximum headways to the target values.
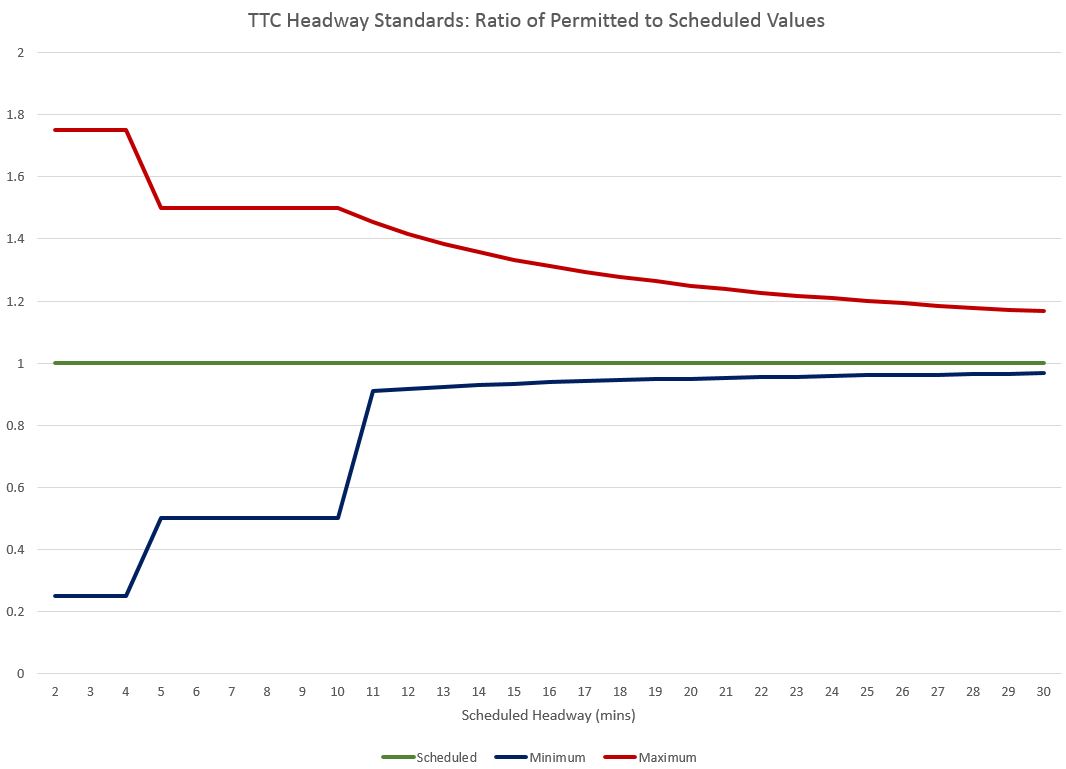
At 10′ and below, the ratios are flat because they are set as a percentage of the headway. Above 10′ the ratios converge on the target value because the fixed leeway becomes smaller relative to the scheduled headway as it rises.
As if this were not bizarre enough, the TTC aims to hit these metrics only for 60% of trips over the entire service day. This is no standard at all, and simply will allow the TTC to report that it is hitting targets when service is actually a complete shambles. (I will turn to the details in a separate article about actual performance of a selection of routes.)
Finally, the TTC seeks to minimize “missed trips” and “short turns” without setting any standard for just what this might entail, or any reporting requirement.
As for the rapid transit network, the standard requires that headways should fall within ±100% of scheduled values. In other words, for the typical 4′ off-peak service, gaps of up to 8′ are acceptable. This “standard” has the nonsensical effect of making a service where only half of the trains are actually present report that it meets standard. 95% of trips are expected to operate within this extremely generous target on an all-day basis.
Another problem arises with the nature of gaps and bunches in the subway. Typically, if there is a big delay, the result is one long gap followed by many closely-spaced trains. Because the stats are recorded per train, there is only one train that is outside of standard, and the rest show up as just fine.
The result is that the subway “on time” metric routinely shows a very high value that bears little relationship to the service riders experience including the inability to board the gap train or several of its followers.
As to route capacity, the goal is to operate at least 90% of the scheduled service past the peak point during the peak hour. This actually fit with what the TTC manages to achieve on its major rpid transit lines, but in effect tells everyone that capacities claimed for these routes will not be reliably available even when the service meets its targets.
Productivity
During the Ford era cutbacks, the determination of which services would survive was based on boardings per vehicle hour. A “boarding” is one passenger getting on one bus or streetcar, and a typical trip will involve more than one boarding distributed over routes in the system. An obvious requirement for such metrics is that riding counts must be accurate, and this was a matter of some controversy as periods of service were cut to fit the Ford targets.
The principle remains in the standards as set out in the table below.
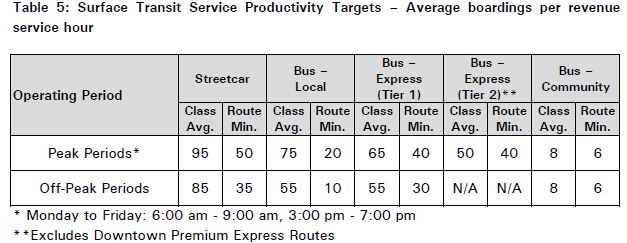
It is unclear here what kind of “streetcar” or “bus” these standards reflect given that vehicles of multiple sizes and capacities exist in the fleet.
The Downtown express routes continue to live a charmed life with exemptions from any sort of standard. Almost all of them exist because of political sponsorship even though they do not represent a “productive” use of TTC vehicles.
The intent of this table is that, for example, the bus network as a whole should have 75 boardings per vehicle hour over the entire service during peak periods, with a minimum for any specific route of 20.
No values are cited for the existing network, and so there is no sense of just what these standards mean relative to service as it now operates.
The TTC used to concoct a value of “net cost per passenger” but this vanished from the standards and route reporting years ago. The basic problem is that the numbers are meaningless, but this does not appear to have stopped the bean counters at the TTC from reintroducing this metric into the standards.
The calculation is simple and deeply flawed:
(Route operating cost per boarding) – (System average fare per boarding)
In a flat fare system, the average fare bears no relationship to the resources consumed to transport a rider. Past attempts to calculate this value have always produced absurdly “profitable” routes that are almost always quite short, or whose demand characteristics involve many short trips. The two kilometre long Coxwell bus was always the star of the system with lots of bidirectionl demand and very short average trips. On paper it “makes money” hand over fist. The fact that a rider might then take a much longer subway trip is not part of the equation.
A further distortion arises with riders whose trips involve more than the system average of two boardings per trip. On a route-by-route basis, they contribute more revenue than they actually pay. Conversely, a one-seat ride contributes less revenue than the rider pays, and so routes with many such trips do not receive their “share”.
Route restructuring that adds or removes transfer connections (for example the Coxwell/O’Connor hookup that recently ended, or the new linkages between routes at Royal York Station), can change the number of “boardings” without changing the number of riders or fares collected. Revenue allocated to the routes may change, but this is simply the effect of counting the same passenger a different number of times.
Various efforts were made to correct for these problems, but the fixes become as complex as the original scheme, and in time this metric was abandoned.
A related metric is the change in ridership per net dollar. This number arises from a convoluted process that is, like the cost per passenger, a suspect calculation.
The first step looks at the standard calculation for potential ridership and revenue losses when there is a fare increase.

This calculation says that if there is a 10% fare increase, the system would lose 10.7m riders, and the subsidy would go down by $86m thanks to net new revenues. Right away, there is a bias in what the formula seeks to achieve – a reduction in subsidy. What is not mentioned is that any fare increase would occur in the context of inflationary increases in the cost of system operation and possibly of service expansion. It is by no means clear that $86m added to or removed from the system would produce the calculated .12 change in ridership per dollar.
Riders react to service quality, and if that quality drops, then by “saving” that subsidy, more harm has been done than simply losing 10.7m rides and charging everyone else more.
The proposed application is described thus:
The standard is applied this way: If additional subsidy is available, new services will not be introduced if the number of customers gained per dollar spent is below 0.12, as the additional funds would be better spent to defer or decrease the average fare in order to grow ridership. Services which are on trial will be eliminated if the number of customers gained per dollar spent was below 0.12. Other services which are already being operated will be modified to reduce their costs or to increase fare revenue if the number of customers gained per dollar spent is below 0.12. If no suitable changes can be found for routes on which the number of customers gained per dollar spent is under 0.12, and if service reductions are required, either because of declining ridership or reductions in funding, then these services would be recommended for removal. [p. 98]
A further problem here is that the non-linearity of elasticity figures is well known. For small changes, riders may grumble, but the effect of a higher fare can be negligible. A 10% fare hike, the value used for this calculation, is equivalent to raising the adult token fare by $0.30, a much higher increase than anything that has been imposed for many years. This begs the question of what degree of change is appropriate as a starting point.
As planning methodology, this calculation is bankrupt because one cannot equate ridership changes based on a situation where only the fare changes on a system wide basis, to situations where multiple changes occur at once (fares, cost of operation, overall service quality), much less to route-specific changes such as service improvements. The decisions riders make for each circumstance will not be the same, and to pretend that this is true is a bogus process.
Moreover, there is no complementary calculation saying “if we take X dollars of subsidy out of the system, and cut service, here is what happens”, or conversely that “an investment of Y dollars could produce an improvement” based on a change to service quality.
It is no secret that riders are more sensitive to service quality than to fares, and yet the TTC proposes a calculation that ignores service as part of the equation. Further problem arise with the difference in behaviour by those who are regular users, possibly with a flat-fare pass and a lower-than-average fare per trip, let alone a future situation where fares may differ depending on the mode and/or distance travelled.
The process described above can be boiled down to this: keeping fares low is more important than providing more service, even though getting more people on the TTC and out of their cars is a basic reason the transit system exists, and that depends at least as much on service as fare levels.
Warrants for Service Changes
The TTC divides potential changes into two classes, minor and major, basically depending on whether the change is an adjustment to something that exists, or the complete removal or addition of service. “Major” also includes any change that has a cost/resource implication.
To evaluate potential changes, planners weight various components of affected trips to reflect that some “time” is more negatively perceived by riders than others.
Trip component weight:
- Each minute of in-vehicle travelling time 1.0
- Each minute of waiting time 1.5
- Each minute of walking time 2.0
- Each transfer 10.0 [p. 89]
There is no question that transfers are a major pain in the butt, especially if service is unreliable and the location of the transfer exposes riders to the worst that weather and Toronto road conditions might present. In that context, there is a strong weight toward one-seat rides despite the network design goal of building a grid.
Crowding levels are compared to the standards, and if they are at 95% or more for at least six months, this should trigger a service improvement, or a restructuring to better match how vehicles are used with the locations of demand (e.g. scheduled short turns, branches). If a route runs below 80% for six months, service would be reduced provided that this does not simply cause the route to bounce up to the 95% level (this is possible on routes with few vehicles where fine-grained changes are impossible).
For express routes, the warrants differ for Tier 1 (Rocket) and Tier 2 (“E” branches).
Tier 2 services are expected to be at least 10km long with travel time saving of 20% or better. In the case where a route is shorter, riders should be travelling over 60% of the length of the route rather than making point-to-point journeys along the way. These routes would operate only during peak periods.
Tier 1 service should meet all of the Tier 2 warrants, and be intended to support a large weekday ridership of 10k or more over a service period from 6:00 am to 10:00 pm.
When an express service is implemented, local service will probably be reduced, although the criteria vary depending on circumstances:
- If the existing service runs every 10 minutes or better, it should not be cut by no more than 50%. This produces the anomalous result that a local frequent service could become substantially less frequent, but this would depend on the ratio of demand between a potential express service (and its stops) versus the local service.
- If the existing service runs at over 10 minutes, it should be cut by no more than 25%.
- If the existing service is on the 10-minute network, it should not be changed.
Community Buses are special cases where there is an attempt to reduce the need for Wheel-Trans trips in neighbourhoods where there is both a concentration of riders with mobility issues and destinations to which they wish to travel. [see p. 93]
Service Evaluation
The TTC proposes to resume production of annual performance reviews and a route enhancement plan. This is long overdue, together with detailed reporting of how well the system achieves even the less-than stringent metrics on a route by route basis. Of particular concern is the matter of latent demand, the degree to which riders are not on TTC routes because the service is so unreliable and/or crowded.
Service reliability is a matter of route management, but the “standards” for acceptable operation give a wide berth for erratic service and “gaming” the system by operating staff. It is not sufficient to set an easily achieved target and then to “hit” it. The fundamental questions are what these targets should be to improve rider perceptions of the network, and what steps are necessary to achieve them.
The Survey of Riders
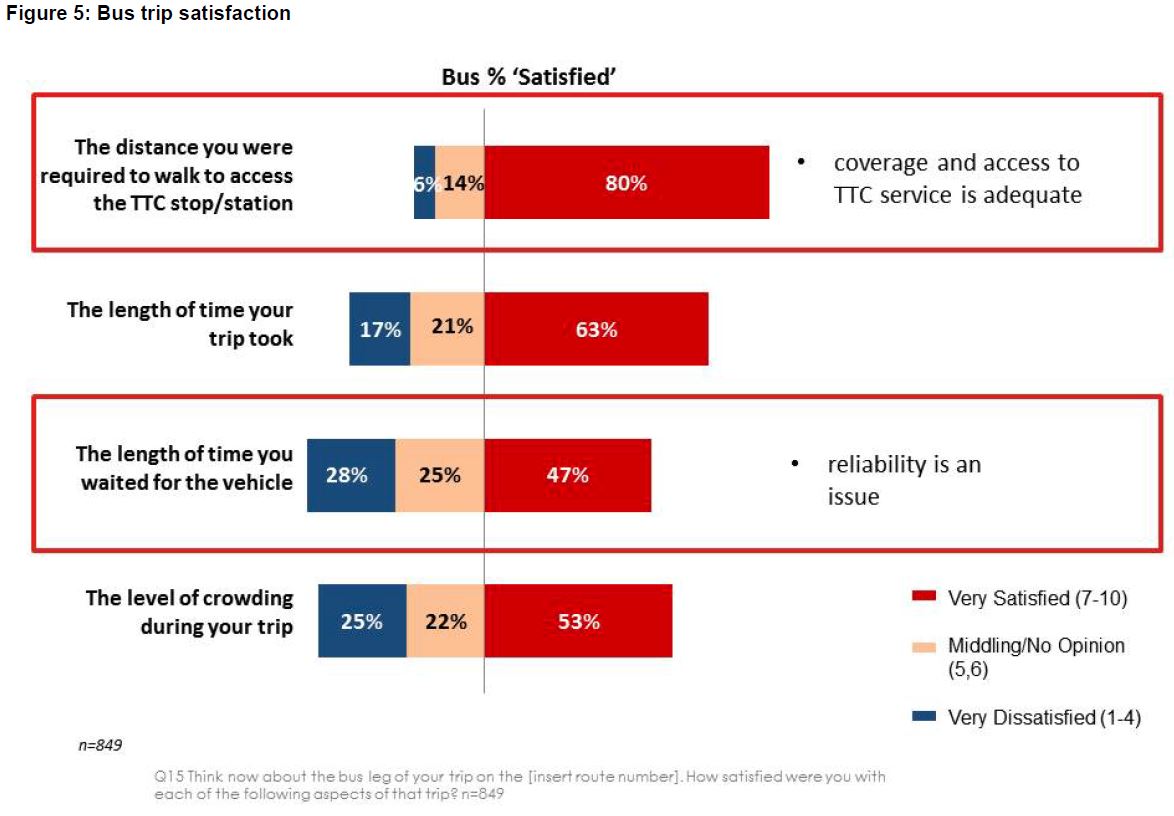
An online survey, whose results occupy a large portion of the report, reaffirmed that riders are unhappy about waits for service, irregular arrivals and crowded vehicles.
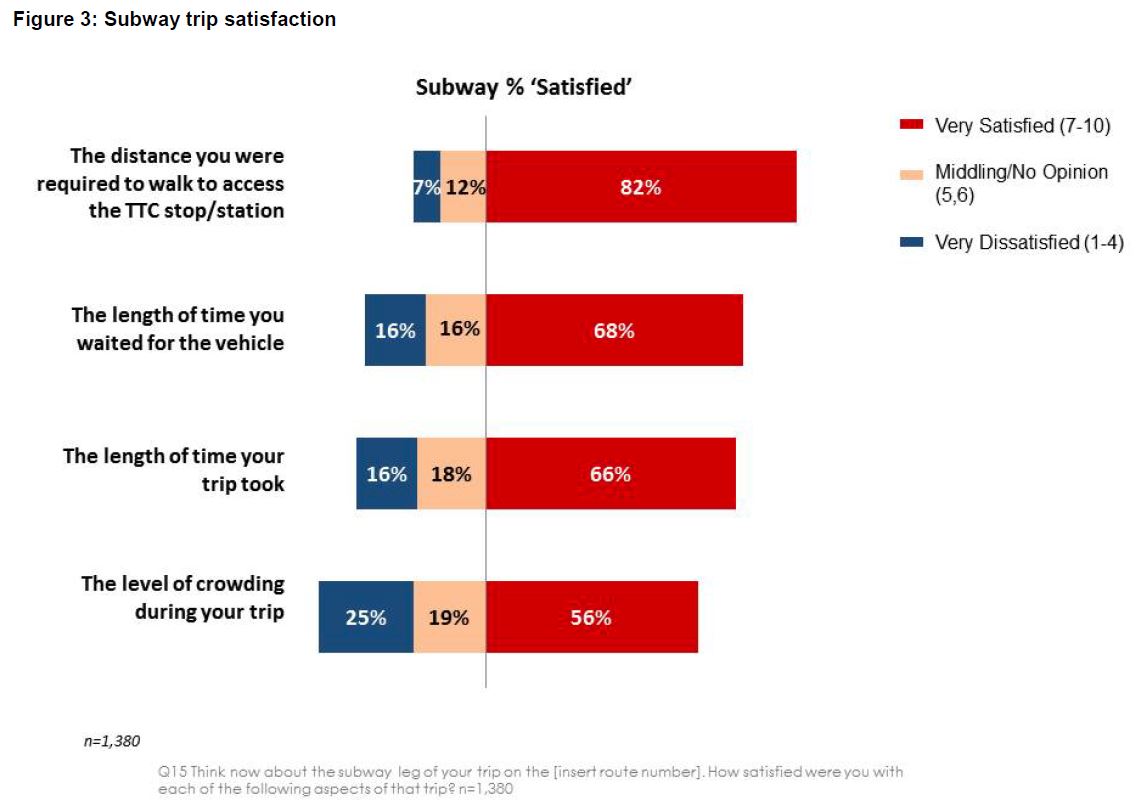
For bus and streetcar, the majority of respondents were not very satisfied with the length of time they waited for their TTC vehicle to arrive. This is an indication that a combination of both service frequencies and service reliability is an issue. Further to this, streetcar respondents were also dissatisfied with the level of crowding on their trip. The existing streetcar fleet is very much constrained; the delivery of the new low-floor streetcars should help resolve some of these issues. Satisfaction is the highest among subway respondents. [p. 8]
Although bus riders are less unhappy about crowding than streetcar riders, the results are hardly a glowing endorsement with only 53% of bus riders “satisfied”. Indeed, subway riders at 56% percent are only marginally better.
The level of dissatisfaction shown here is also much higher than in the TTC’s rolling Customer Satisfaction Survey indication that at the very least different populations are responding, and moreover that the questions asked elicit different responses.
Reliability is a big issue for both surface modes with less than half of riders satisfied with the wait time for vehicles.

A very substantial portion of TTC’s ridership is unhappy with the “product” the TTC provides, and this should be a wakeup call to those whose only focus is on new subway lines and reduced subsidies. “Subways tomorrow, but less service today” does not make a very appetizing election slogan, and yet that is, in effect, what many Toronto politicians have been feeding us for years.
Results based on a ranking of changes that riders want show that on time arrivals, less crowding and shorter wait times stand at the top of the list.
The survey reveals that occasional riders are much more satisfied with service than regular users. This is no surprise as an occasional rider is more likely to use the TTC when it suits them (including a decision to use another mode) whereas a regular rider has less choice in the matter and must endure day-to-day conditions. Similarly, occasional riders are more satisfied with hours of service.
The results are broken down in two groupings: between participants in a formal panel versus those responding online, and by geographic district. Although there is some variation, all groups are consistent in flagging on time arrivals, less crowding and shorter wait times as their priorities at similar levels. On time arrivals have the highest score in northern Etobicoke, while crowding wins out in Toronto [see pp. 29-33].
The demographics of survey participants may have some effect on the results, but this is not explored in the report. More men than women responded, although women make up the majority of transit riders. Almost one third (31%) of responses came from households with incomes of $85k or higher, and only 23% from those under $45k. Of particular note, 66% of responses came from people with at least some university education. [p. 57]
Although 58% of “most recent trips” were work-related, the remainder were not with recreation/leisure at 20%, school at 10%, medical appointments at 7%, and “other” at 5%. This shows how an undue focus on work trips can sideline a substantial portion of the travel market.
As the respondents are subdivided into finer and finer groups, it is no surprise that there are more situations where certain types of rider are under or over-represented because each subset is smaller [pp. 47-48]. There are also noticeable differences between the in-person panel and the online responses [pp. 50-51].
The executive summary of the survey reaches four conclusions:
- Customers explicitly prefer vehicles arriving on time over shorter wait times. This suggests that the ability to keep to a schedule is actually more important than improving the frequency of vehicle arrival. It also underscores the importance of the Next Vehicle Information System and its ability to communicate up‐to‐date and accurate information.
- Stop location/walk distance considerations, etc. are of significantly less importance to customers than are wait times, trip duration and crowding. However, as ground is made in other areas, these issues might arise in the future. Further research should be conducted (particularly after significant improvements are implemented) to monitor fluctuations in these priorities.
- Customers clearly distinguish between service improvements during peak periods and those during off‐peak periods. Part of this is due to the influence of frequent riders in our sample; however, this means that improvements to off‐peak services will not likely have the same impact on overall satisfaction, value for money and pride in the same way that improvements to peak services will.
- Where possible, the development of service standards should consider factors that achieved the highest share of preference first and factors that achieved above average share of preference second before considering factors that achieved a below average share of preference. [p. 22]
I disagree with the first point in that, yes, knowing when the next vehicle will appear is a good thing. However, when the predicted time clearly shows that it will arrive after a gap that bears no resemblance to the scheduled service, this simply tells a rider what they already know, that the schedule cannot be trusted.
The third point implies that off-peak improvements should rank lower than those during the peak, and this is a dangerous premise. First off, over half of all travel occurs outside of the peak, and so service quality during this period affects more riders. This is especially true for reliability issues when headways are wider, and the effect of gapped and bunched vehicles is greater. Changes that involve more resources (e.g. more service) are easier to implement off-peak because vehicles are available, and off-peak crew hours are generally cheaper than peak hours.
If the TTC falls into concentrating on peak services, they will address the area where, today, there is probably the largest mismatch between demand and service, but that is a matter of historical backlog. Off peak service quality is important too, and should not be downplayed.

I would care more about the Next Vehicle Information System if I actually believed it had any value. Last time I was at an equipped stop, the time-to-next values were decreasing by 1 minute approximately every 2 minutes. Which smacks of being intentionally misleading, since at the very least the leading vehicle is providing current congestion data to revise all following vehicles’ arrival times with…
Steve: This is an issue with NextBus. The estimated travel times are updated now and then based on historic patterns, not on real-time evolution of values. Therefore, it is possible for the clock to “count down” at a rate faster or slower than times would imply depending on current conditions.
An even more galling issue is that the TTC does not have any way to include a vehicle’s unscheduled destination (e.g. a short turn) in the info NextBus uses, and so it can predict the “arrival” of a vehicle that will never show up causing the estimated time to suddenly jump when the short turned vehicle is no longer in the prediction. NextBus has incorporated this ability in their system (they already deal with scheduled short turns and branching), but it requires that the TTC supply the data. Whether their new VISION vehicle tracking system will be able to do this, I don’t know, but will ask.
LikeLike
NextBus is useless. I gave up on it long ago. Recently I discovered transsee.ca and found it amazing! Accuracy and detail is great. Constant updating. This based upon my first use for a main route that I use and is often off-schedule.
Steve: Guess where transsee.ca gets its data from? It is important to distinguish between the apps that present the data and the underlying data’s quality. Nextbus can get screwed up in various ways that are not its fault usually related to bad data (schedule info, routes) from the TTC.
LikeLike
The survey results are interesting in that they challenge the conventional wisdom underlying the trip time weighting. It’s clear from both the “importance of improvements” and “trip planning importance” slides that riders are most sensitive to the time spent waiting for a vehicle, and (closely related) the reliability of the service. Crowding is also an important factor, which is also directly related to service frequency and reliability (vehicles are more crowded when they are bunched). Way down at the bottom of both lists are transfers and walking distance. (Maybe walking distance doesn’t reflect customer preference, it’s just a reflection that riders are satisfied with how far they have to walk now.)
This is almost backwards from the weightings that the TTC uses to evaluate service changes, where waiting time is only slightly less onerous than travel time, walking time is more onerous than waiting time, and riders would be willing to add 10 minutes to their trip to avoid one transfer. (Is the transfer penalty in addition to waiting time for the second vehicle?)
Steve: I believe so.
Logically this makes sense — transferring is only onerous when the waiting time component is an issue. People don’t have an issue with taking a route to the subway rather than taking a parallel surface route, because the frequency and reliability of the subway makes the transfer easy. Transferring is an issue where you are using one or more routes with infrequent or unreliable service. But that’s not an inherent issue with transferring — it’s an issue with frequency and reliability.
I wonder how service planning and modeling would change if the weightings more closely reflected those survey responses rather than the current values. Also, it would have been useful to have that ammunition about transfer importance in response to “people tell me” planning for a certain multi-billion-dollar infrastructure project I can think of.
Steve: This is a good example of the fact that the “update” to the standards rehashes all of the existing practices, while the survey suggests that some standards are out of whack.
LikeLike
Perhaps the TTC could ask the riders whose regular stop has been removed how they like their new walking time.
Walking from a side street to the main street where the transit runs is an inescapable journey. But then having to walk to a further stop — because the closest one has been removed — is exasperating when the bus/streetcar goes by before you get to that further stop.
The flip side is having to wait on a bus or streetcar that’s stuck in traffic, when there’s a removed stop right outside. I’m thinking of stops like northbound Bathurst at Bloor. I’ve seen two or three streetcars stuck in the lineup to get into Bathurst station (this was prior to the bustitution). Anyone bound for Bloor Street itself either had to get off at Ulster or wait five or ten or more minutes to get into Bathurst station — then walk back down to Bloor.
Steve: And even worse, the stop removals on King made no difference at all to travel times because the “savings” were immediately eaten up in congestion at the “main” stops just beyond. Basically, a stop removal that is not at a traffic signal saves little or nothing.
LikeLike
Nextbus times often drop slowly because the predictions represent the best case scenario. This makes sense because if it showed the average time and you showed up at the stop when it predicted, you would miss it half the time. If things are moving worse then average, the time will move slowly.
My idea behind TransSee is to give you more information so you can judge the accuracy of the Nextbus prediction. I’m pleased to see it seems to work seamlessly.
LikeLike
There are some routes that does not meet the standard. The 11A Bayview service to Steeles on Sunday morning runs every 40 minutes instead of every 30 minutes and 45 Kipling, 54 Lawrence East, and 165 Weston have 10 minute service that doesn’t start at 8 am.
LikeLike
I have read the June 18 service changes page here.
Any plans to post this up on this blog?
Steve: I am still awaiting the detailed memo setting out all of the changes. As of yesterday, the TTC claimed it does not yet exist. This Coupler post may have been done off of a draft version.
LikeLike