
This article continues a series reviewing the quality of service scheduled and operated over the COVID-19 era in summer 2020 that began with an introduction and continued with Part I looking primarily at Scarborough and Part II moving further west looking at north-south trunk routes between Victoria Park and Jane.
In this article, I continue further west to review these routes:
Technical Note
There are a few gaps in the data exported from the TTC’s VISION tracking system because of outages.
On Monday and Wednesday, June 22 and 24, there were outages from late morning to early afternoon. This causes very long headways to be calculated for the first bus crossing a screenline (the point where headways are measured) after the system comes up again.
From midday Wednesday, July 15 to midday Friday, July 17, there was an outage and no data are included in the charts for this period.
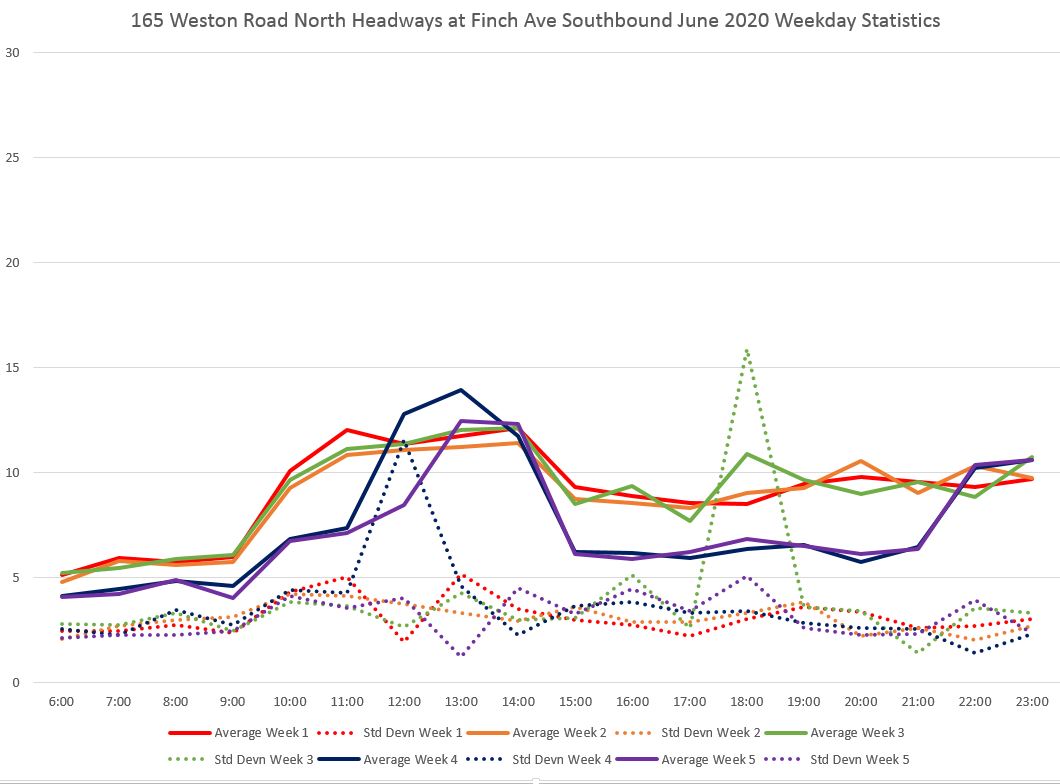
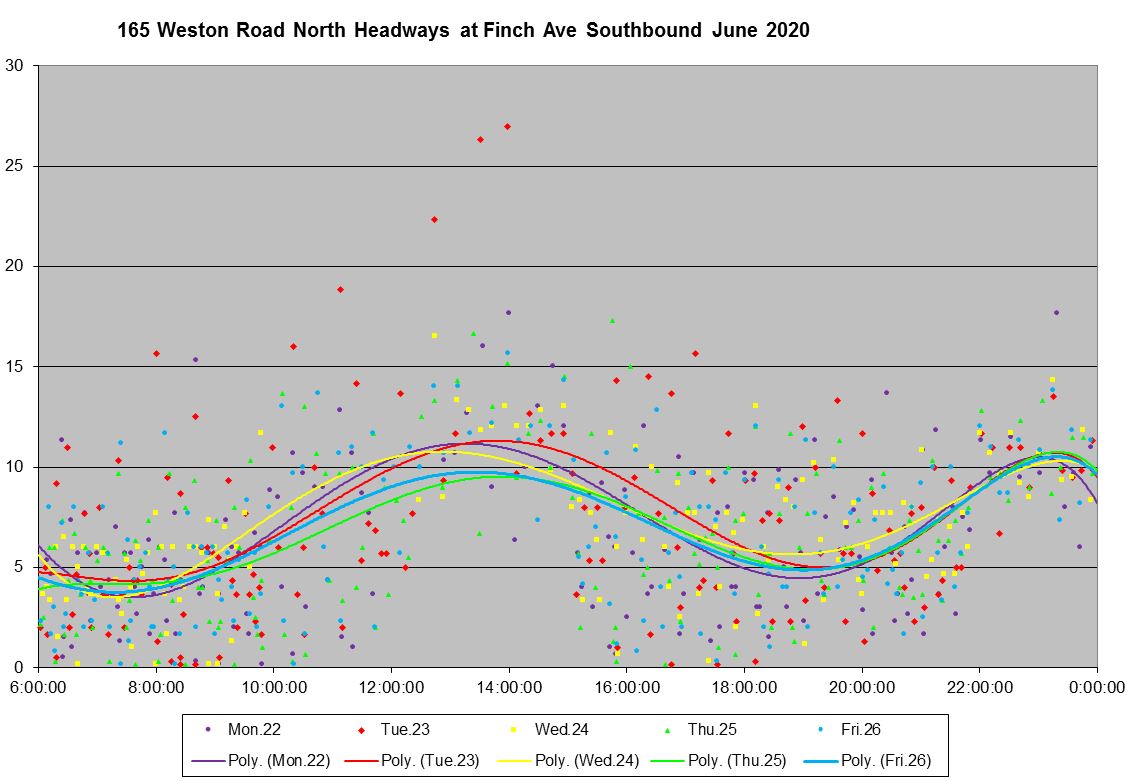
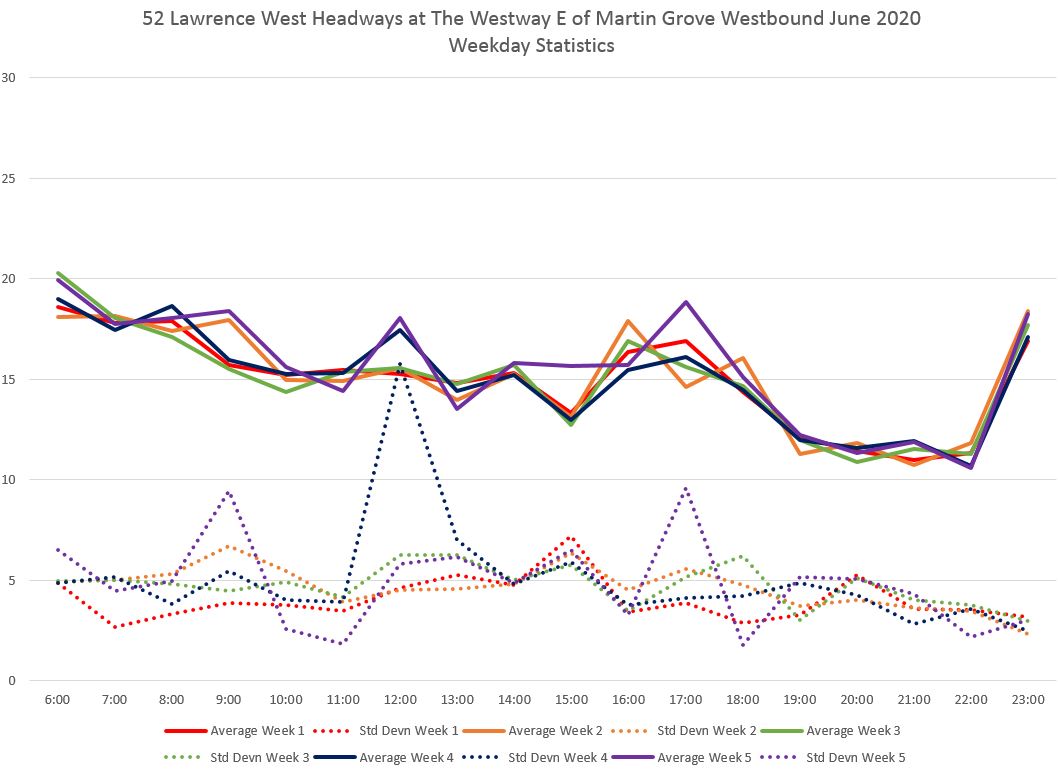
For each route discussed here, there are sets of charts displaying headway data in various formats including:
- Averages and standard deviations of headways on a weekly and monthly basis.
- Raw data including trend lines showing the overall shape of the data.
- Quartile charts in block-and-whisker format showing how tightly or loosely the data values are clustered around the mean.
- Charts for Saturdays and Sundays.
In the interest of space, only the weekly averages, standard deviations and raw data charts are shown in the article, but the full sets are available in linked PDFs at the end of the section for each route. An illustration of the quartile chart format is included in the discussion of the Weston Road Bus.
For a complete description of the various charts produced for these analyses, see Understanding TTC Service Analysis Charts: A Primer.
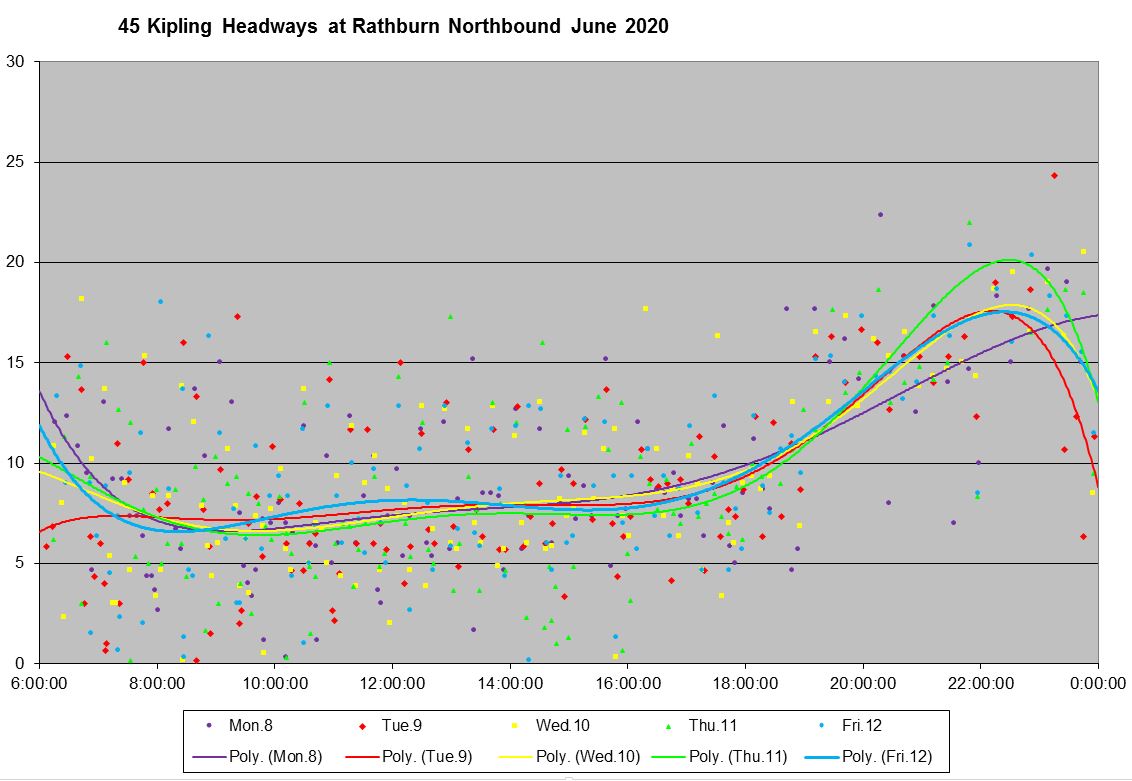
45 Kipling
Service on Kipling runs primarily between Kipling Station and Steeles, with a branch to Carlingview via Belfield weekday daytime. In the schedule in effect in March 2020, over half of the service to Steeles was provided by the 945 Kipling Express.
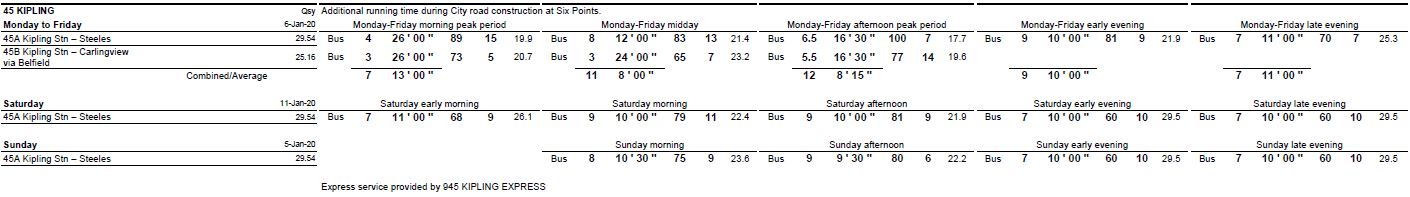

The schedule which came into effect in mid-May dropped the express service, and left the local service unchanged except late evenings weekdays when the service was reduced.
However, the service actually operated and tracked until mid-June appears to have included the supposedly cancelled express trips. Until it becomes possible to track movements of the standby buses, the actual quality of peak service operated on the north end of Kipling will be difficult to determine.
If any readers are regular users of 45 Kipling and can comment on the service they see on the street, please do so.
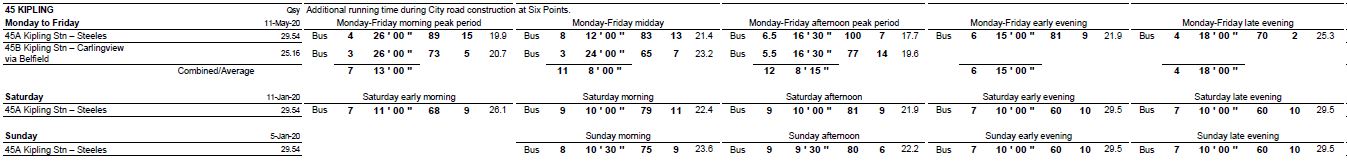
The published schedule in effect in August shows a consistent headway leaving Kipling Station northbound in the AM peak, but a ragged headway alternating between 12 and 6 minutes through the midday. This is caused by the inability for a 12 minute Steeles service to blend with a 24 minute Carlingview service, and this situation predates covid-related service changes.
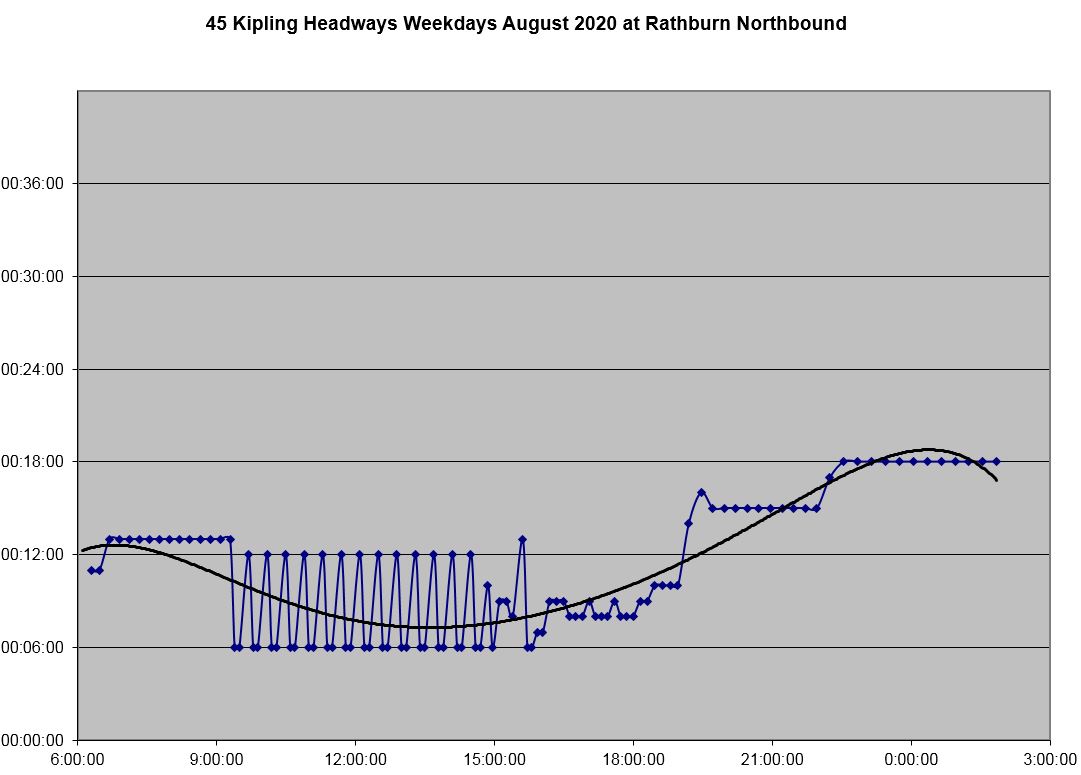
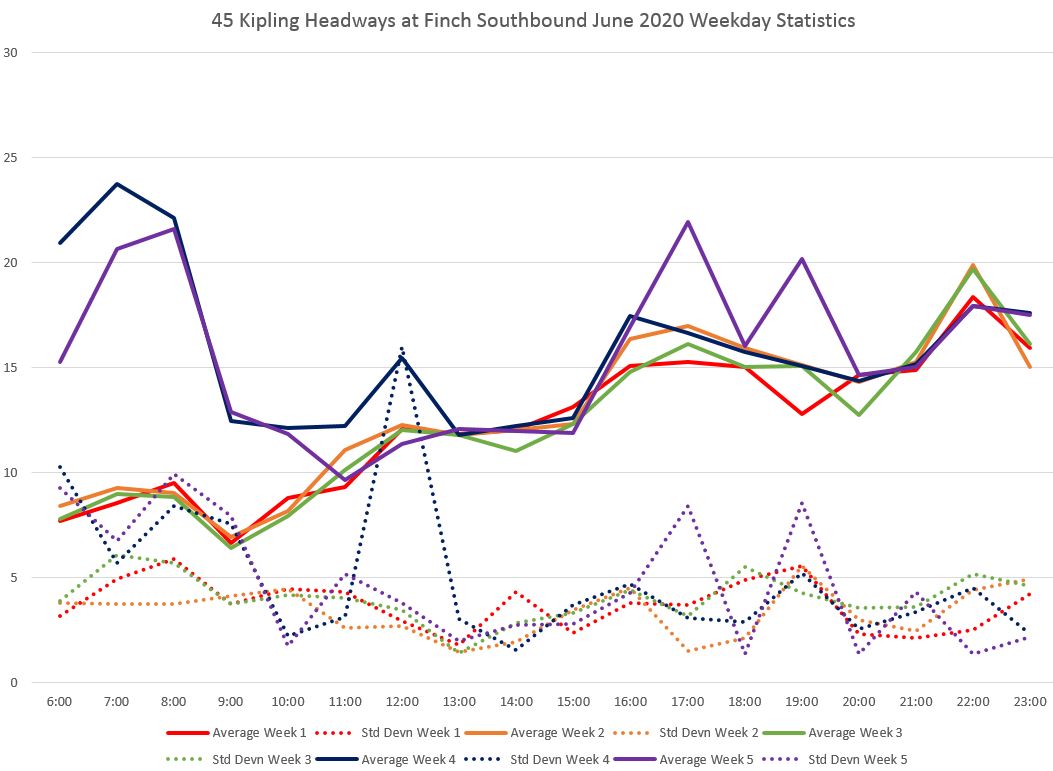
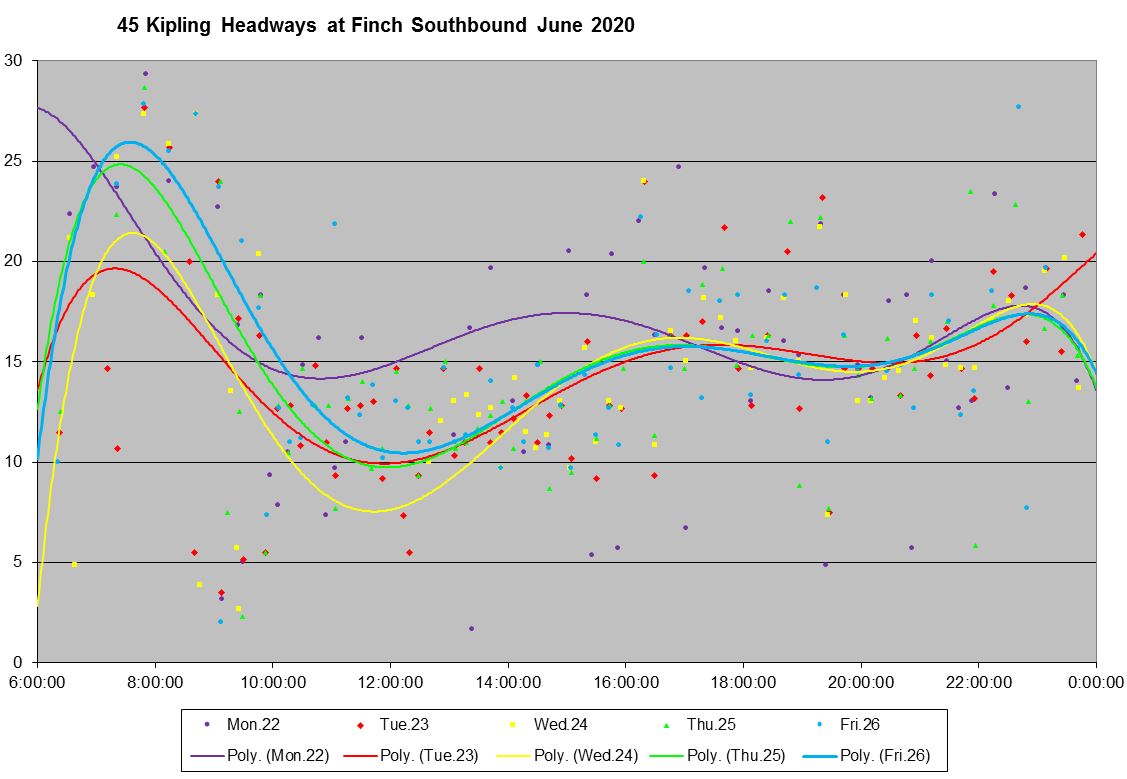
The tracked service shows a clear change in week 4 of June with wider peak headways in the AM. The midday spike is caused by the missing data problem and does not represent a real drop in service.
In week 2, as an example, even with more frequent peak service, the headways are scattered over a range from zero to 15 minutes.
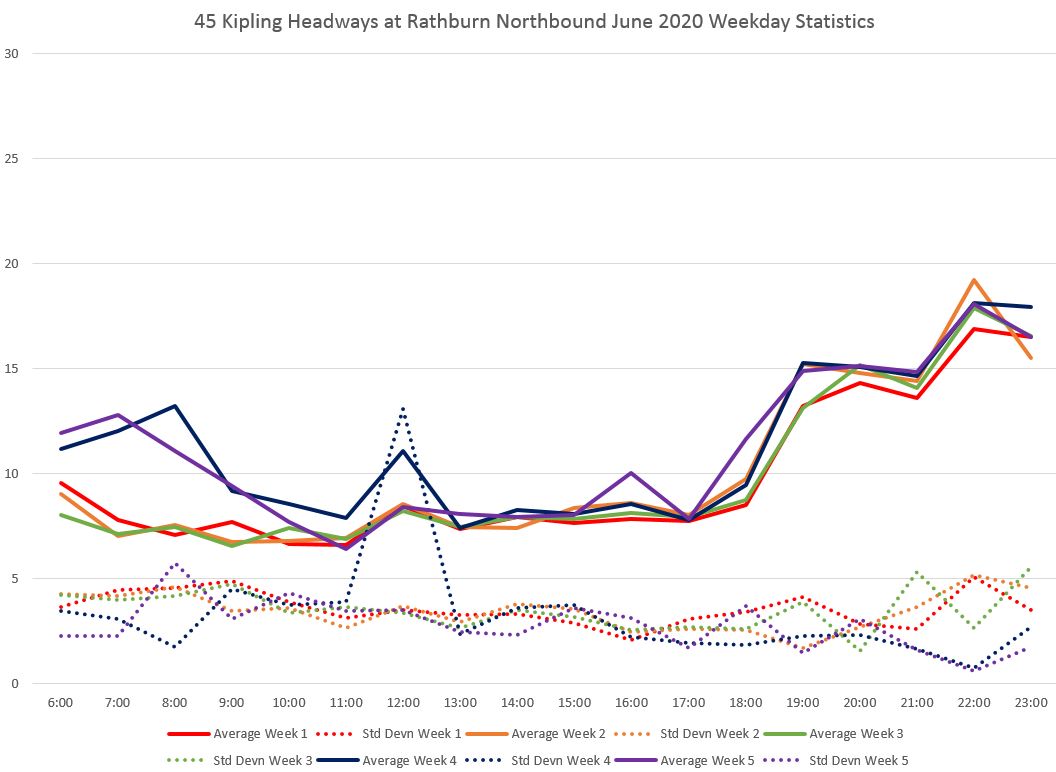
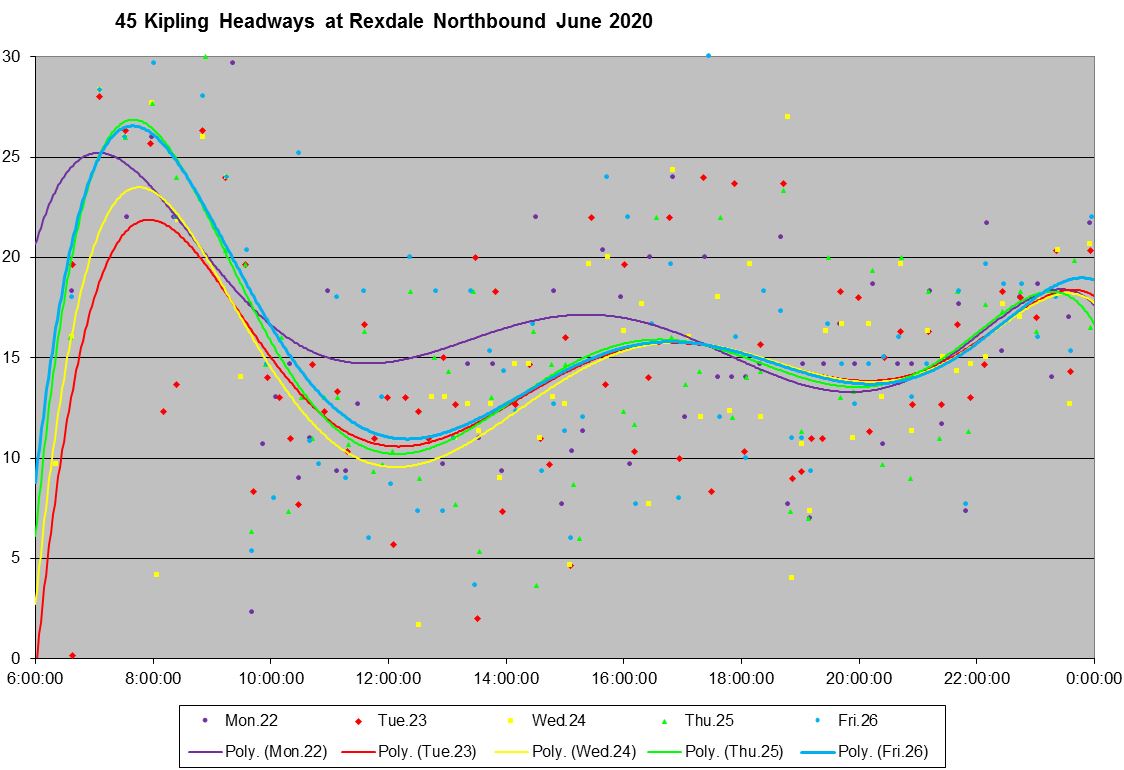
At Rexdale, only the Steeles service remains, and the effect of the missing express runs is quite clear.
The average headway of tracked buses matches the scheduled service, but equally there is a problem with erratic service as shown by the high value of the standard deviation.
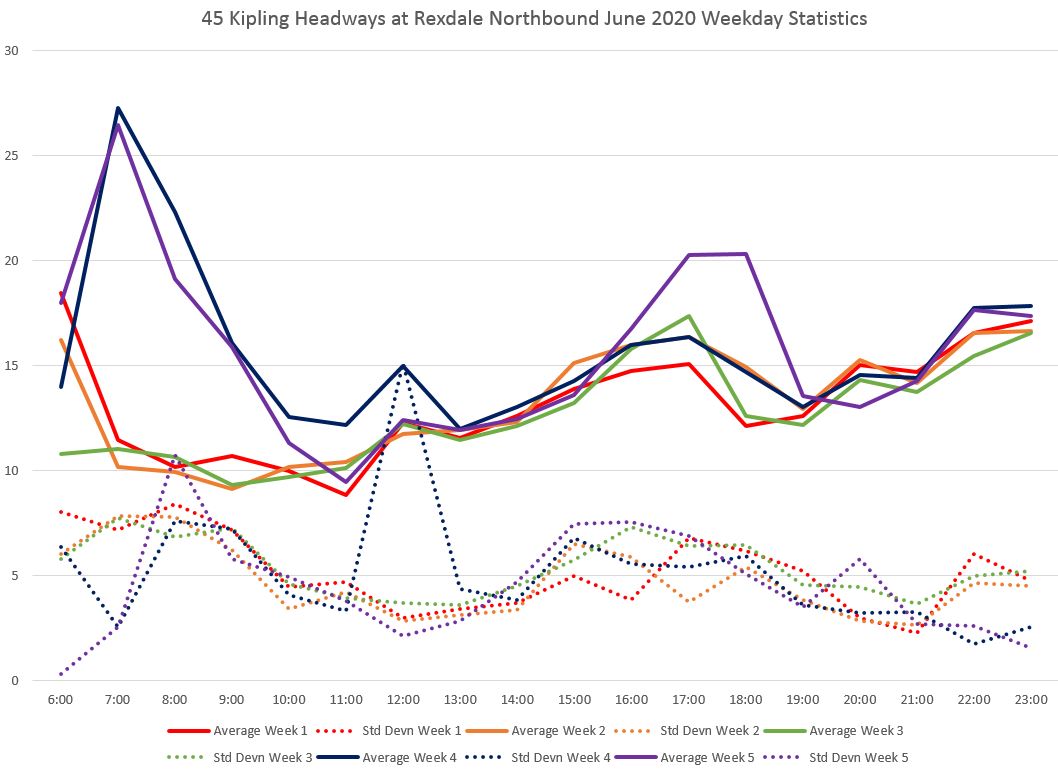
The detailed data show just how unreliable this service is even in week 2 with the “better” level of service.
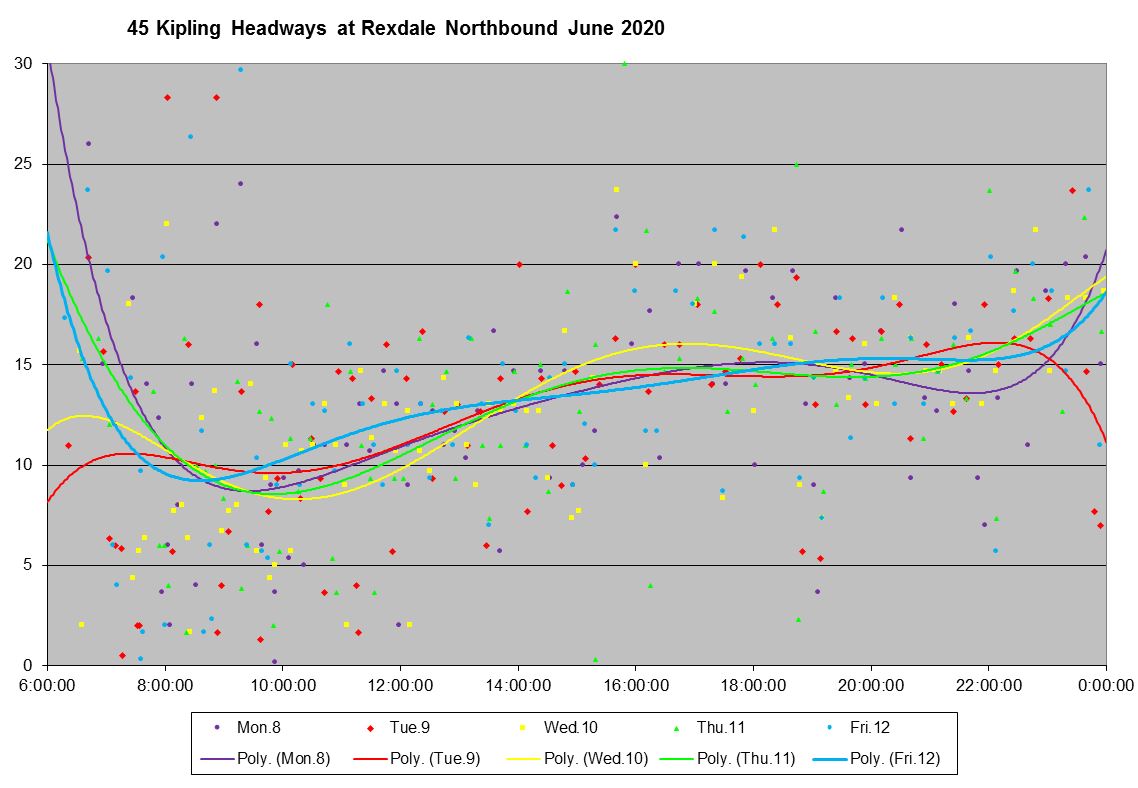
In week 4, the service is even less reliable.
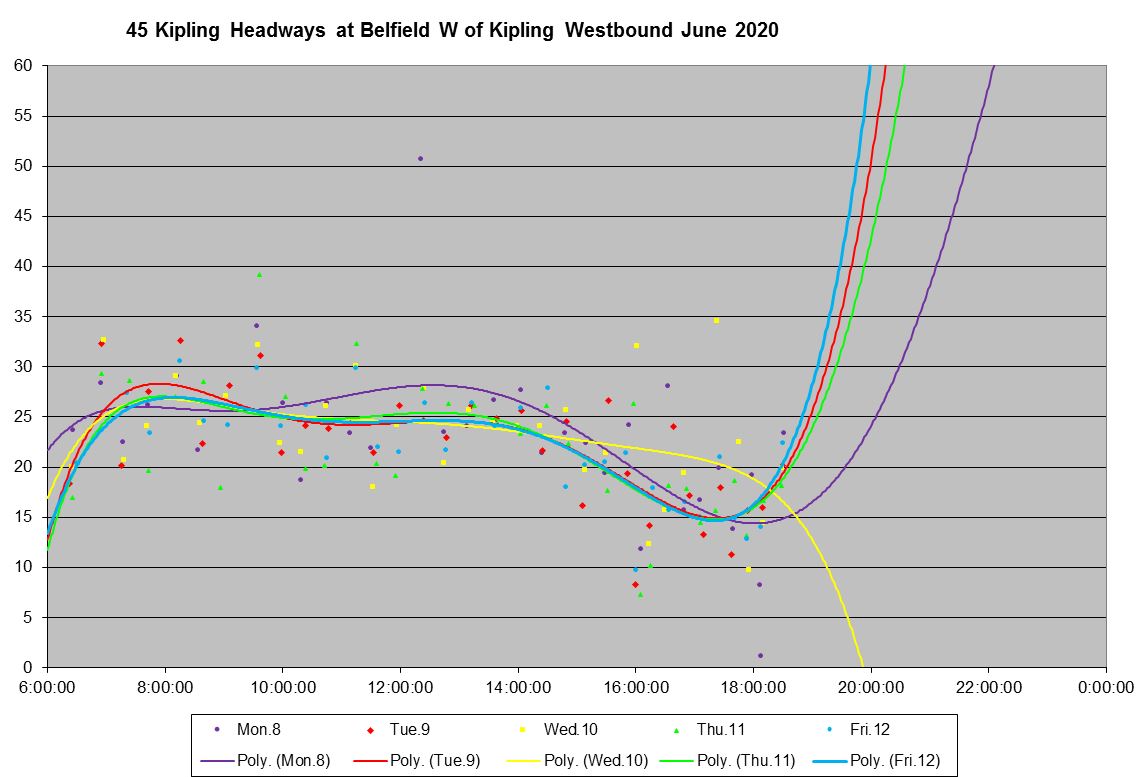
The Carlingview service runs at more-or-less the same headway until the PM peak when it improves, but then ends for the day.
Unlike the Steeles service, the Belfield branch did not see a drop in tracked service in late June. Note that these charts have a different vertical scale running to 60 minutes so that the wider gaps in service are visible.
The scheduled service southbound at Finch mirrors the northbound service to Steeles including a wide scheduled headway in the peak periods. This might be supplemented with standby buses but there is no way to know if this happens because they are not tracked. (They also would not show up on any service prediction apps and riders might think that they face a wide gap when a bus is actually nearby, but out of sight.)
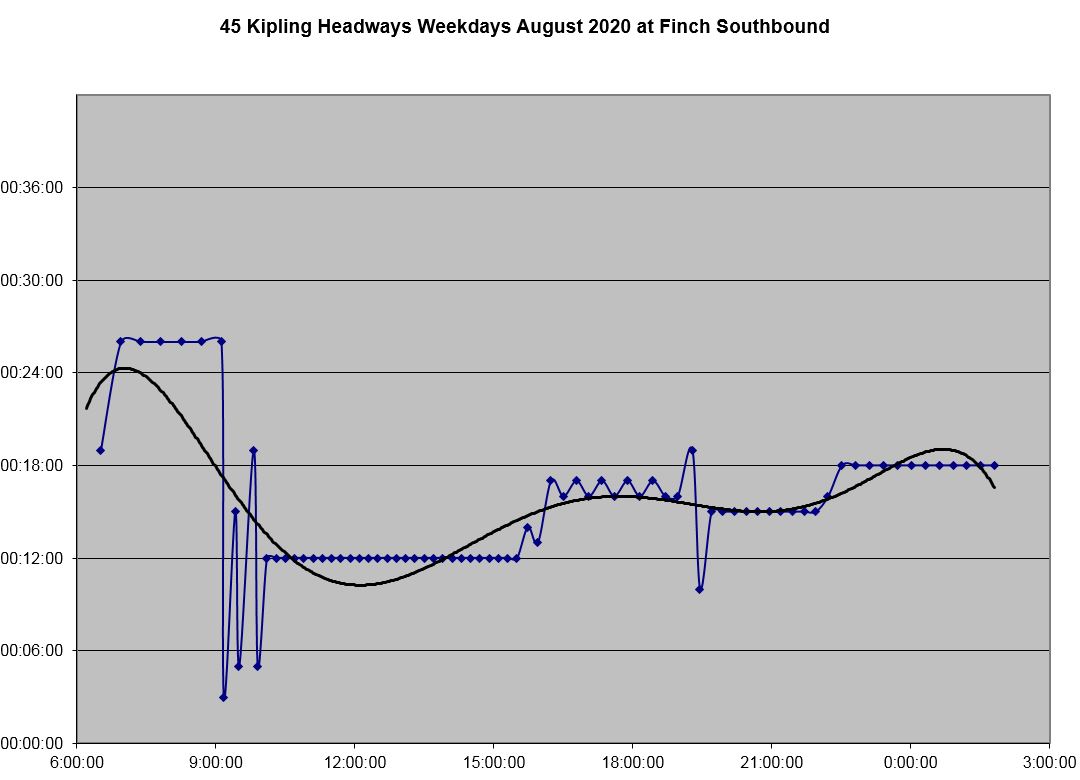
The service southbound at Finch shows the same pattern as northbound with very wide headways in the AM peak in the last two weeks of the month. The range of headways is quite wide even though this location is not far from the terminus.
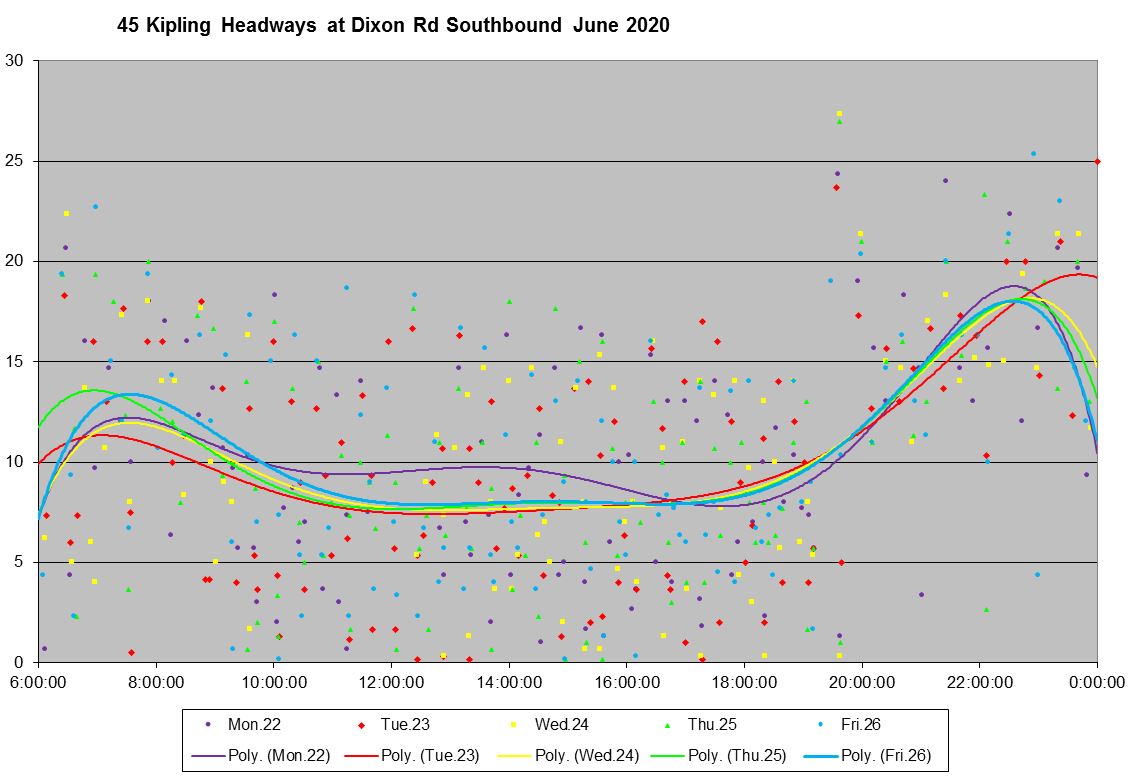
At Dixon Road, the southbound service mirrors the northbound with the gyrating scheduled headway caused by mismatched service from Steeles and from Carlingview.
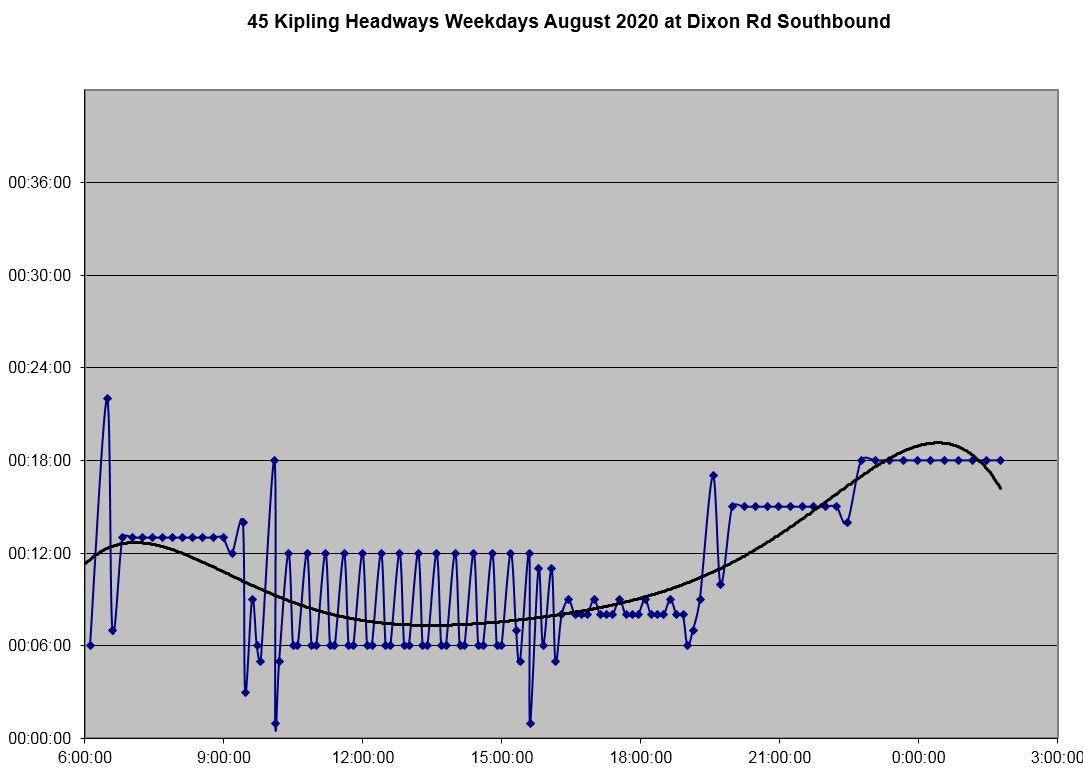
The tracked service has a consistently high standard deviation even during the PM peak and evening when the scheduled headway is supposed to be uniform.
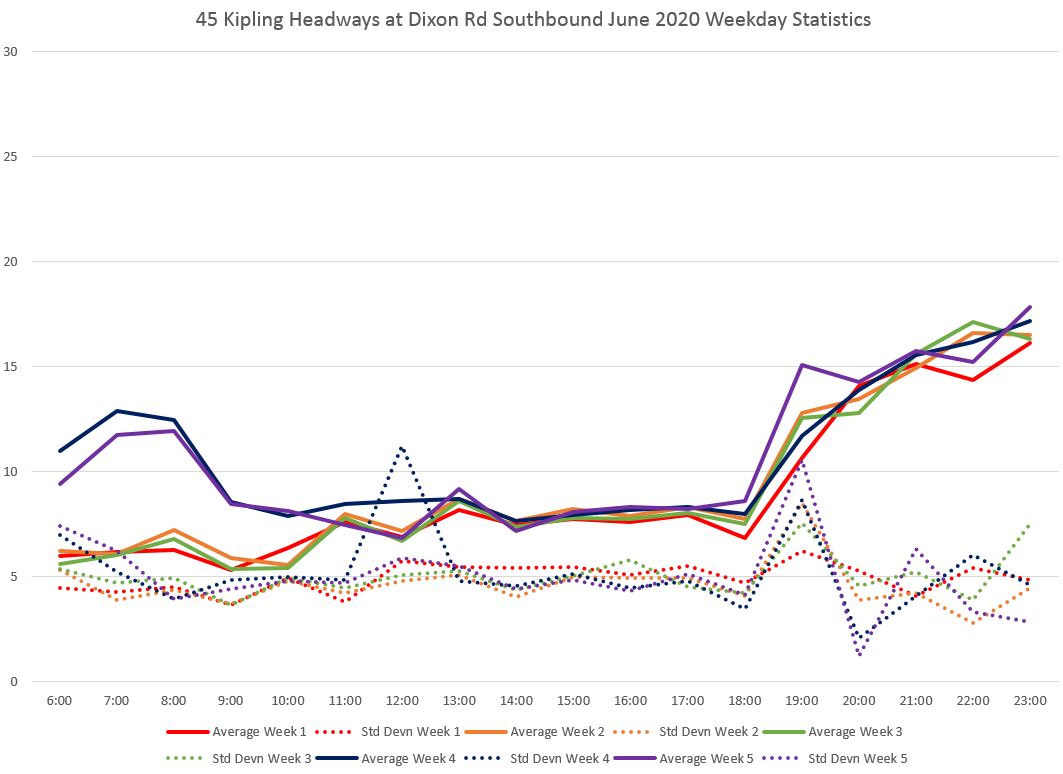
The detailed data show what riders face when waiting for buses. For much of the day, the wait can be anywhere from zero to 20 minutes, with even longer gaps in the evening.
Full chart sets for the locations cited above are linked here:
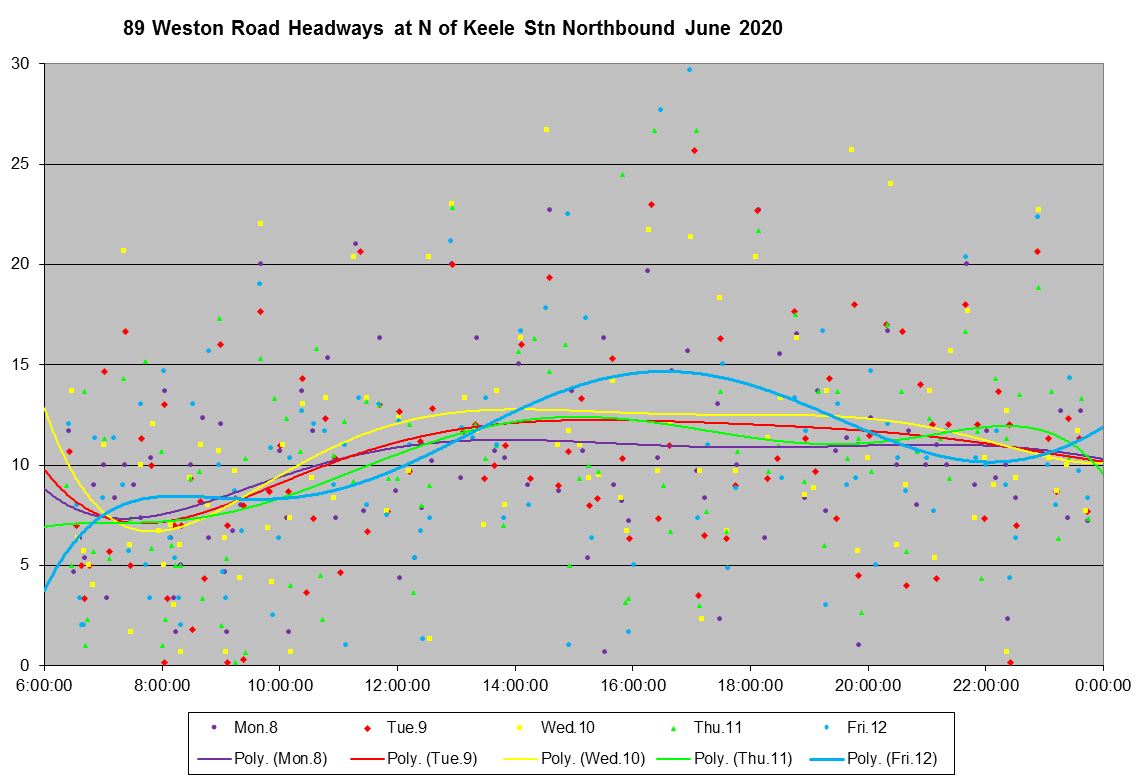
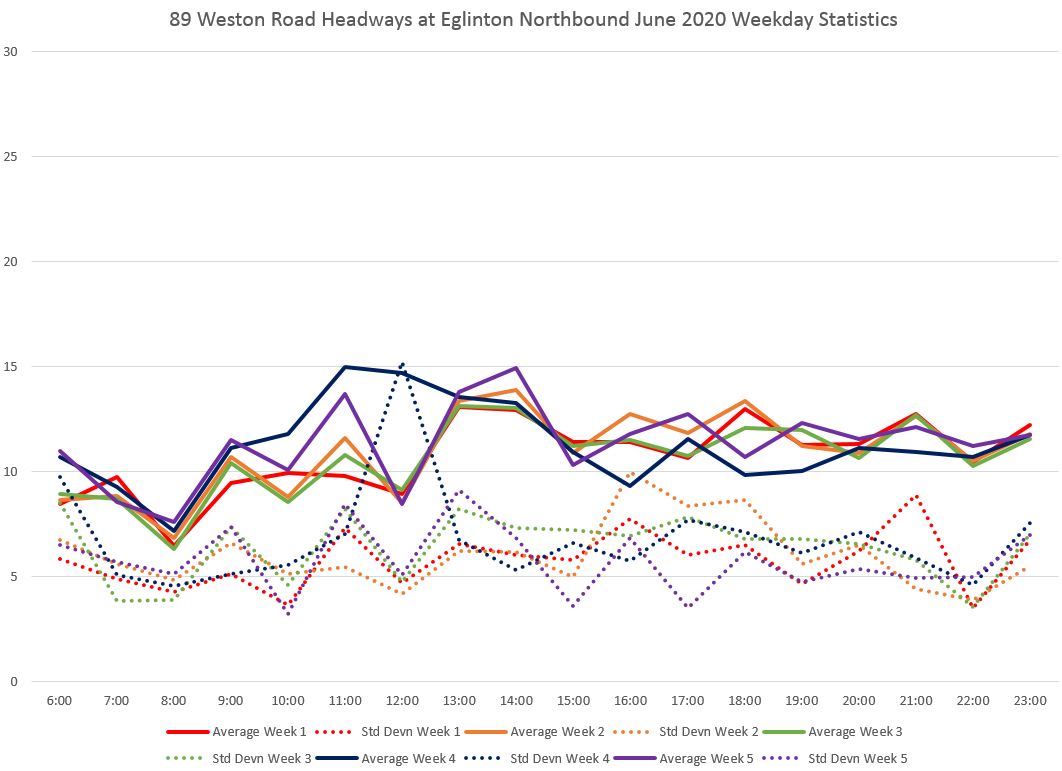
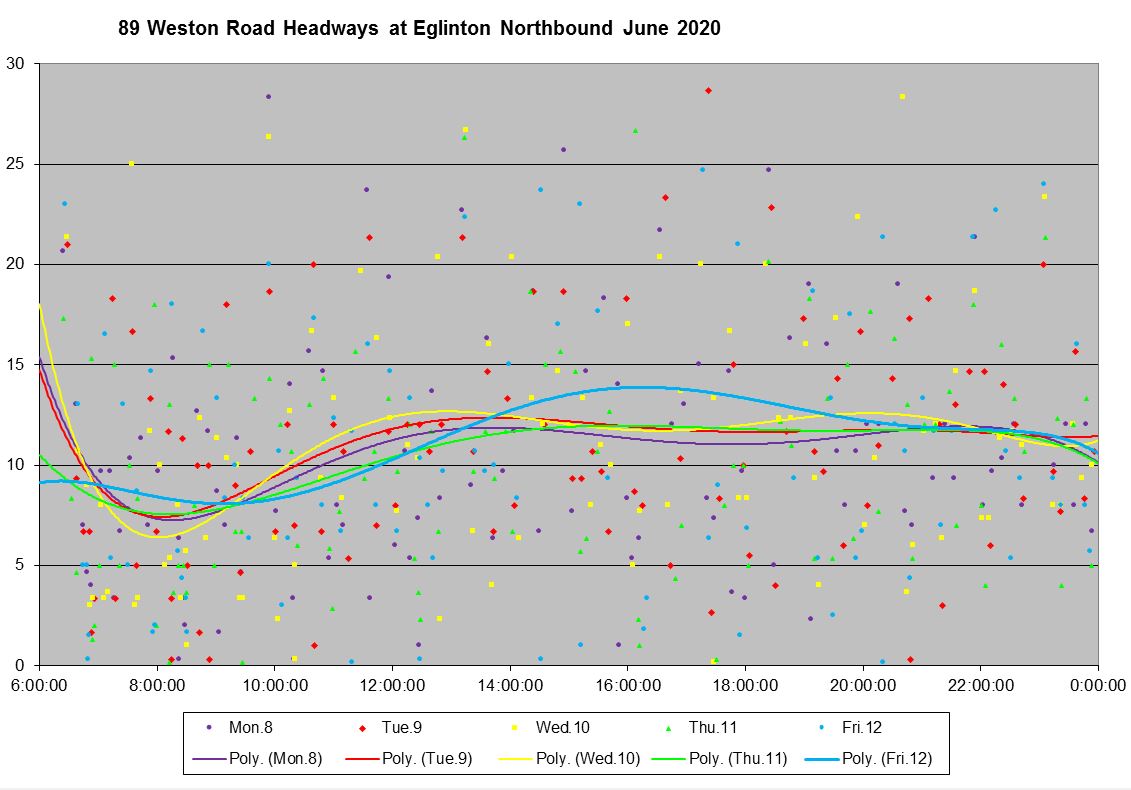
89 Weston Road
Service on Weston Road has been particular hard-hit by schedule changes with the loss of the Bloor to Steeles 989 express service and a reduction in the 89 local service.
89 Weston is currently diverting to High Park Station via Bloor due to construction at Keele Station.
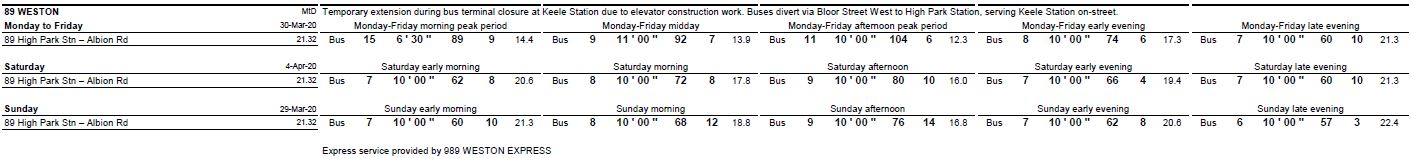

Schedules in effect in June had officially changed as of mid-May with wider headways at all weekday periods on the remaining 89 local service to Albion Road.
The tracked service in June shows a wide variation in headways compounding a schedule that reduced service by selective cancellation of crews on the 89 local and all 989 express service.
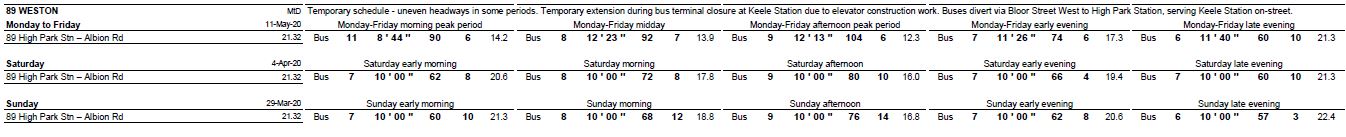
The wider weekday headways were implemented by selectively calcelling crews, and the published schedule shows regular spikes in the headways.
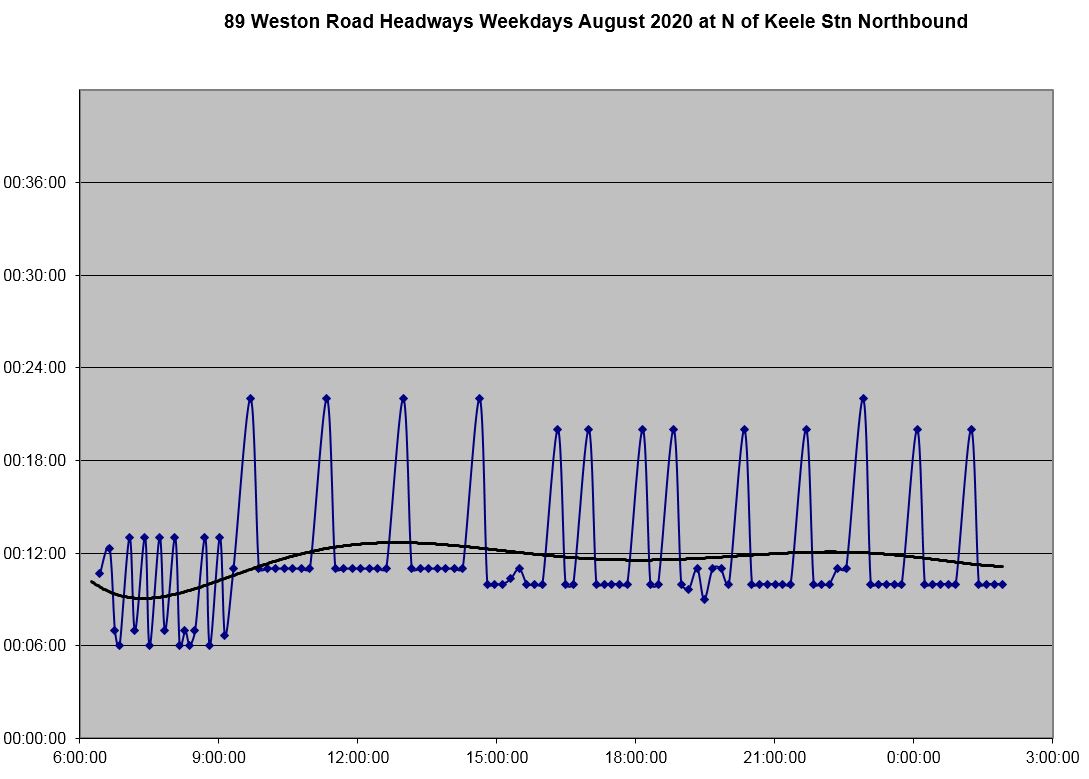
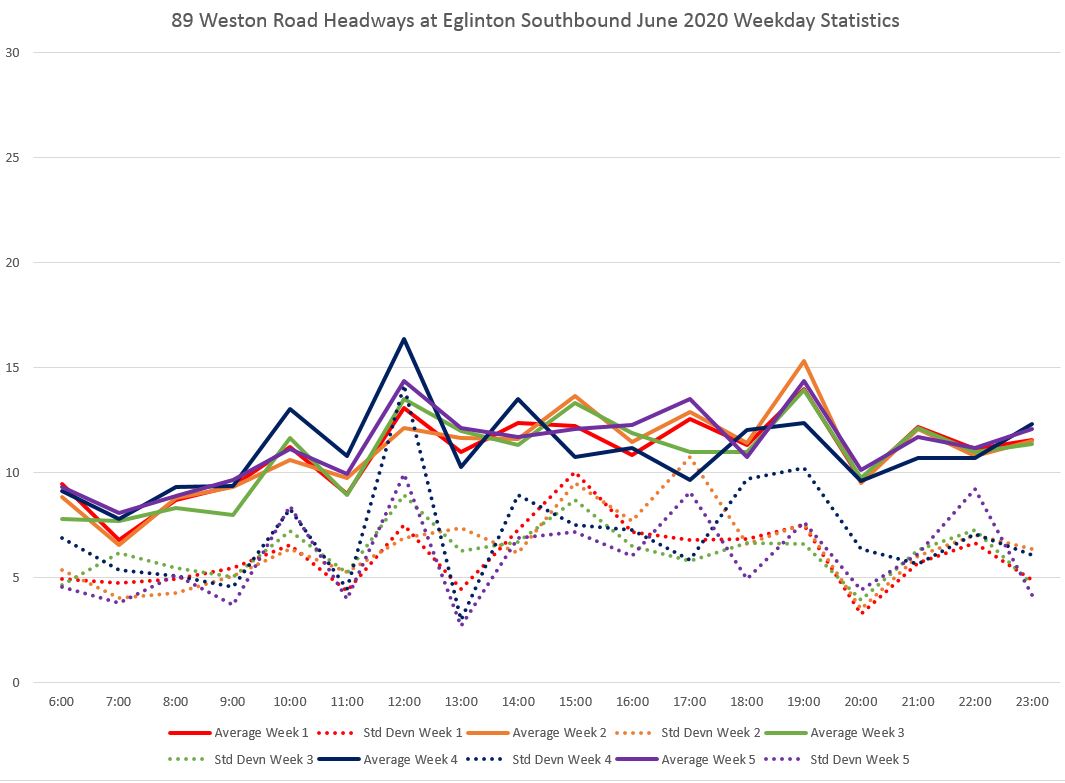
The service level of tracked vehicles through June was consistent, but with a consistently high standard deviation of values showing widely scattered headways.
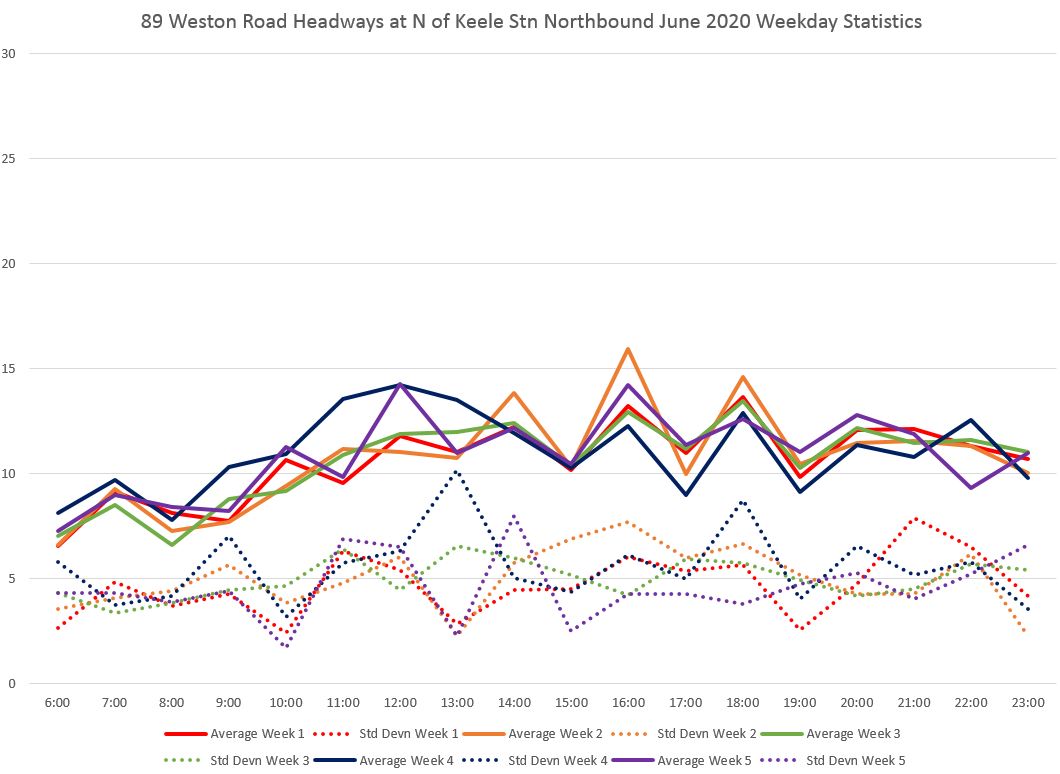
The individual data points for week 2, as an example, are spread over a wide range with values below 5 and above 20 minutes.
When the disorganized service leaving Bloor northbound reaches Eglinton, the SD value is even higher and the actual headways range from zero to above 25 minutes.
The southbound service suffers from the same problems as northbound with a mix of scheduled gaps and widely varying headways. Here is the schedule:
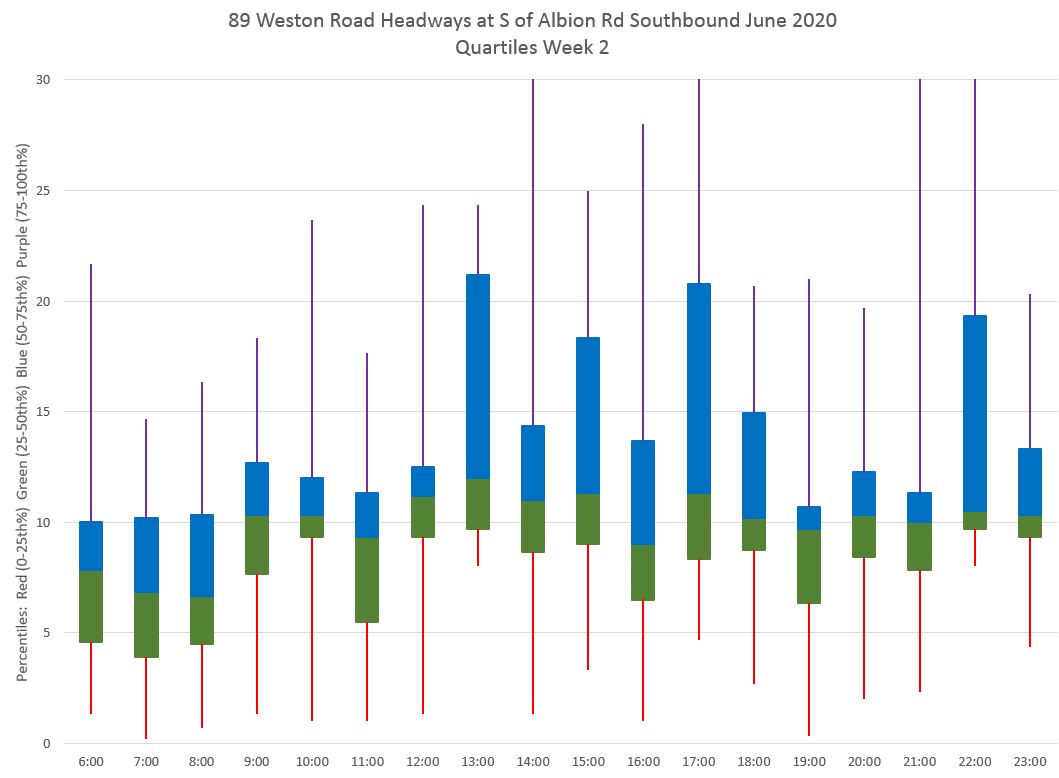
Leaving Albion Road, the service is already erratic with an SD value regularly in excess of five minutes.
The detailed data for week 2 show the values spread over a wide range from zero to 25 minutes, and this is near the terminus. There is no way that this can possibly meet the TTC 6-minute standard for “on time” performance.
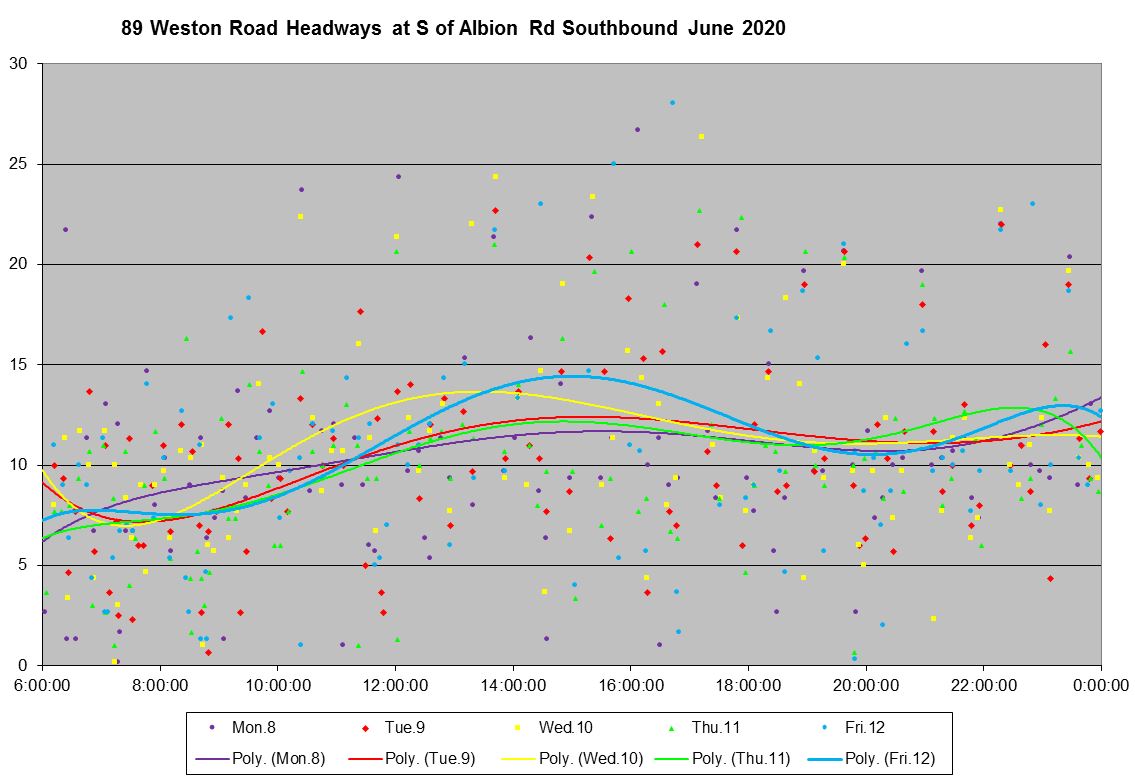
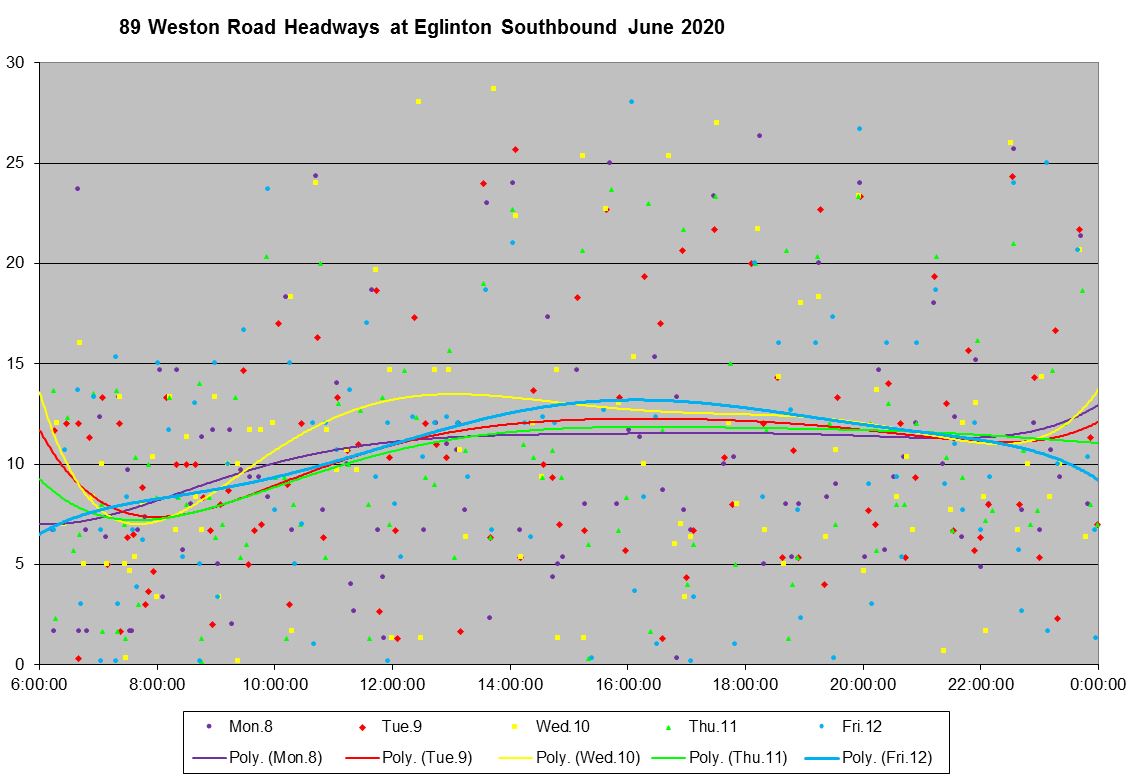
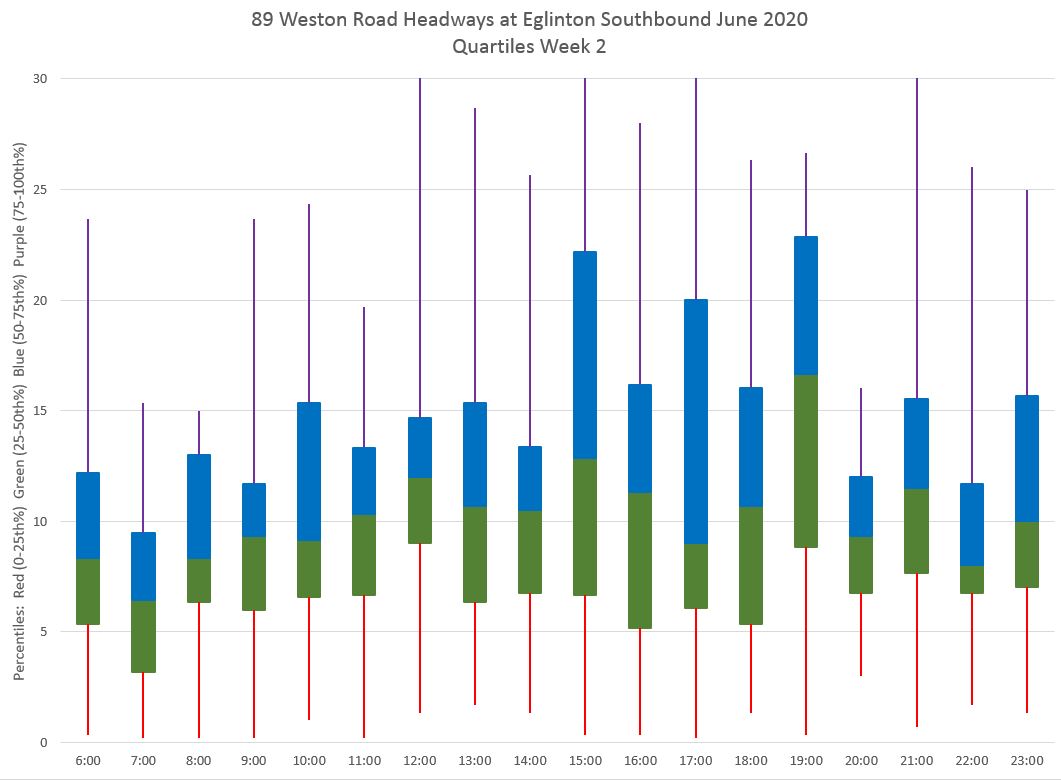
The headways are even more scattered midway along the route at Eglinton.
Another way of looking at the data is to break it into quartiles. In the charts below, the central quartiles representing half of the headways are contained within the vertical boxes. The dividing line between the lower green section (quartile 2) and the upper blue one (quartile 3) is the median value. Half of the headways are lower than the median, half are higher.
The “whiskers” on the boxes show the bottom and top quartiles respectively. They represent the other half of the service, and the length of the whiskers shows that these headways are spread over a wide range.
The first chart shows the data for trips southbound from Albion Road, while the second shows the service at Eglinton. Note how both the position and the length of the boxes and whiskers changes as the service which is already erratic leaving the terminus becomes even worse as it moves down the line.
The complete chart sets for the locations cited above are linked here:
165 Weston Road North
The 165 Weston Road North operates from York Mills Station, overlaid on the 96 Wilson route, then north on Weston Road to Steeles. For that segment it was combined with the 989 Weston Road Express which ran during peak periods from Bloor to Steeles (see the preceding section for schedule info on route 989).
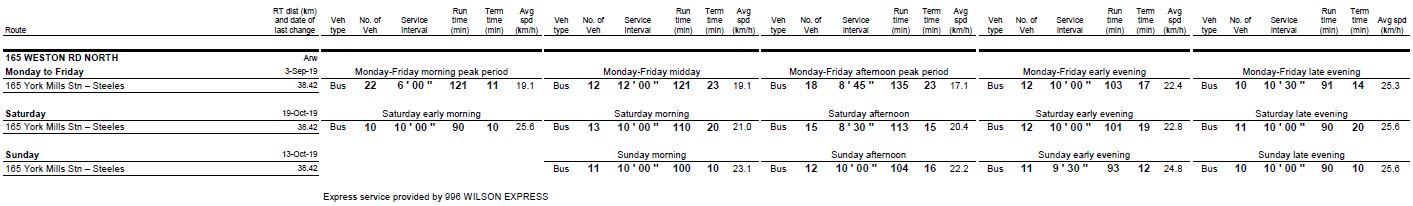
In the schedule implemented in service was improved during all weekday periods except late evening. Although this is not evident in the schedule summary, this was achieved with trippers that overlay the basic service.
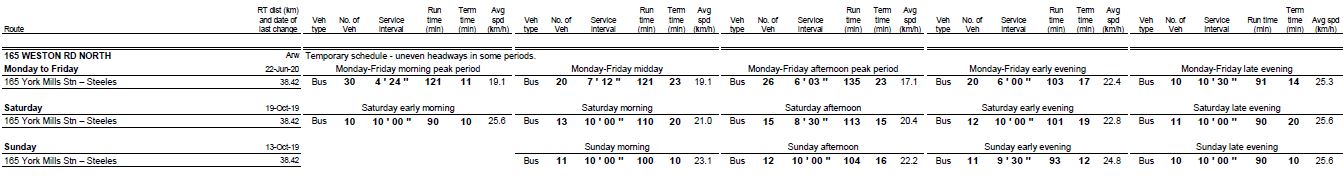
Looking at the scheduled headways as a graph, we can see the effect of the trippers, but also that they are scheduled on a headway that does not blend with the underlying service. Service on the 165 is scheduled with gaps for much of the day. (Only the west/northbound service is shown here because the south/eastbound pattern is identical.)
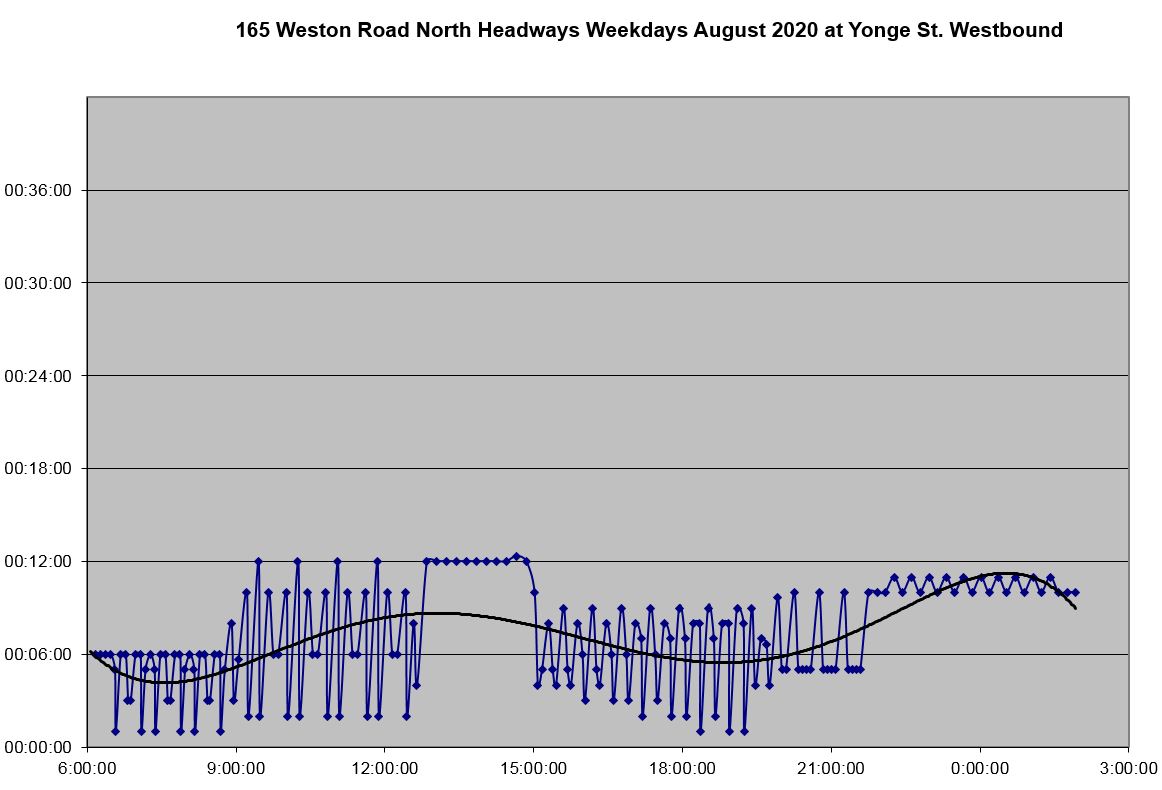
The service westbound at Albion Road (the point where the route turns north and into Weston Road) shows the change in the final weeks of June when the trippers were officially part of the schedule, and therefore were tracked.
The data for week 4 show headways scattered over a wide range with many at or near zero indicating bunching.
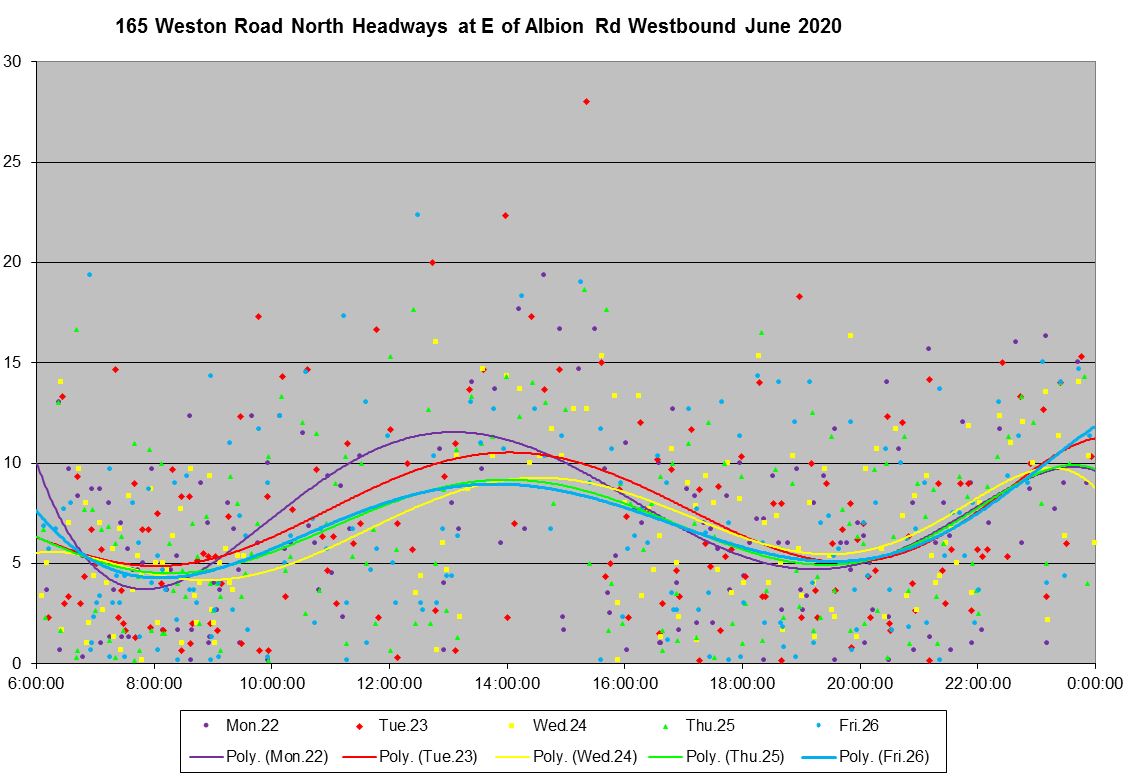
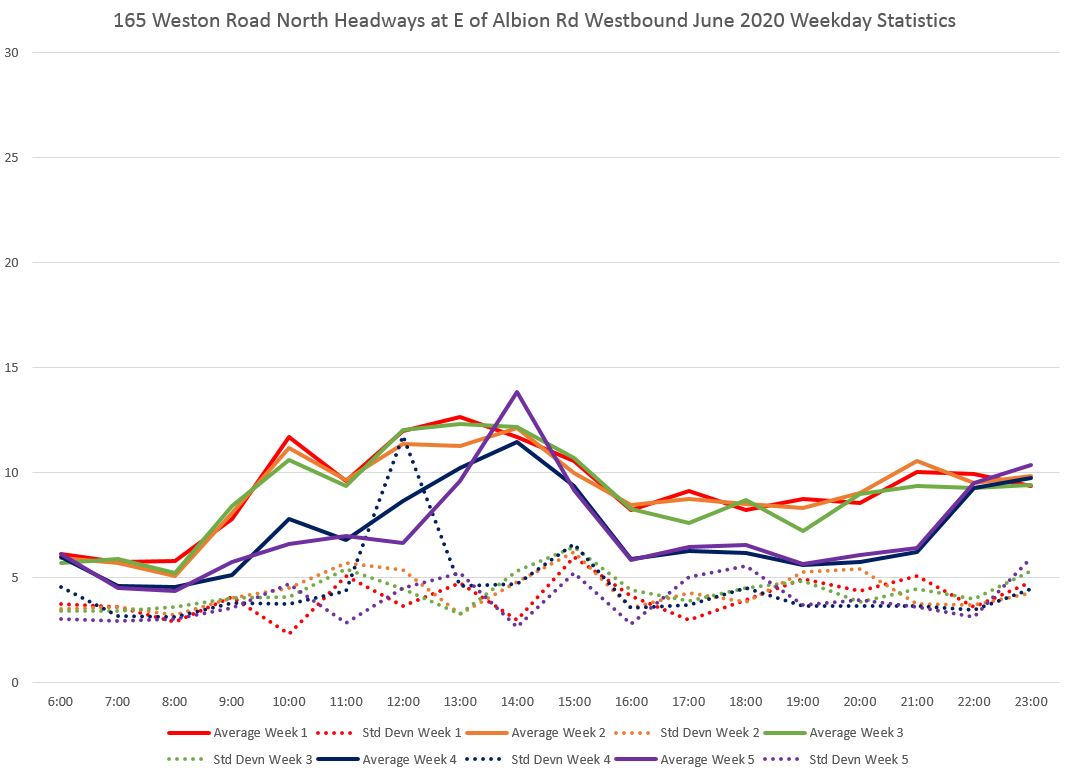
Inbound, the service behaves similarly. Scheduled headways improved in late June when the trippers were added.
However, as with the outbound service, the headways are scattered over a range from zero to about 15 minutes for much of the day.
Full chart sets for the locations cited here are linked below:
60 Steeles West
The Steeles West corridor is served by two routes: the 60 Steeles West local and the 960 Steeles West Express, although in the March 2020 schedules, the 960 was not a frequent service compared to the local trips.
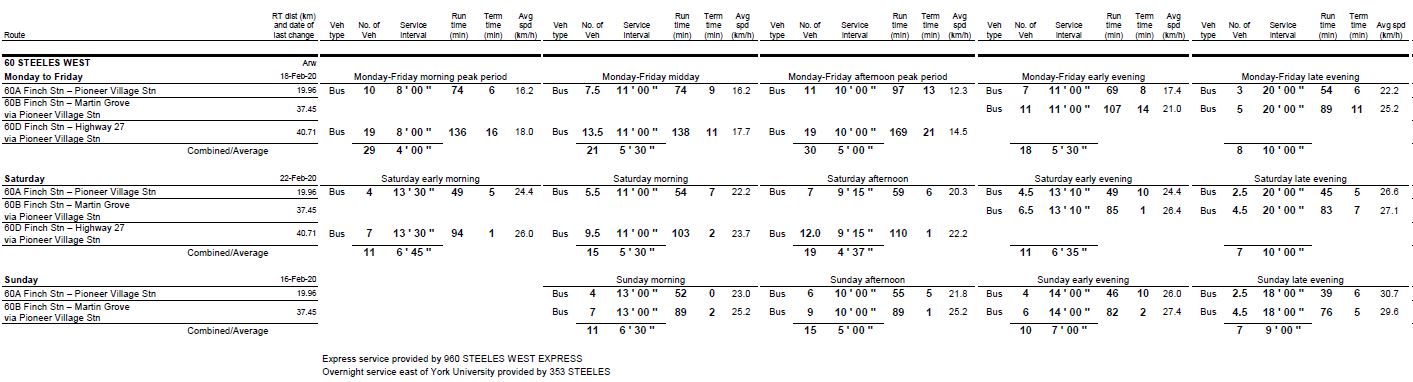

In the June schedules (which took effect in late May), the 960 Express is cancelled, but the local service is improved on weekdays except in the AM peak when it is unchanged.
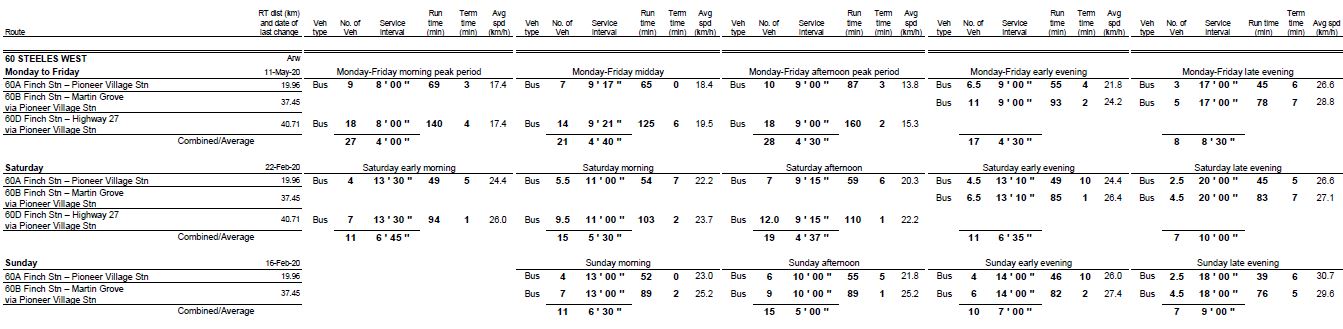
There are no trippers on 60 Steeles, nor are there cancelled runs, and so the scheduled headway is quite stable. There is a small oscillation between four and five minutes caused fractional values (e.g. 4’30” is scheduled as alternating 4’00” and 5’00”), but not the large swings in headways we see on many other routes. The service west of Pioneer Village Station is less frequent with limited spiking in headways due mainly to transitions between peak and off-peak periods.
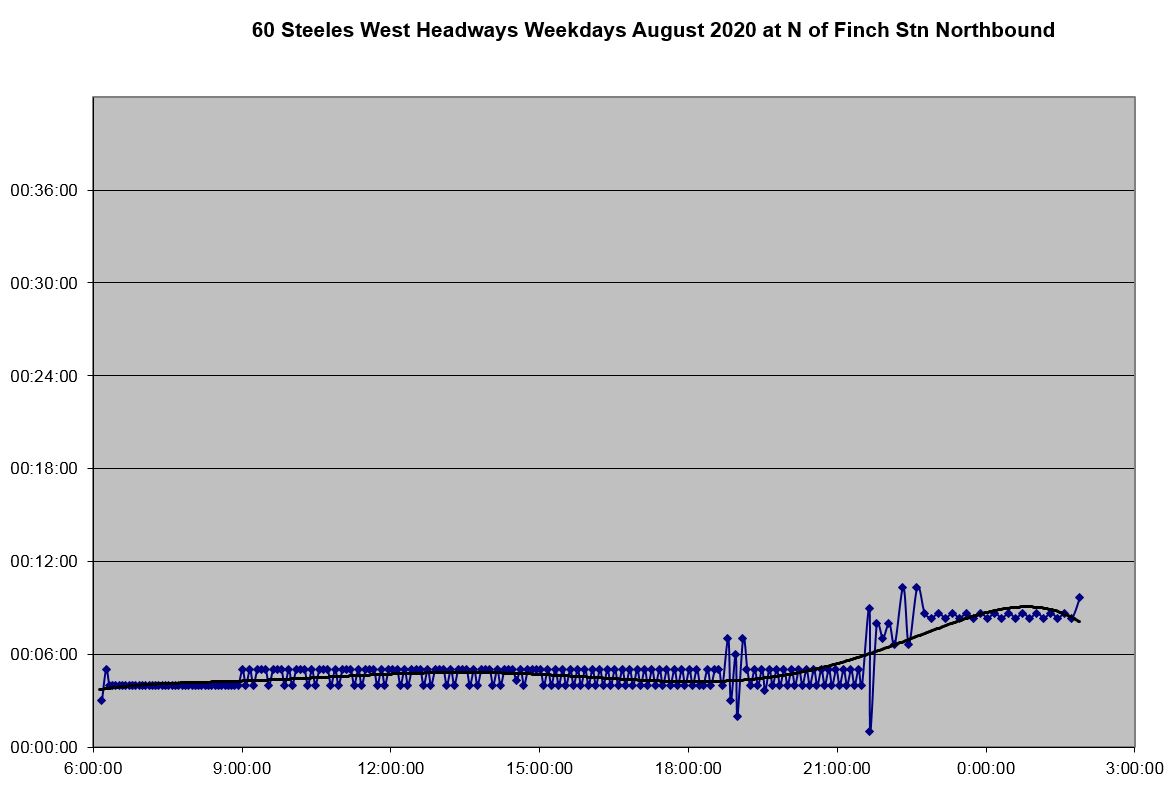
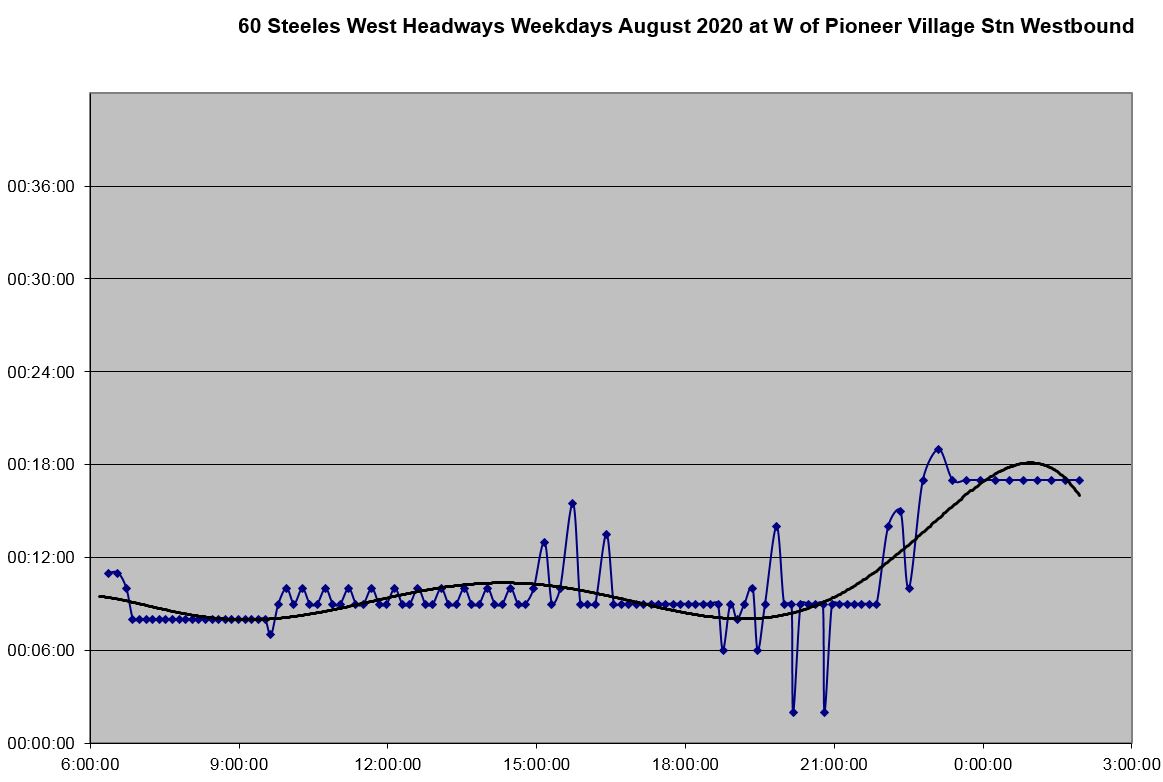
The headway leaving Finch Station was reasonably well behaved in July 2020 with a standard deviation of values at 3 minutes or less almost all of the time.
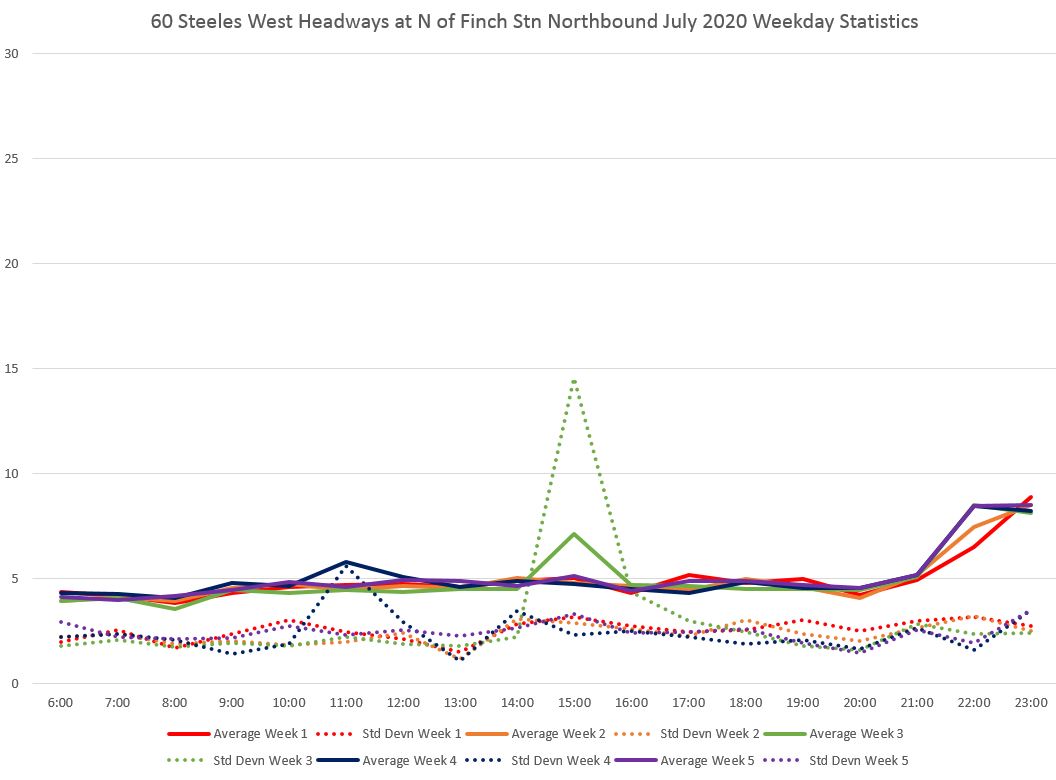
This regularity is reflected in the clustering of individual data points just under the five minute line corresponding to the scheduled headway.
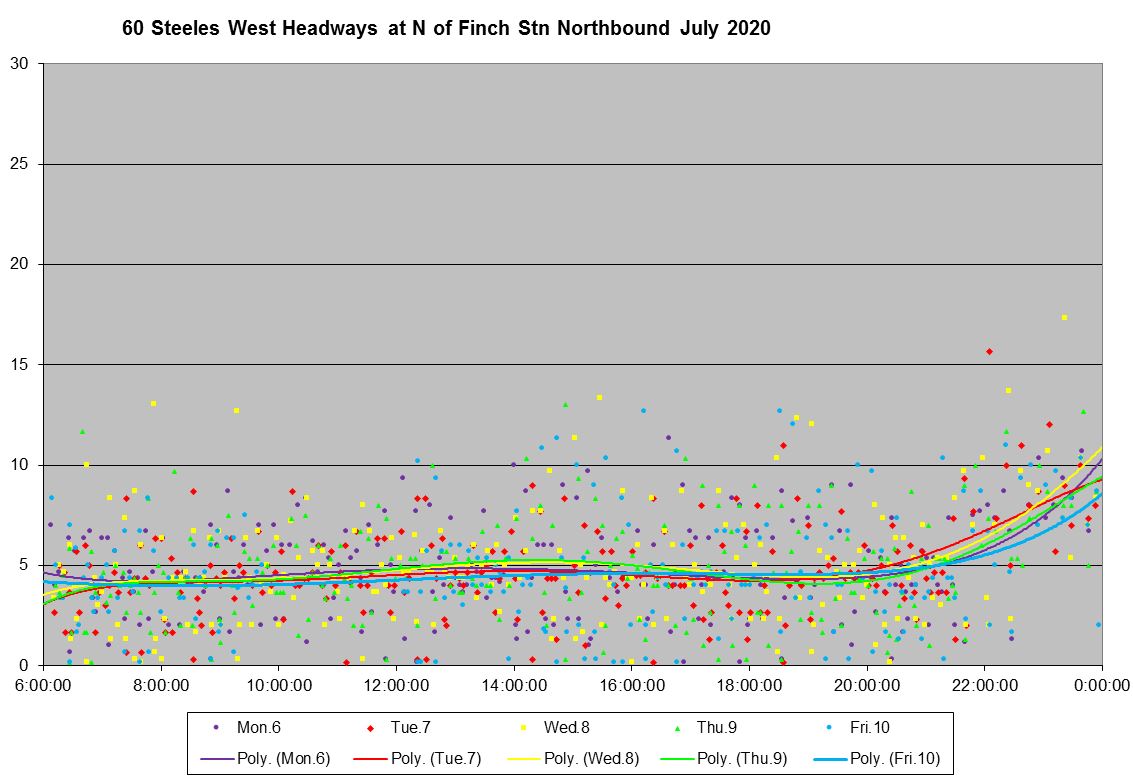
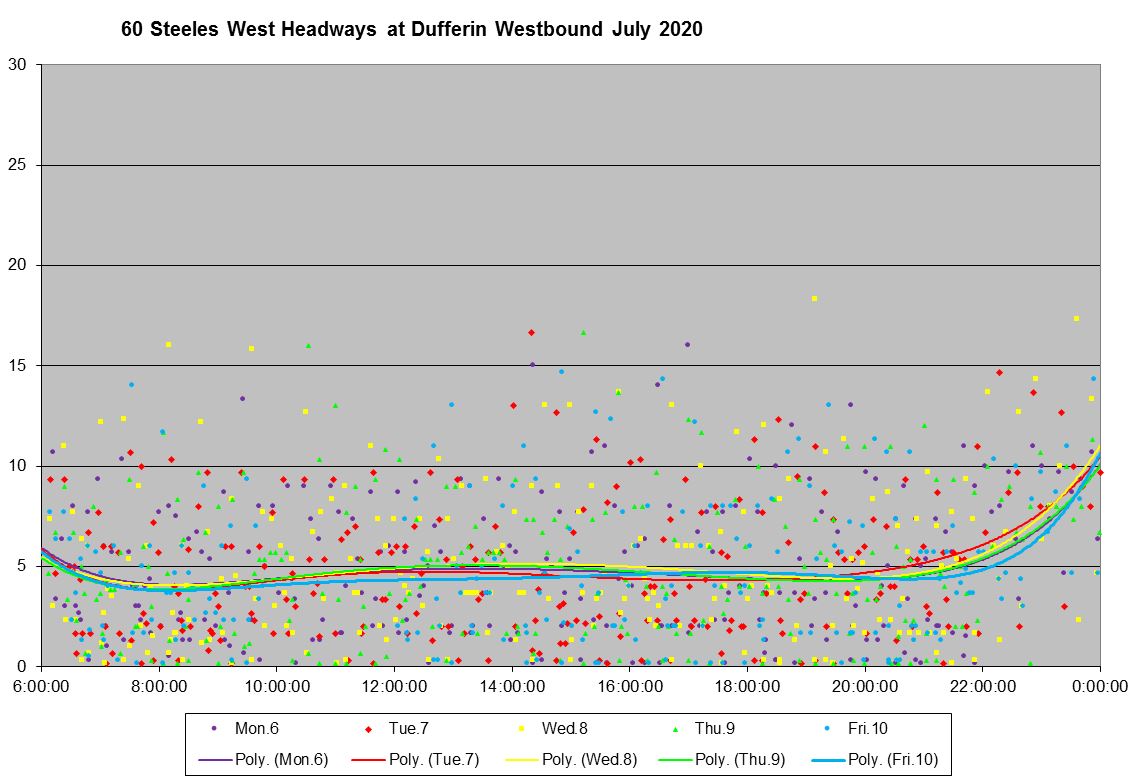
By the time the service reaches Dufferin, the trend line is still in the same place, but the SD values have risen.
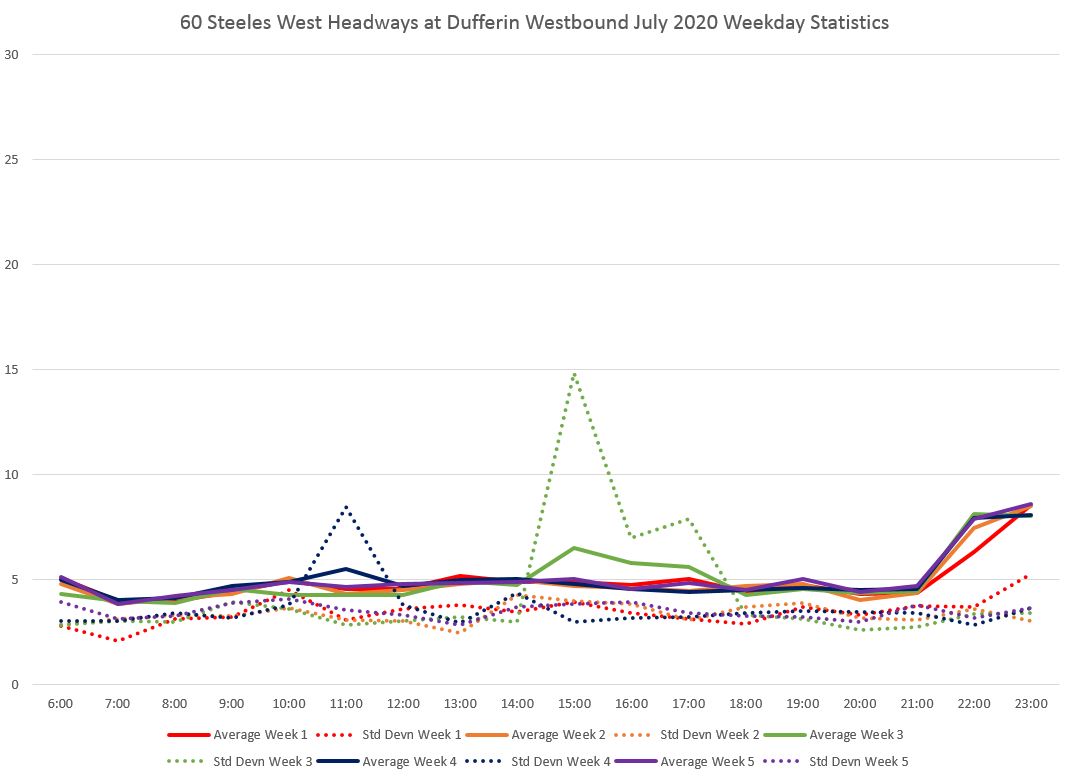
This is reflected in the greater dispersion of headways as buses move along the route. They are now spread out over a range of zero to 10 minutes minutes with several points above that line, but the clustering is a function of traffic signals marshalling the service into waves.
Service is less frequent at Jane Street because half of the buses turn back from Pioneer Village Station. The SD values are also higher showing that not only are the headways wider, but so is the dispersion of their values.
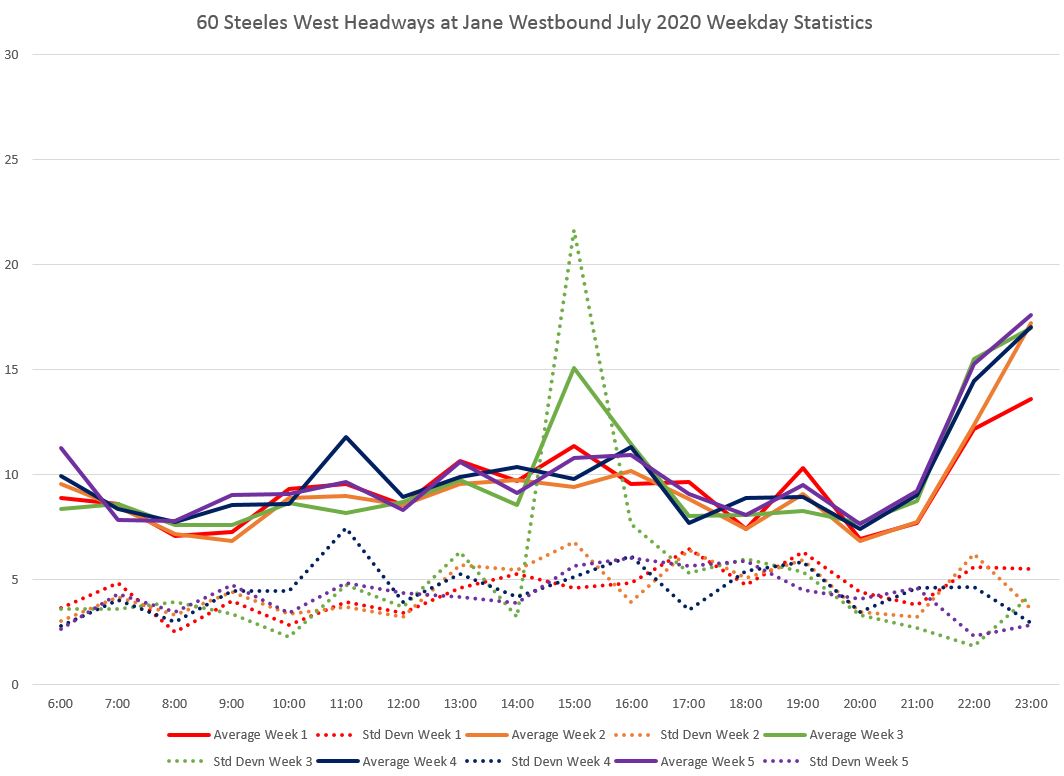
This is quite visible in the detailed data where the headway values span a range of zero to twenty minutes.
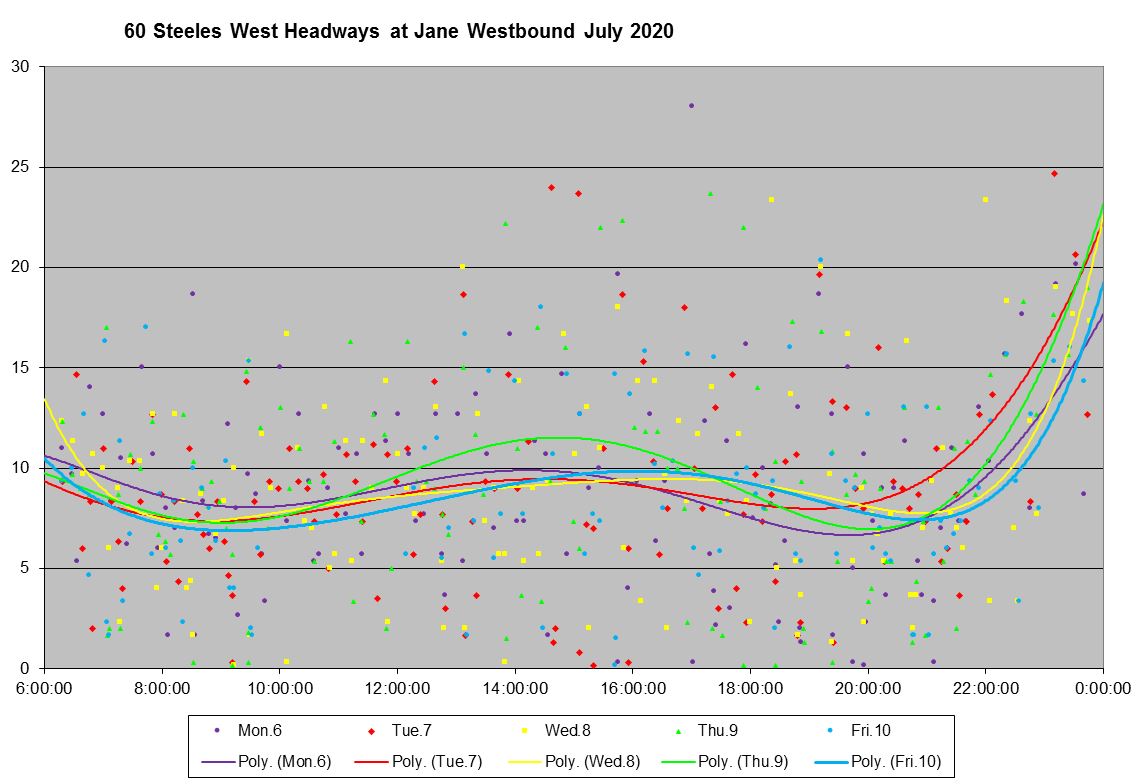
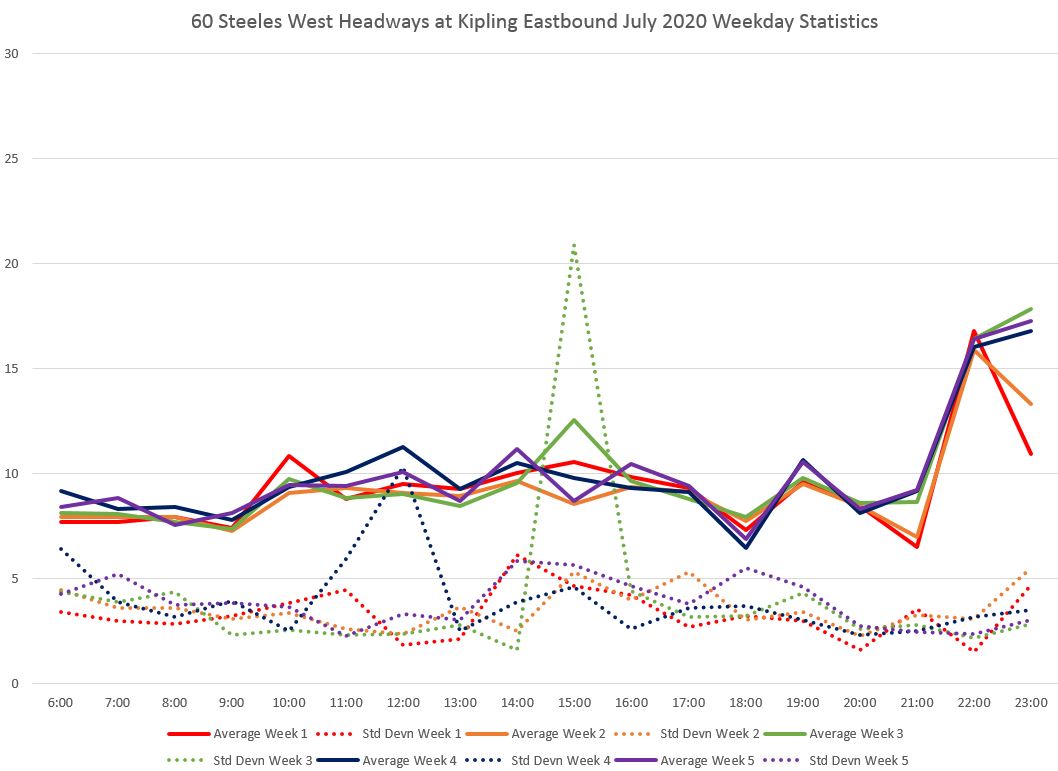
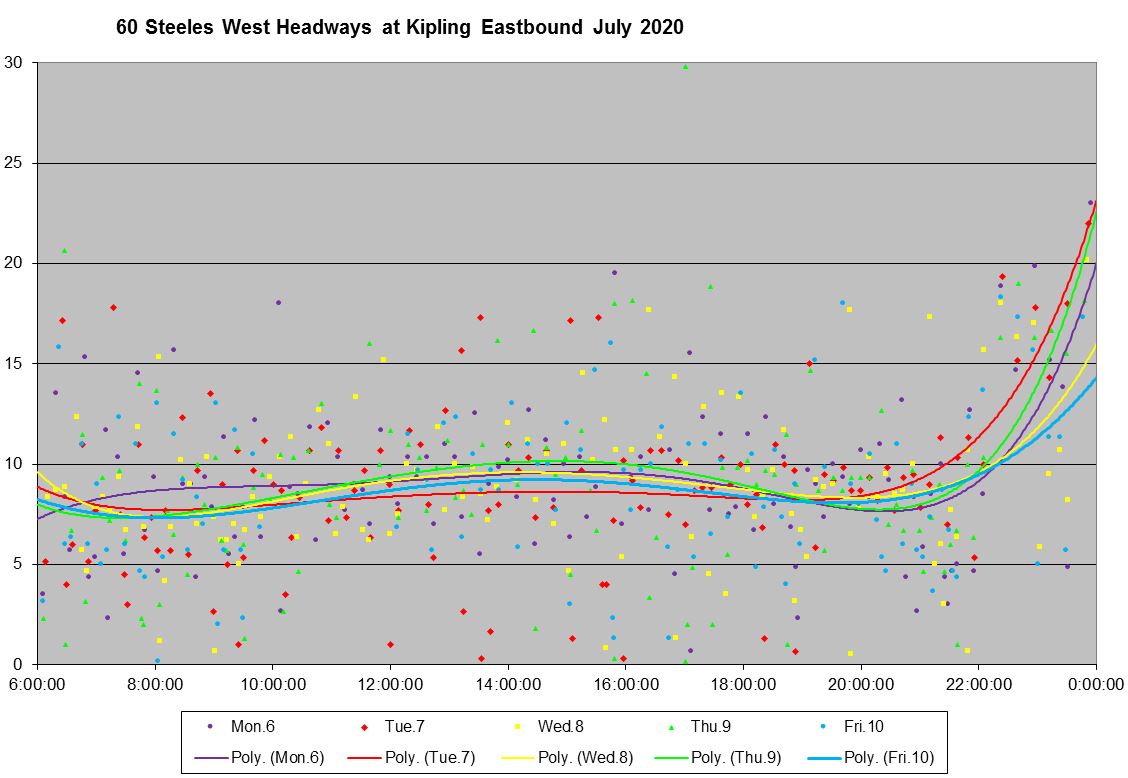
Eastbound service behaves similarly, but as an example I have included charts of the service eastbound at Kipling. This is close to the western terminus of the route, and at this point the headways are better clustered around the scheduled value.
Full chart sets for the locations cited above are linked here:
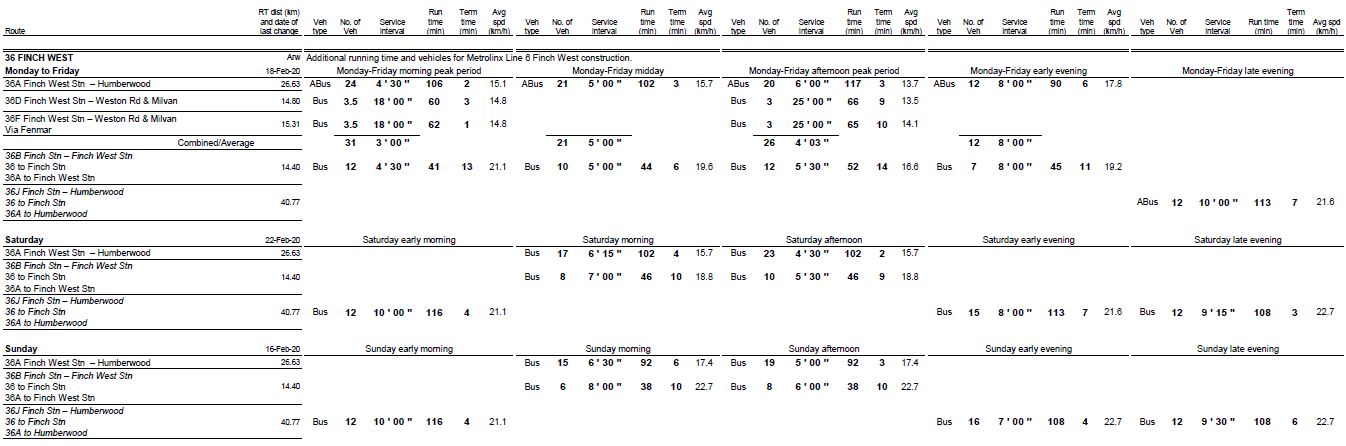
36 Finch West
Service on Finch West is provided by various overlapping routes:
- 36A from Finch West Station to Humberwood operating with articulated buses on weekdays
- 36D and 36F from Finch West Station to Weston Road & Milvan, peak only
- 36B (an internal branch number) from Finch Station to Finch West Station during certain periods
- 36J (an internal branch number) from Finch Station to Humberwood replacing the 36A and 36B services during certain periods
- 939B Finch East Express from Finch West Station to Scarborough Town Centre during certain periods
Generally speaking the consolidated “36J” only operates during periods of lighter demand.
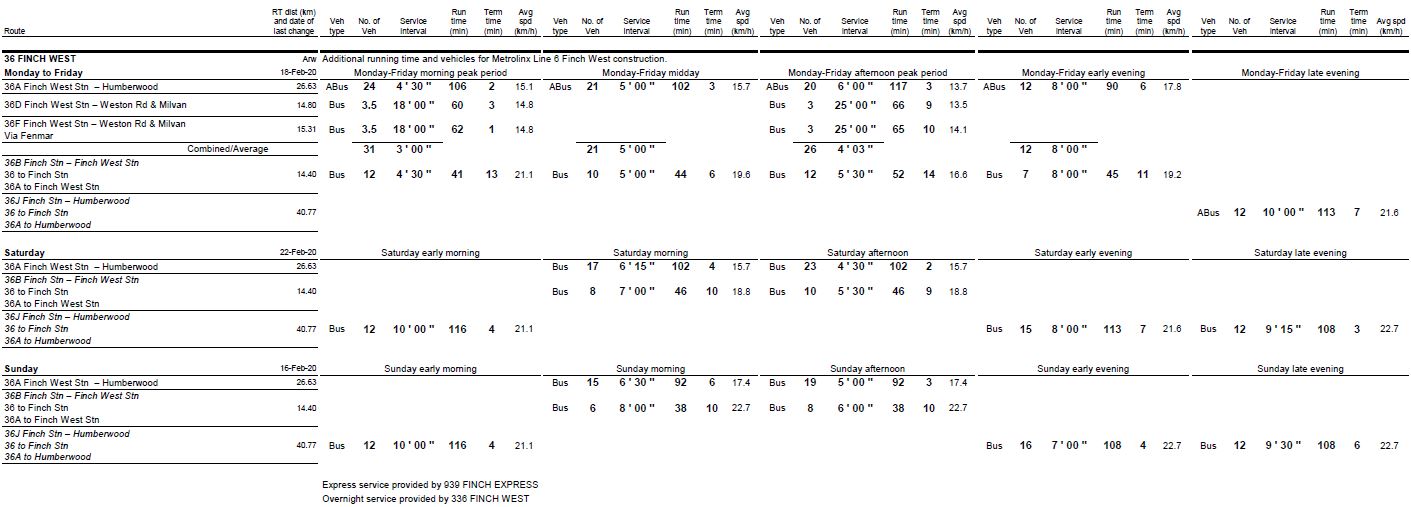
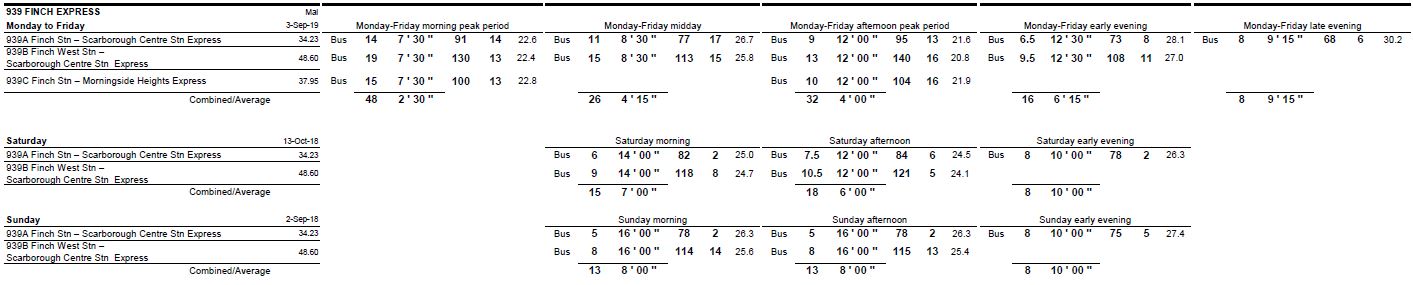
In the June schedule summary, the same service design was used for 36 Finch West that had been in place since Feruary 2020. However, the 939 Finch East Express service to STC was cancelled.
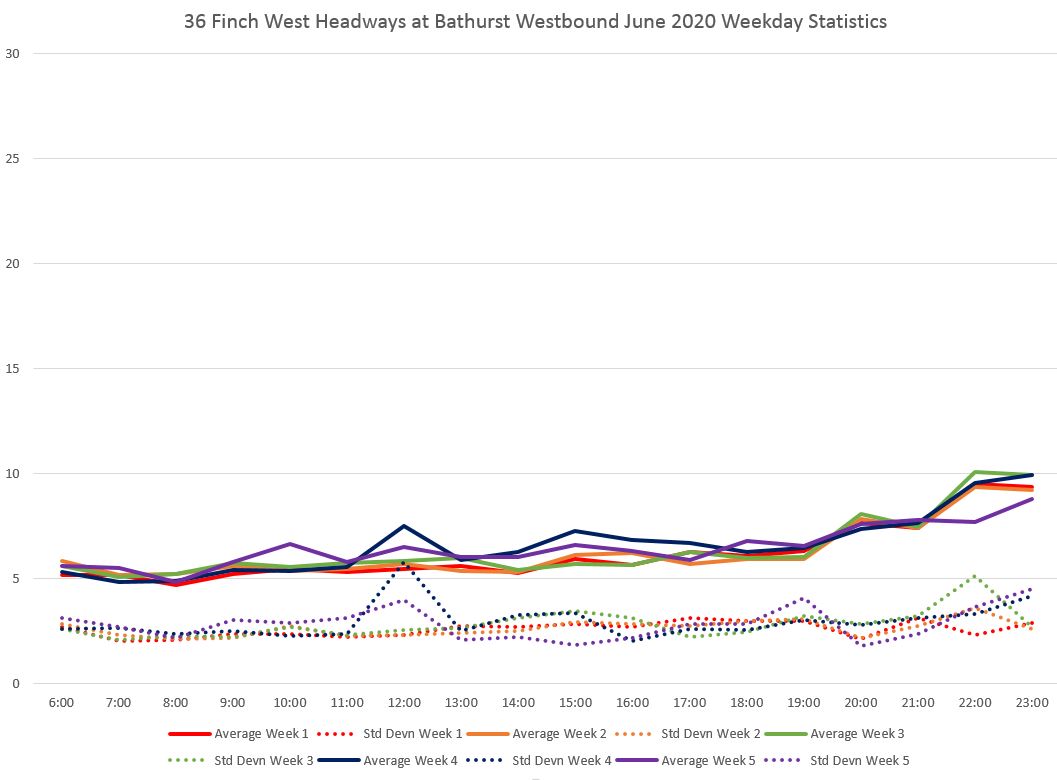
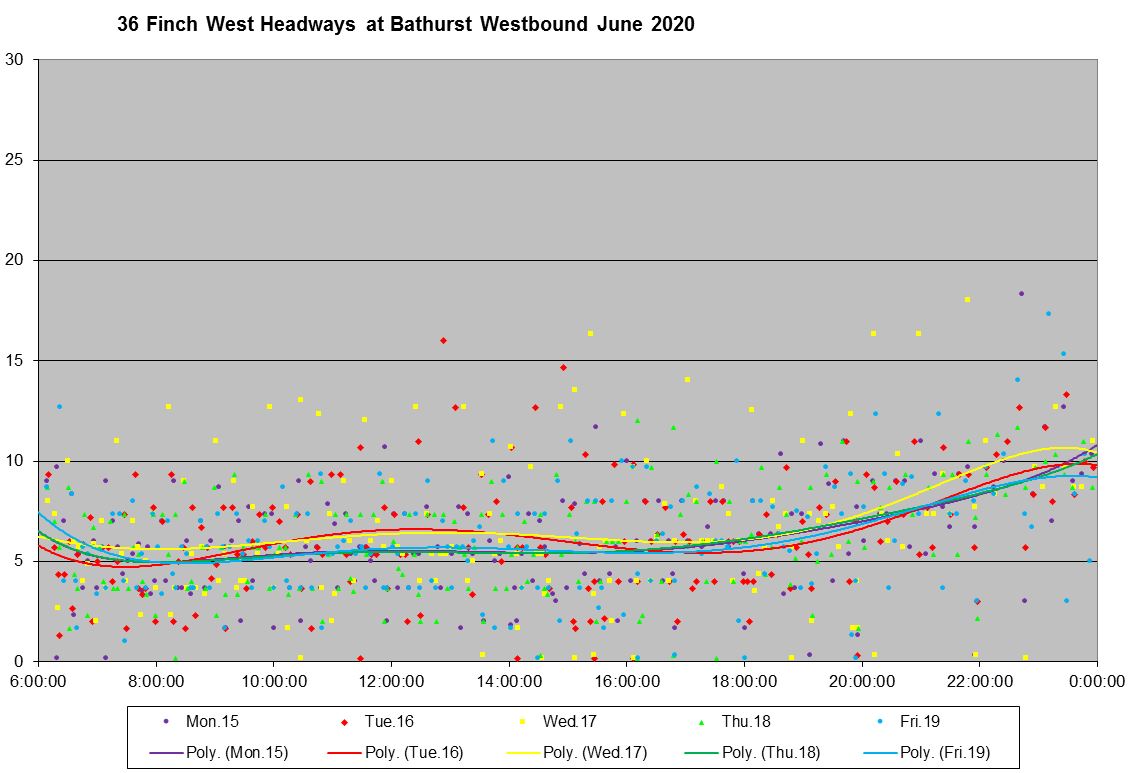
The service westbound at Bathurst for most of the day consists only of the 36B shuttling back and forth between Finch and Finch West Stations on a regular headway.
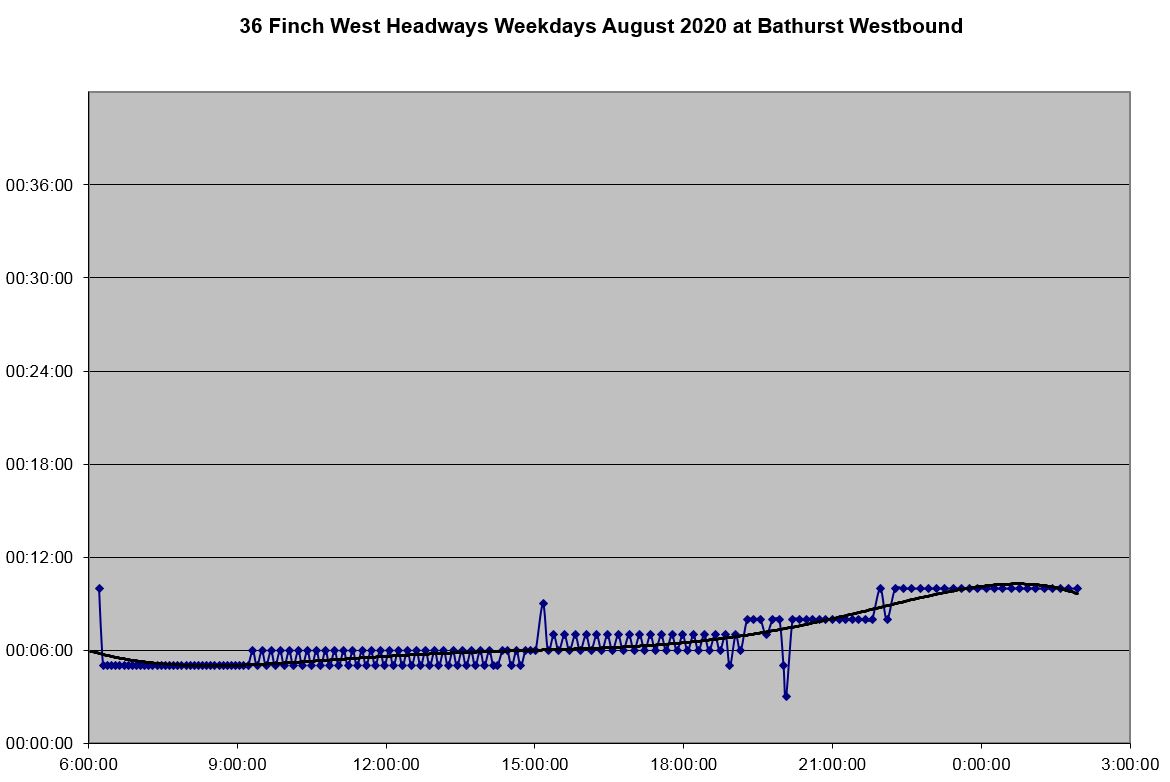
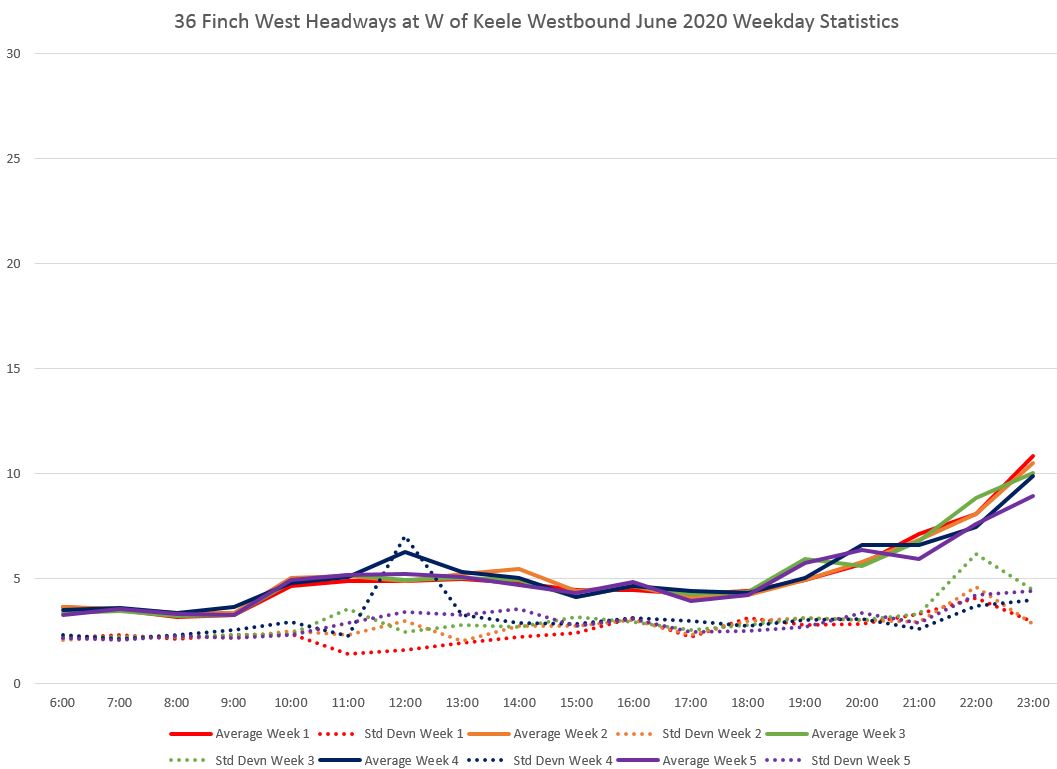
West of Finch West Station (at Keele) the peak service shows the effect of the 36 D/F Weston/Milvan services overlaid on the 36A Humberwoods with irregular headways because these services do not blend.
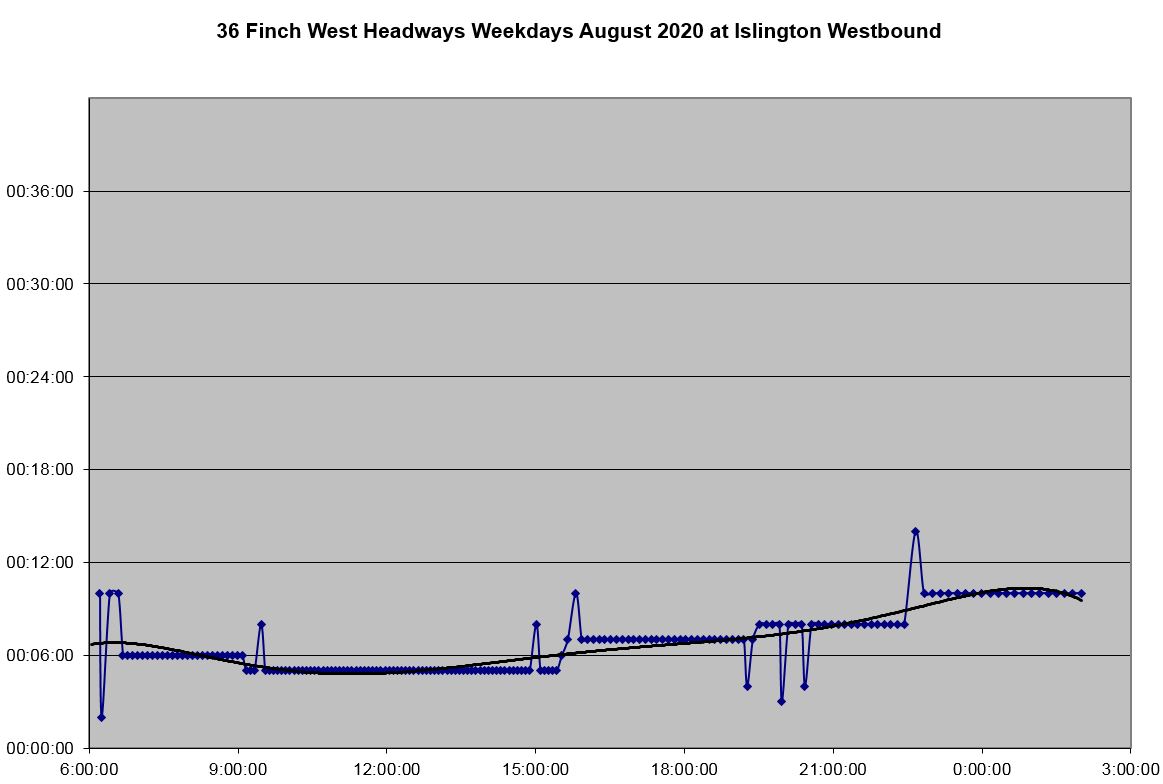
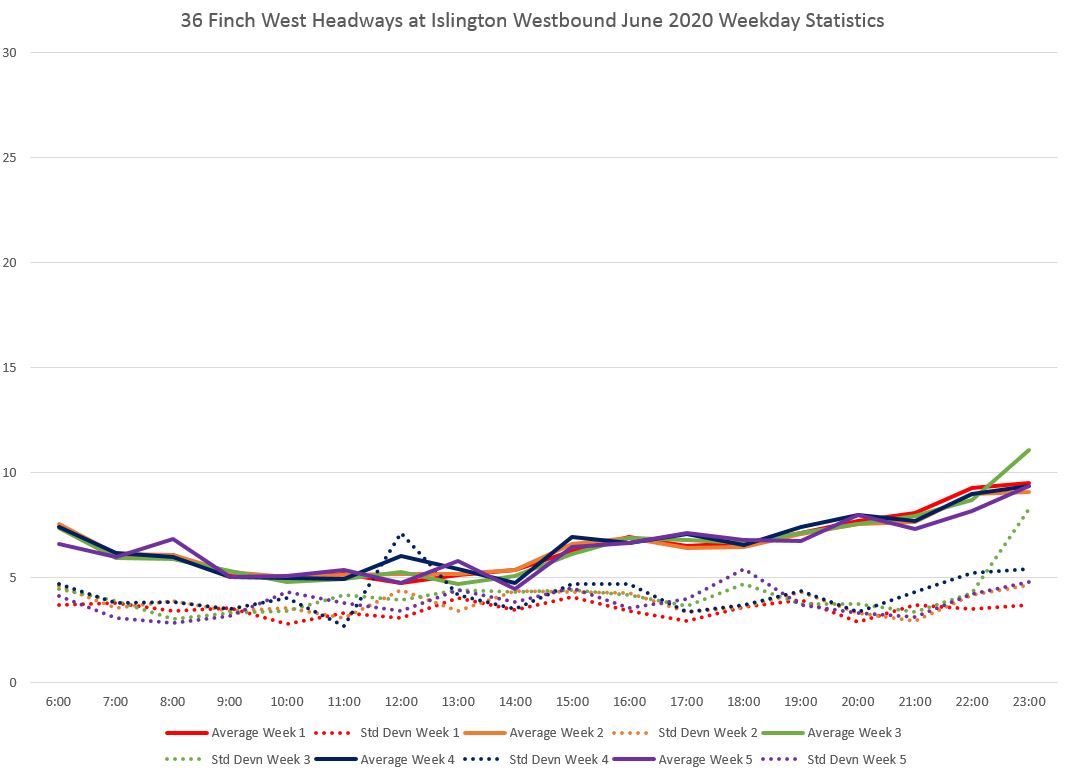
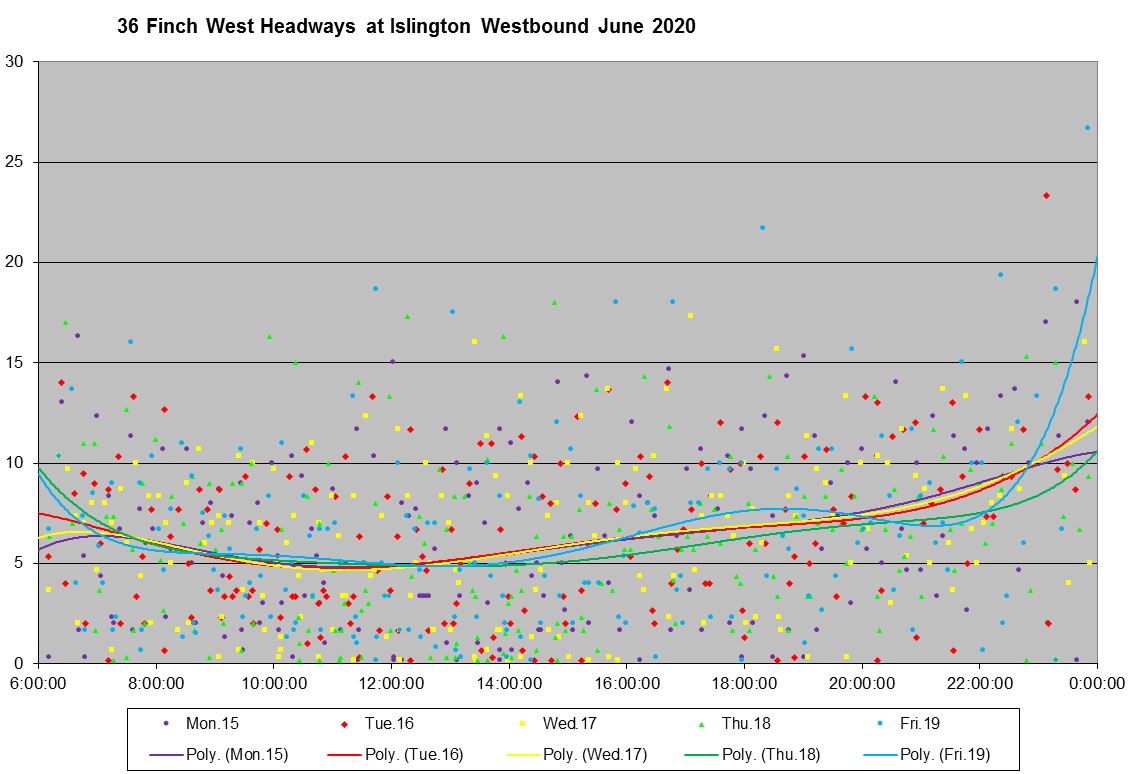
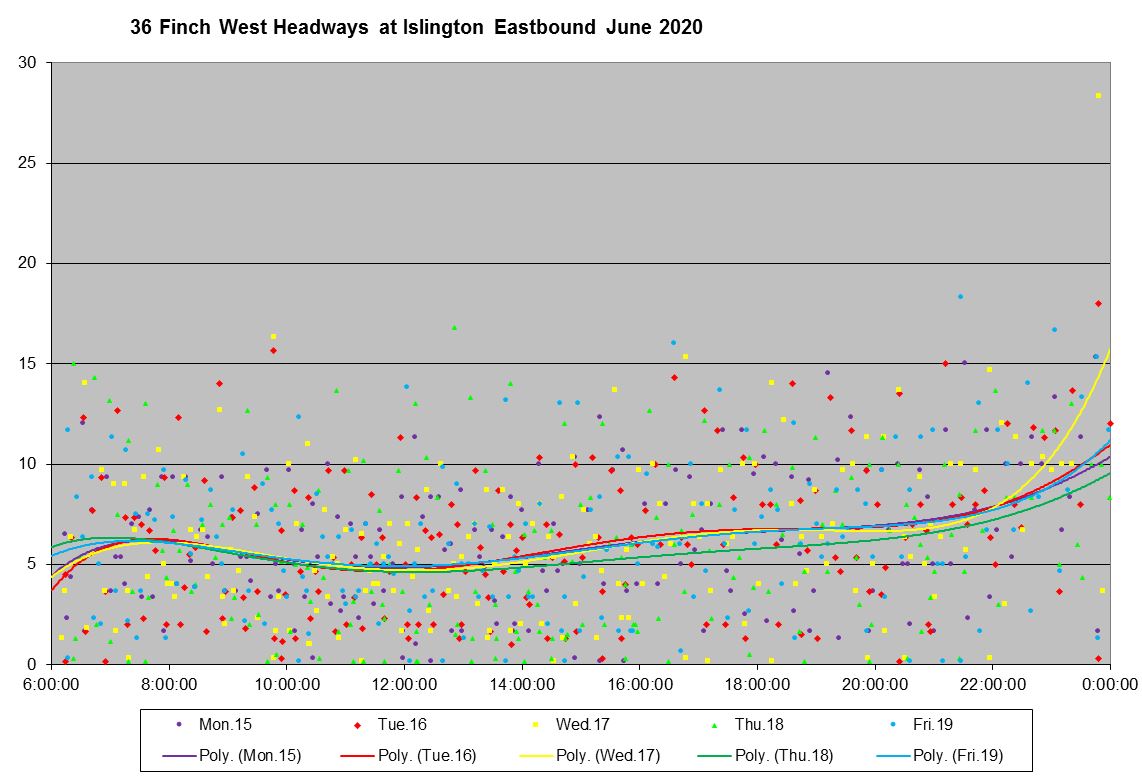
At Islington, only the through 36A Humberwood service remains, and it has a regular scheduled headway.
Service operated westbound a Bathurst lies in a consistent band for most of the day because there is little change in the scheduled headway. The standard deviation of the headway values is about three minutes, and most of the data points lie in the zero to ten minute range.
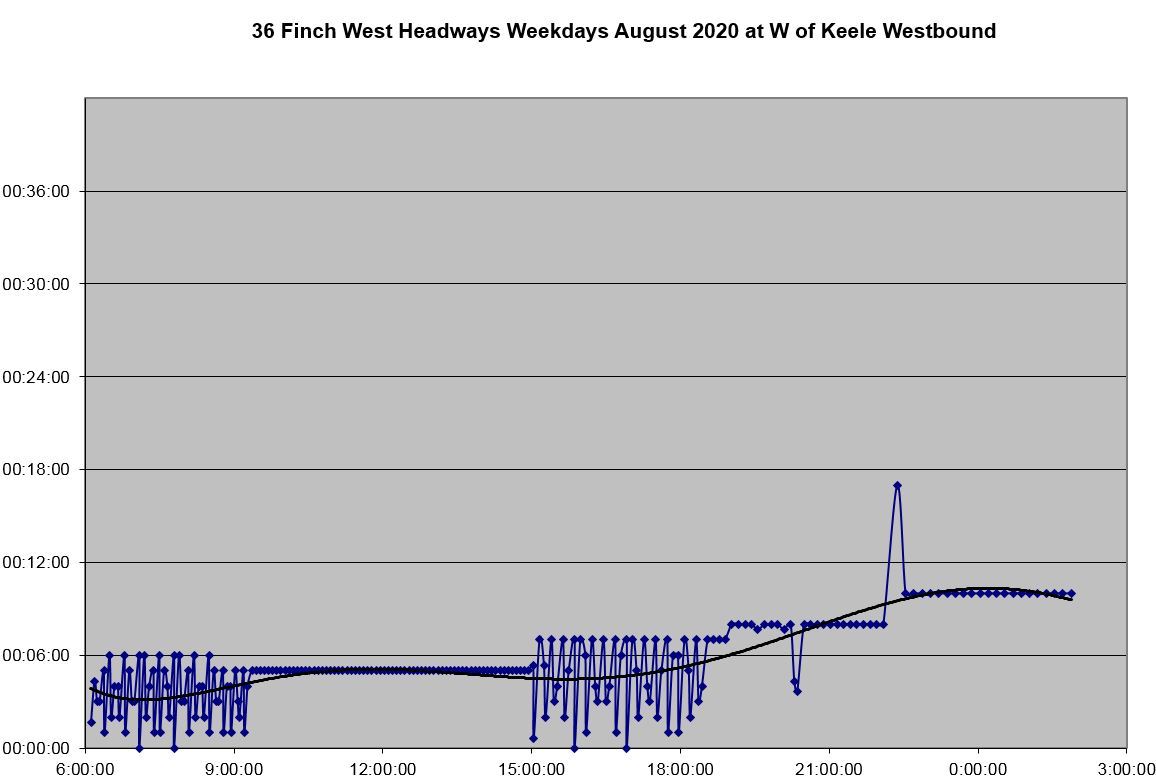
Westbound at Keele the scheduled headway is lower with overlapping service during peak periods from the main Finch service and the branches to Weston/Milvan. Headway lie in a band from zero to ten minutes.
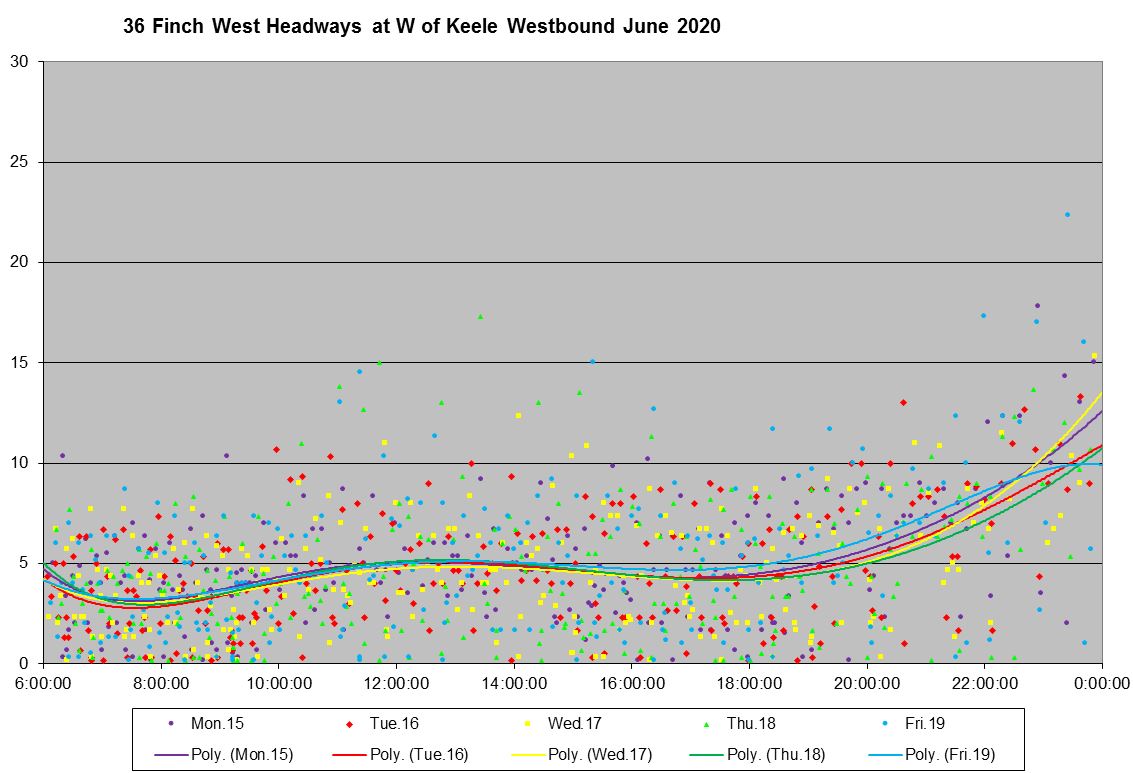
When the service arrives at Islington, the Weston/Milvan peak period branches have dropped off and only the through service remains. However, the headways lie in a wider band of zero to 15 minutes as is typical for the outer ends of routes.
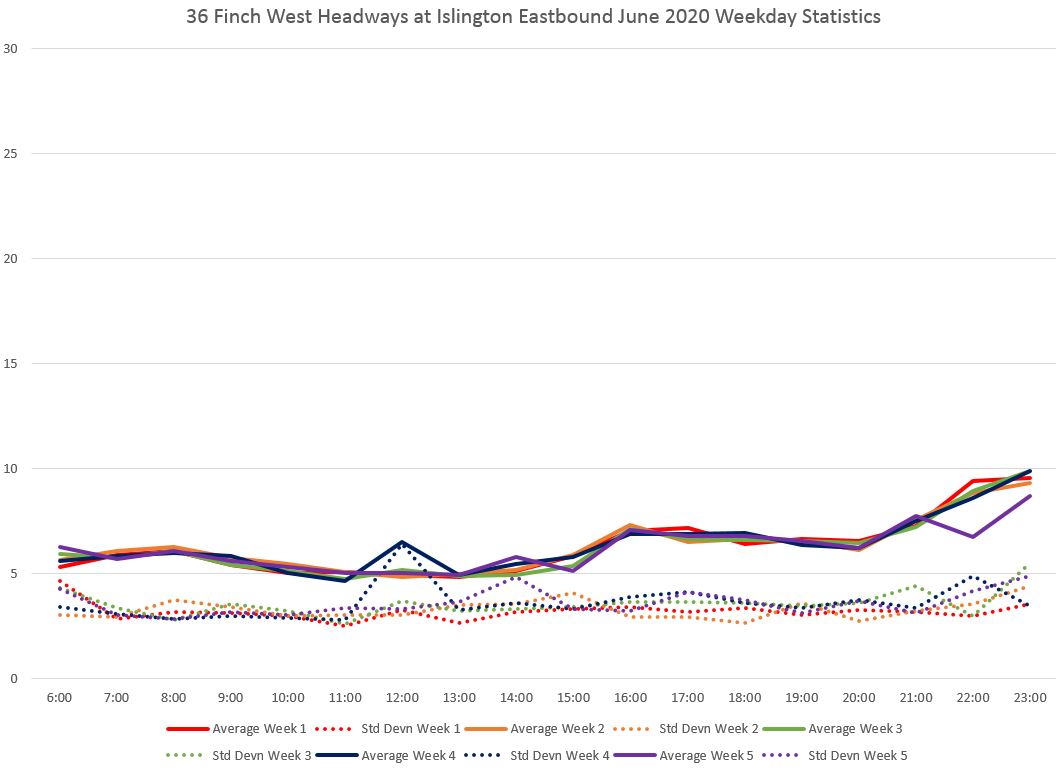
At Islington eastbound, the headways are not quite as dispersed as westbound, but there are gaps over 10 minutes and bunching that will only worsen as the buses travel further east. The remainder of the route eastbound looks similar to the westbound service and in the interest of space I have omitted charts for it.
Full chart sets for locations cited here are linked below.
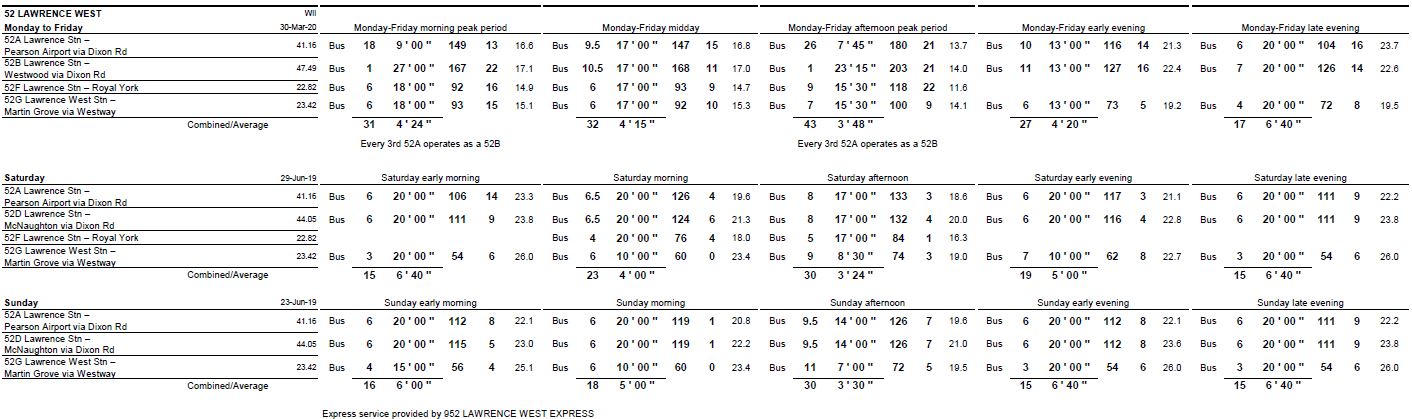
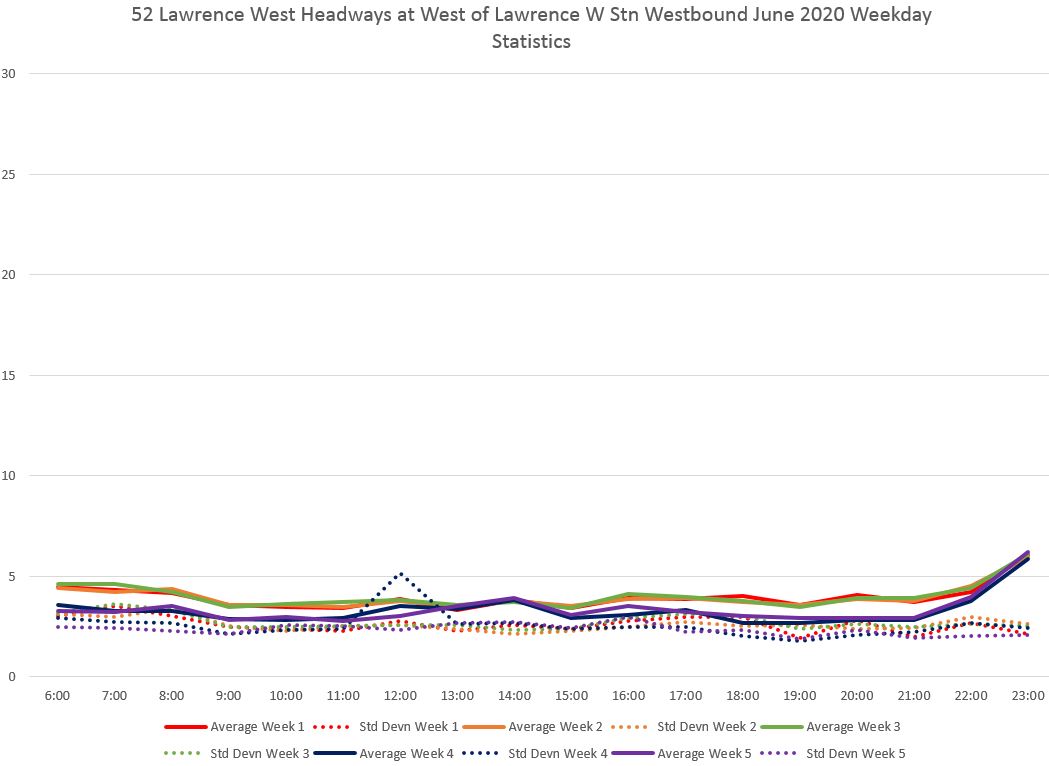
52 Lawrence West
Service on the Lawrence West corridor is provided by several routes:
- 52A from Lawrence Station to the Airport via Dixon Road
- 52B from Lawrence Station to Westwood via Dixon Road
- 52D from Lawrence Station to MacNaughton (weekends only, a shortened version of the 52B)
- 52F from Lawrence Station to Royal York Road weekday daytime only
- 52G from Lawrence West Station to Martin Grove and The Westway
- 952 Lawrence West Express from Lawrence Station to the Airport (peak only)
Here is the service design used in March:

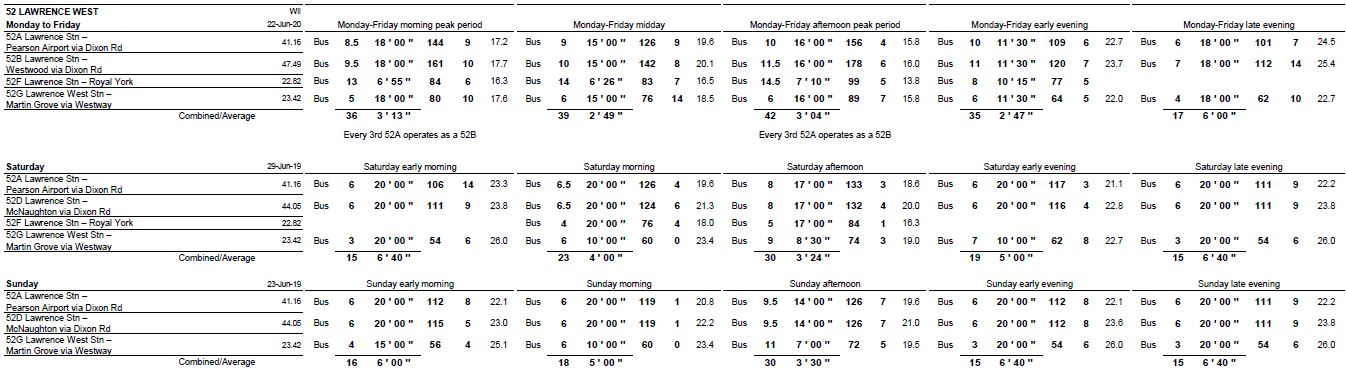
In the June schedules, the 952 Lawrence West Express service is dropped, and the weekday service design for the various 52 branches is revised.
- During peak periods, the one-in-three 52B Westwood service (every third 52A to the airport continues to Westwood) scheduled in March, is replaced by an alternating service with every second 52A running as a 52B (contrary to the legend on the summary below). The 52A/B service remains every 9 minutes, but with more service to Westwood in June than in March.
- Offpeak weekday service on the 52A/B continues to run with alternate trips to Westwood, but on an improved headway compared to March.
- The 52F service to Royal York is operated by trippers (although this is only evident by looking at the service pattern in the schedule) and it is substantially improved.
- There are minor changes to the 52G Martin Grove service.
- These revisions are accomplished both by changes to the number of buses on the route and by reduction in scheduled travel times to reflect better traffic conditions.
The scheduled headways show the effect of overlapping services and trippers that are not scheduled at a common headway. Although three services 52A, 52B and 52F operate as a blended service with one bus on each branch every 18 minutes (June schedules, AM peak), this results in 12 minute gaps on segments where the Westway/Martin Grove 52G buses are missing — east of Lawrence West Station and on the Dixon Road branch.
This build-in irregularity combines with the Royal York 52F service to give a highly variable headway. A nine minute AM peak headway on the 52A/B service overlaps a 6’55” headway to Royal York resulting in combined service with varying waits built into the schedule. The same effect is seen in the PM peak and early evening.
West of Lawrence West Station, the 52G Westway service is included producing more frequent service, but on a ragged headway because the blending does not work.
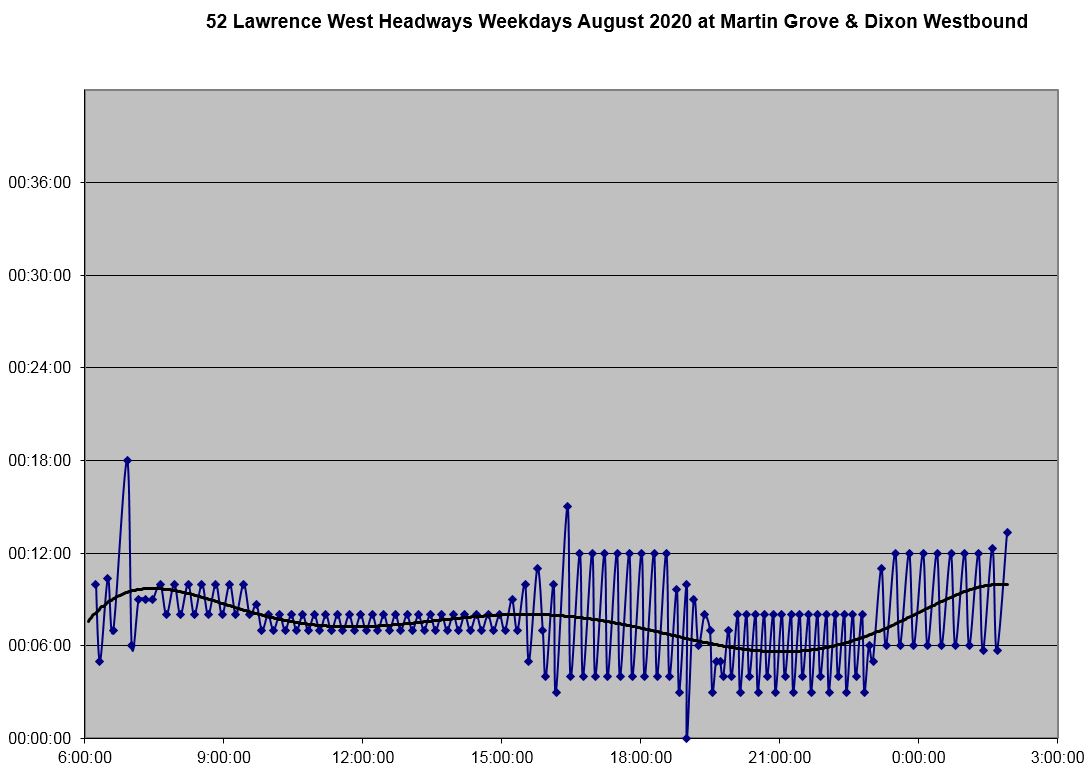
On Dixon Road, the 52F Royal York and 52G Westway services have dropped out, leaving the 52A service to the Airport and the 52B to Westwood. During the day these are scheduled with a blended headway, but from the PM peak onward, there are alternating short and long headways in the schedule.
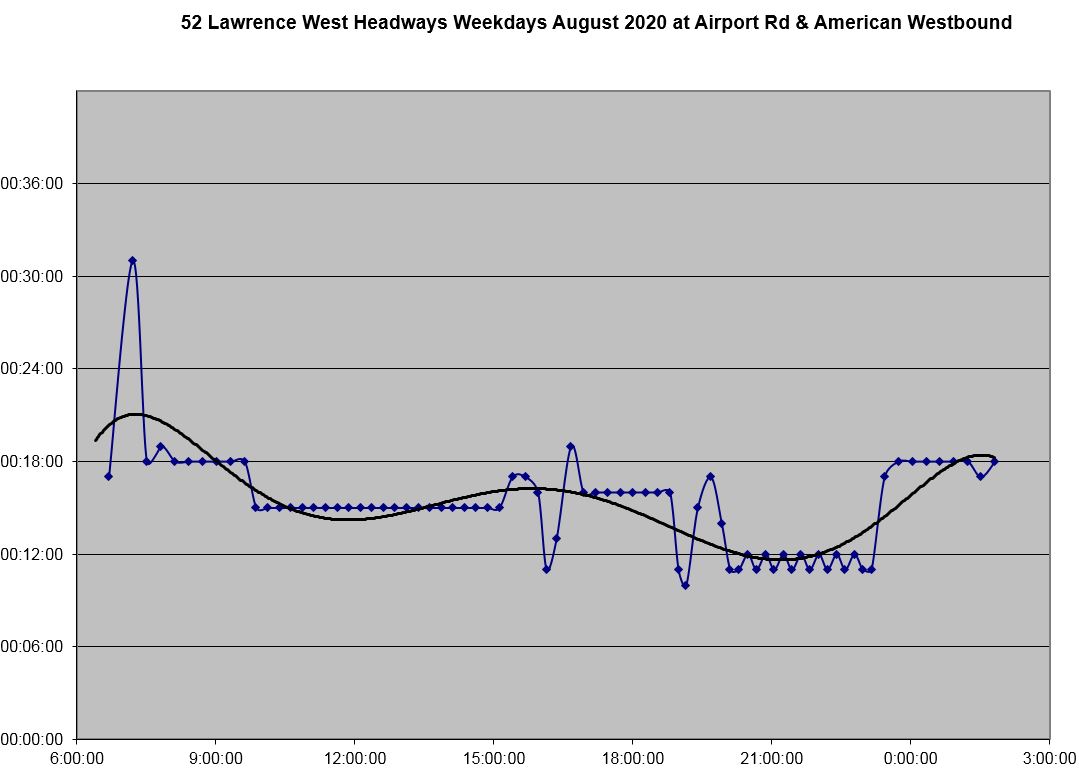
Beyond Pearson Airport, only the 52B Westwood service remains, and its scheduled headways are steady except during transitional periods.
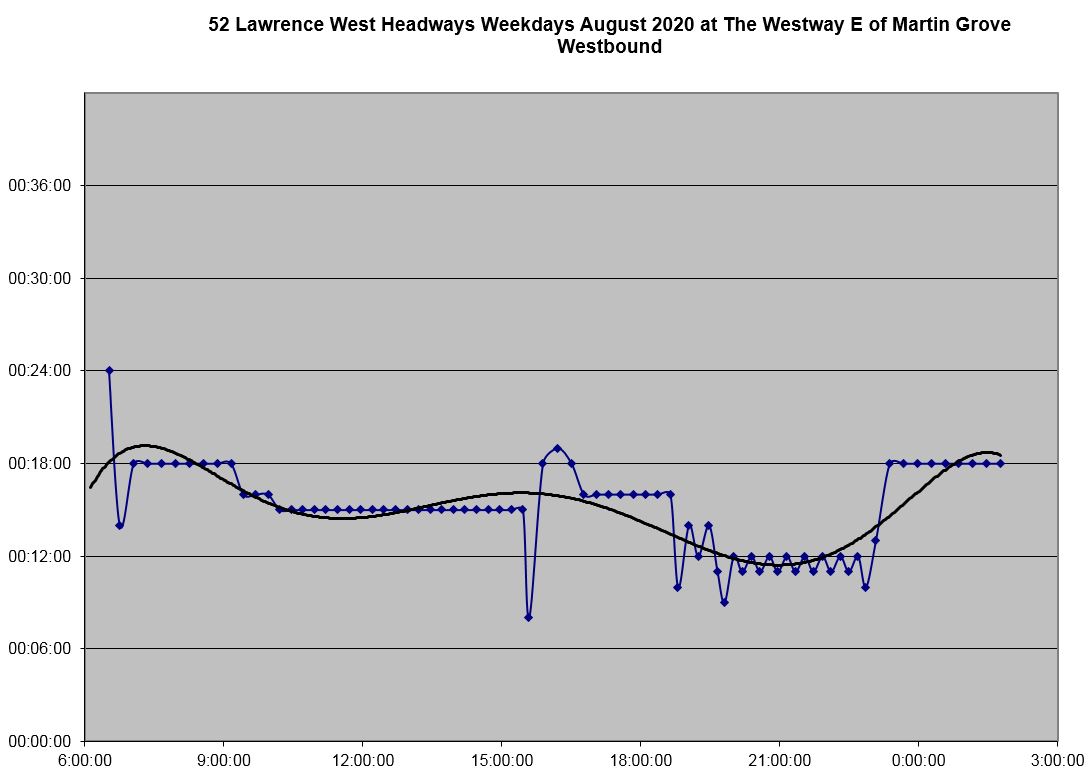
Similarly, on The Westway, with only one branch, the 52G, the scheduled headway is fairly consistent.
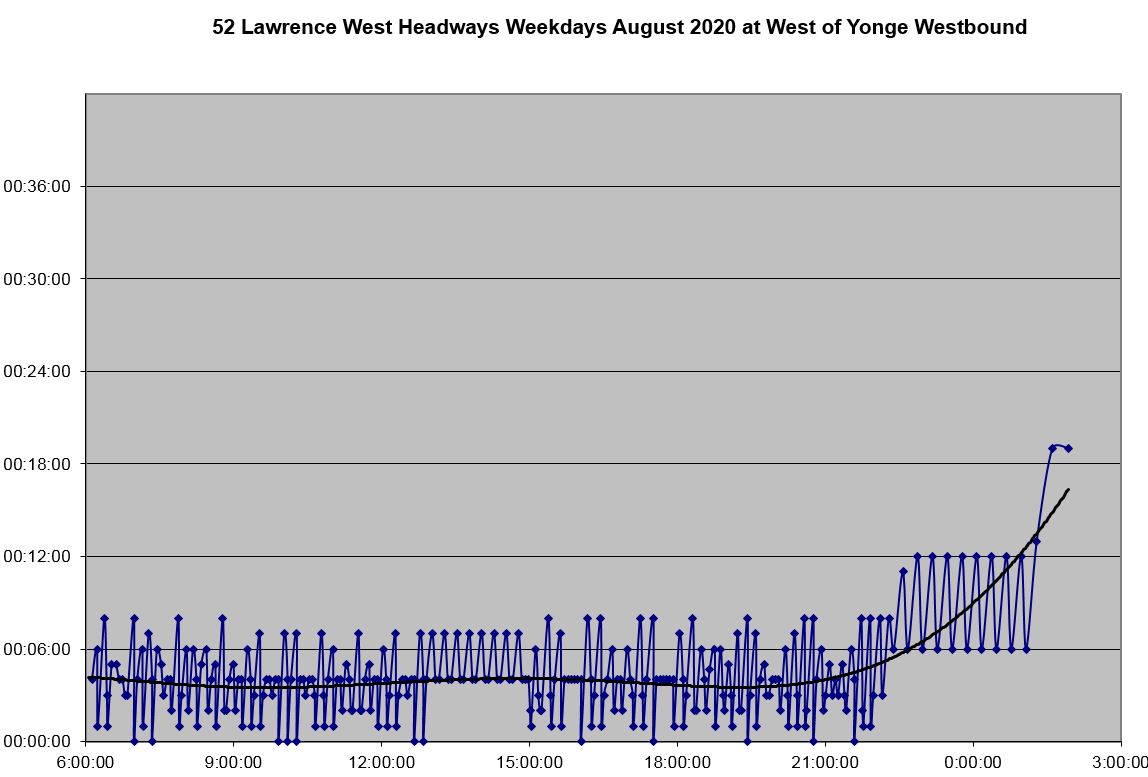
Leaving Yonge Street westbound the tracked service changed in the last two weeks of June because the added tripper service was part of the schedule.
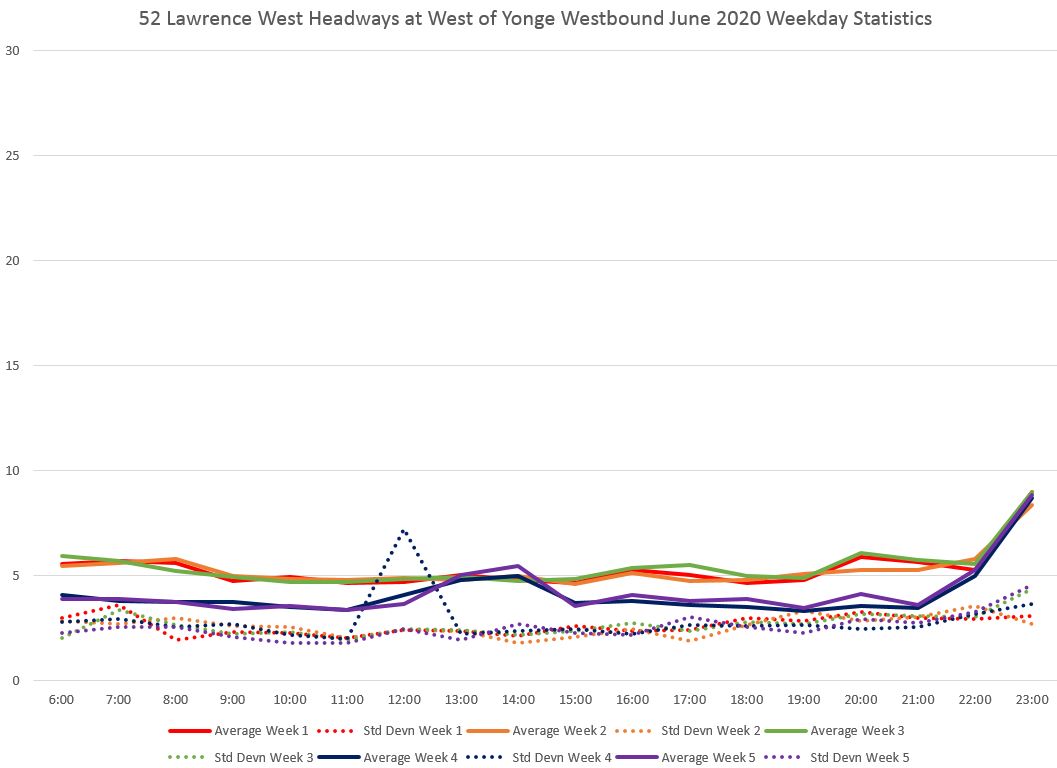
In week 4, the service westbound from Yonge has headways distributed over a range from zero to ten minutes and notably has a lot of data points right at the zero line (x-axis). This is not surprising considering that the schedule is built that way as shown above.
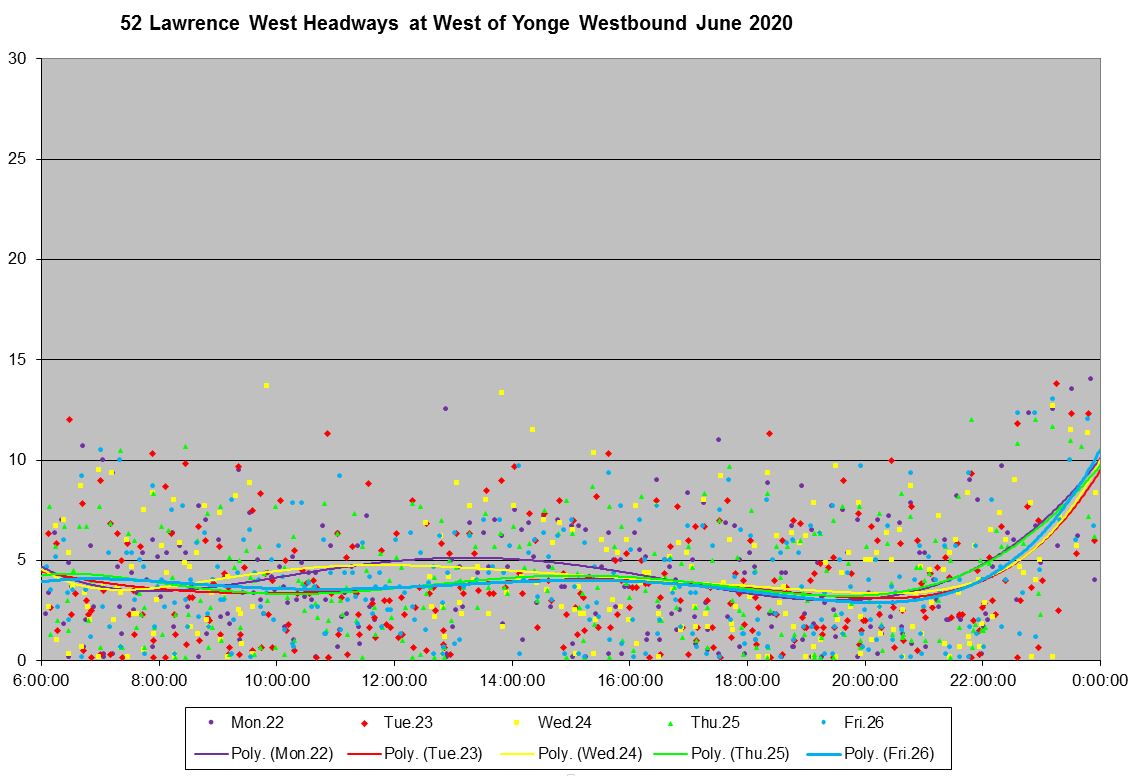
West of Lawrence West Station, the Royal York 52F service has joined in. The average headway is lower, but the SD value is almost equal to the headway showing that there is a lot of bunching.
The detailed data show that many headways are zero indicating that two or more buses crossed the screen line within the same 20-second interval in which these data are plotted.
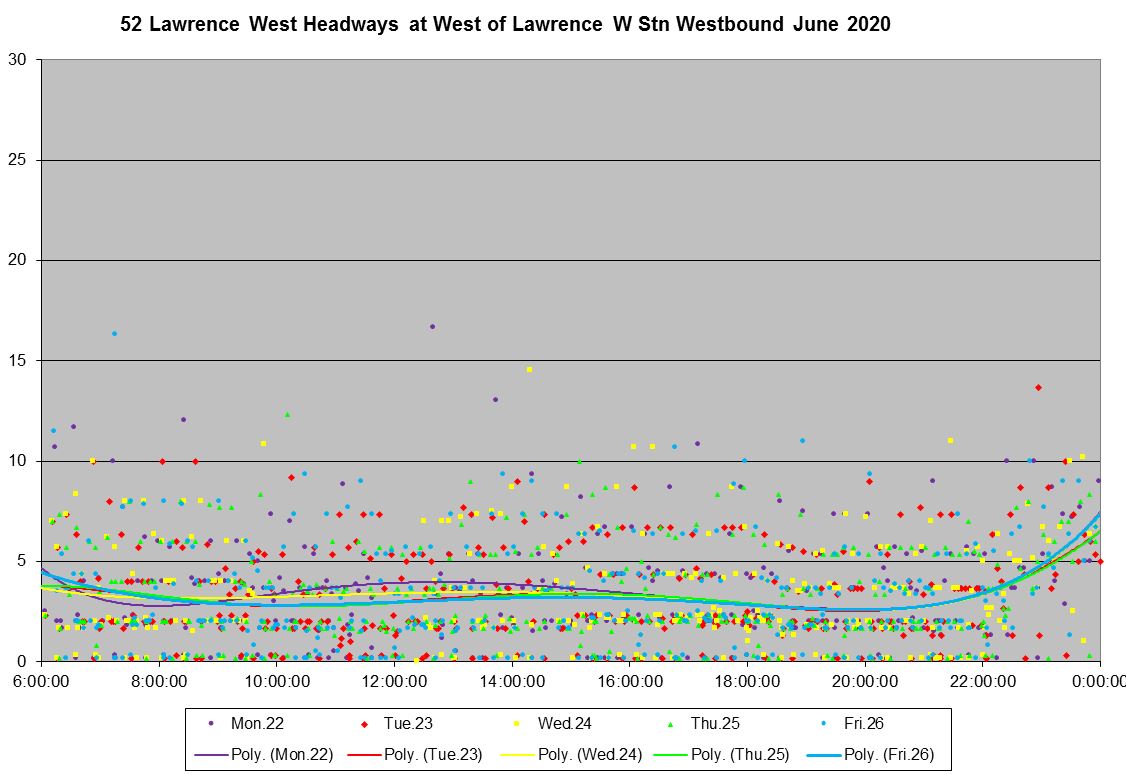
On Dixon Road, only the 52A/B services to the airport remain. The SD value is high at five minutes or more, in part because of the scheduled uneven headways and in part because the service simply is not well-spaced.
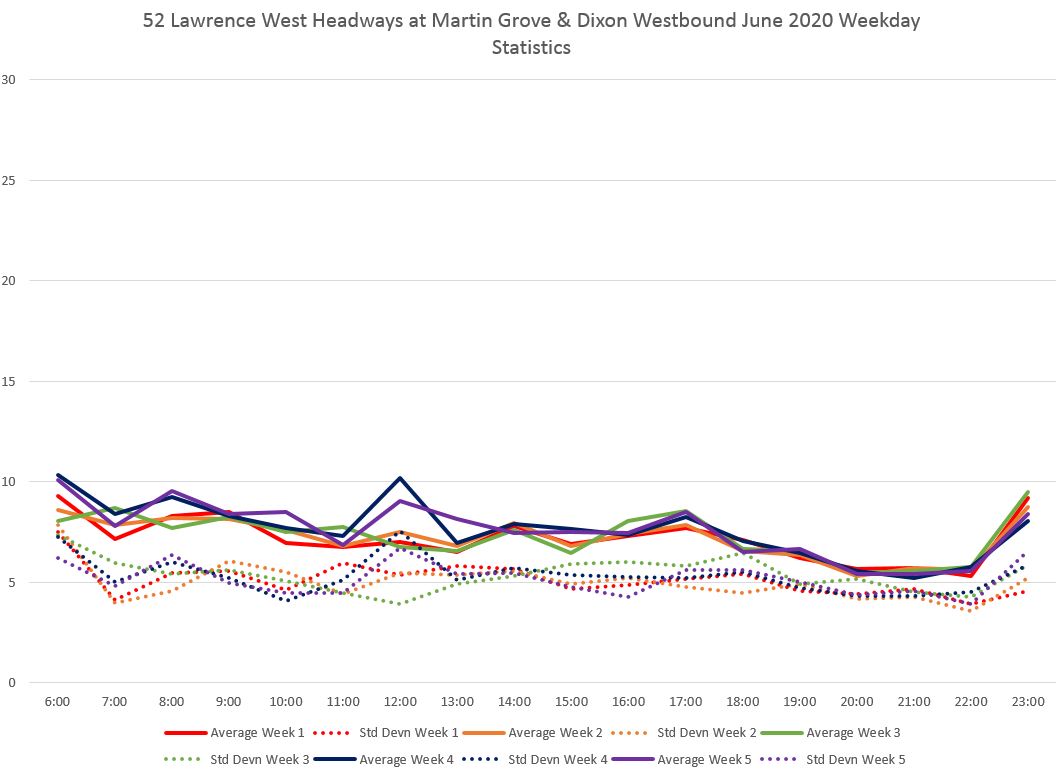
The tracked service in week 4 is spread over a range of headways from zero to almost twenty minutes.
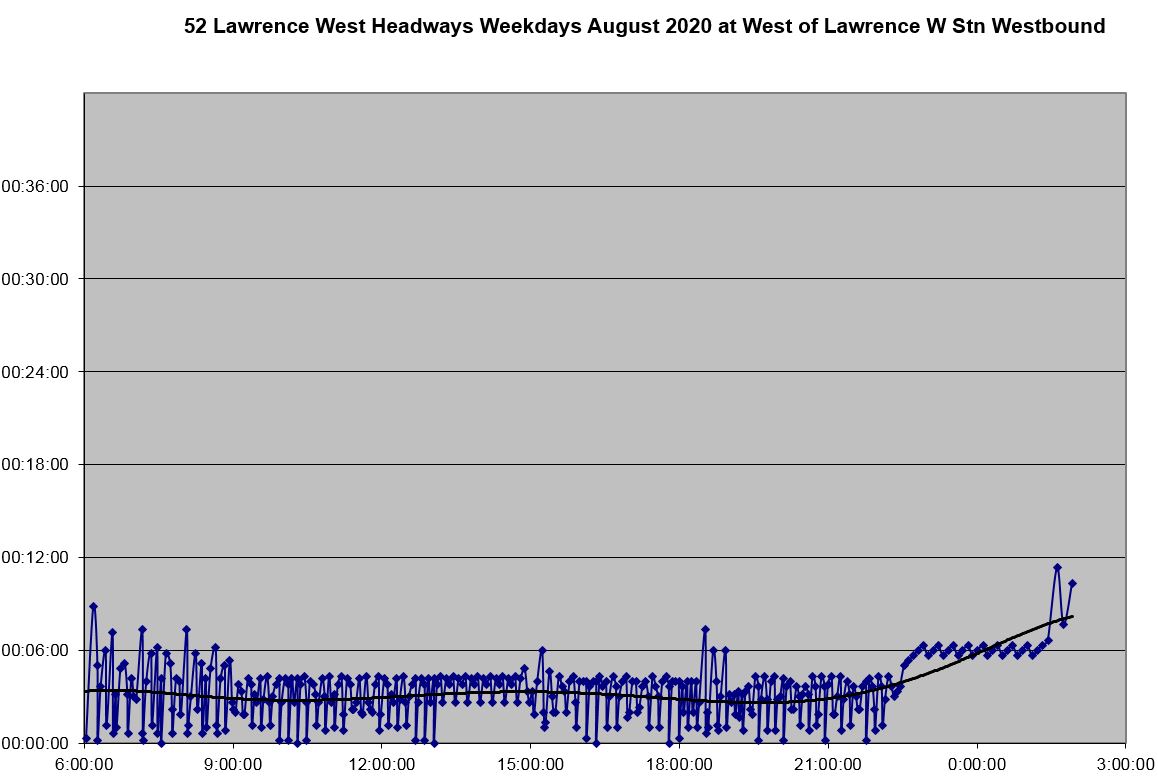
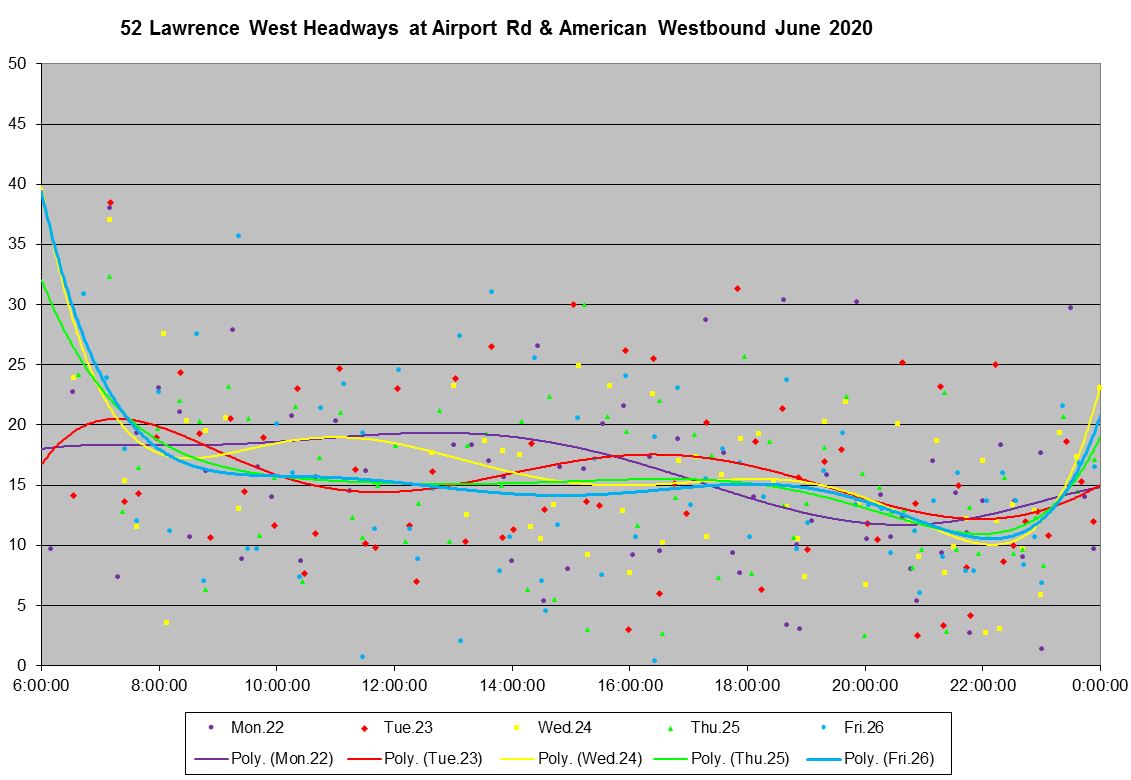
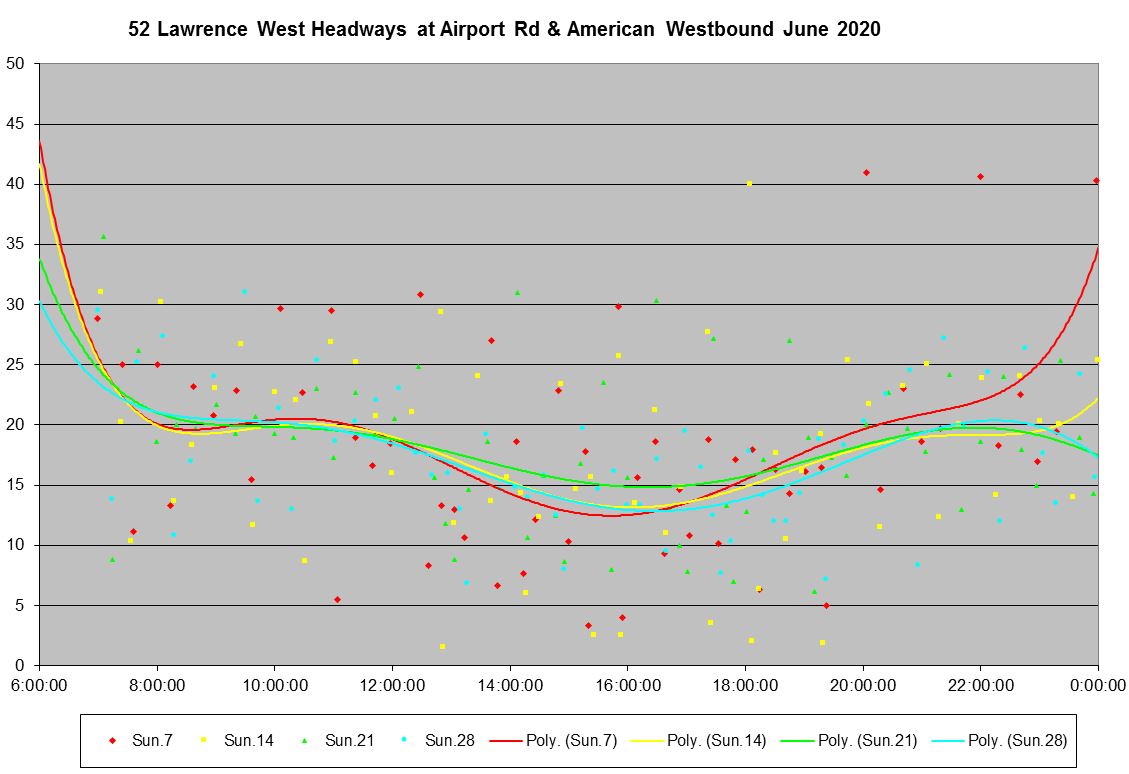
West of the airport, only the service to Westwood Mall remains. Note that these charts have a higher y-axis maximum of 50 minutes so that all of the data points will fit on the chart.
The SD value lies between 5 and 10 minutes showing badly scattered headways even though for much of the day a consistent headway is scheduled.
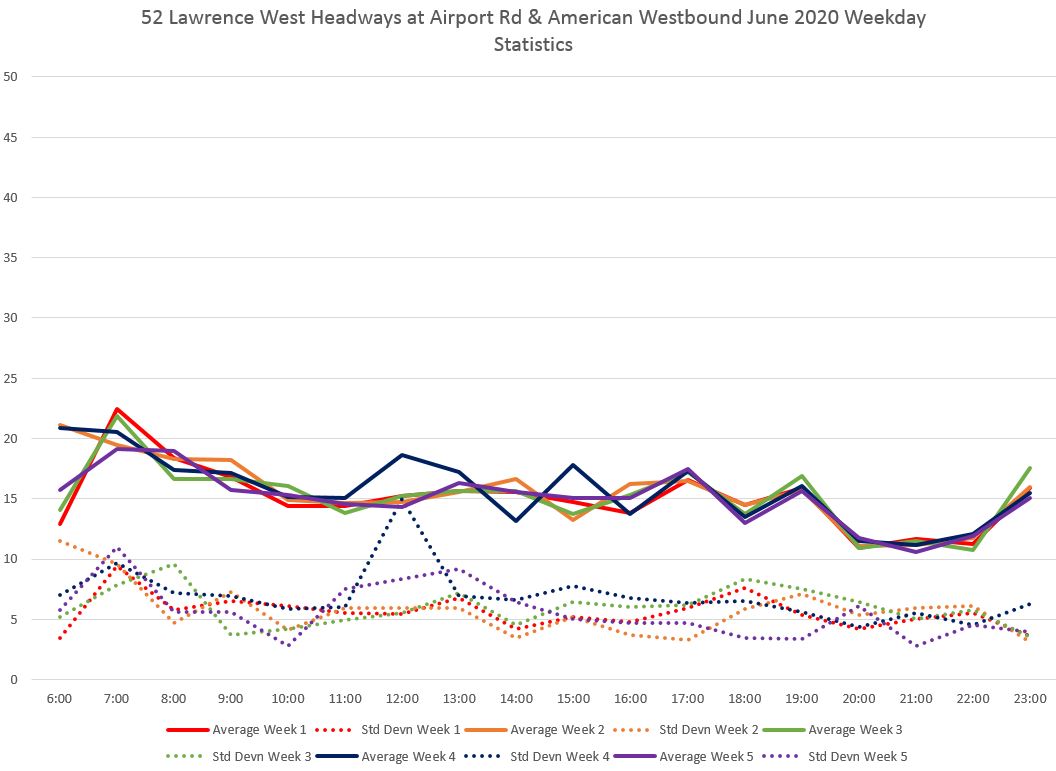
The actual headways during week 4 lie in a band extending to 30 minutes with some higher values.
I have not included weekend charts in these articles, but this one simplied demanded its presence. The Sunday service west of the airport is extremely unreliable.
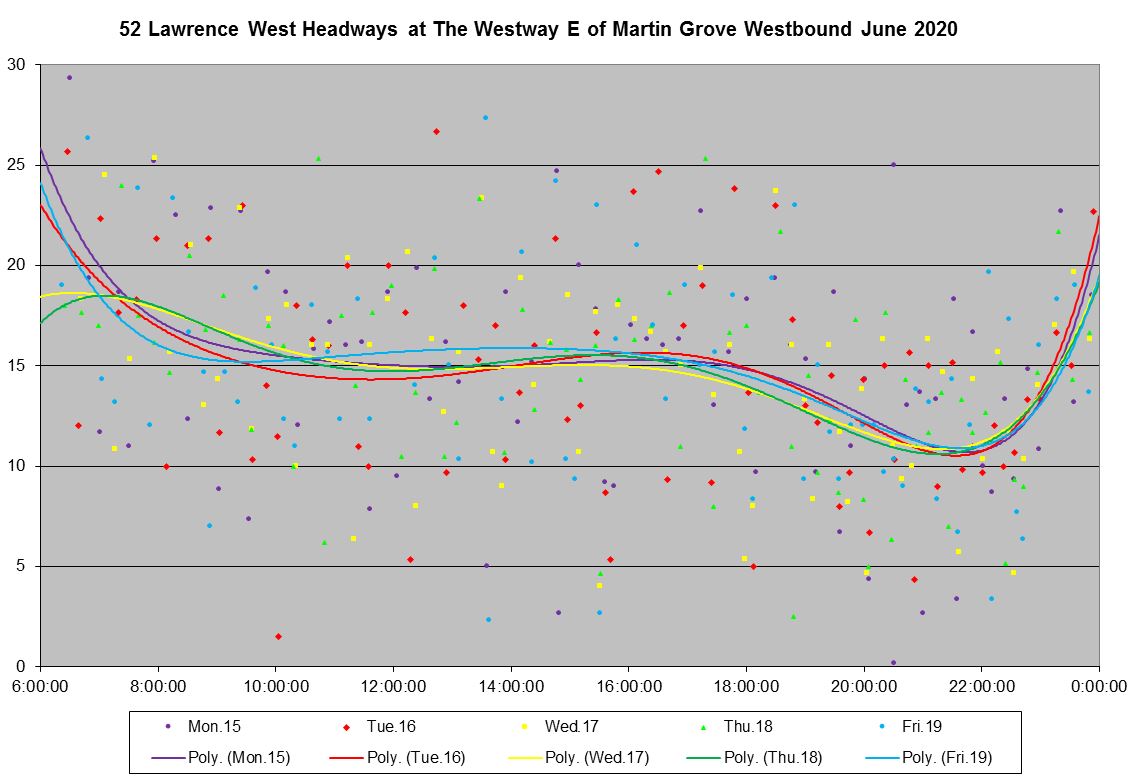
On The Westway, there is only one branch operating and one would hope for a regularly spaced service. However, the standard deviation value sits at five or more or much of the day showing that service is bunched even though the scheduled headways are wide.
The headways between tracked buses lie in a band almost 20 minutes wide.
I have not included charts for eastbound service in the interest of saving space and reading time. They are quite similar to their westbound counterparts.
The full chart sets for the locations cited here are linked below:

It looks like 60 Steeles West is the most reliable route profiled here, while 89 Weston is a real disaster. I wonder why Steeles runs so much better?
Are all of these routes controlled from the same transit control, or is it spread amongst bus divisions? Would there be any information in looking at performance for the different transit control operations?
Finally, and I don’t know if this is an artifact of random data, but the standard deviation of 45 Kipling SB at Dixon, and less so at Finch, has a big spike in the standard deviation at around 19:00, then actually drops to quite a low level (comparatively) at 20:00.
Steve: Transit control is centralized, but routes are parcelled out to individual supervisors. 89 Weston (and 41 Keele) have been disasters for a long time as I reported in previous articles, and the service cuts with the removal of express trips has made things even worse. My gut feeling is that various routes somehow “fall off the table” for good line management and never get back. This often seems to happen when construction projects really screw things up, and this becomes the “new normal”.
The situation on Kipling is that this is the transition to from peak to off-peak headways. This is an inevitable problem with displaying the data in one hour slices where a substantial change in the headway corresponds falls within the hour. More generally, there is always a challenge as the value of “N” goes down that big changes in data values have more effect on the SD and what might be a minor incident averaged on a weekly or monthly basis has proportionately more effect on an hourly basis, particularly if the headways are large and the buses per hour are few. At Finch, there is no change in headway, and so the SD doesn’t show a bump the same way as at Dixon Rd.
I debated trying to include analyses of all of the oddities in the charts, but that would have drowned the fundamental issue in a lot of detail. The big problem is that headway management is something the TTC does not do, and they don’t do it even moreso on routes with less frequent service where the results can be very wide gaps. This problem affected the streetcar system when short headways became longer thanks to larger vehicles (think Queen with ALRVs) and laissez-faire “management” was no longer up to the task of regulating service. It was a concern before the TTC planned to increase capacity rather than just go for a 1:1 replacement of capacity with less frequent Flexity service. It will be a big issue if there are system-wide cutbacks.
At one point I was trying to concoct a customer waiting time index, but didn’t pursue it in detail. The problem with gaps is that more people accumulate waiting for a bus that is in a gap, and they wait longer than the advertised level of service, with the result that most riders see long gaps followed by crowded buses. The TTC only reports things on an average, all-day basis, and this hides so much detail that the numbers are meaningless.
LikeLike
Though I am certainly not sure how to construct one and I agree that having the full (gory) details is best, I suggest that a ‘customer wait time index” might be like an “Executive Summary”. The full tables are complex and not very easy to understand whereas a table of the wait times (at a stop in mid-route?) for a passenger who arrives there at hourly intervals might get across the fact that the important thing is how long does he/she wait to see a bus. (Yes, if the bus is really late it may be full so you only see it as you can’t get on so these figures would be ‘best case’). If the timetable frequency is a bus every 8 minutes, the mythical passenger at a mid-route stop should never have to wait more than 8 minutes – I fear we all know what the actual result would be.
Steve: It’s a tad more complex than that, although I agree that a summary version is needed. Take the case where a would-be passenger arrives every minute expecting a bus every 10 minutes. If they are evenly spaced, then the average waiting time will be 5 minutes just as one would expect for a 10 minute service.
However, if the actual spacing is 19-1-19-1-19-1, many riders will wait longer than 10 minutes, and very few will benefit from the second bus 1 minute behind its leader. The average wait time goes up to about 9 minutes. But this does not fully capture the actual passenger experience which happens individually, not on average. If you were to tell the typical member of the TTC board that despite the erratic service, the average wait time was only 9 minutes, they would say, that’s not too bad. However half of the riders would have a wait longer than 10 minutes, and a quarter of them would wait longer than 15. It is the outliers that establish how people experience the service, especially if there is a good chance you will fall into that category often. For example, if the odds are one in four that you will hit a gap, then it is almost certain that you will have this several times per week, especially if you use more than one route, in the course of a regular ten-trip commute. Those gaps are what people remember particularly if they are followed by a crowded bus and the weather is vile.
Considering what crowding could be like in “before times” on some routes, the question then is “what are the odds I won’t be able to board the first bus”.
A well-known and useless metric often reported by the TTC is on time performance at terminals where the target is to depart no more than 1 minute early and no more than 5 minutes late. There are standards for headway adherence too, but these are never reported, and I suspect that they are never measured.
The headway standards are:
Yes, you read that correctly, the accepted range allows vehicles running almost in pairs. Service with headways skewed like this would quickly become pairs as followers on a short headway caught up with their leaders.
And as if that isn’t ridiculous enough, the “target” for adhering to these meaningless metrics is that 60% of service meets the “standard” on an all day basis. In other words, it is perfectly acceptable that 40% does not meet the standard, and there is no specification of how those non-standard trips might be distributed in time over the day.
This nonsense was approved by the TTC Board with no real understanding of the implications, and an assumption that because their professional staff had produced this bilge, it must be a worthwhile standard. I should mention that Andy Byford was still CEO when this was approved in May 2017, and so he bears responsibility for it although the current CEO, Rick Leary, probably had a large influence because Byford hired Leary to make the buses run on time.
Yes, there is the making of a separate article here, but I wanted to get all of the performance info about what is happening right now even with lighter-than-normal traffic before turning to how meaningless the standards actually are.
LikeLike
It’s unfortunate that TTC needed a global pandemic in order to run the 60 [Steeles West] at predictable steady headways.
Before this started it was not uncommon to have large gaps in service on that route. I’ve seen gaps of 15 minutes at rush hours more than once. I ordinarily take the 125 [Drewry] from Finch Station, but have on occasion come up to the bus platform having just missed it. I would then go to the 60 platform thinking that with the 3-5 minute headway on that route I could get home faster than waiting for the next 125. What would happen then would be such a long wait for the 60 that I would simply walk back to the 125 platform to catch the next 125 instead which was running a relatively reliable 15 minute headways at the time.
Steve: For readers’ reference, an analysis of 60 Steeles West in April 2018:
LikeLike
Do you also do an analysis based on the TTC’s own criterion of “on time” service? Granted that it’s a pretty meaningles standard, are their “on time” numbers even close to accurate?
I guess you could just check at the first waypont out of the terminal, whether the bus is within 6 minutes of the schedule. Do a count and see what percent are on time. It would be interesting to see if the TTC’s data even is collected and analyzed correctly.
It would also be kind of interesting to see if buses that left “late” by the metric also took an extra-long layover, and how that layover corresponds to the published terminal+ recovery time.
As for the buses who leave “early” (i.e. soakers), do they take a shorter layover just to not deal with passengers? I can see reasons for leaving late (getting in late, needing the washroom, etc.) but a lot fewer reasons for an early departure.
Steve: I don’t attempt this sort of analysis because it is hard to correlate each trip in the tracking data with a scheduled departure especially on routes with short headways. What does show up, although it takes some digging to track them, is trips that run close together (ie a pair of buses) at the same time every day. Those are perennial soakers. I can even tell what their off-days are because a problem might only exist on three of five weekdays, but consistently from week to week. Mixed in with this are operators who drive very conservatively, usually quite junior staff, and are always overtaken along the route.
The basic problem is that the TTC’s metrics give a patina of respectability to erratic service. “We are meeting our Board-approved standards” is a phrase that dismisses all criticism, and there lies the danger in having the Bard approve a standard they do not understand and which was not explained to them when it was presented, at least from the point of view of its actual meaning relative to real-world service. Board members are loathe to challenge staff on technical matters like this.
LikeLike