
Recently, I published an article about the evolution of travel times and service quality on the Eglinton-Kingston-Morningside corridor since the installation of the transit priority “red lanes”, a project which has been branded RapidTO by the City. See: Red Lanes, Express Buses and Service Reliability in Scarborough
For clarity, although I have done work for City Planning as part of the King Street Priority project, I was not involved in the City/TTC Scarborough project. Analysis presented in my previous articles is my own work separate from the official reports.
One of the challenges of presenting this material is that there is a lot of data between transit vehicle tracking, ride counting and general traffic monitoring. In my articles, I only deal with the transit tracking component and even that is a lot. The City and TTC have boiled down the data further to present the major issues.
The City’s project page contains an overview and links to various resources including the TTC’s RapidTO page. The heart of reporting on the project is in the Project Dashboard which summarizes data showing effects on transit and general road user travel times as well as service reliability.
The High Points
The RapidTO lanes in Scarborough were the low-hanging fruit of potential transit priority projects. Much of their length already had peak period diamond lanes. The streets were not dependent on parking to serve commercial properties along the route, and they were mostly wide enough to leave two traffic lanes in each direction even after dedication of the curb lanes for transit.
Travel time changes were modest, and the savings cannot all be ascribed to the red lanes because other changes were made concurrently or after implementation, notably the elimination or relocation of stops.
Traffic and ridership volumes have not yet returned to pre-pandemic conditions and so we are not yet seeing either the roads or transit service stressed to previously-normal levels. Whether the red lanes will limit transit times from rising back to or above 2019 levels will probably not be known until sometime in 2022.
Service reliability continues to be the bugbear of TTC operations, and we are finally seeing figures to support this in a report from the TTC. When only half of service can achieve a rather generous target range of headways (time between buses), the service is not very reliable.
Update: Of particular note is the high reliability factor shown for the express routes, particularly 905 Eglinton East. The metric is defined as ±50 percent of scheduled headway, and the express routes have much larger headways than the 86 and 116 local Scarborough and Morningside services. Therefore, service on the 905 can be much more erratic because there is a wider acceptable window of values using the 50 percent rule. This is not necessarily better service, only a side-effect of a poorly-chosen metric.
The City and TTC present this metric as an “improvement” relative to October 2019, but the change is only a slight improvement on appallingly bad service. If this were a report card, it would generously have changed from an “F” grade to “E”.
External, physical changes to the route environment such as reserved lanes and stop consolidation will not, by themselves, produce reliable service, and the TTC has yet to address headway reliability management as a core function.
Travel Times
The City/TTC Dashboard uses October 2019 data as its pre-implementation baseline. Travel times have dropped modestly during peak periods with the greatest benefit going to the 86/986 Scarborough route. This is unsurprising given that 86 Scarborough spends more time on the busiest portion of the Red Lanes (Eglinton and Kingston Road) compared to 116 Morningside.
The data presented on the dashboard jump directly from October 2019 as a “pre-pandemic” reference to October 2020 when the lanes were installed.
To see the effect of the drop in traffic and travel times with the onset of Covid earlier in 2020 (if any), please refer to my article linked above where the May 2020 data are shown. This separates the pandemic effect on traffic from the implementation of the red lanes.
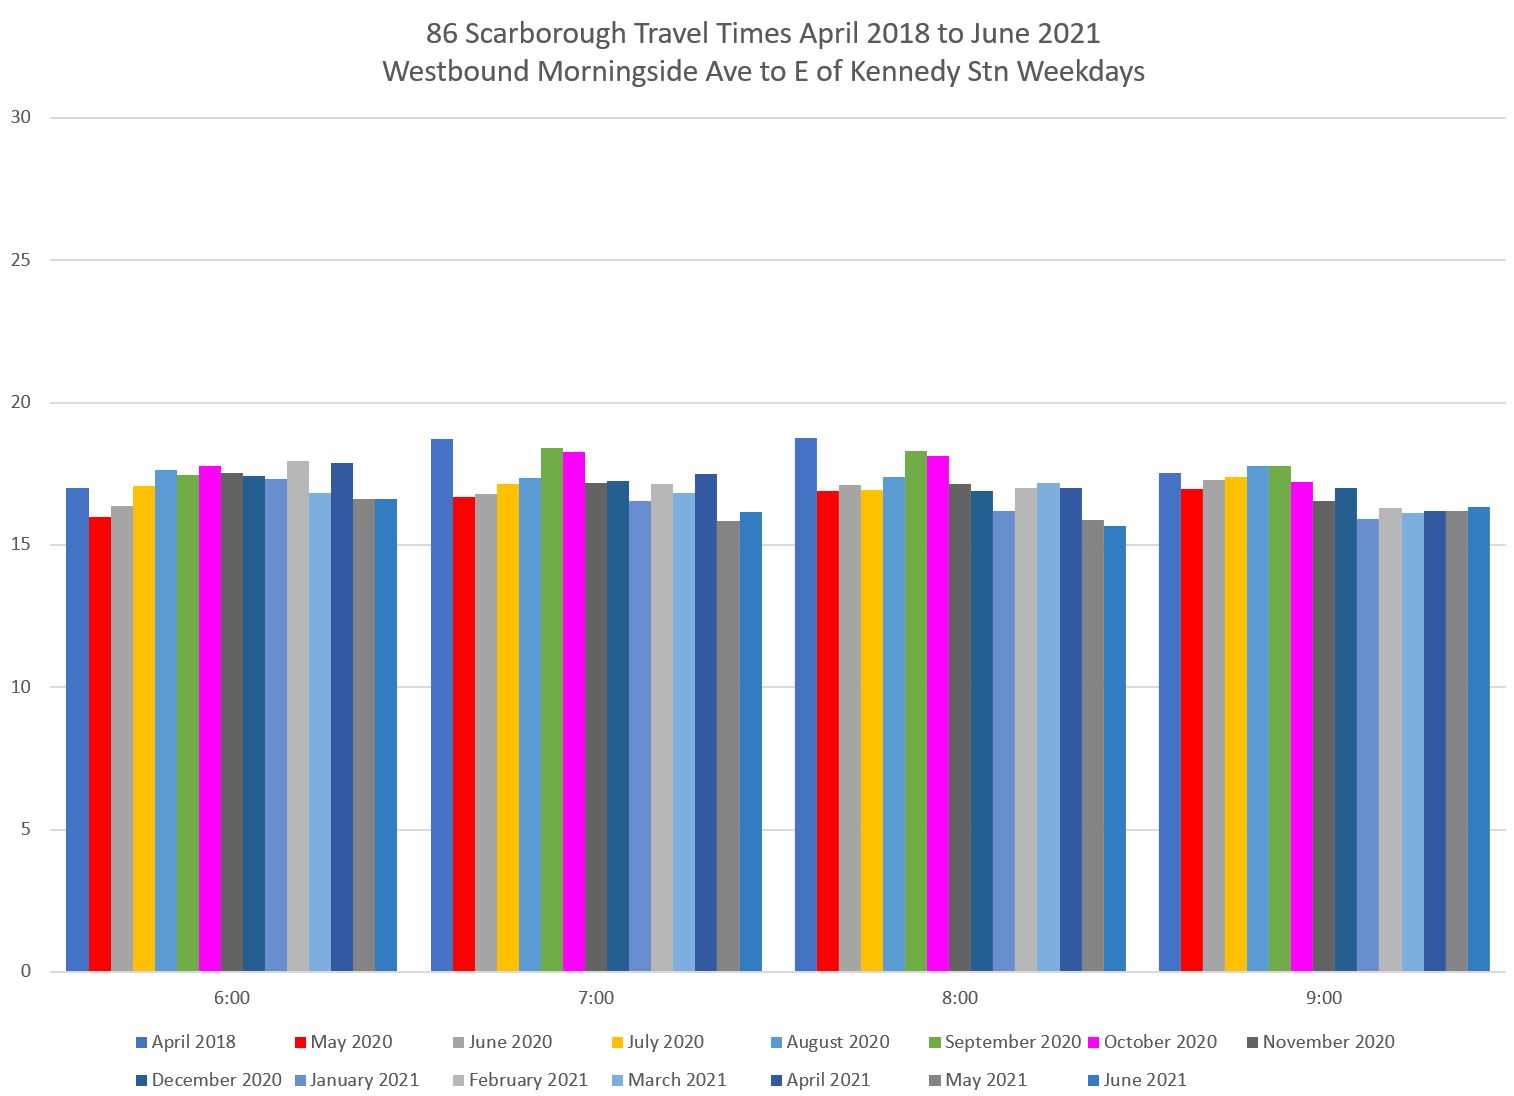
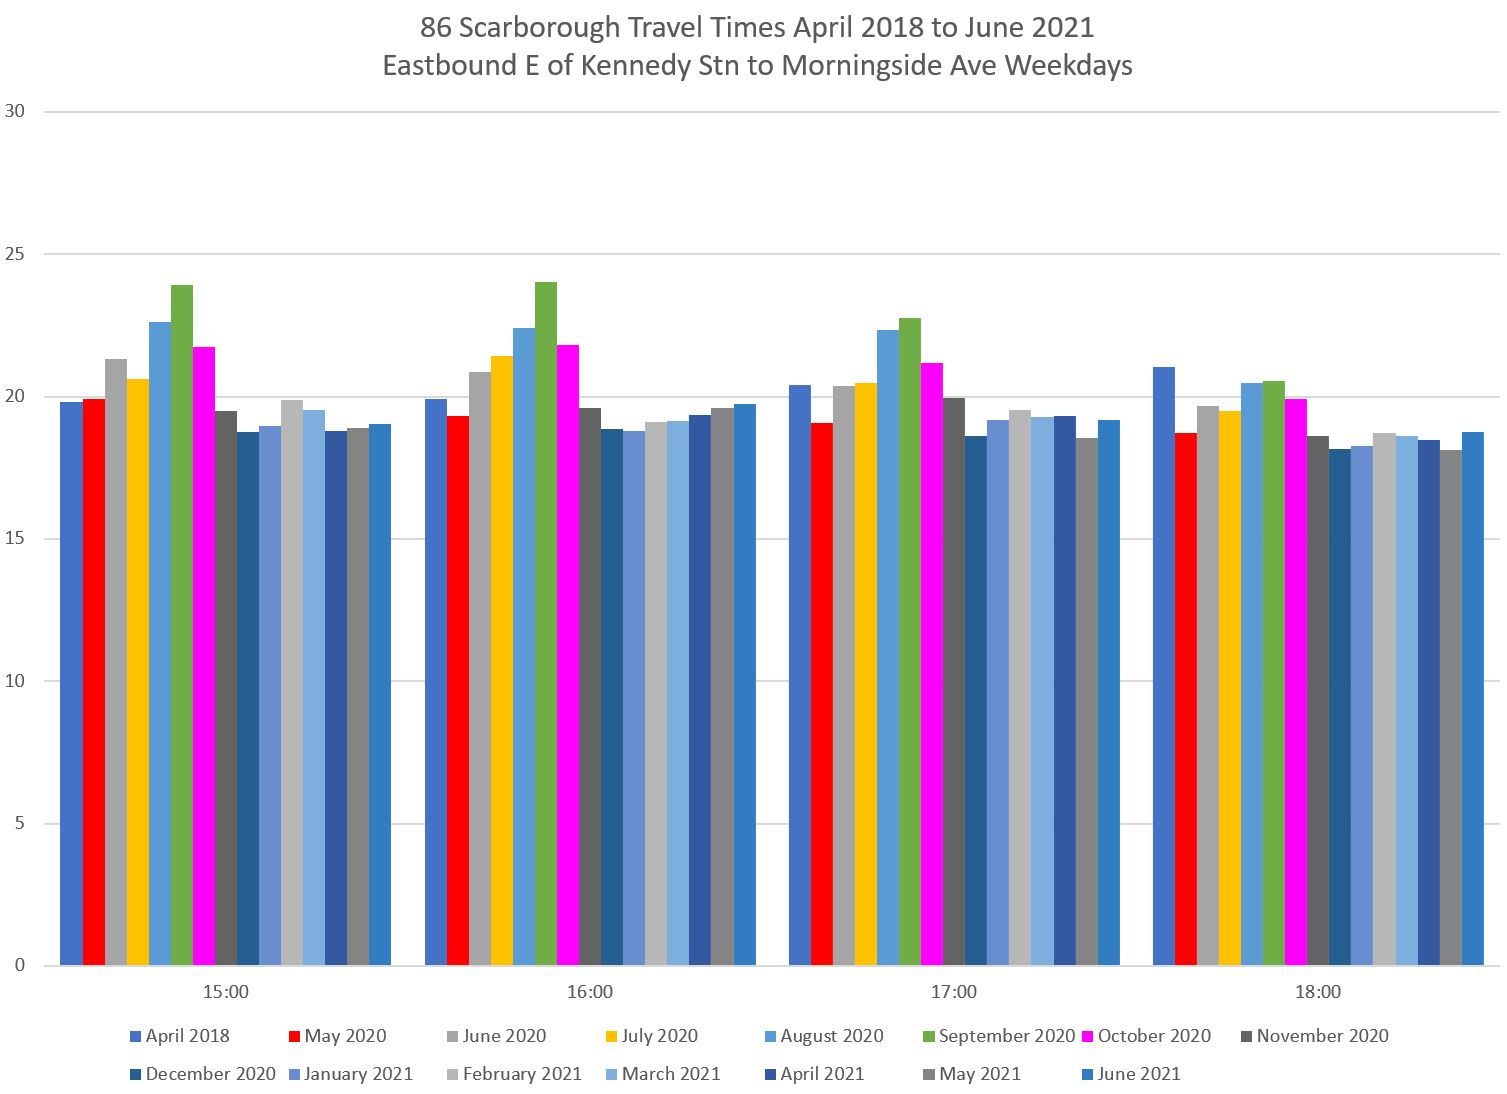
The charts below are a subset of those presented in that article, but they focus on the peak period, peak direction data.
The red bar is March 2020, the point where the city shut down cut transit demand and road traffic sharply. Note that the effect here was modest.
The pink bar is for October 2020, the month the read lanes were implemented. The change is small in the AM peak but larger in the PM. This is in line with the City’s dashboard summary.
The dashboard report breaks down the change in travel times over the three segments of the Scarborough red lanes in the peak direction and hours.
Car travel times did not rise on either the RapidTO corridor or parallel streets. This is due in part to the lower overall volume of traffic which, on this corridor at least, does not appear to have returned to pre-pandemic levels. This is not the case on other proposed RapidTO corridors such as Jane where mid 2021 travel times are back to 2019 levels. Moreover, much of the Scarborough corridor already had peak period transit lanes, no parking and six lanes overall so that taking a transit lane was not as much of a “bite” out of the road as on narrower streets such as Dufferin and Jane.
(For details of car travel times and traffic volumes, please see the Dashboard report.)
Service Reliability
The TTC cites a 12 per cent increase overall in service reliability on the four routes in the corridor, with a 19 per cent jump for 116 Morningside. Some changes were made in conjunction with the red lanes, but their benefits did not depend on the lanes. This included removal of some stops and relocation of others, as well as schedule changes to better match with actual travel times.
For the purpose of this dashboard, the TTC has adopted a new “reliability” metric of service being within 50% of the scheduled headway (interval between buses). For example, a route might be scheduled (and advertised) as showing up every 10 minutes, but it is considered “reliable” if it the gap between buses is no more than 15 or no less than 5 minutes. This is a more generous definition than previously used in the Service Standards which uses a 6 minute window, but that is measured relative to scheduled times at terminals rather than headways between buses midway along a route.
There is no way to sugar coat these numbers. Although the City and TTC present this as an improvement compared to October 2019, reliability has fallen since January 2021. The values here are far below any target worth being proud of, and show how transit priority does not, by itself, guarantee reliable service.
This echoes the data in my own articles showing that there is a wide variation in headways on routes in the Scarborough corridor and every other part of the system.
If only half of the 86 Scarborough service arrives within ±50 per cent of the scheduled headway (every 5 minutes for the location and time shown here), this means that the other half was either on a headway below 2’30” or above 7’30”. This irregularity contributes to onboard crowding as riders will always board the first bus that shows up for fear that the next one will never arrive, or will not be headed to their destination.
Updated: The scheduled headway in May 2021 for these four services is:
- 86 Scarborough: 5’00” combined service on three branches
- 116 Morningside: 7’00”
- 905 Eglinton East Express: 8’00”
- 986 Scarborough Express: 9’45”
Using the 50 per cent rule, this means that the range of acceptable headways on the express routes is much larger than on the locals, and they can rank as “reliable” more often even if service in absolute terms is less reliable from a rider’s point of view. This is a poorly chosen metric that allows infrequent service to be wildly unreliable but within the TTC’s target.
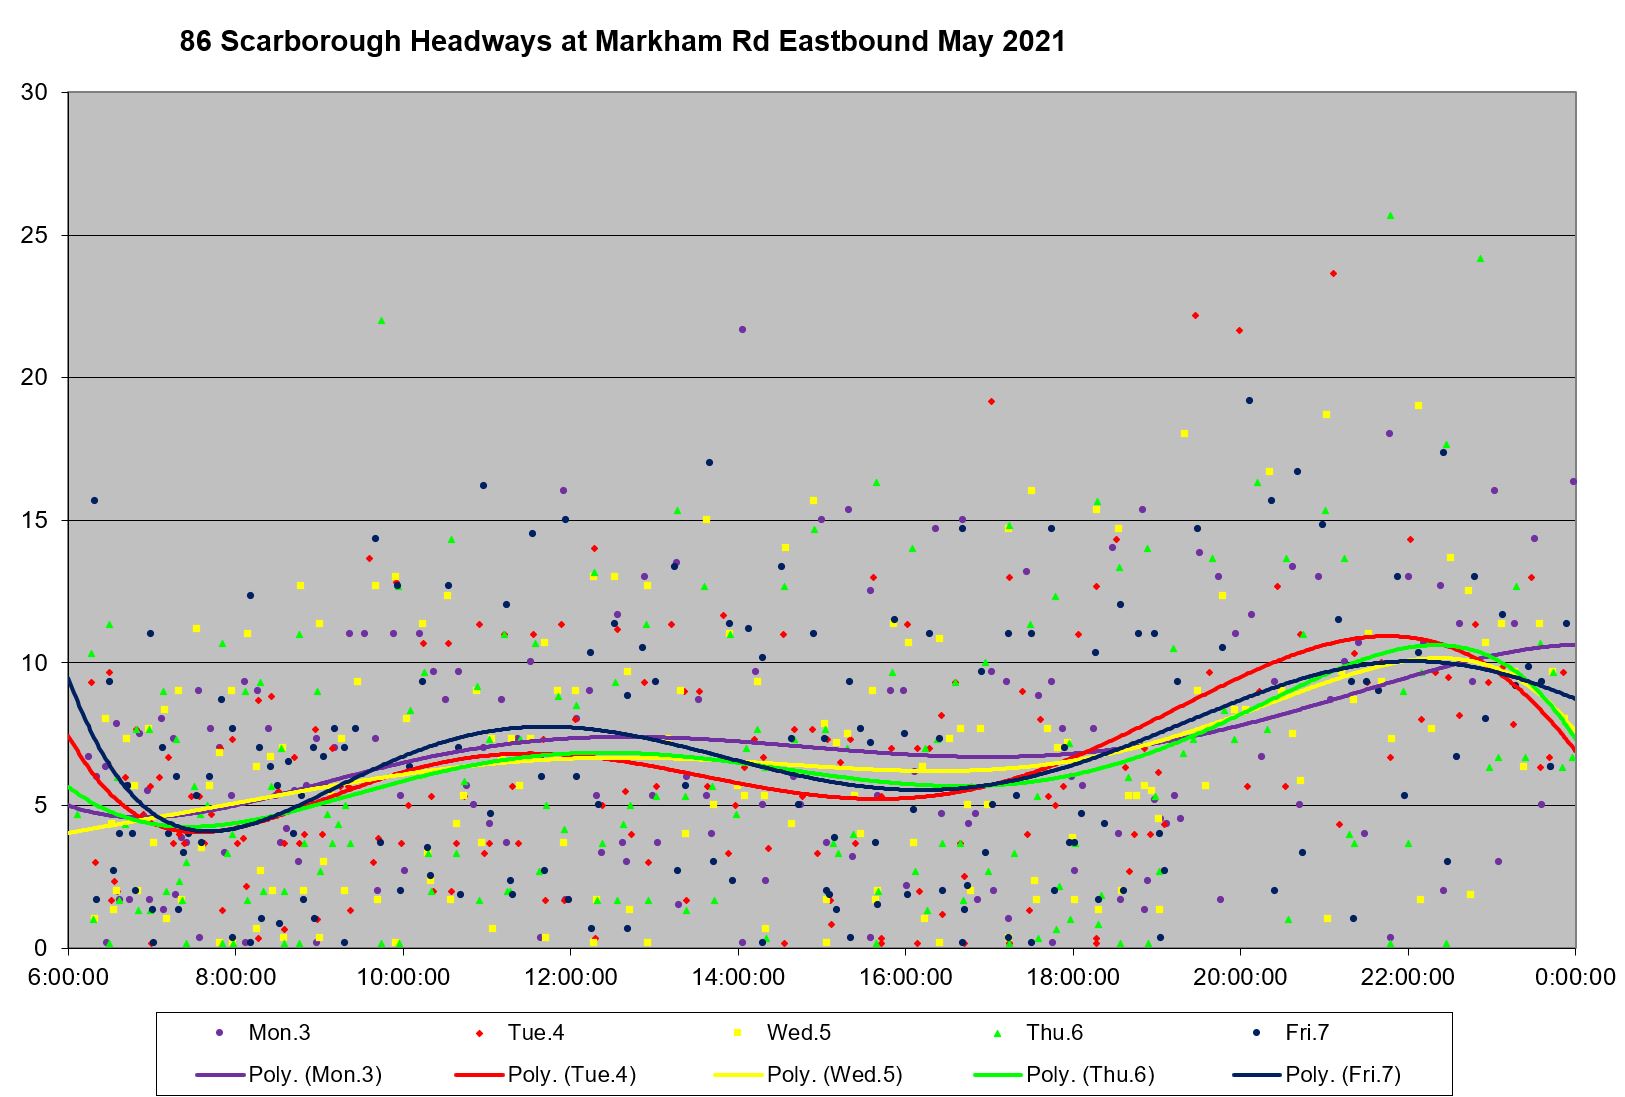
Here are the details of headway distributions eastbound at Markham Road in the first week of May 2021. These values are typical. Many buses operate at very short headways (bunched service) and a correspondingly large number run at headways over 10 minutes even when the scheduled service is every 5 minutes.
Ridership
Ridership fell on routes across the system, and as of May 2021 had still not returned even to fall 2020 levels on this corridor.

I’m sure there will be some auto-addicted disciple out there who will exclaim, “Won’t someone think of the single-occupant inside their 2-ton automobile”.
LikeLike
It is interesting that the two express routes 905, 985 are significantly more reliable than the regular bus service of the 86 and 116. Also that 116 service is consistently better than the 86.
I imagine that traffic conditions and volume of passengers can explain part of the difference among reliability of routes.
As a passenger, the most visible factors like operators tagging each other or lack of discipline to space departures from the subway terminal will affect reliability. These can be proven on Steve’s service charts.
If the reliability charts were grouped by route supervisor, all the routes of an under-performing route supervisor would have poor reliability and those same routes under another route supervisor could have consistently better reliability.
There are staff performance variables that are not measured that could improve these reliability charts and the TTC Board should promote them.
Steve: I take those reliability figures for the express buses with a grain of salt. Remember that because they have larger scheduled headways, a ±50 percent window is wider for the expresses than for the locals, and therefore they can give worse service but get a better rating. This is another of the TTC’s misguided service metrics that hides as much as it shows. You may recall that a scheme I proposed recently did not simply use a percentage of the scheduled headway. I have never heard back from the TTC on this proposal.
I have updated the article to include this point including currently scheduled headways on the four routes.
I am actually pondering a way to generate the charts (the ones that look like stalactites and stalagmites in caves) automatically using the GTFS versions of schedules as source data for the target values. Later this year sometime after I get through my review of red line routes and comparisons of local and express operations and streetcar lack-of-service quality and mythical short turns and …
LikeLike
Personal anecdotal observation, many express buses run with very few passengers.
LikeLike
Well, what do you expect when the TTC insists on running 100% of the service even though the ridership is down 80%? The rampant wasteful spending of the TTC has to be brought under control.
Steve: Well “Karl”, the TTC stats for the week ended July 23, 2021 show that the bus network is running at 47% of its pre-covid ridership overall, and this percentage has been growing. A month earlier, On June 29, it was 42%. On April 30 it was 37%. If you’re going to quote stats, you can at least use up to date info.
Do you use buses in Scarborough? Do you benefit from the frequent service and the relative lack of crowding this provides? Or do you just carp at “wasteful spending”?
LikeLike
Yes.
I suffer from the noise and air pollution caused by running empty buses.
The TTC is in a big financial hole. The TTC is known for running empty buses, streetcars, and trains. Service has to be cut where there is no demand or not enough demand. I take the Sheppard subway late nights and trains are almost completely empty. What a waste. The trains on Sheppard should be run every 20 minutes during peak times, every 60 minutes late nights, and every 40 minutes at other times because the demand is simply so low. It is not a question about whether I benefit or not from running frequent empty trains. I don’t think like you. It is not all about me all the time, other people exist too, you know?
Steve: You ran into a brick wall with your assumption that it’s “about me all the time”. “Other people” depend on services you would cut. As for the Sheppard subway, about the worst service it would be possible to run is one train every 20 minutes given that the line is so short.
I suggest that you make a list of services in Scarborough that should be cut, and hand out leaflets to riders asking for their support. You could even start a blog! Then you wouldn’t have to read mine!
LikeLike
Karl: The TTC is in a big financial hole.
What the TTC needs is a line by line review of its budget to weed out wasteful spending. For instance: the TTC hires a lot of bogus “consultants” who charge an arm and a leg to produce reports that nobody reads.
Steve: Examples, please.
LikeLike