
This article continues a series reviewing the behaviour of service on routes that are either part of the RapidTO bus lane network or have been proposed for inclusion in future stages of its rollout.
See also:
The 35 Jane and 935 Jane Express buses operate between Jane and Pioneer Village Stations and follow identical routes except for a peak-only 35B Jane branch that operates via Hullmar between York Gate and Steeles.
This article deals with:
- The change in travel times for the local 35 Jane service between Eglinton and Steeles (the portion of the route proposed for Rapid TO) from pre-pandemic traffic conditions and their evolution through the low point of demand and congestion in 2020 through to June 2021.
- The difference between local and express services.
- The reliability of service.
- The effect of construction of the 6 Finch West LRT.
The High Points
Although much of Toronto’s traffic congestion and transit riding have not returned to pre-pandemic levels, the travel times on the Jane bus are now as high as or greater than values in November 2019, particularly in the PM peak. Southbound travel times were historically longer than northbound, and this pattern continues today.
Construction at Finch produced substantial congestion on the approaches in both directions during the latter weeks of June 2021. However, this was not the only location where traffic congestion, as measured by slower travel speeds, rose later in June.
Headways (the time between buses) are less reliable in the afternoons and evenings on both the local and express services, and this worsened in late June with the combined effect of construction delays and schedule changes. Waits for express buses can be so long that they outweigh the benefit of an “express” trip.
Service can be irregular even on weekends when conditions that disrupt weekday operations are either absent or at a much lower level. This shows a need to better manage service so that disruptions, when they occur, are clearly the product of external conditions, not of laissez-faire operations.
Evolution of Travel Times on 35 Jane
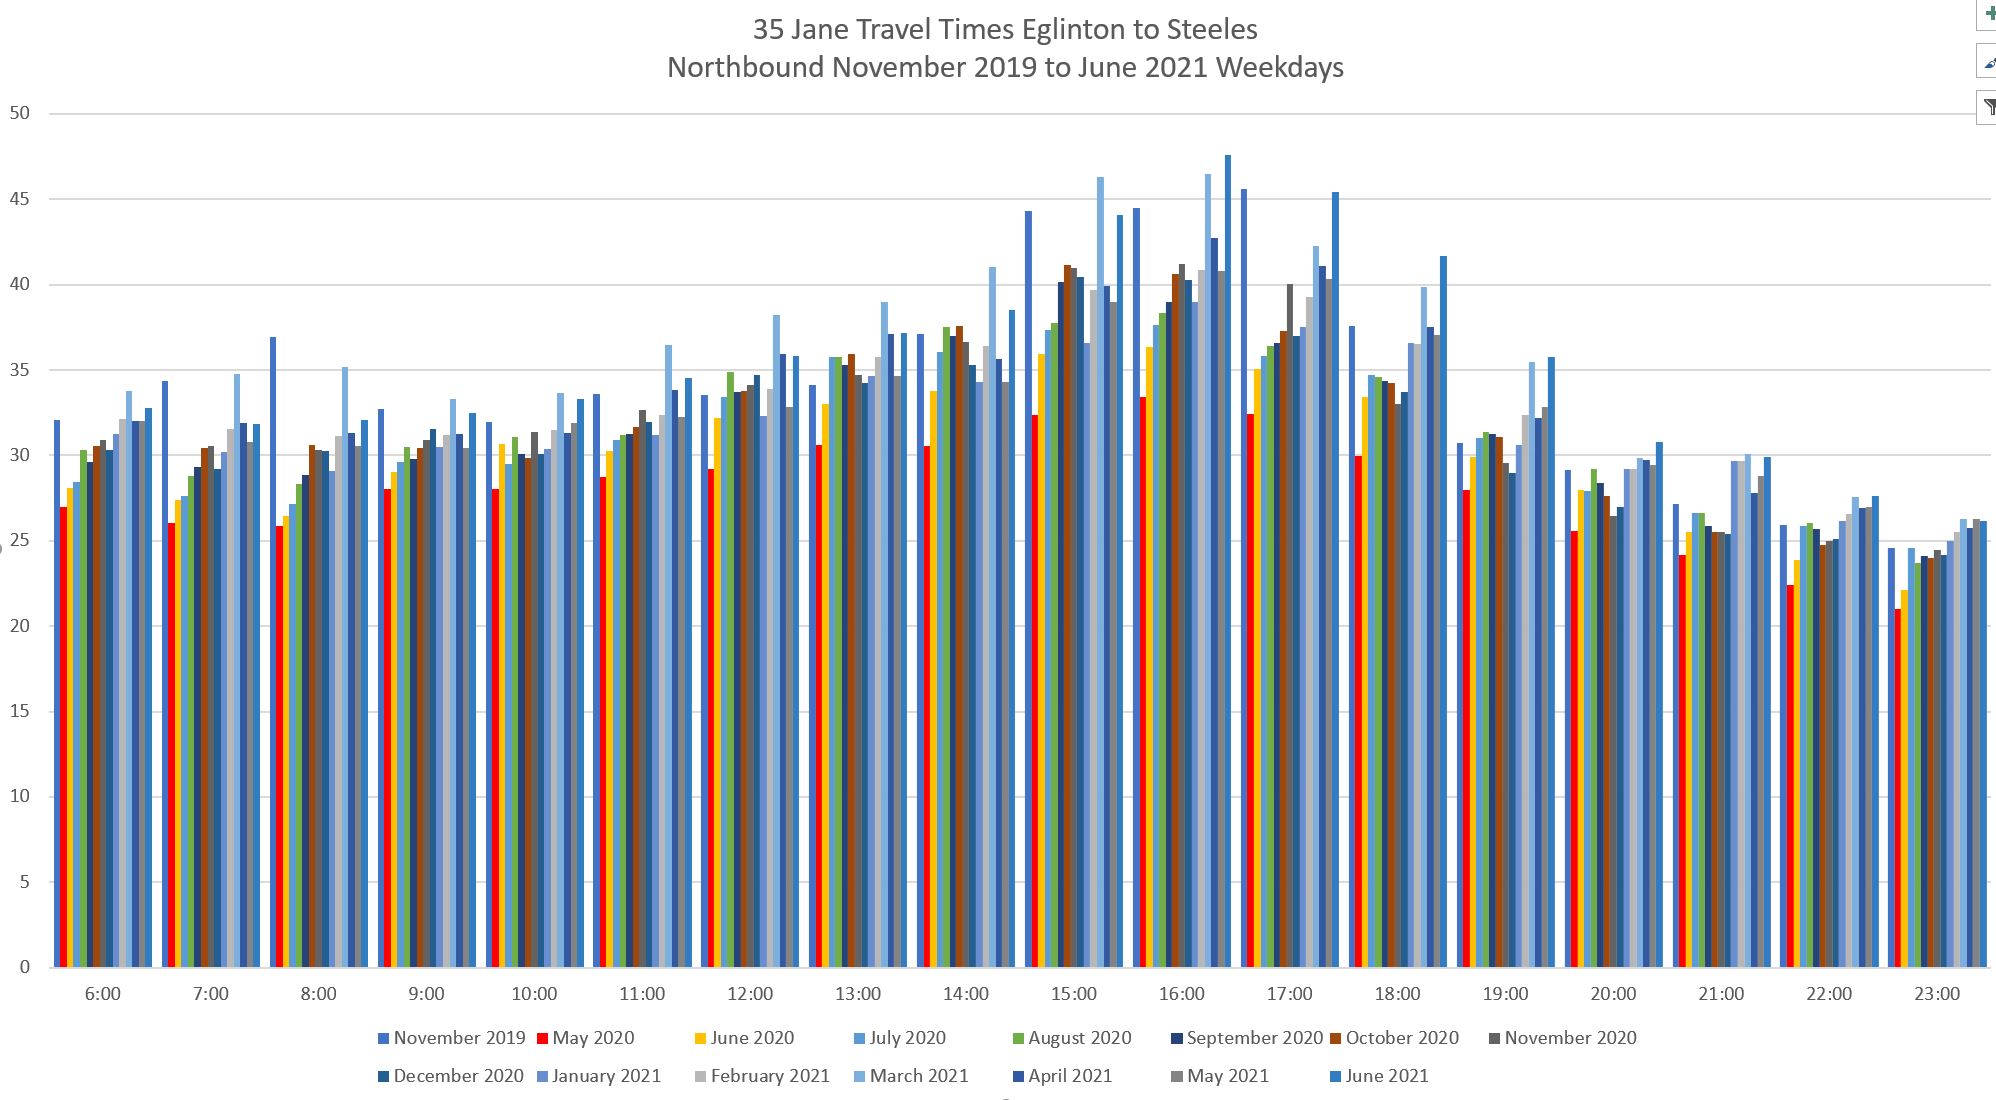
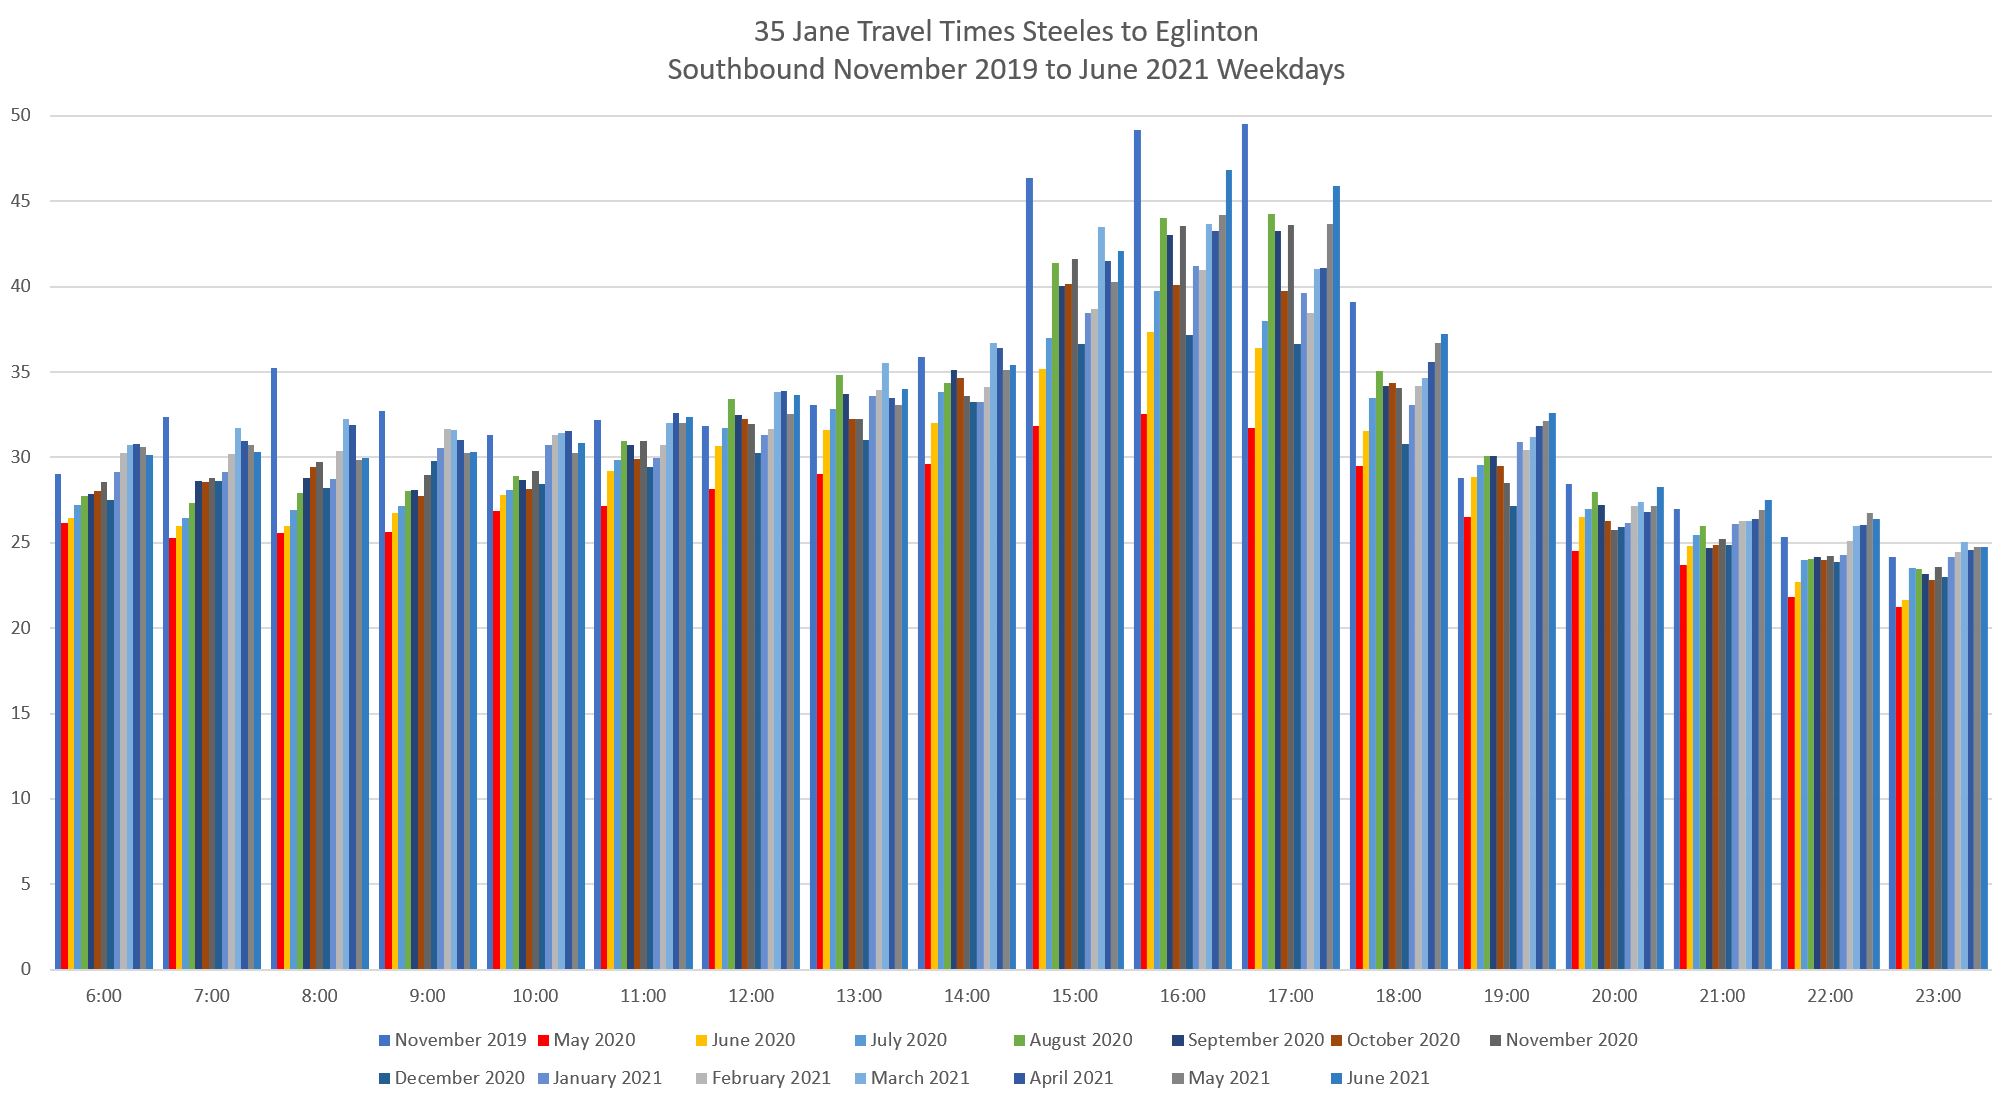
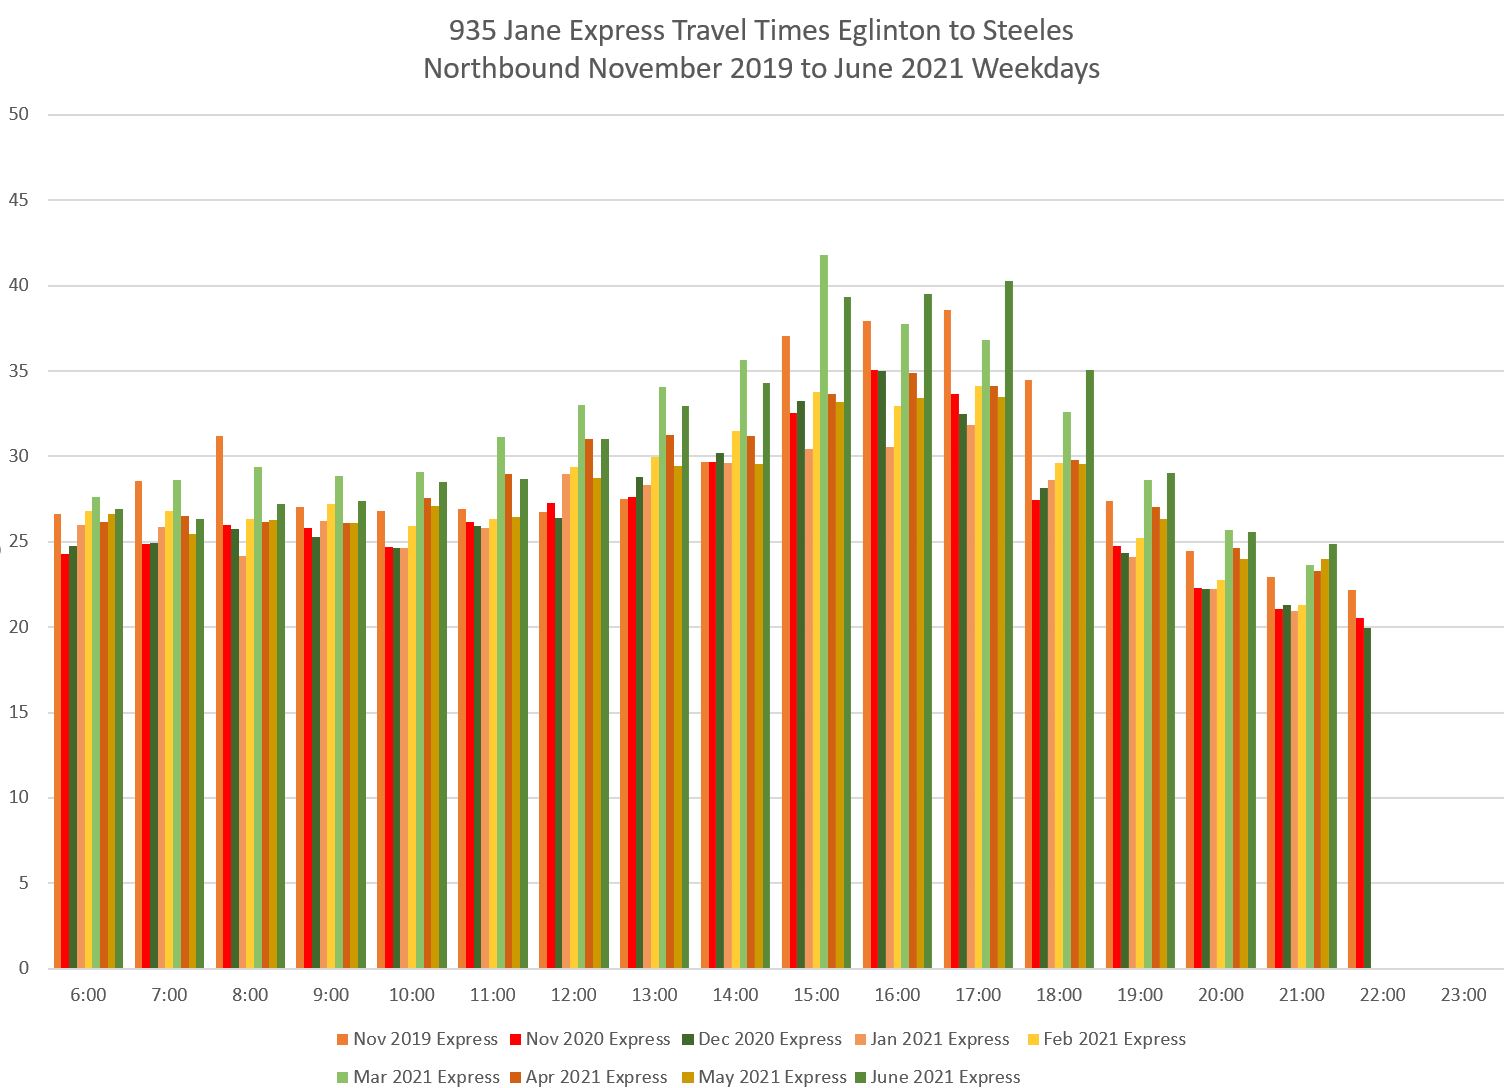
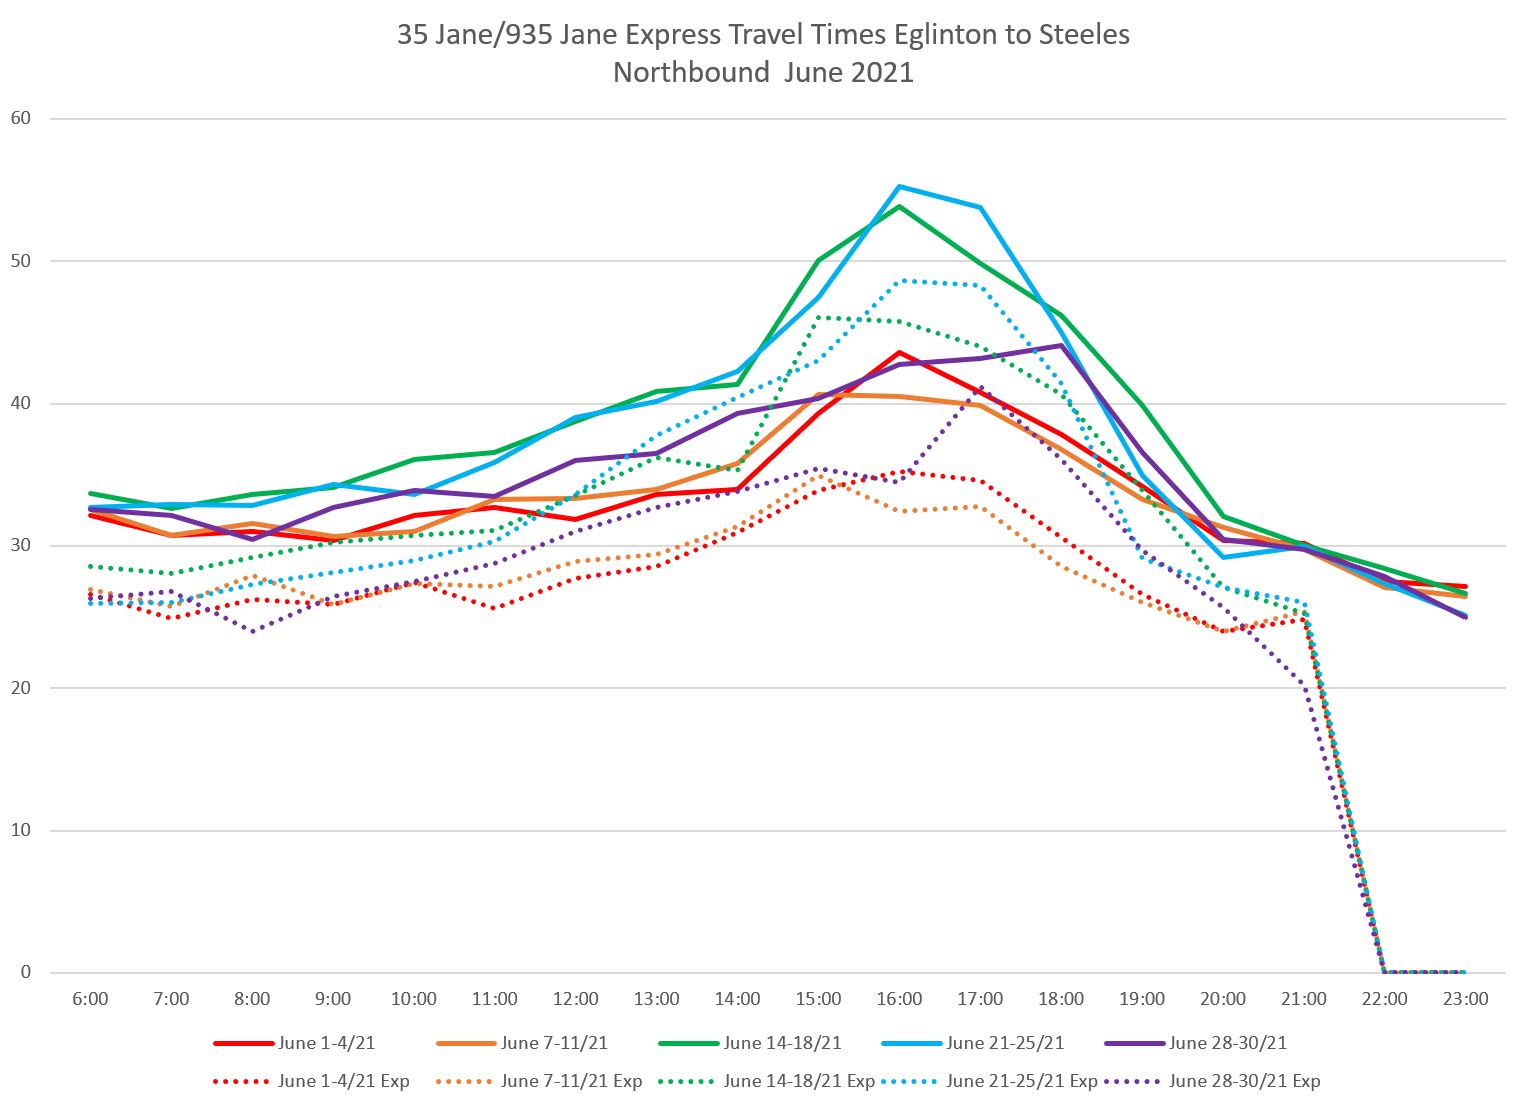
The charts below show the monthly averages of travel times by time of day for weekday service on Jane between Eglinton and Steeles. (Click on images for a larger version.)
For each group of data, the leftmost bar gives the November 2019 value for local service (express trips are not included in these charts). The second bar in red is for May 2020 at the low point in pandemic-era travel demand and road traffic showing the degree by which travel times changed. The remaining bars track the gradual rise in travel times to June 2021 when buses generally take longer at all times of the day than they did in late 2019.
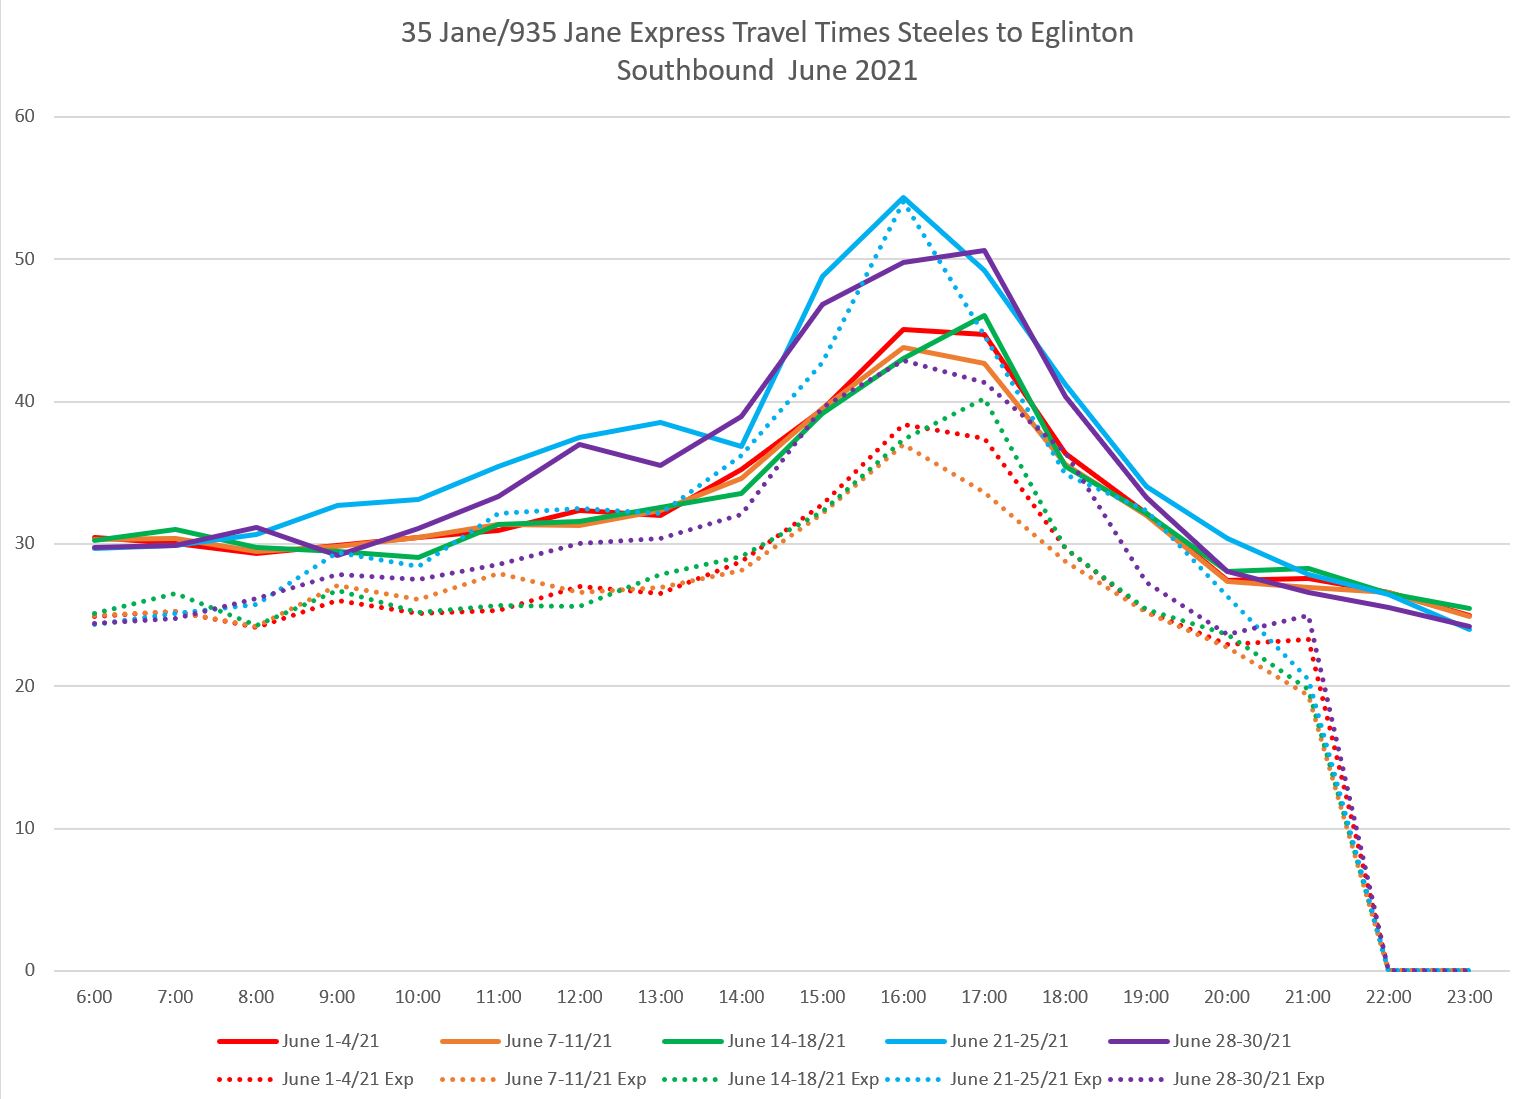
Part but not all of this effect is in recent months, and is most notable in the traditional PM peak period. The effect is also stronger in the southbound than the northbound direction. The fall 2019 travel times southbound were even higher than they are in 2021 during the PM peak.
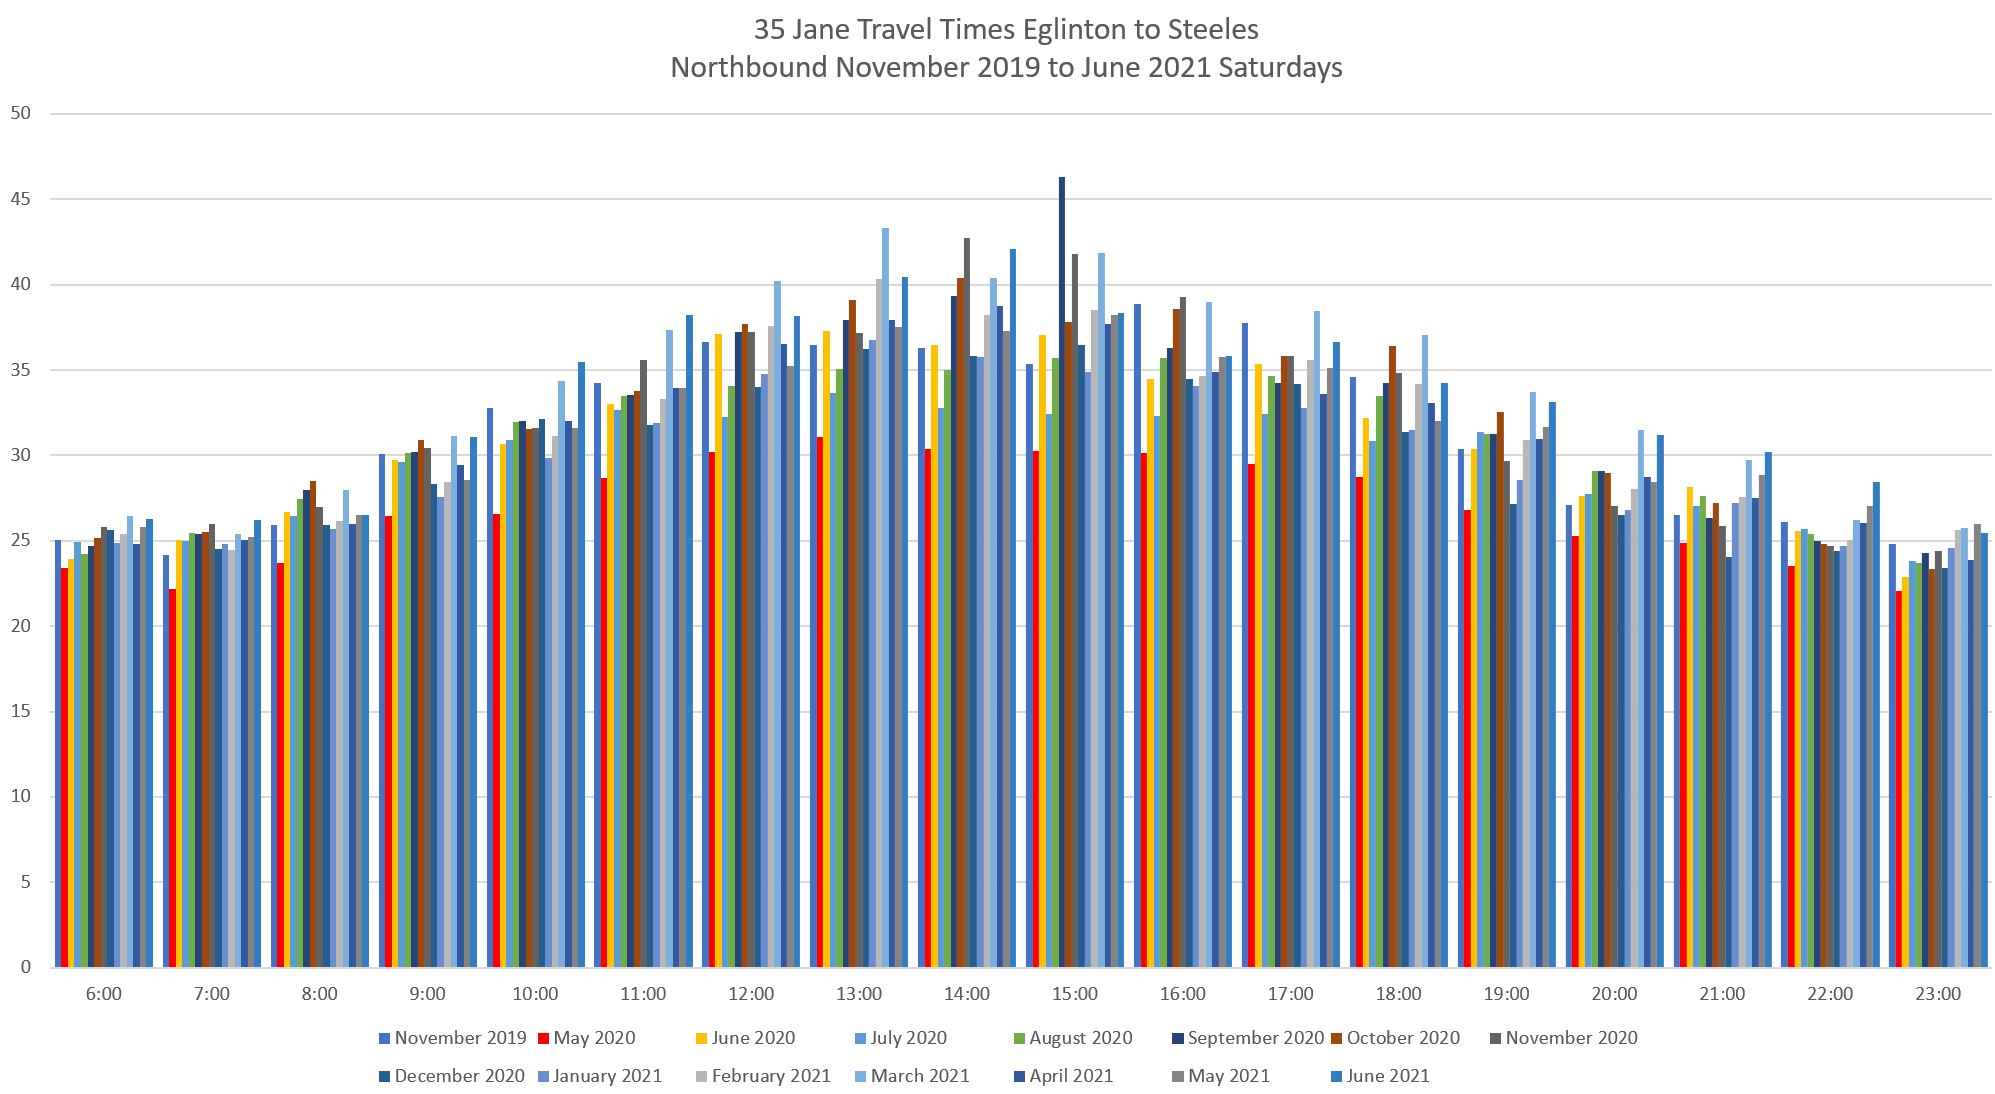
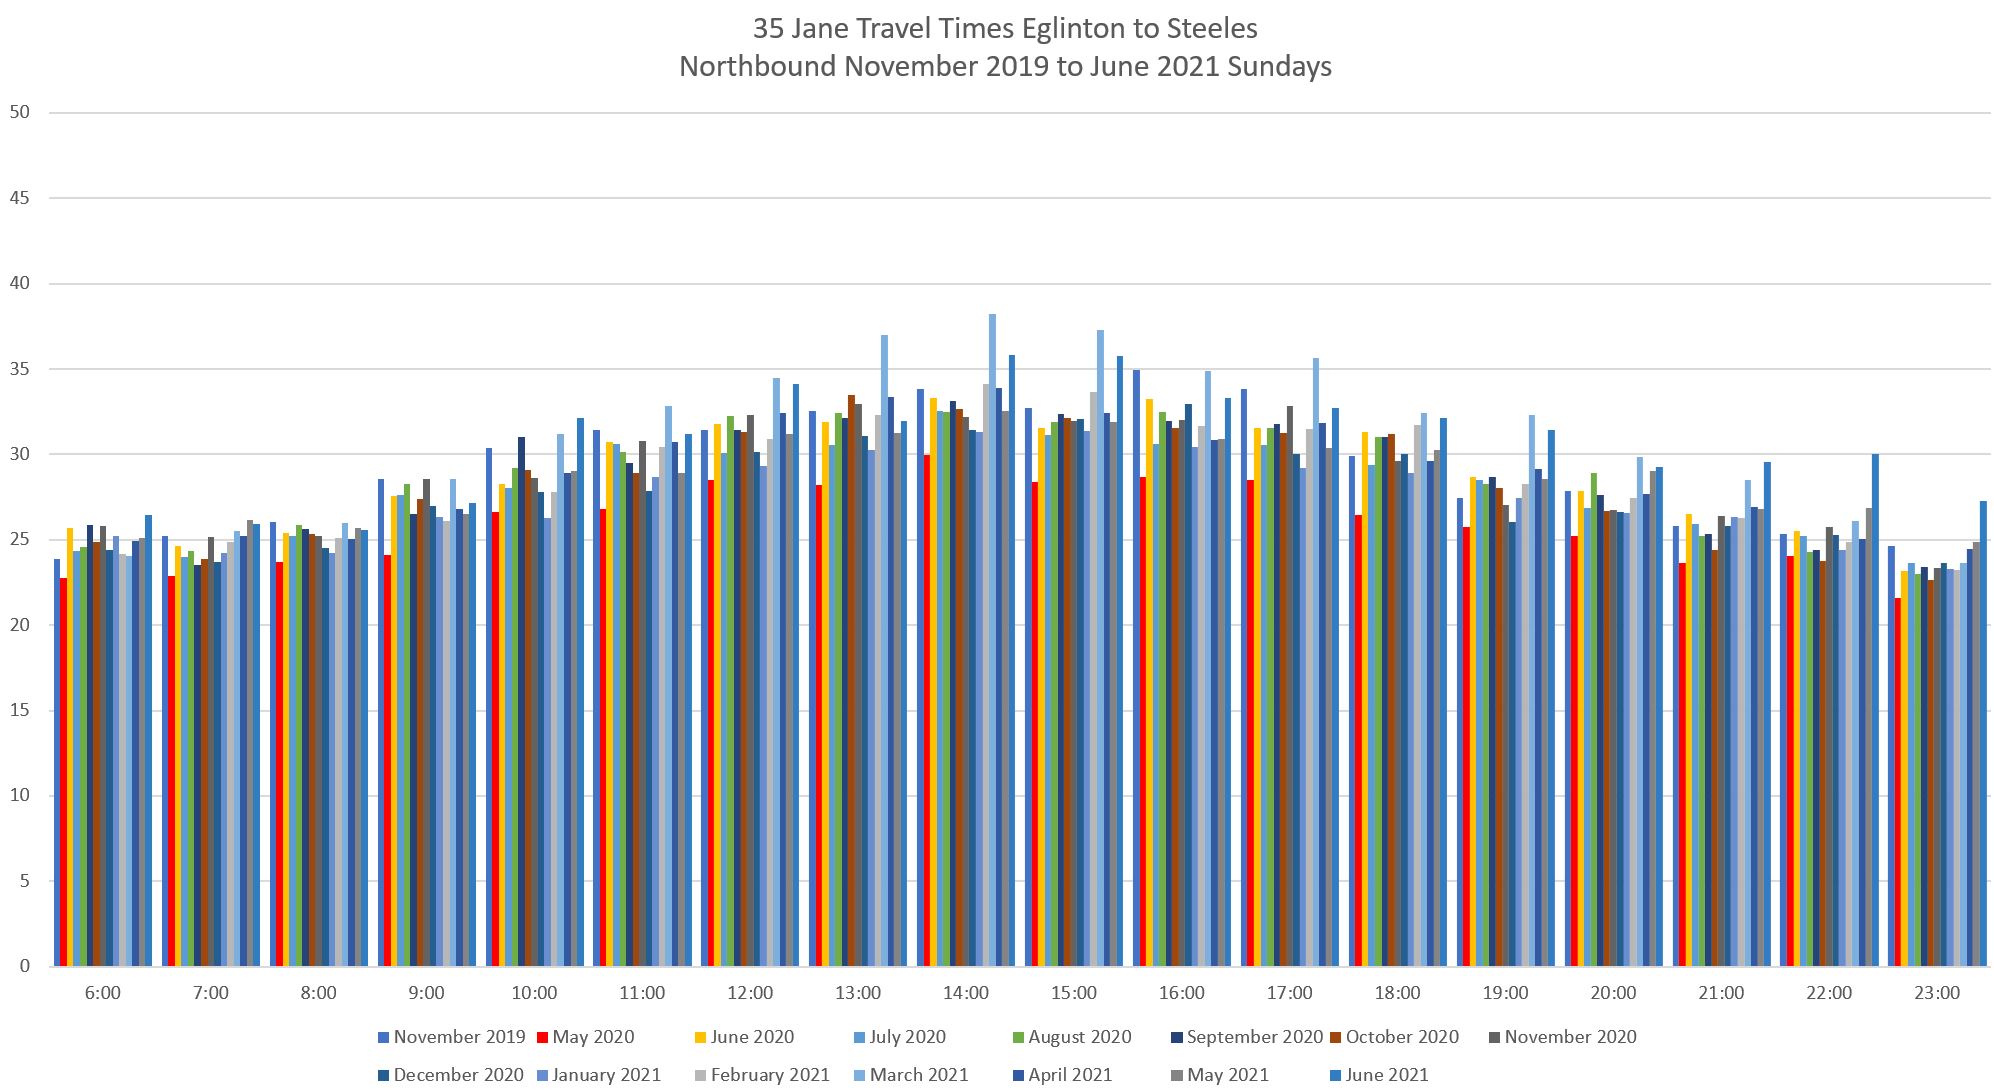
The situation on weekends is similar. Here are the northbound charts for Saturdays and Sundays.
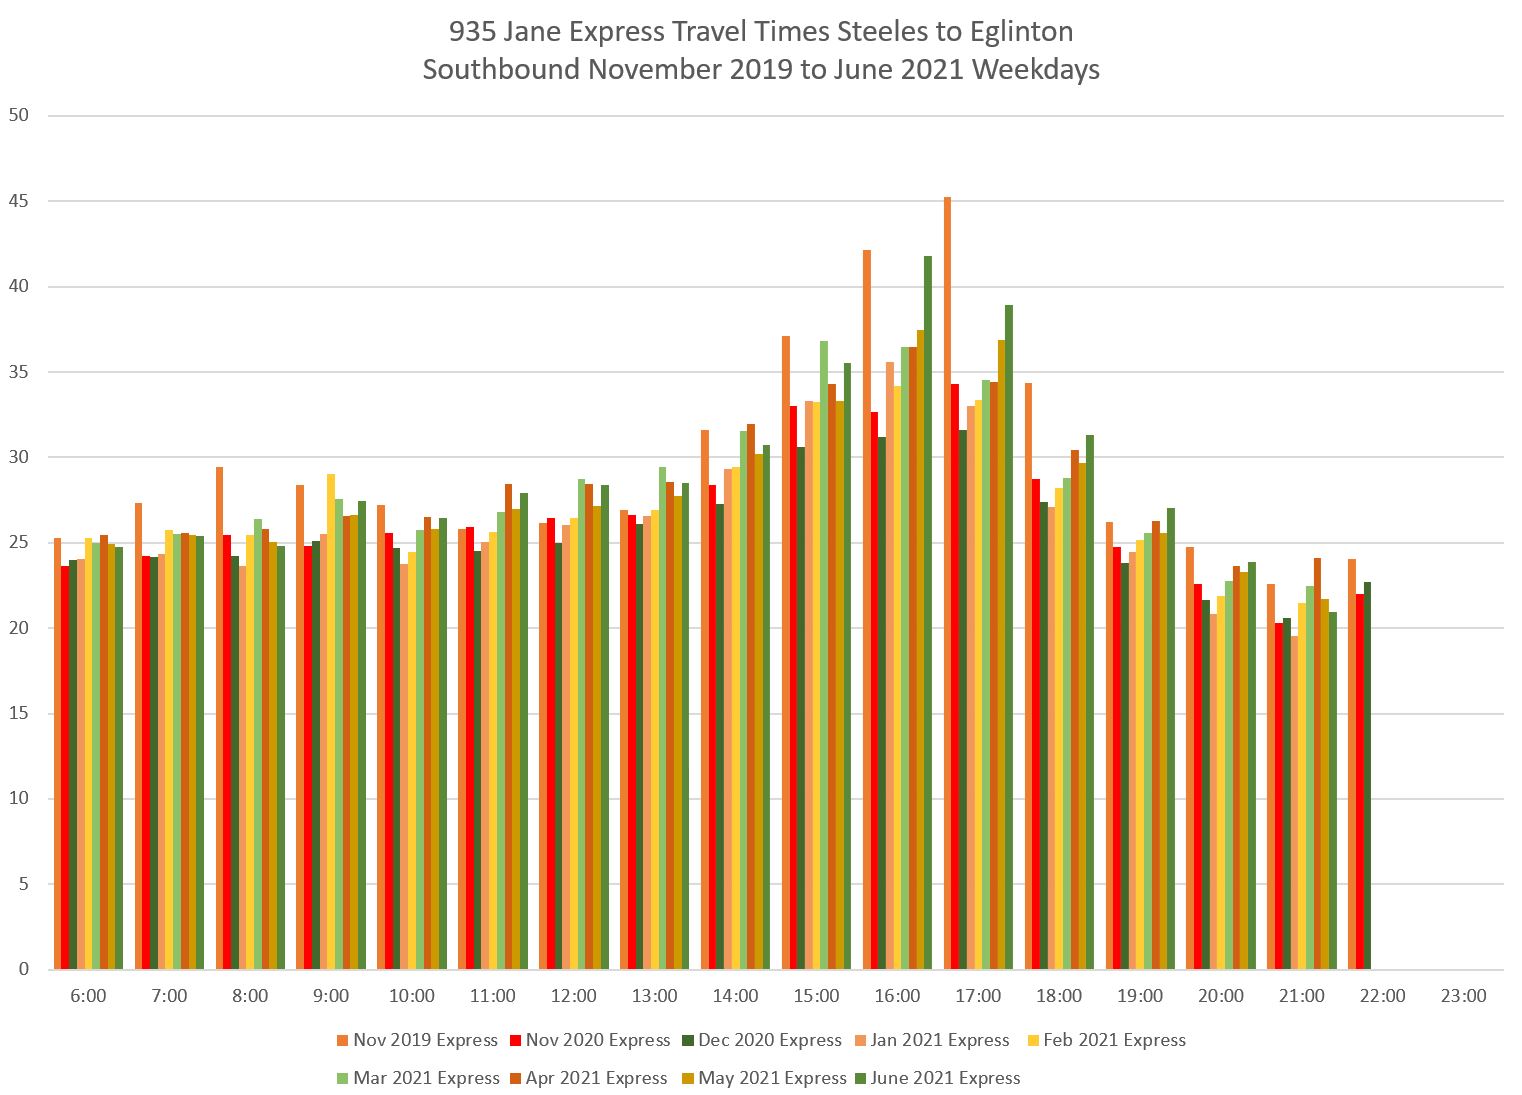
The 935 express service operated in 2019, but was suspended in 2020 until November (red). Travel times are now generally higher than in fall 2019.
As with the local service, southbound travel times, especially in the PM peak, were higher in 2019 than in most recent data.
Recent individual weeks have shown changes in travel times due to the effect of construction of the 6 Finch West LRT line. Here are charts for May 2021.
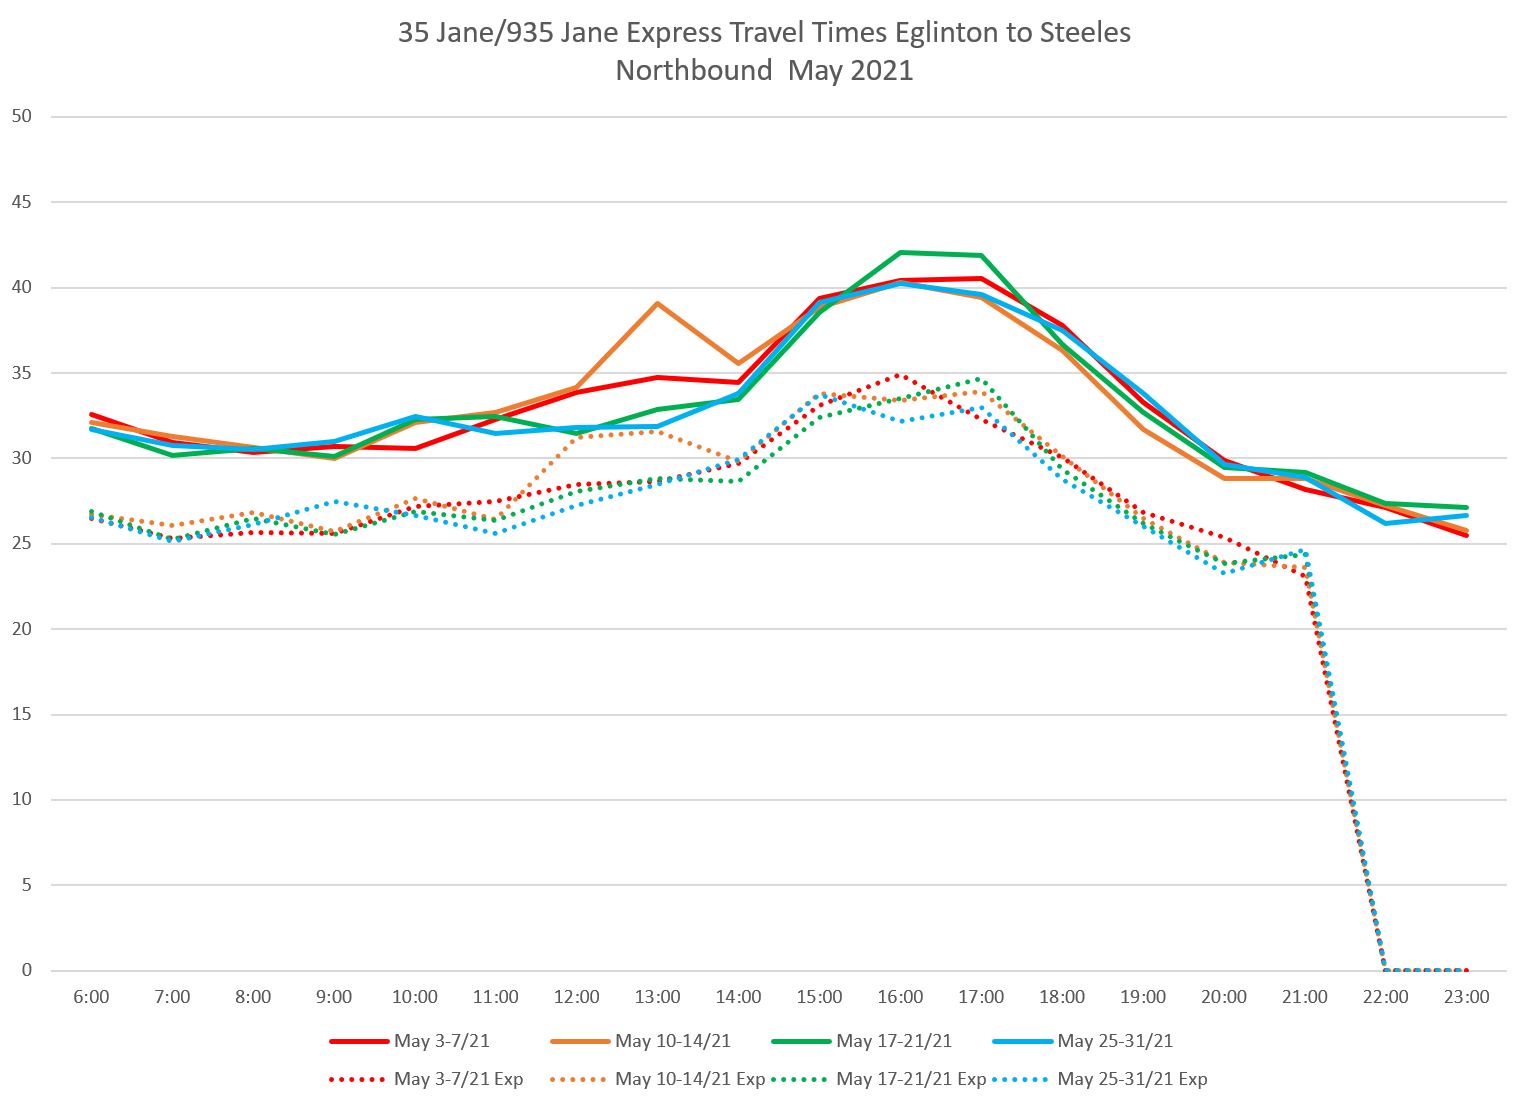
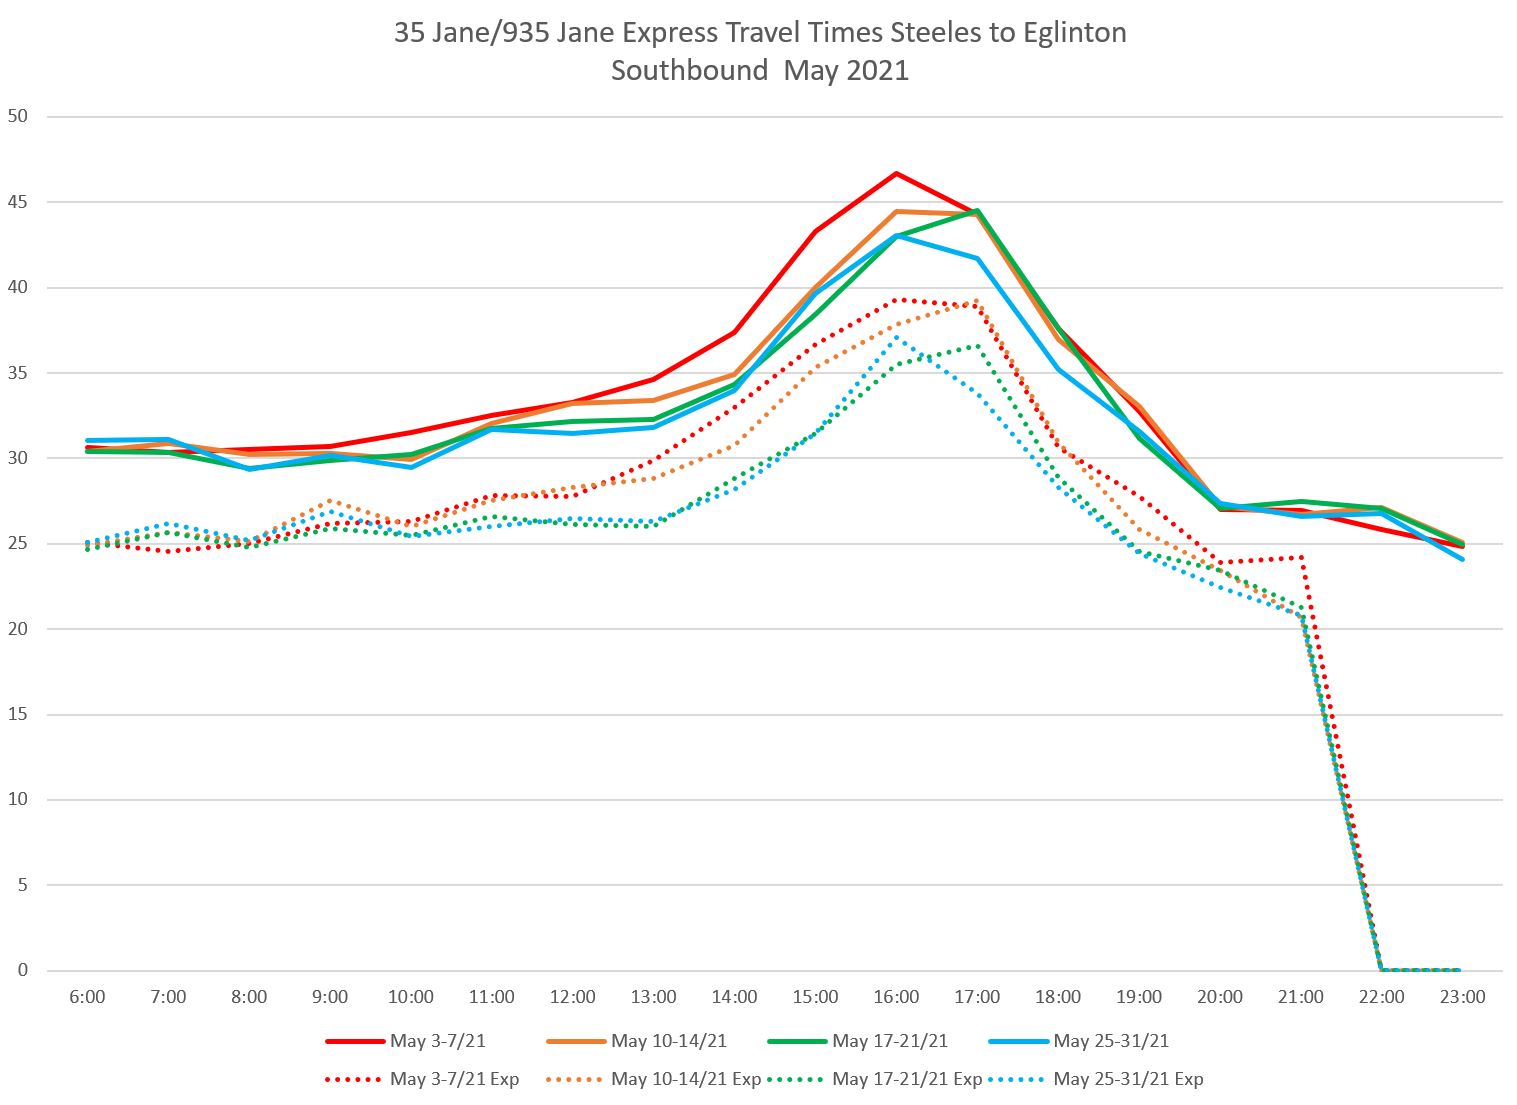
June 2021 shows a jump in values in the latter part of the month. (Note that the vertical scale on the June charts goes to 60, while the May charts go to 50 minutes.)
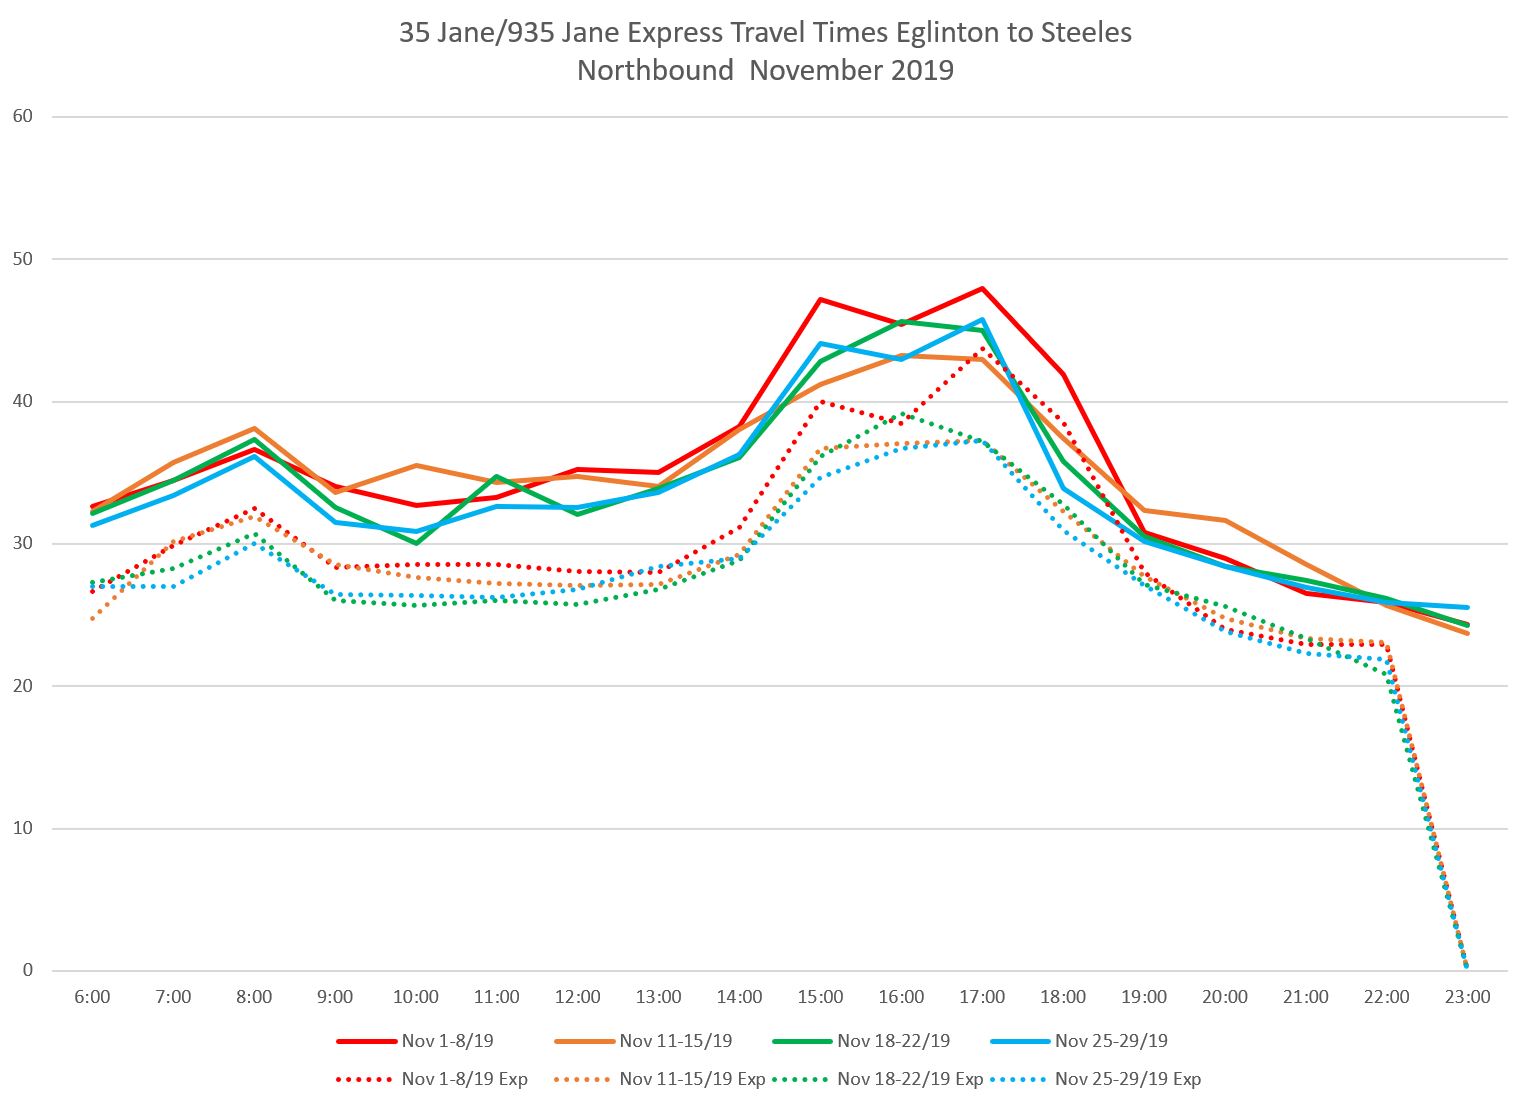
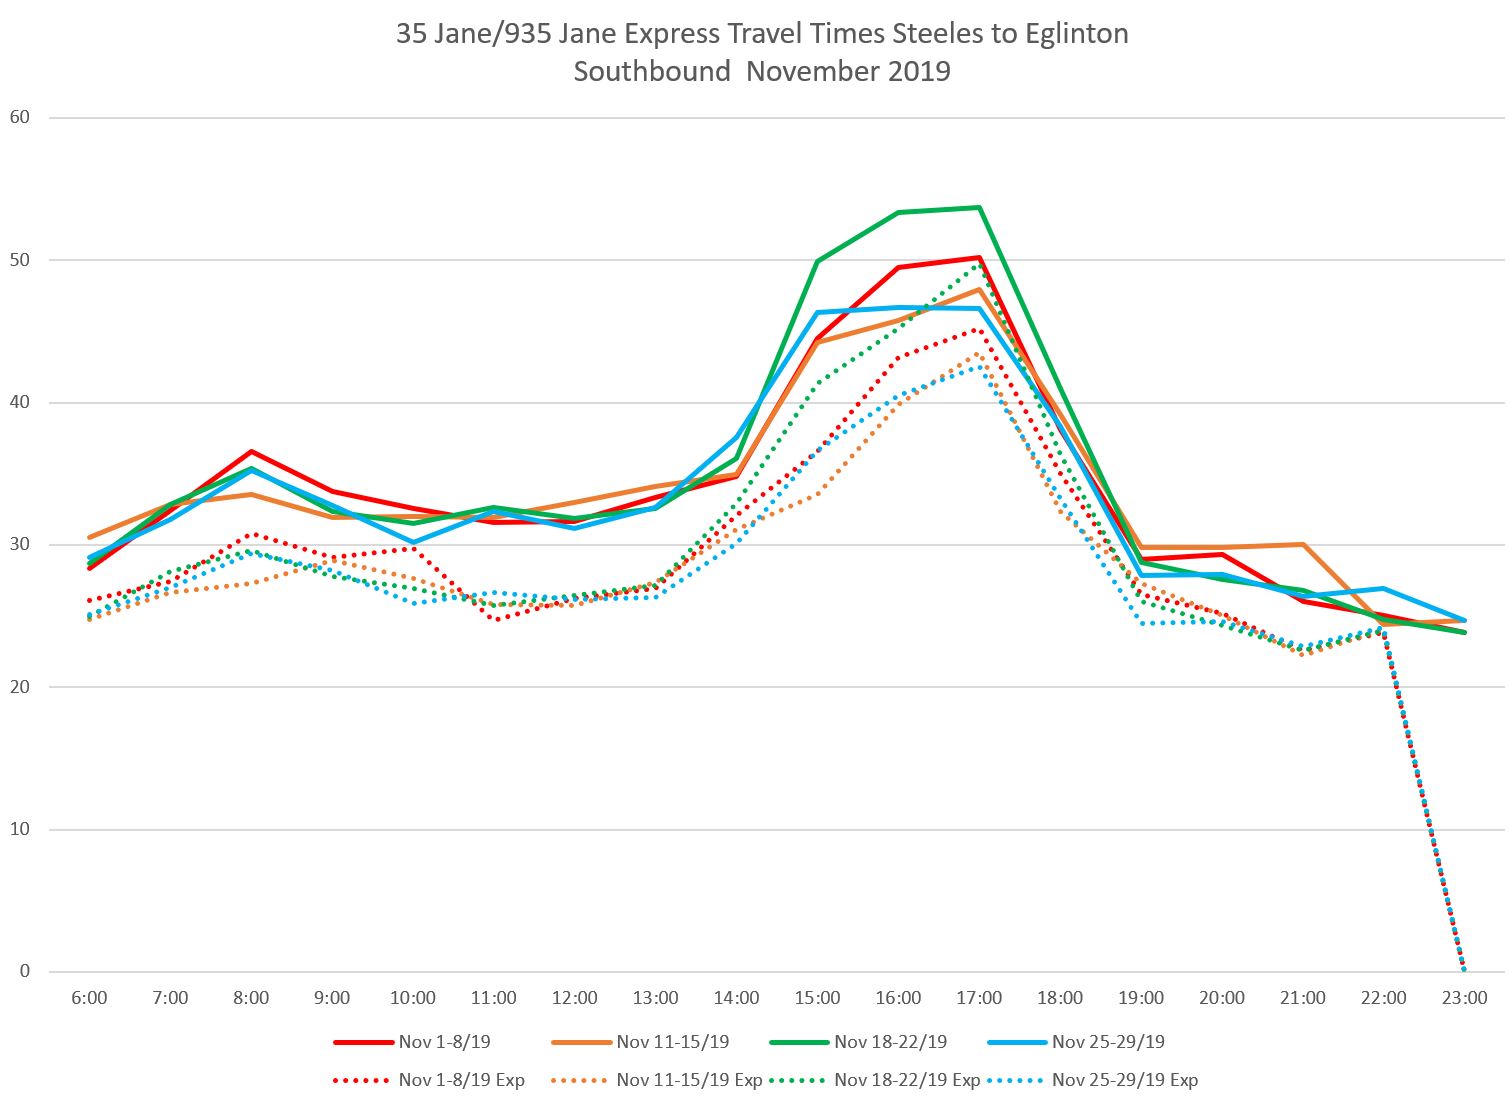
For comparison, here are the weekly charts for November 2019. The peak travel times were high in the PM peak, and higher southbound than northbound, and this peak was re-established on Jane through 2021. There was a much smaller AM peak in 2019 that is not yet seen in current data.
Schedules for 35 Jane provide almost half an hour more for a PM peak round trip than an AM peak trip (May-June 2021) because of this stark difference in the two periods. 935 Jane Express buses get about 20 minutes more in the PM peak than in the AM.
Comparing Local and Express Speed Profiles
Although Jane Street has both local and express services, the locations and times where one is faster than the other, and by how much, vary.
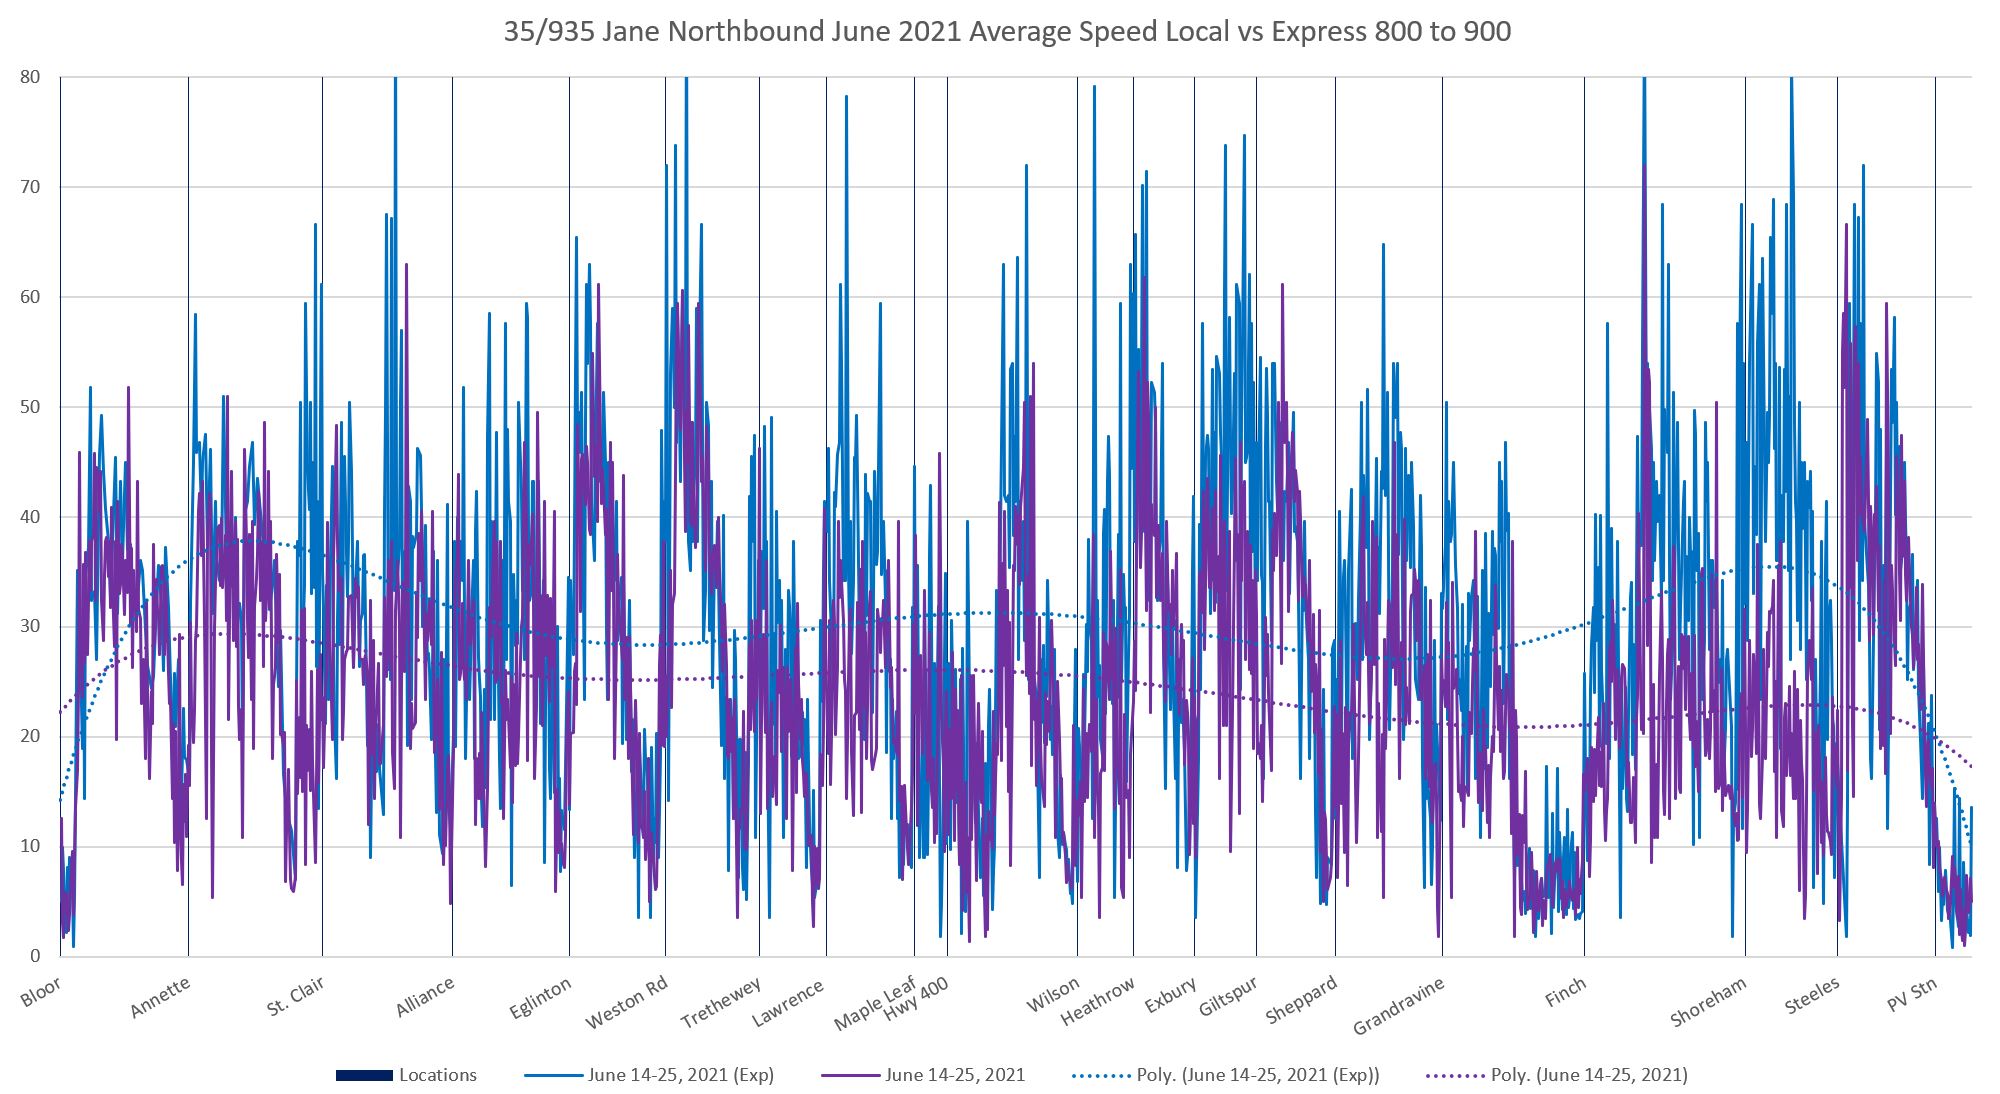
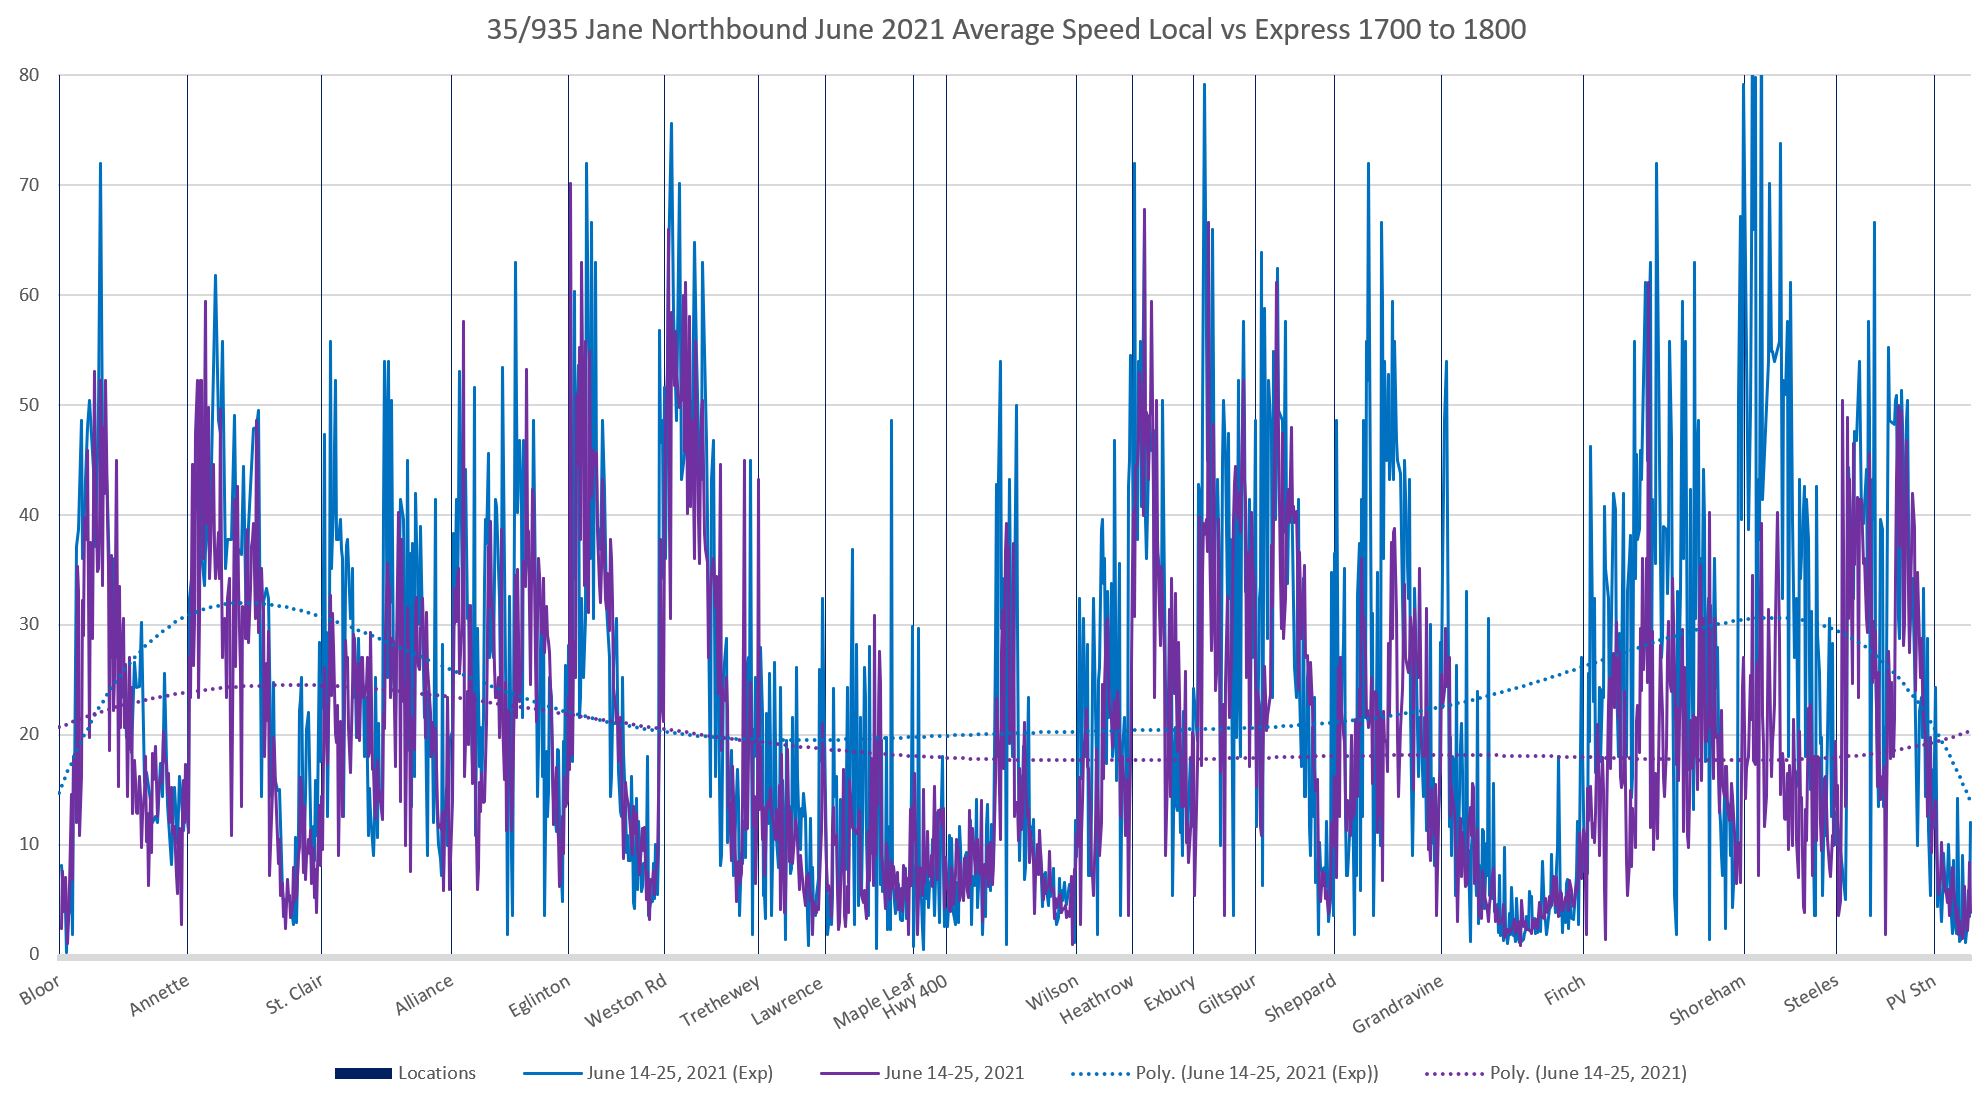
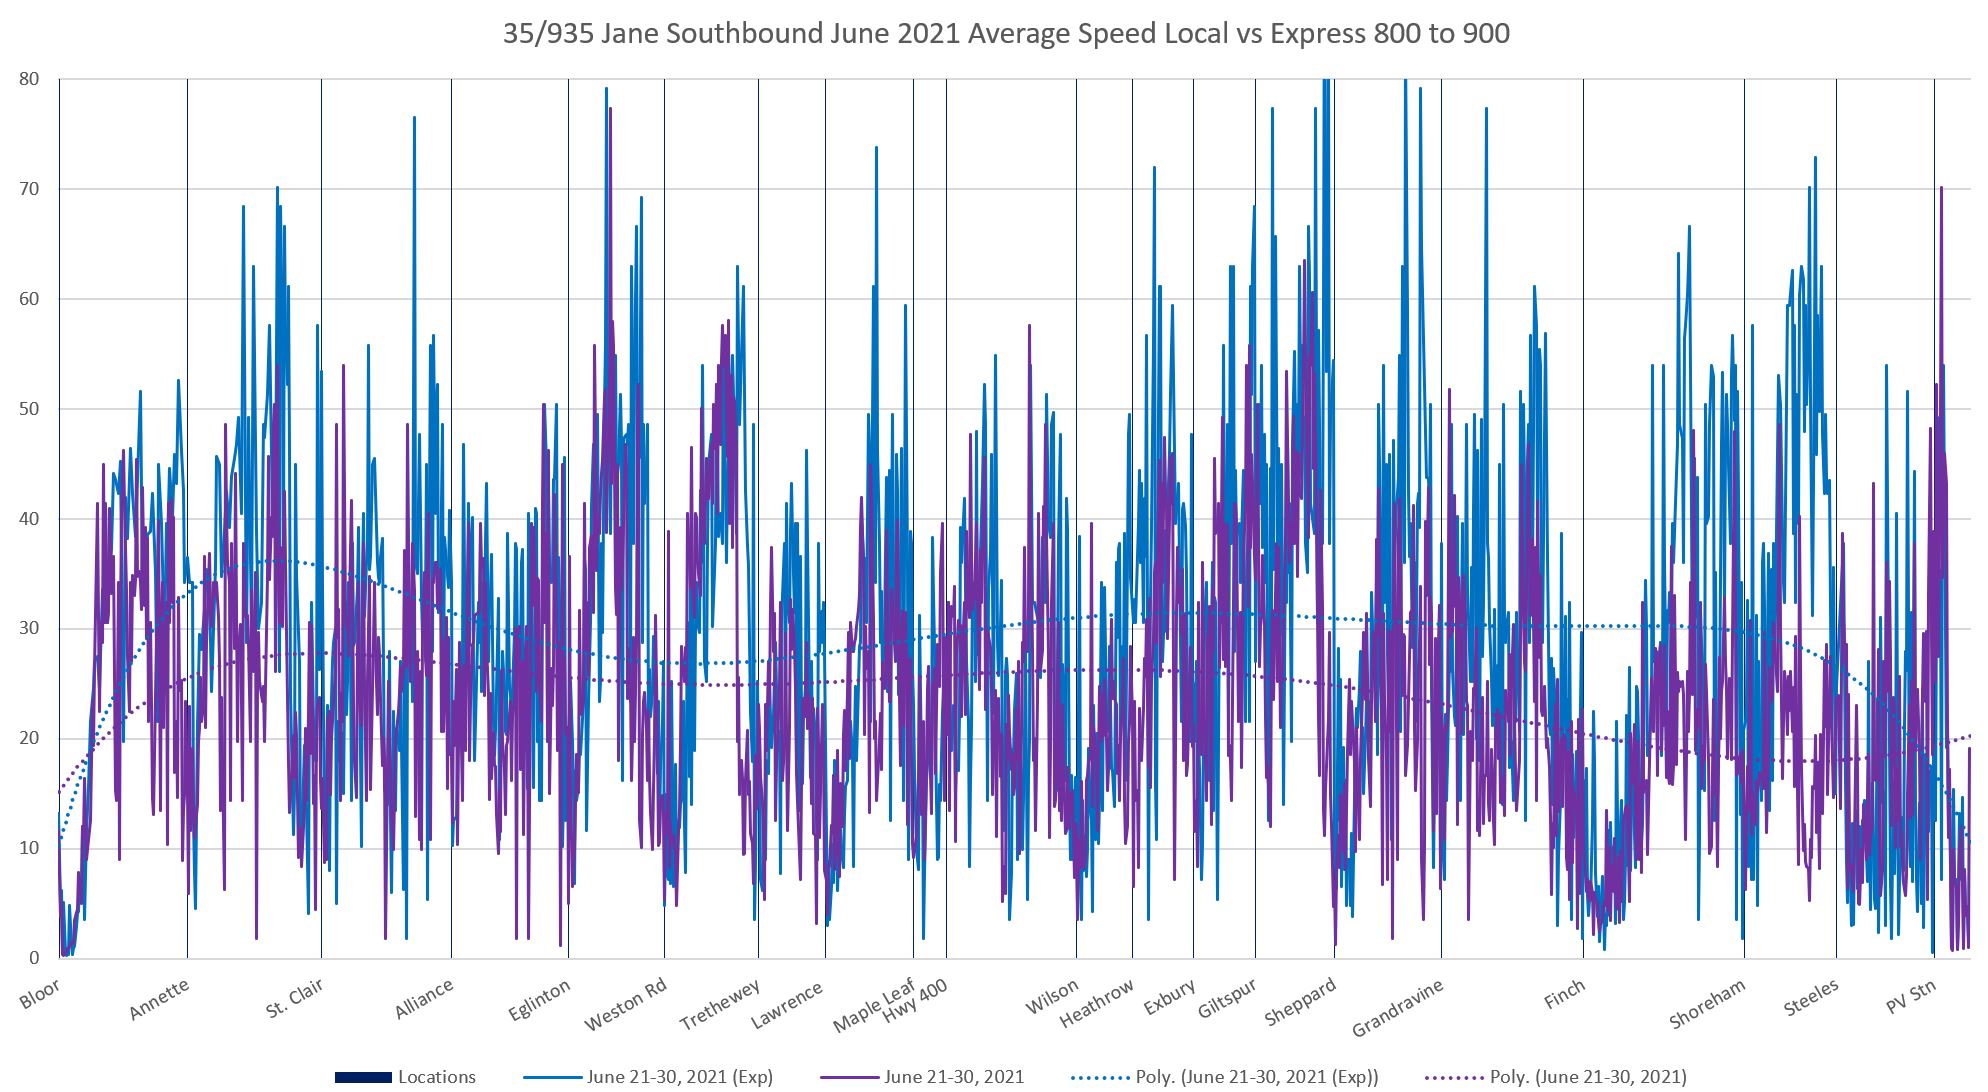
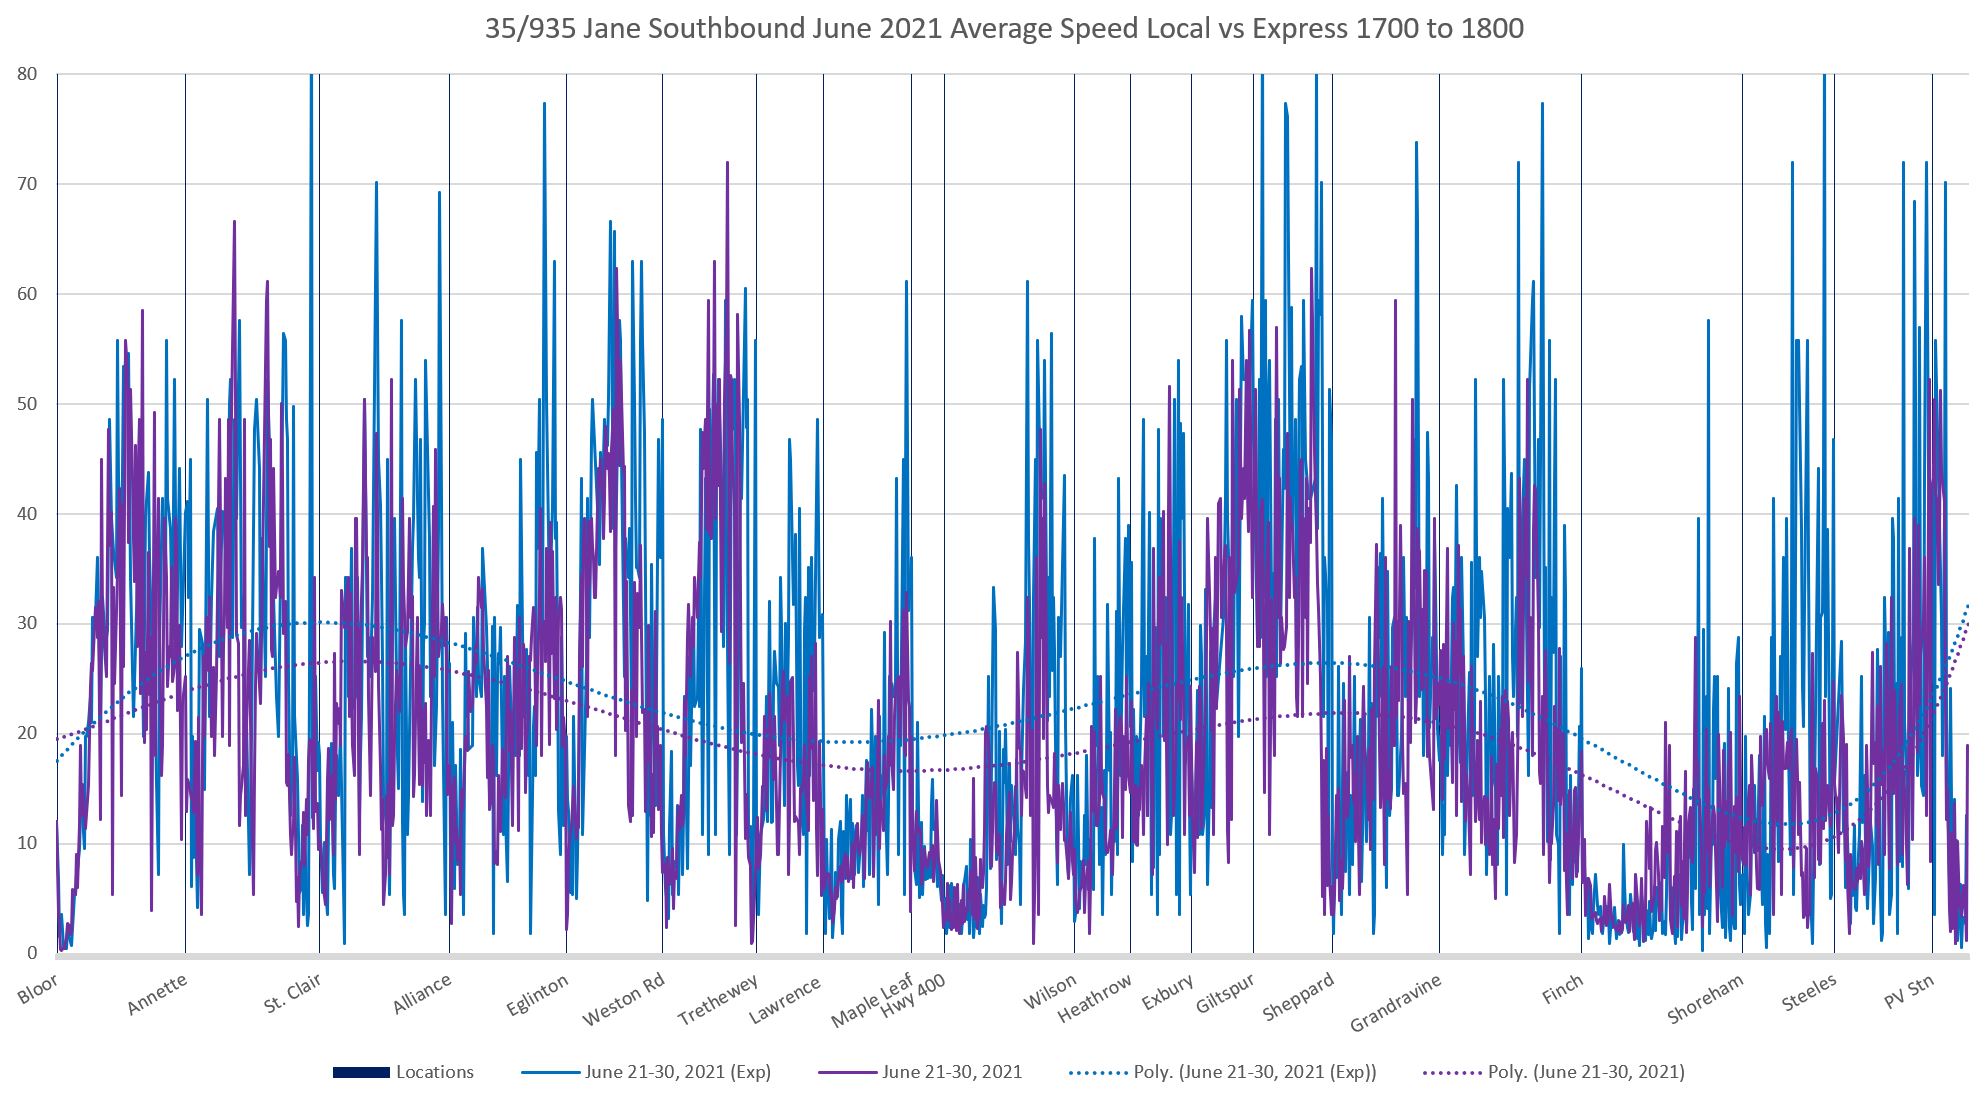
The charts in this section compare speed profiles for the two services along the route. On these charts, the vertical axis shows the average speed of buses at each location, while the horizontal axis runs south to north (Jane Stn at the left, Pioneer Village Stn at the right). Northbound trips should be read from left to right, southbound trips from right to left. Each page represents a separate hour’s data from 6:00 am to 11:00 pm (2300).
Note that these data are taken from two weeks when construction at Finch affected the route. These were weeks 3 and 4 of June northbound, and weeks 4 and 5 southbound (as seen in earlier charts above).
The turquoise lines show the express bus speeds, while the purple lines show the locals. In each case the dotted lines show the overall shape of the data but do not track changes closely.
Items of interest:
- In the PM peak there is substantial congestion in the central part of the route northbound that eliminates much of the benefit of “express” operation. Buses stuck in traffic move at the same speed whether they serve every stop or not.
- The effect of construction on travel speeds northbound approaching Finch (from the left) and southbound (from the right) are obvious and they affect both services. The southbound effect is stronger in the PM peak.
- Locations where local buses stop but express buses do not can be seen with the purple lines moving downward (lower average speed) below the turquoise ones. The average speed is rarely zero because not every bus sits long enough at every stop to be considered as stationary. This is especially true at stops where traffic signals do not hold buses either through signal priority, or because the stop is farside, or because the location is not at a signalled location.
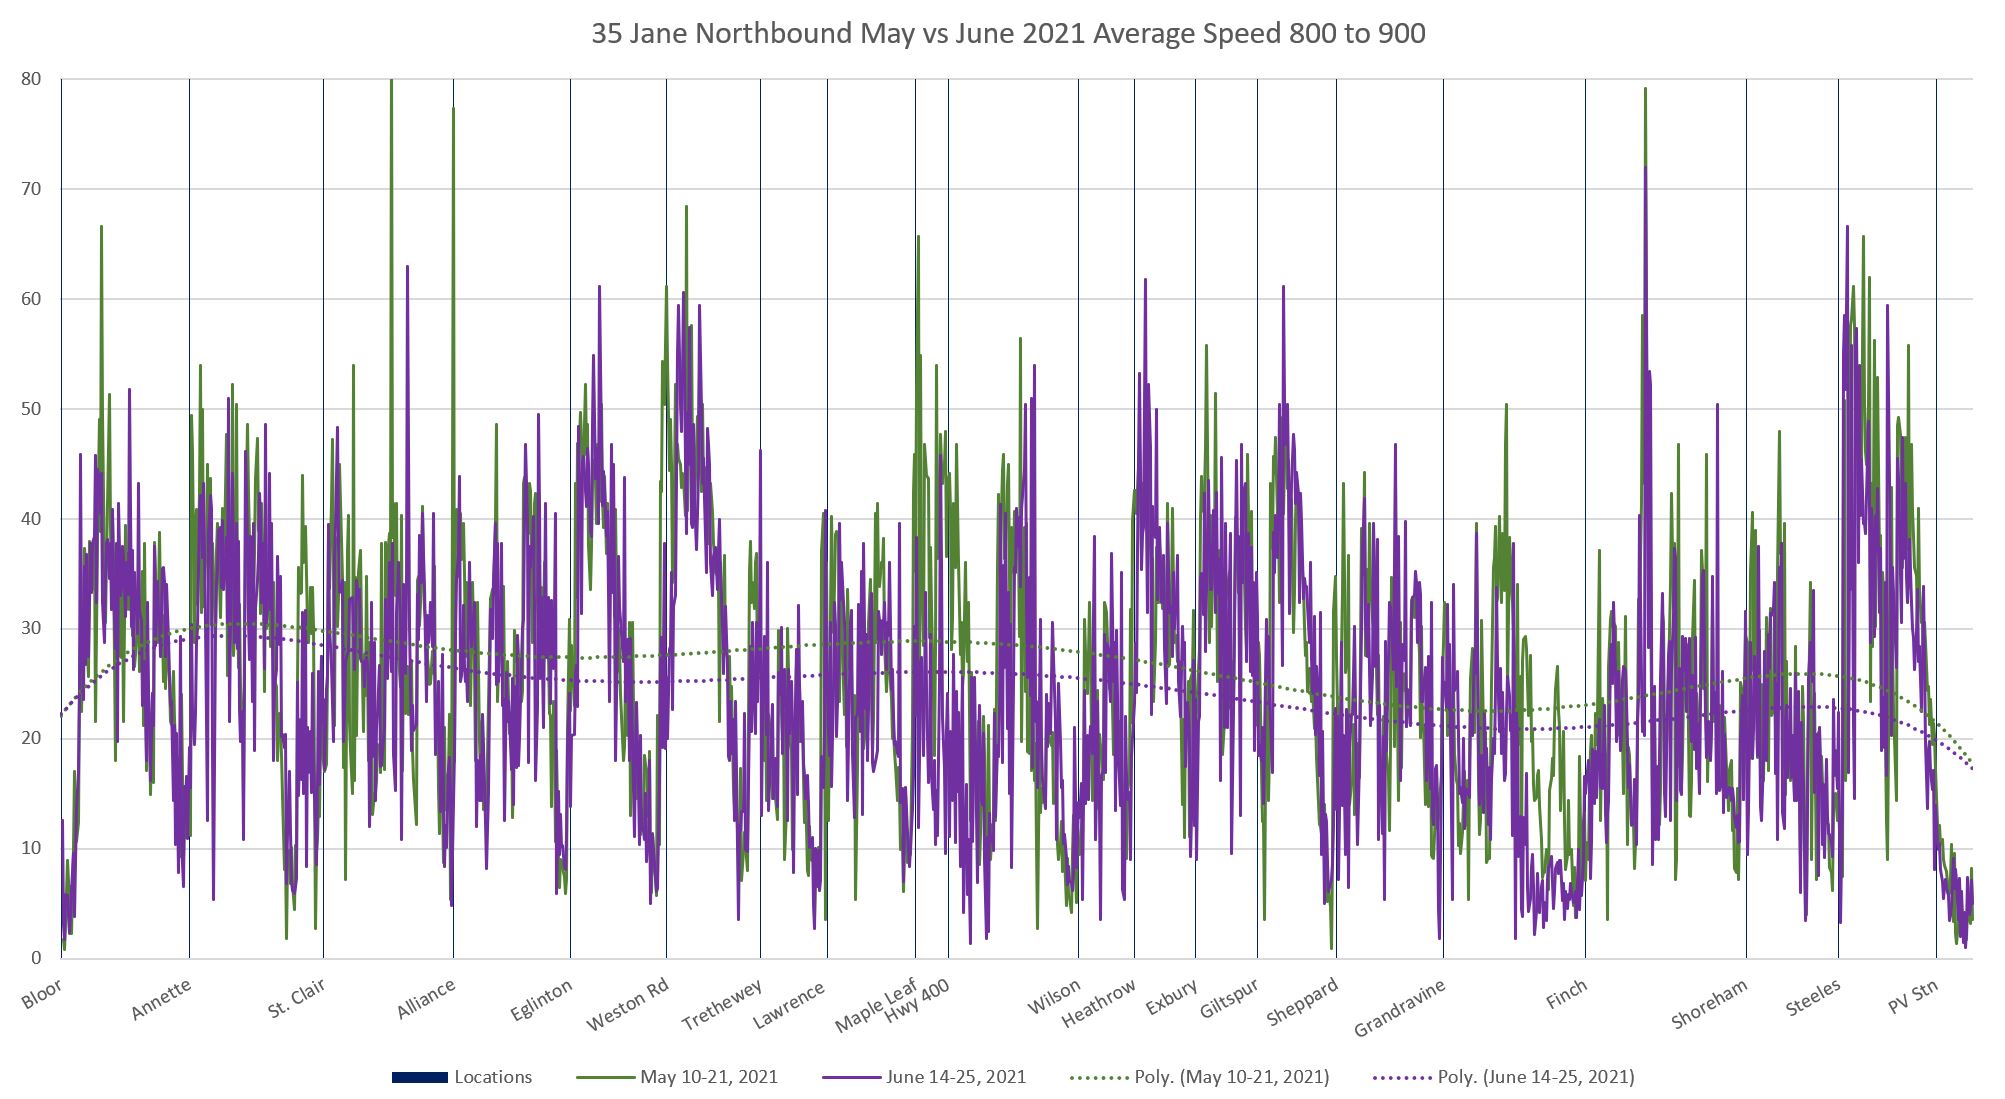
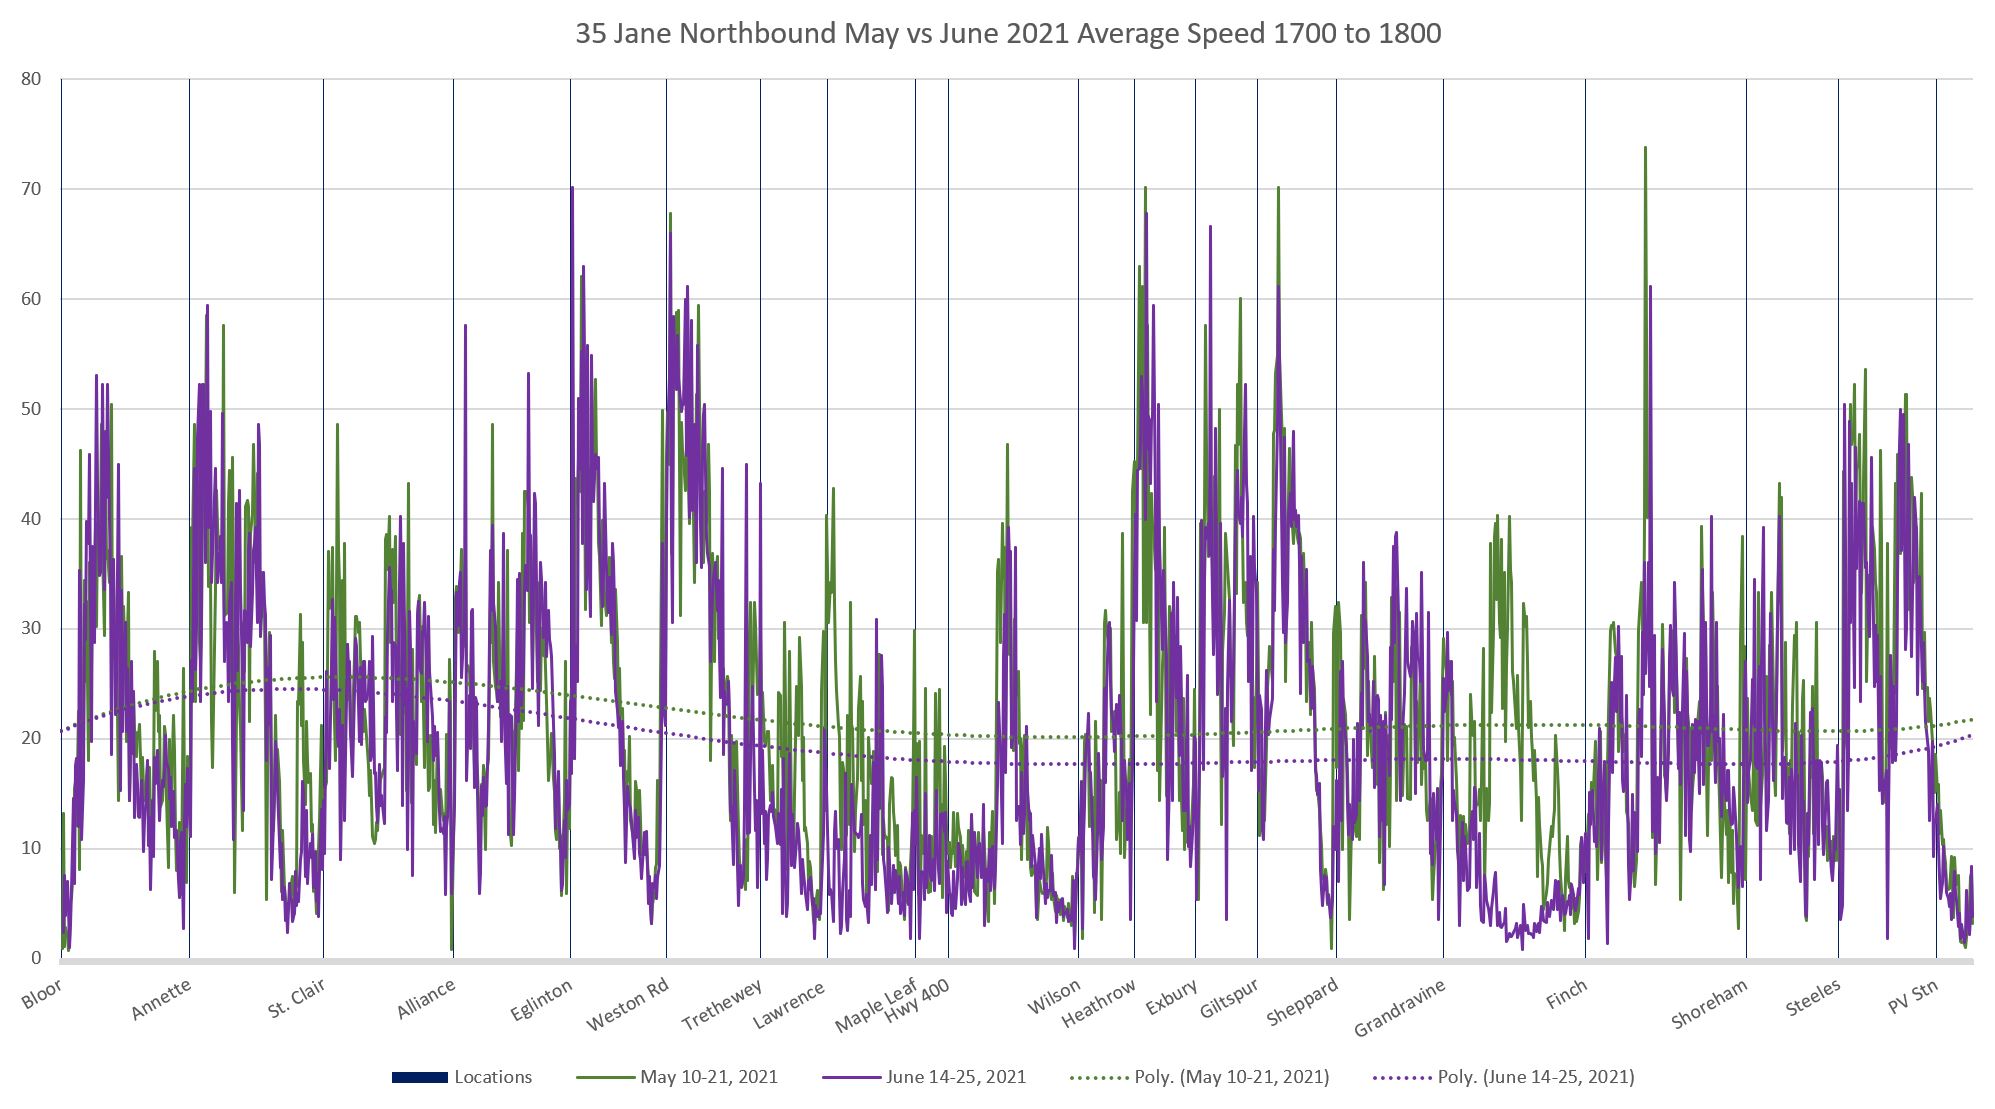
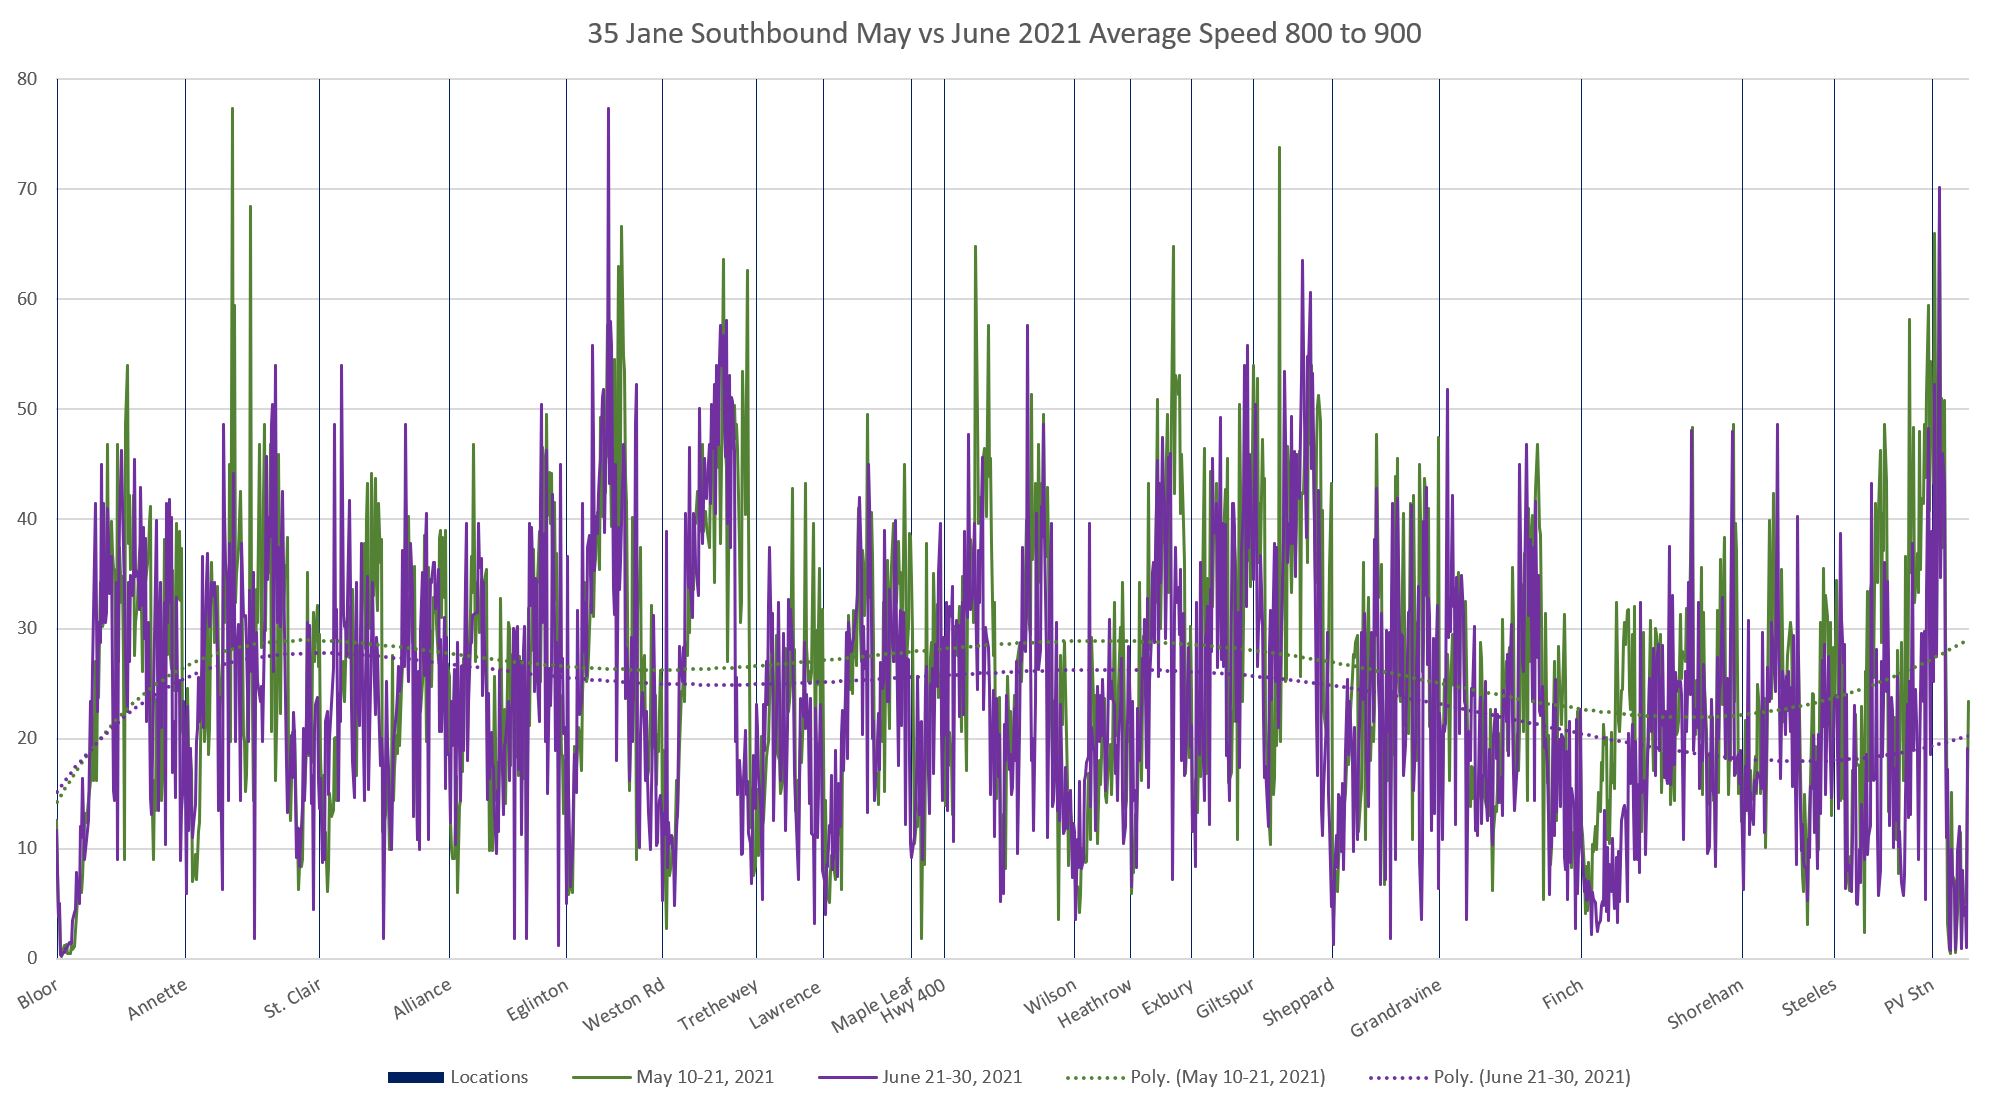
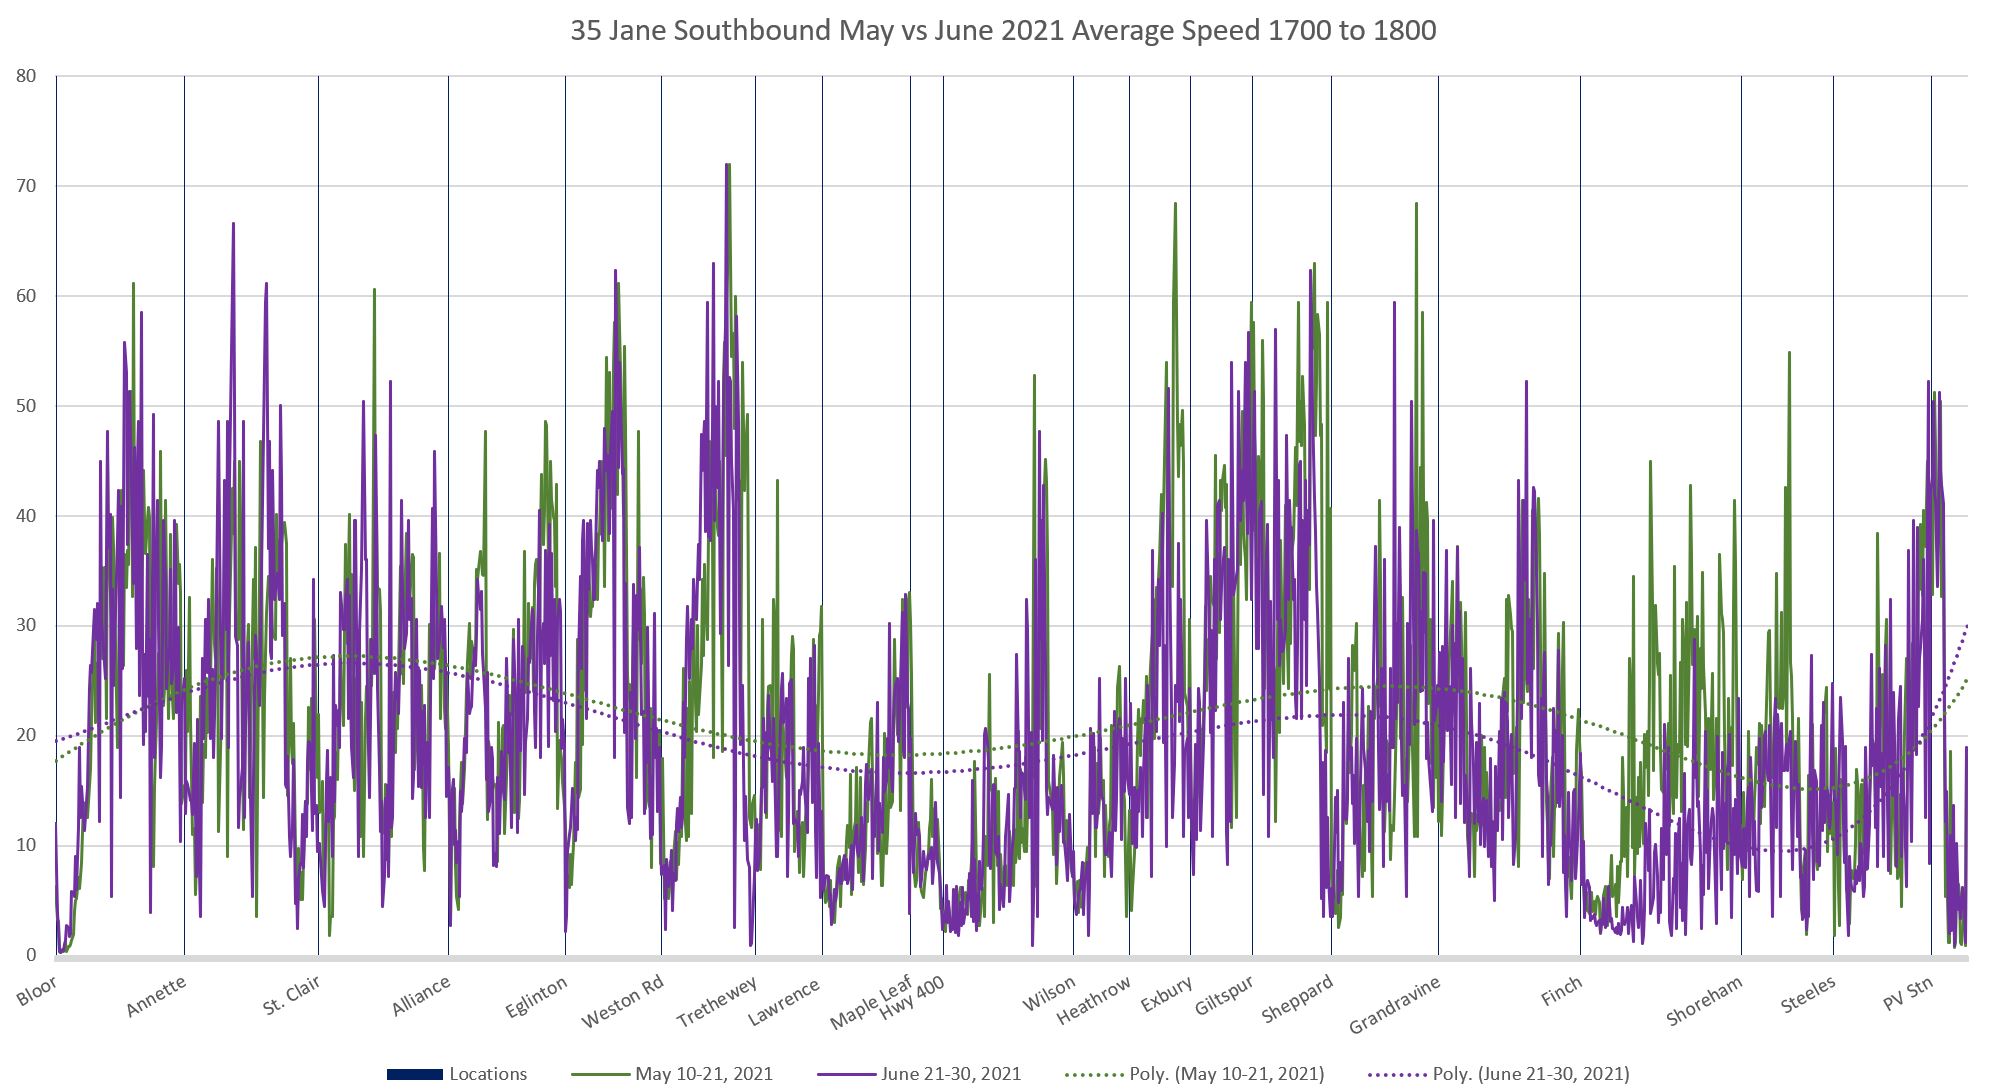
The Effect of Construction at Finch & Jane
The charts below are in the same format as the express vs local charts above, except that they contain data for mid-May 2021 (green) in place of the June express data. Only data for the local buses are shown here.
Items of interest:
- The trend lines run closer together as one would expect from data for comparable services. That said, the May trendlines are consistently at a slightly higher value than June over the entire route, not just at the congested Jane/Finch corner.
- The backlog of traffic causing low speeds is evident approaching Finch in each direction where the May data are well above the June values especially in the PM peak. The distance that traffic is backlogged is visible in the width of the area where the two sets of data diverge.
- As noted above, there is an area in the middle part of the route where May speeds are faster, notably in the PM peak northbound.
Headway Reliability
Headways on Jane are erratic under “normal” circumstances as I have documented in previous articles. The congestion at Finch, and to a lesser extent elsewhere, late in the month worsened an already bad situation. In this section, I will present data from the second week of the month before congestion at Finch affected the route, and from the fourth week when construction produced delays as shown above.
Scheduled Service
Schedules for both the local and express services were changed on June 20, the beginning of week 4. During some periods, the scheduled frequencies stayed the same, but the travel times were trimmed. This is happening on many TTC routes where scheduled times were excessive, but in this particular case the change happened to coincide with the onset of construction. (I will monitor these routes through the summer to document how quickly they return to pre-construction conditions.)
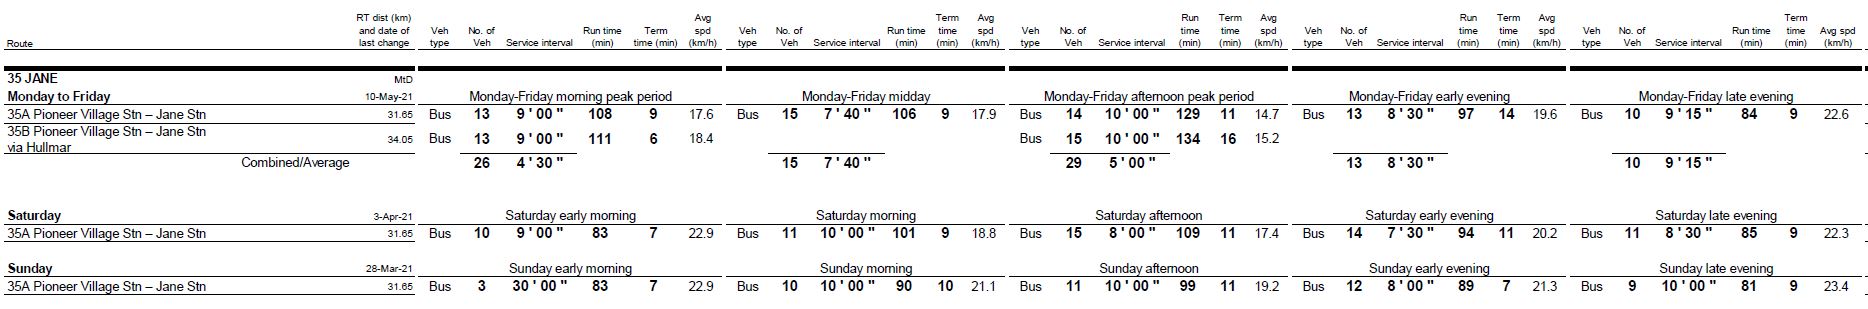
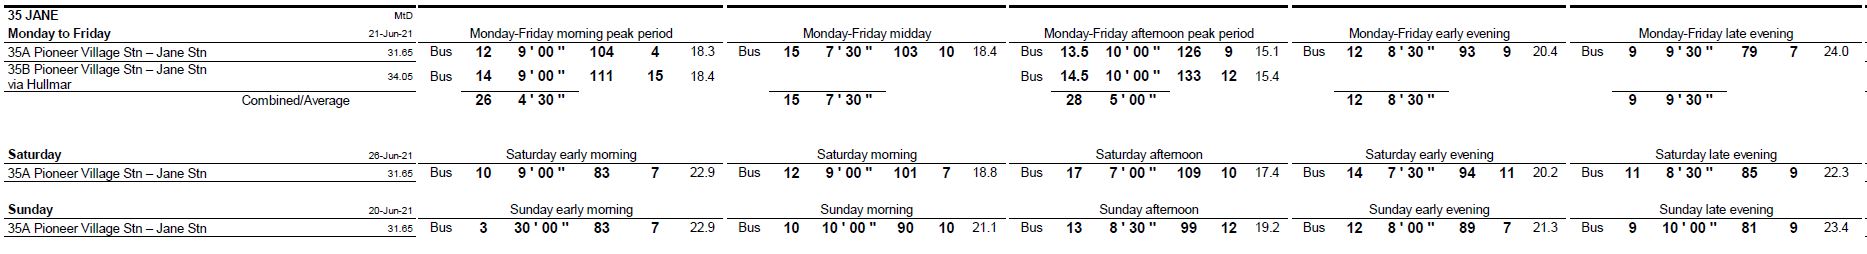


Local Service Northbound from Jane Station
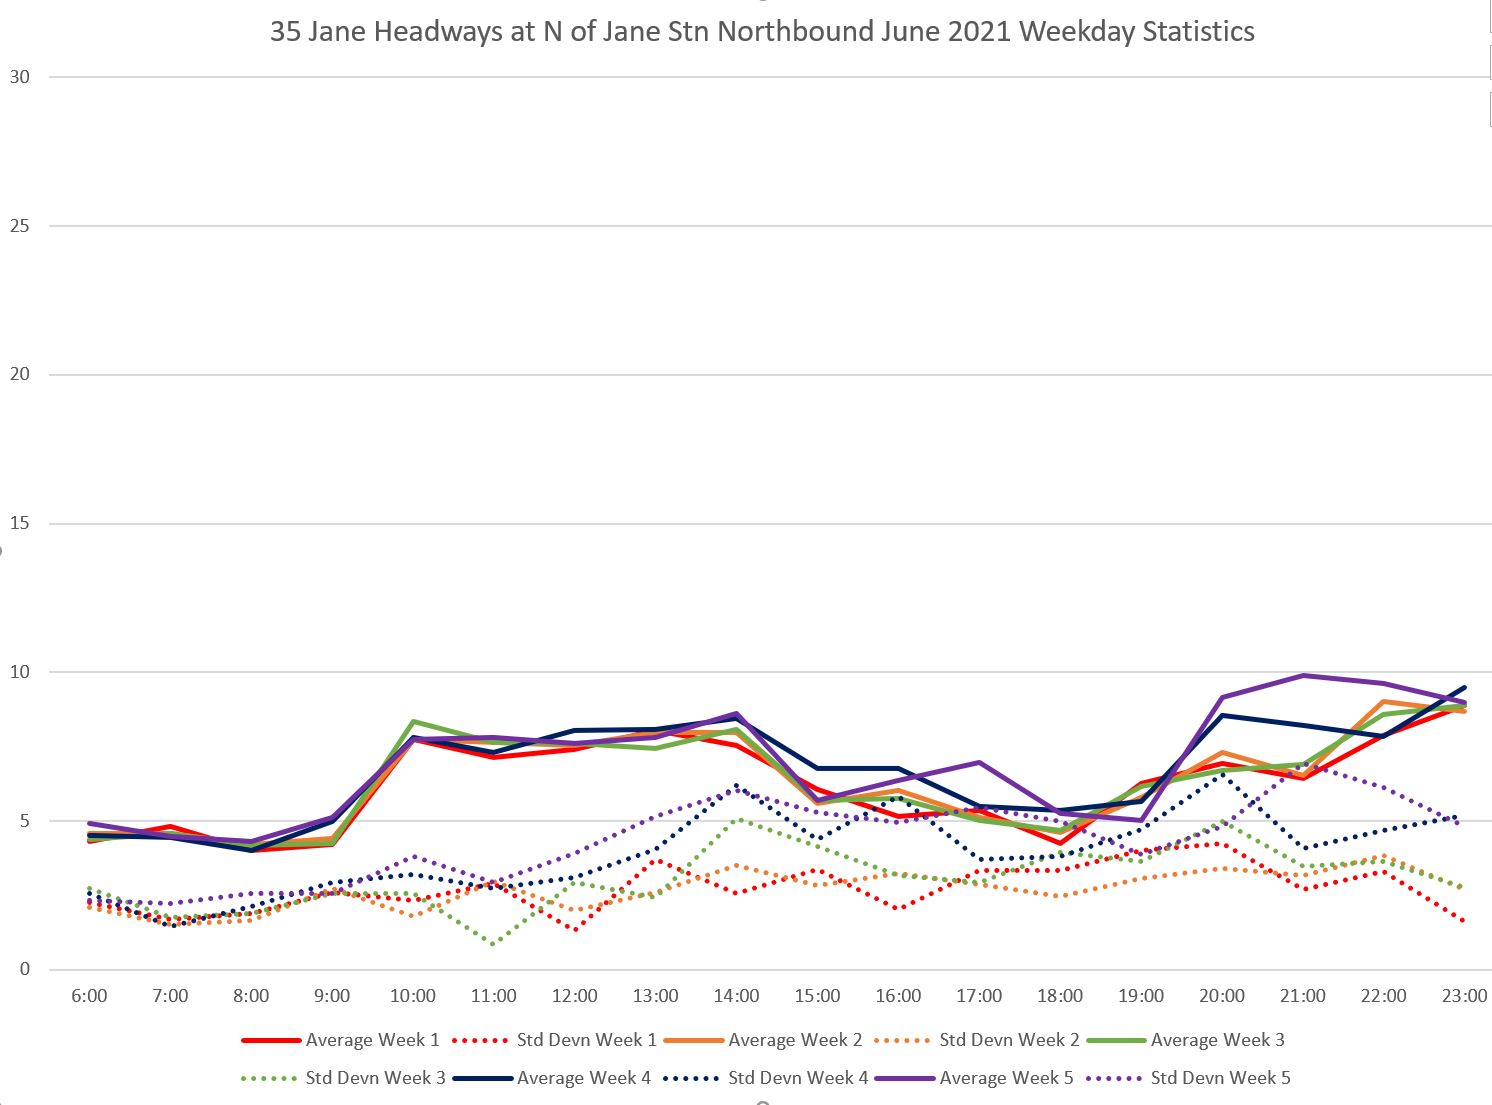
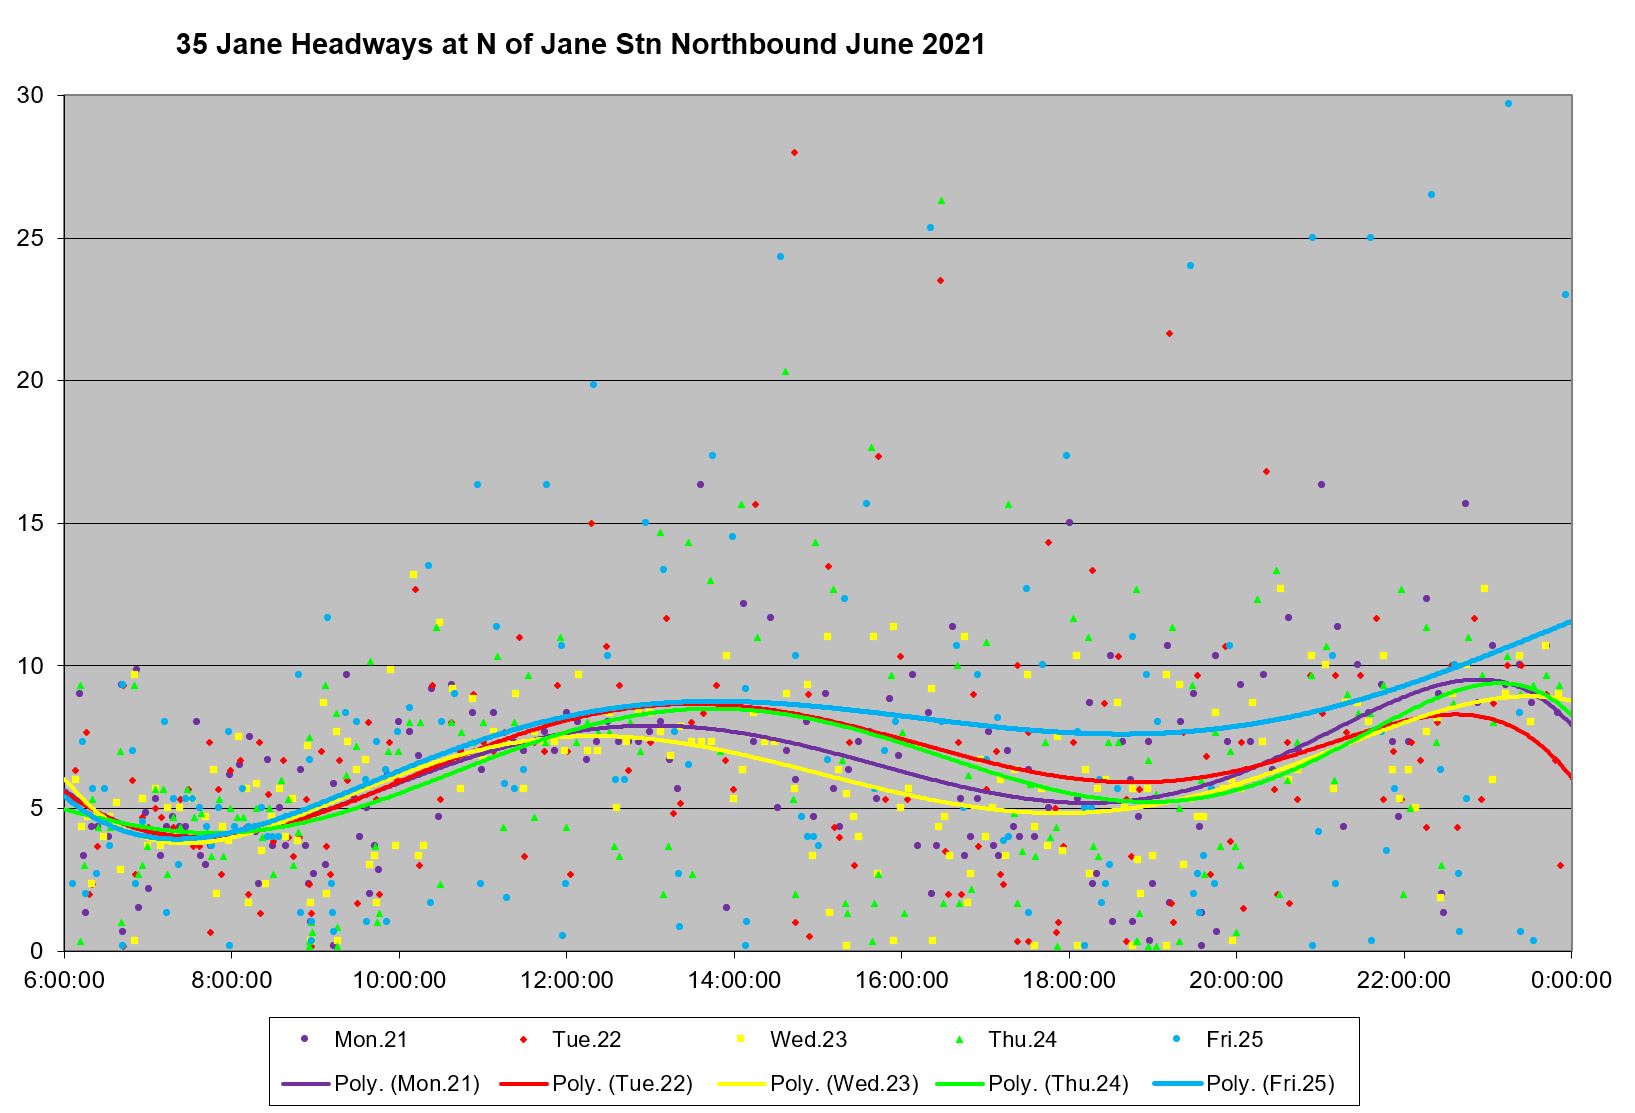
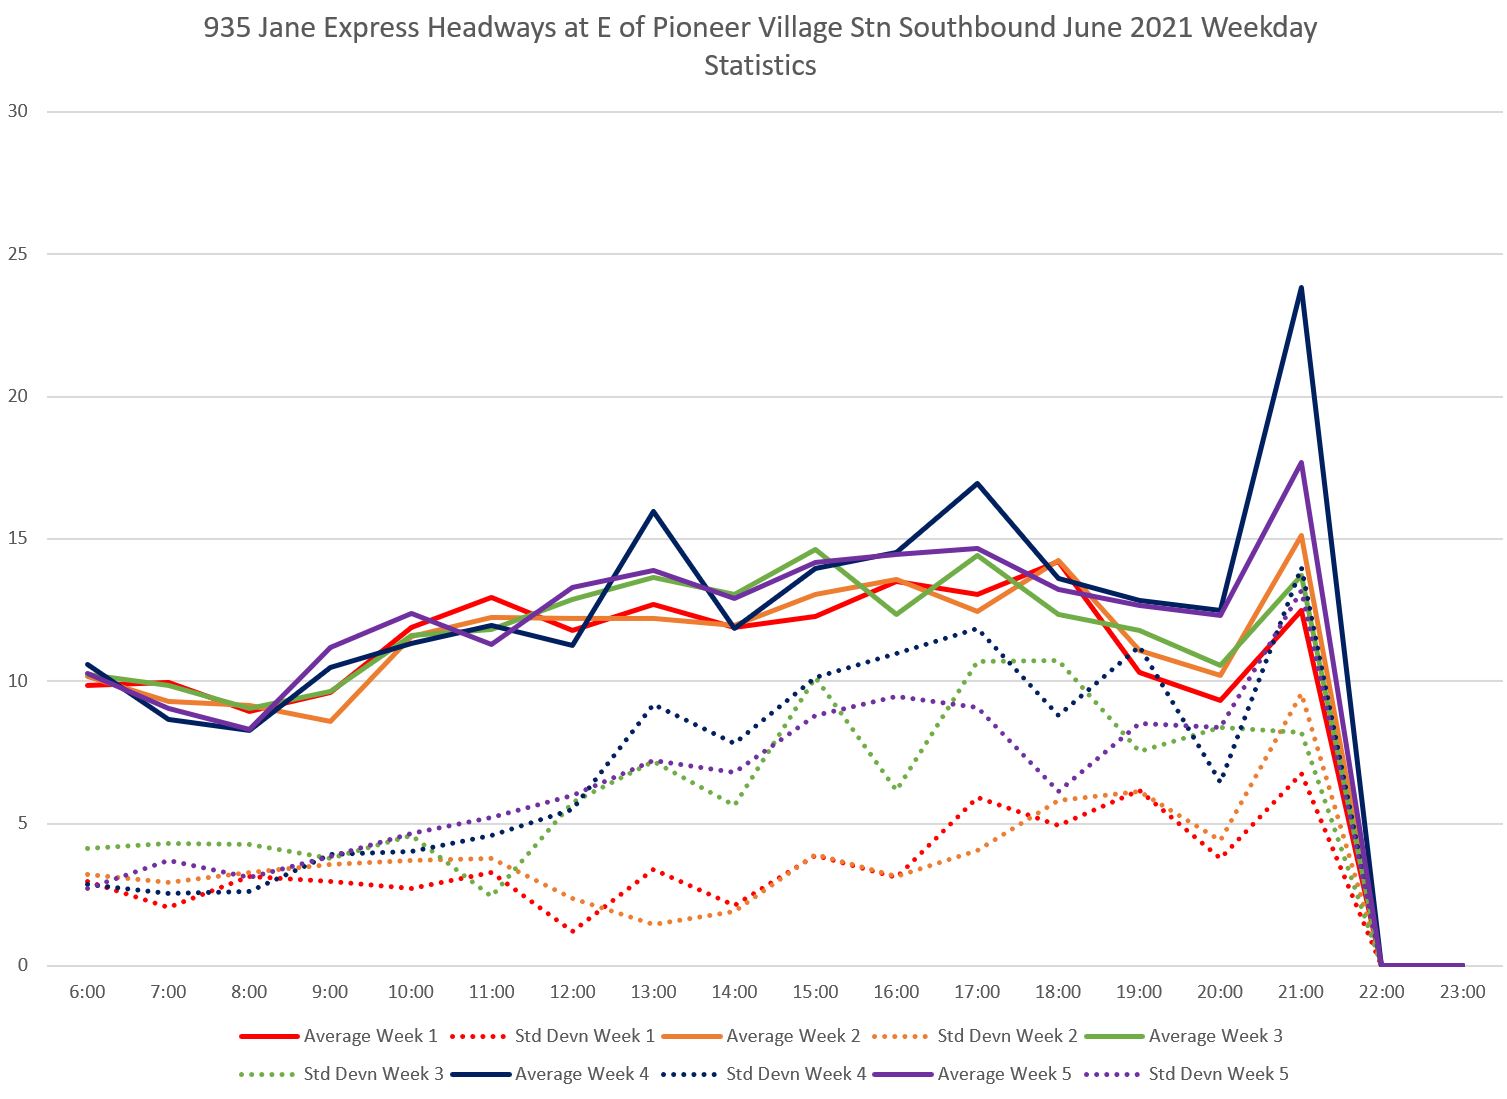
The chart below shows the service actually operated from Jane Station northbound. The solid lines show the weekly average headways (the times between buses) and the dotted lines show the standard deviation of these values. The SD is a measure of the dispersion of values, and a low SD reflects evenly spaced service (i.e. consistent headways). A high SD, especially one close to the average, indicates gapping and bunching. The average value might suggest that all of the scheduled service is operated, but the SD values show how well or badly organized this service is.
Service is reasonably well-behaved in the morning, but the SD values begin to rise, especially later in the month (week 4, dark blue, and week 5, purple) in the afternoon and through to late evening.
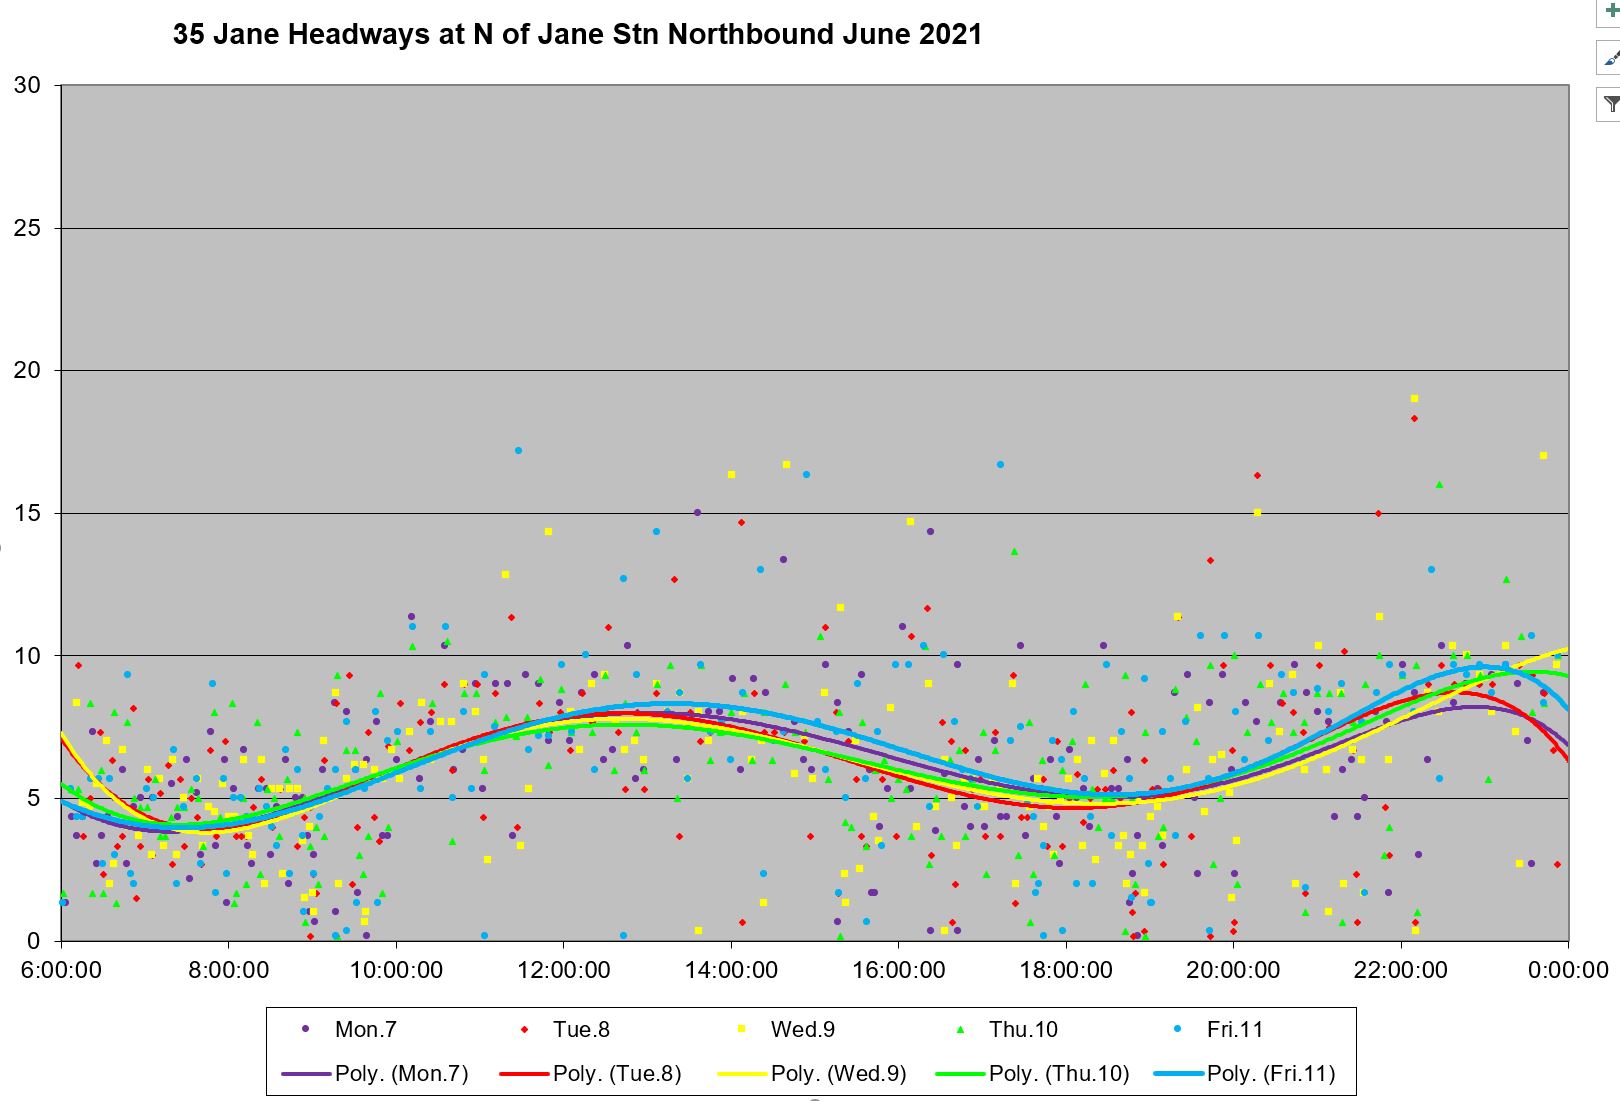
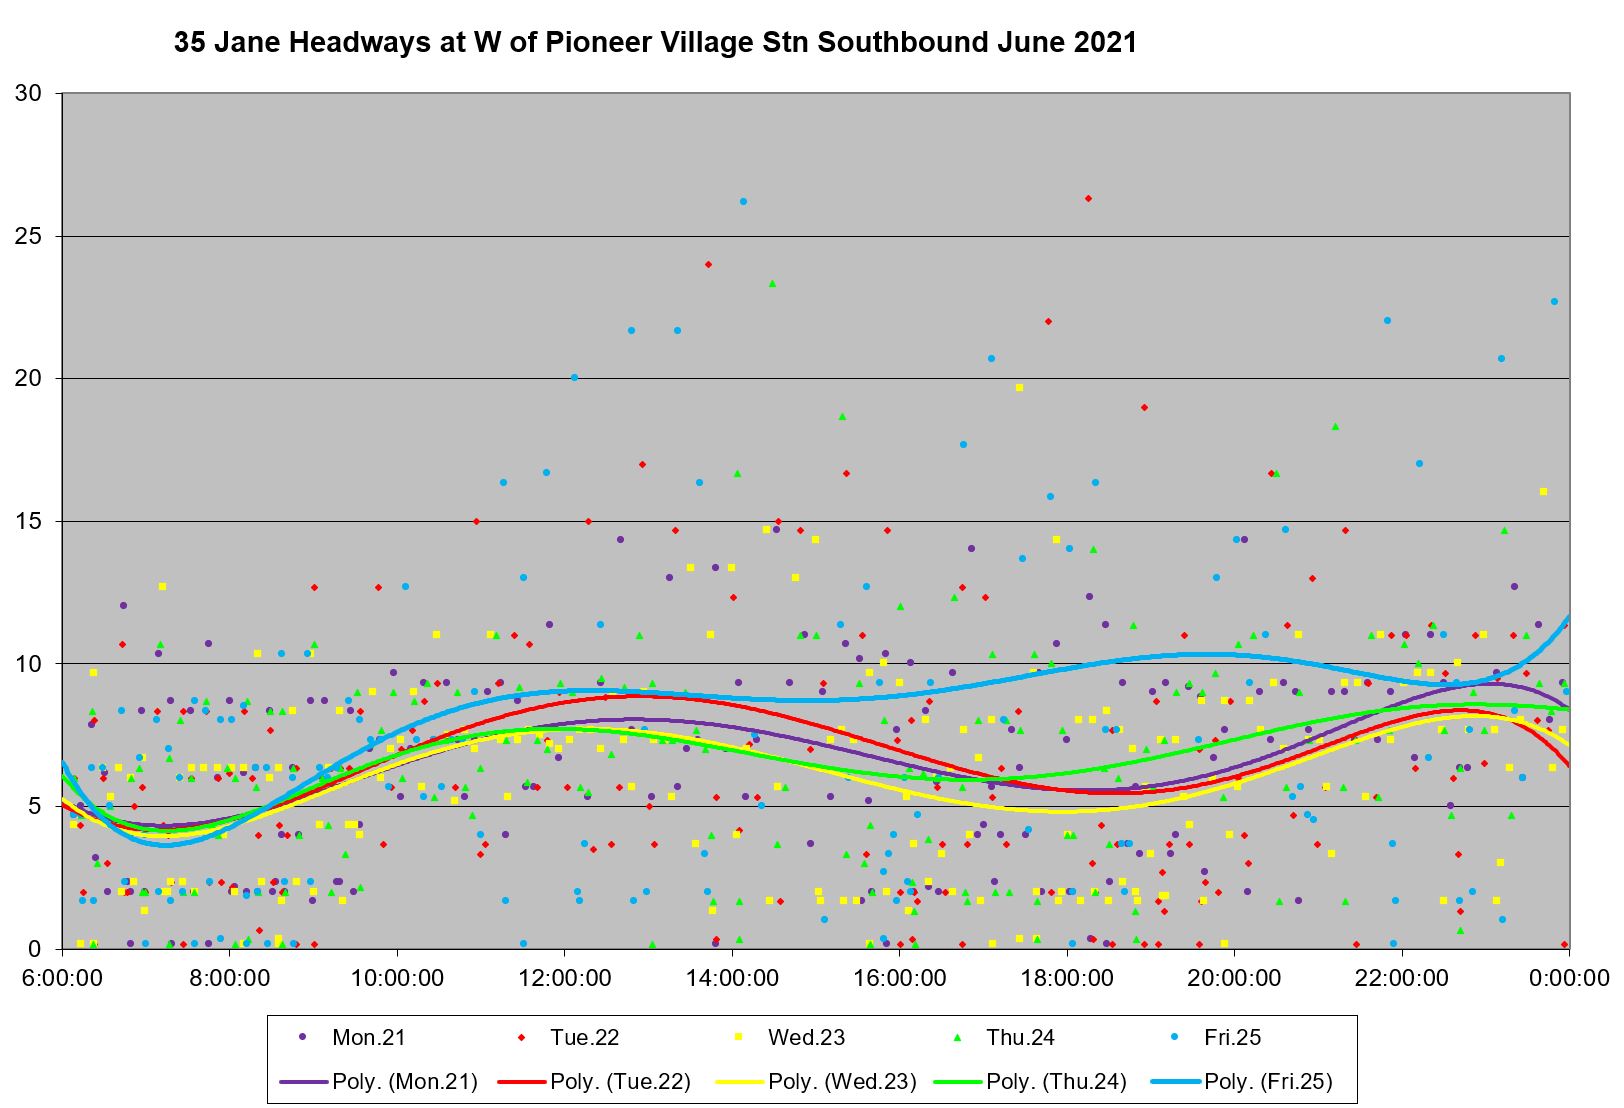
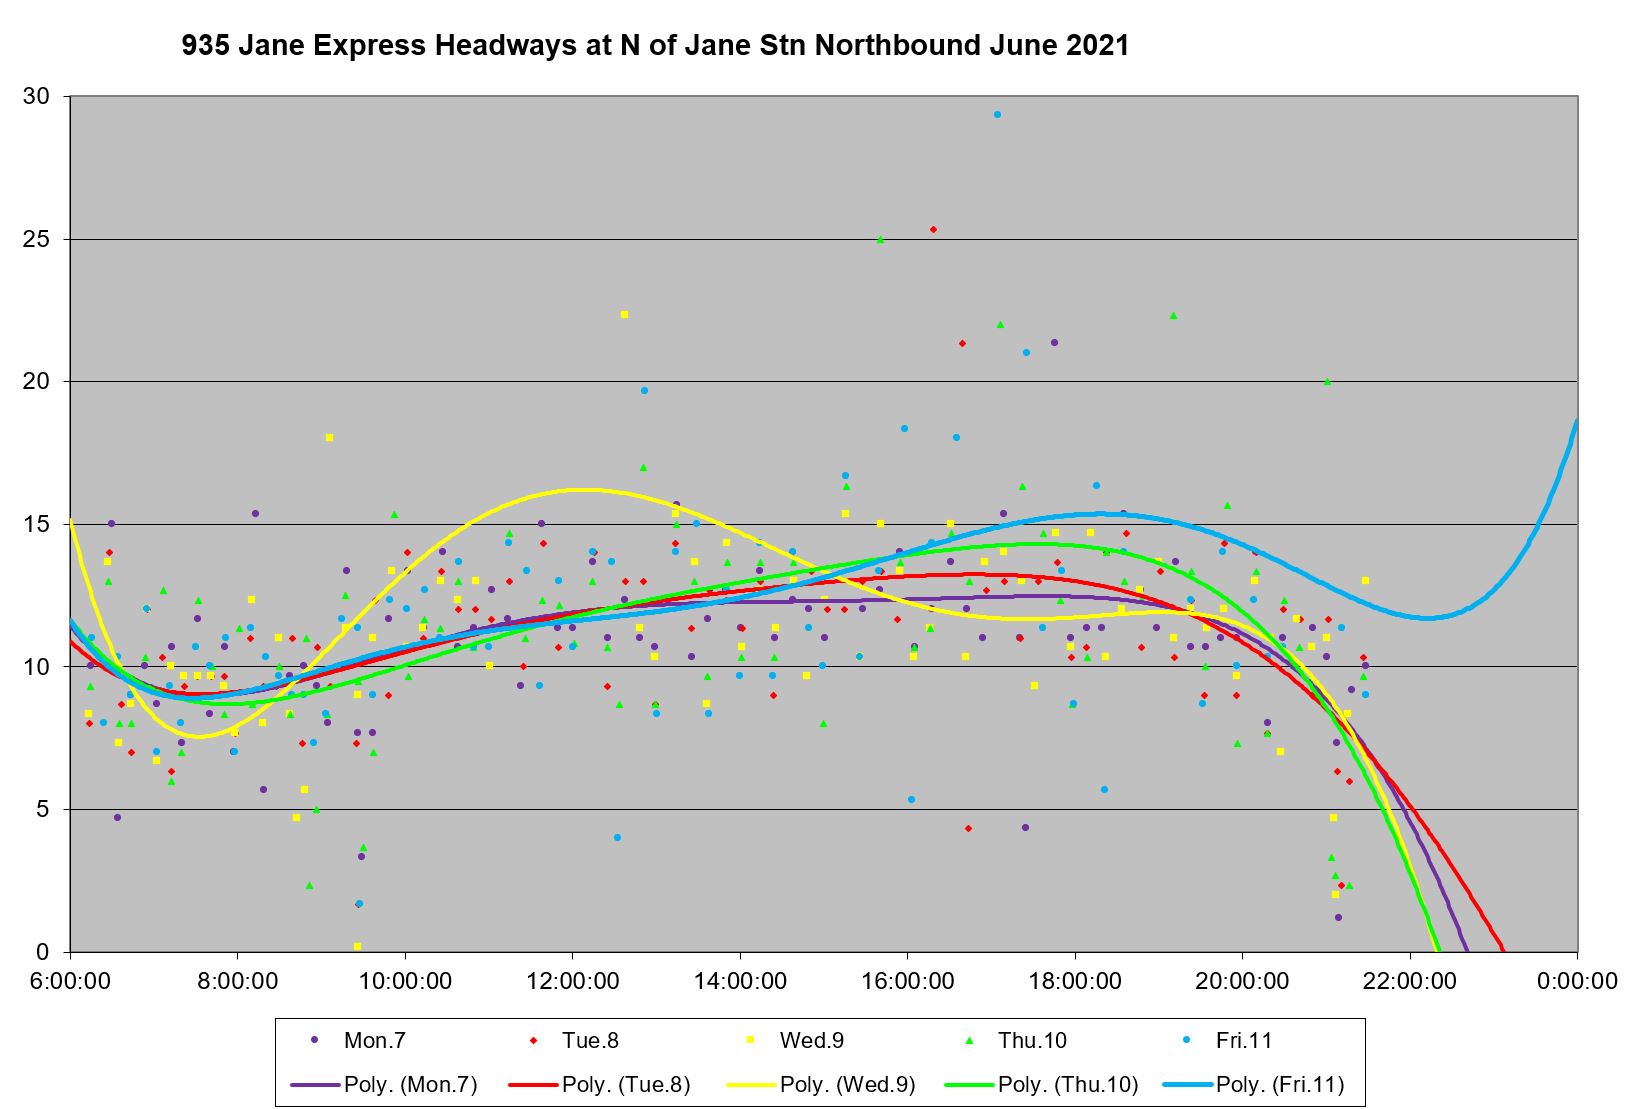
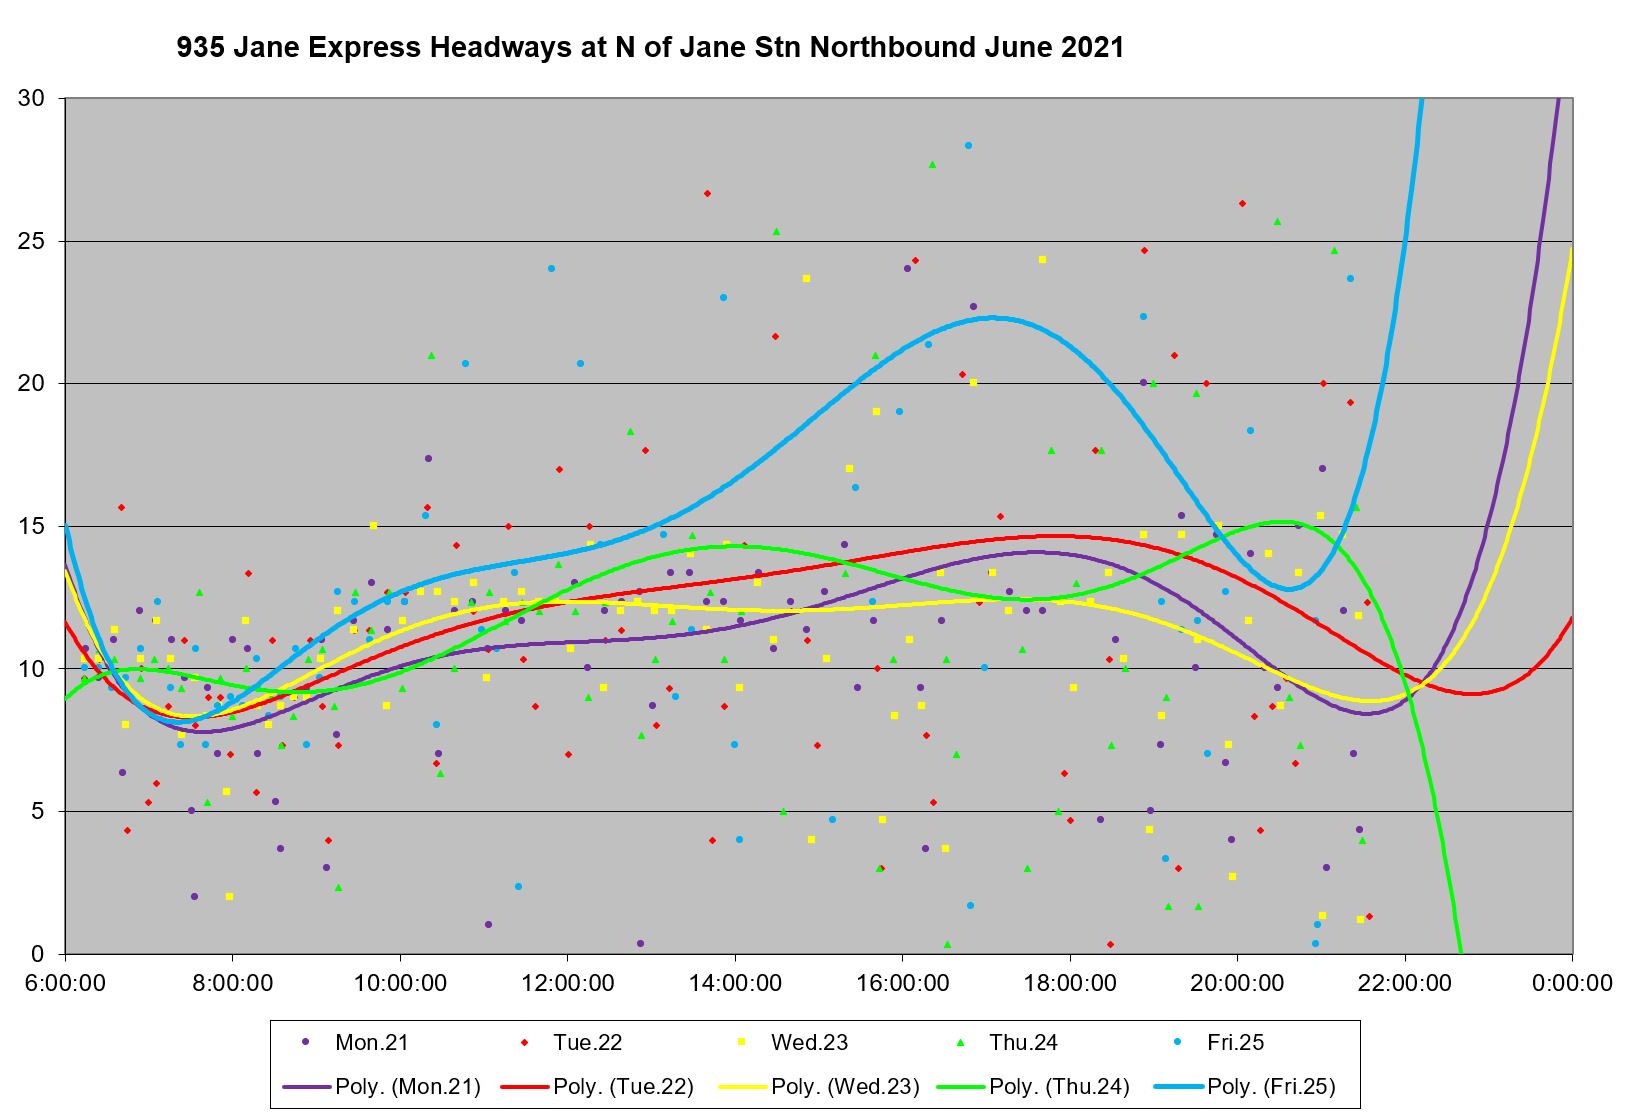
Headways leaving Jane Station have a wide range of values from midday onward, and the situation is worse in week 4 than in week 2. Each dot on the charts represents one bus and its headway. Particularly troubling is the wide range of headways in the evening when the scheduled service is less frequent and there is less congestion to disrupt travel.
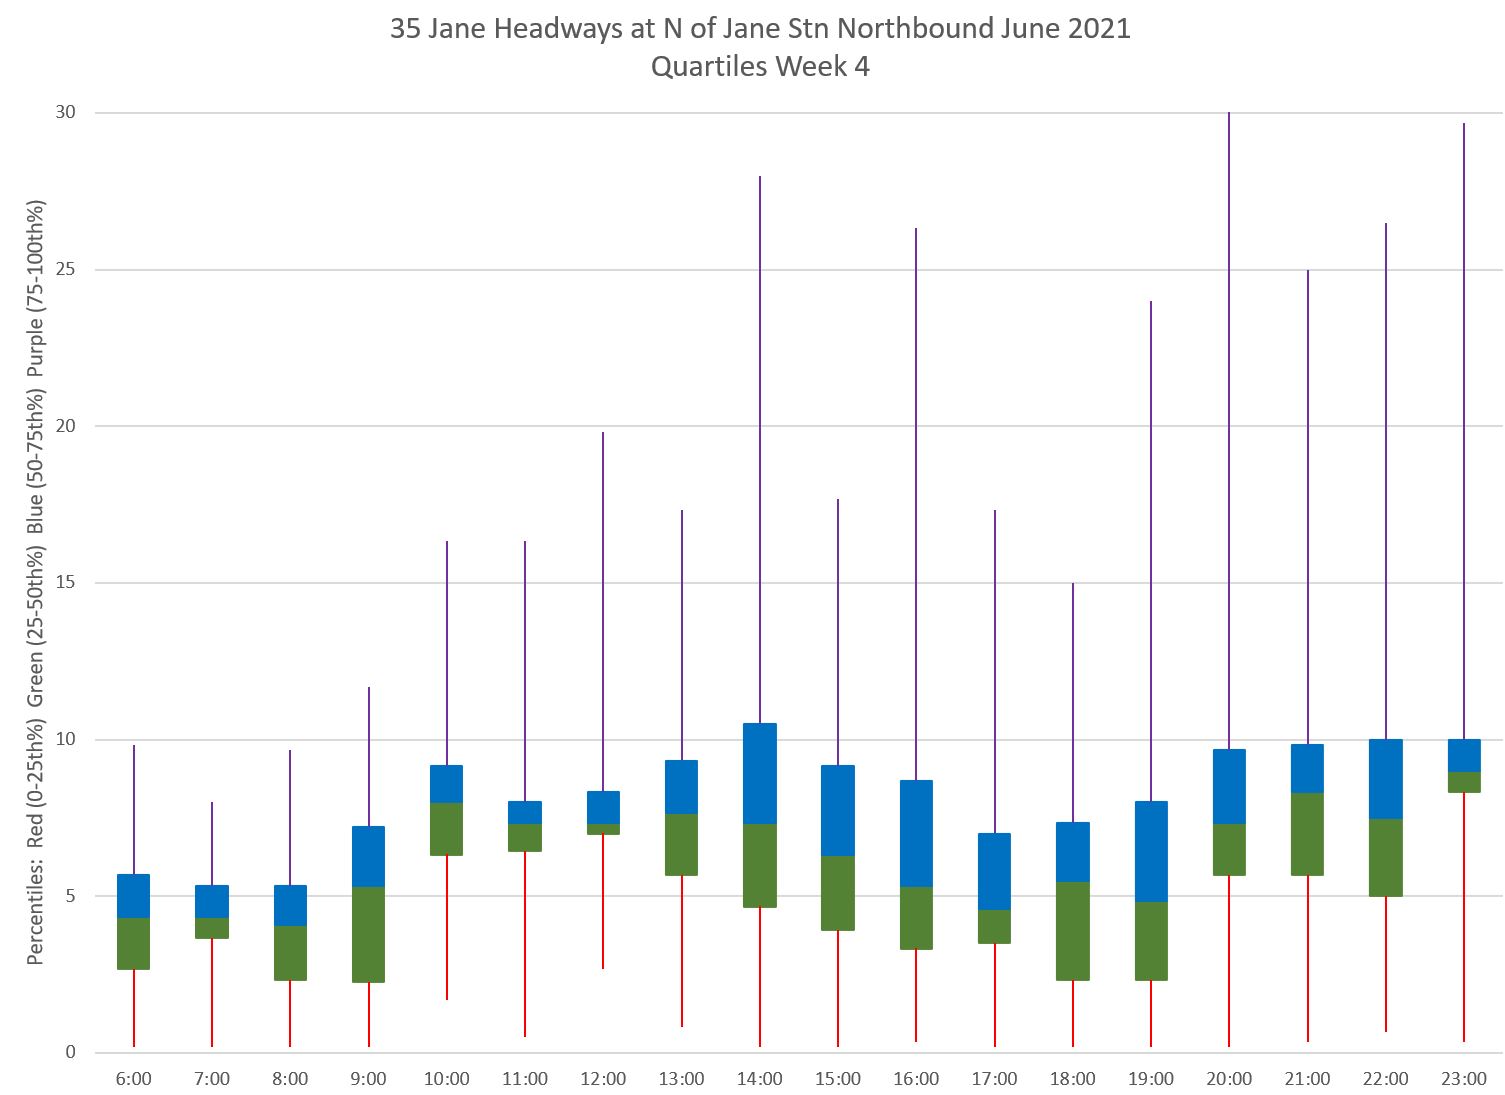
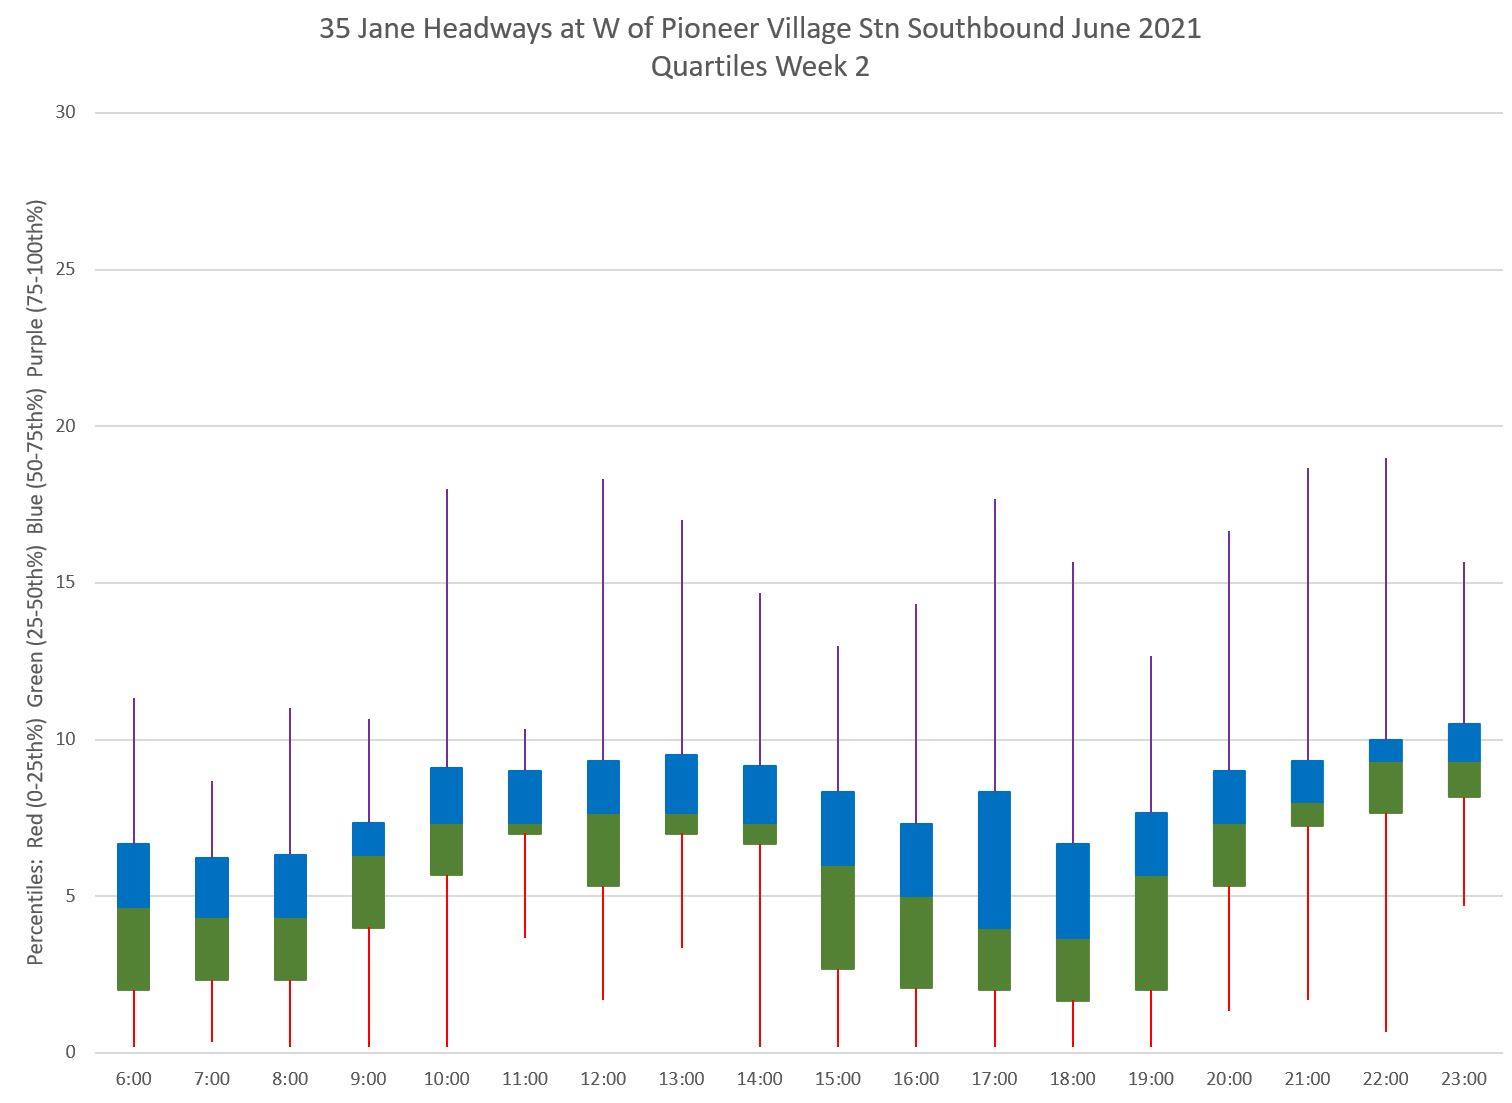
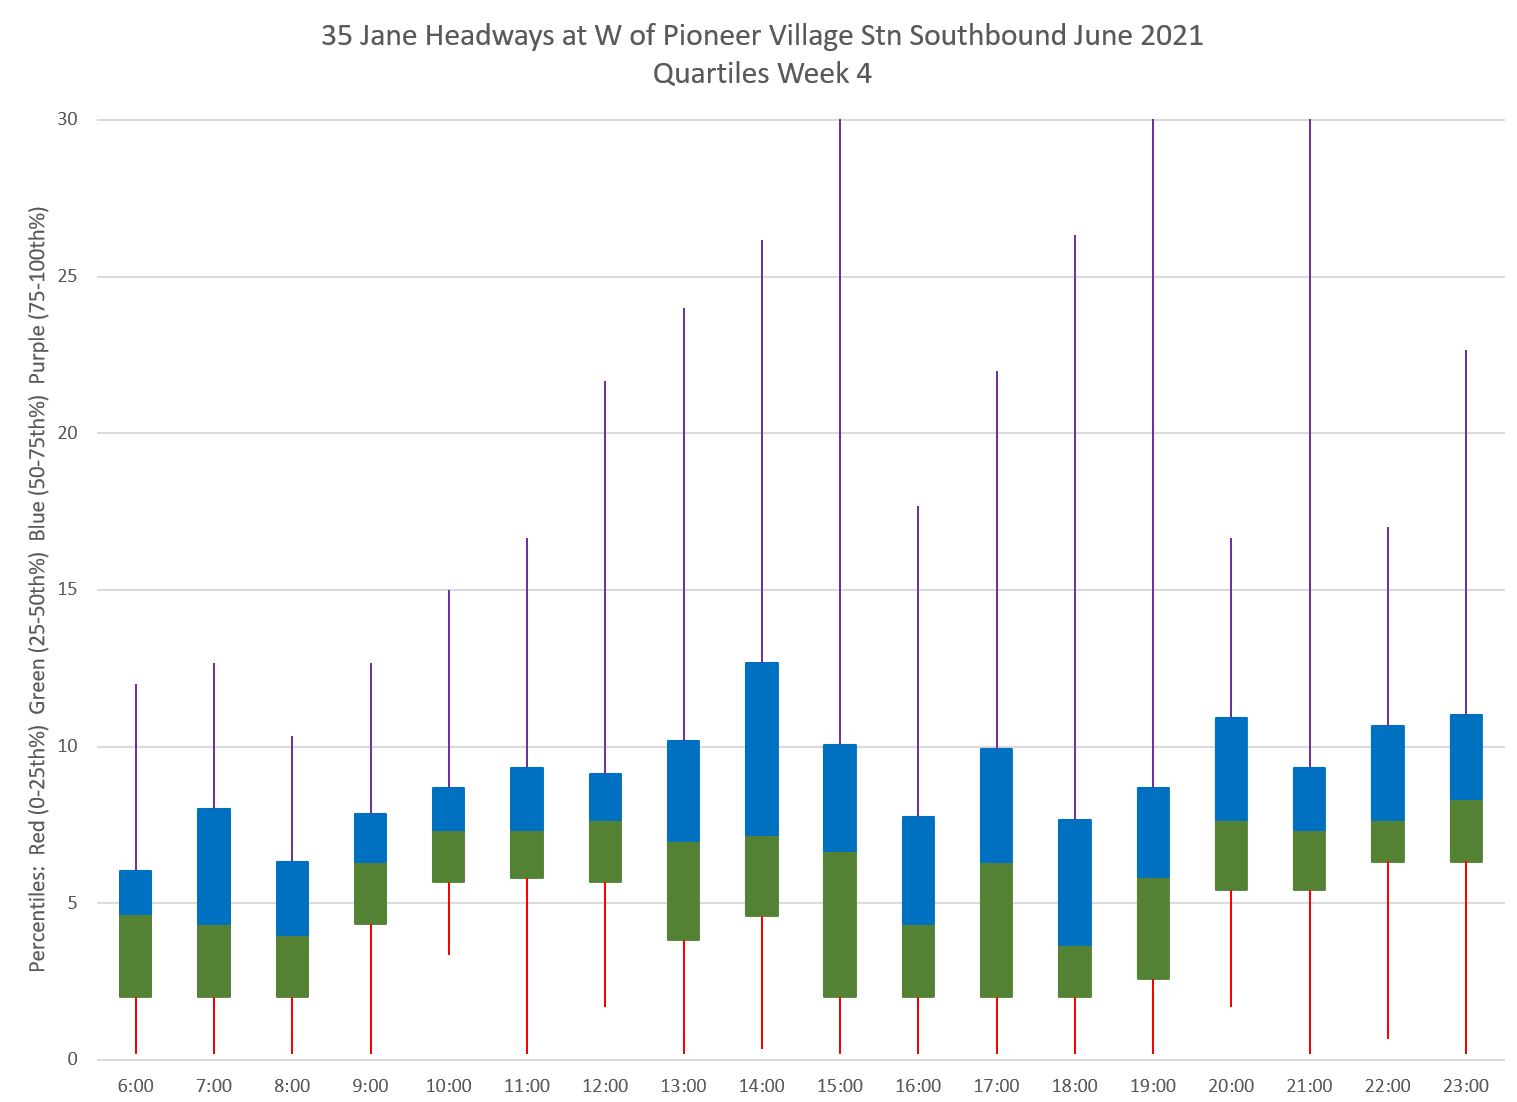
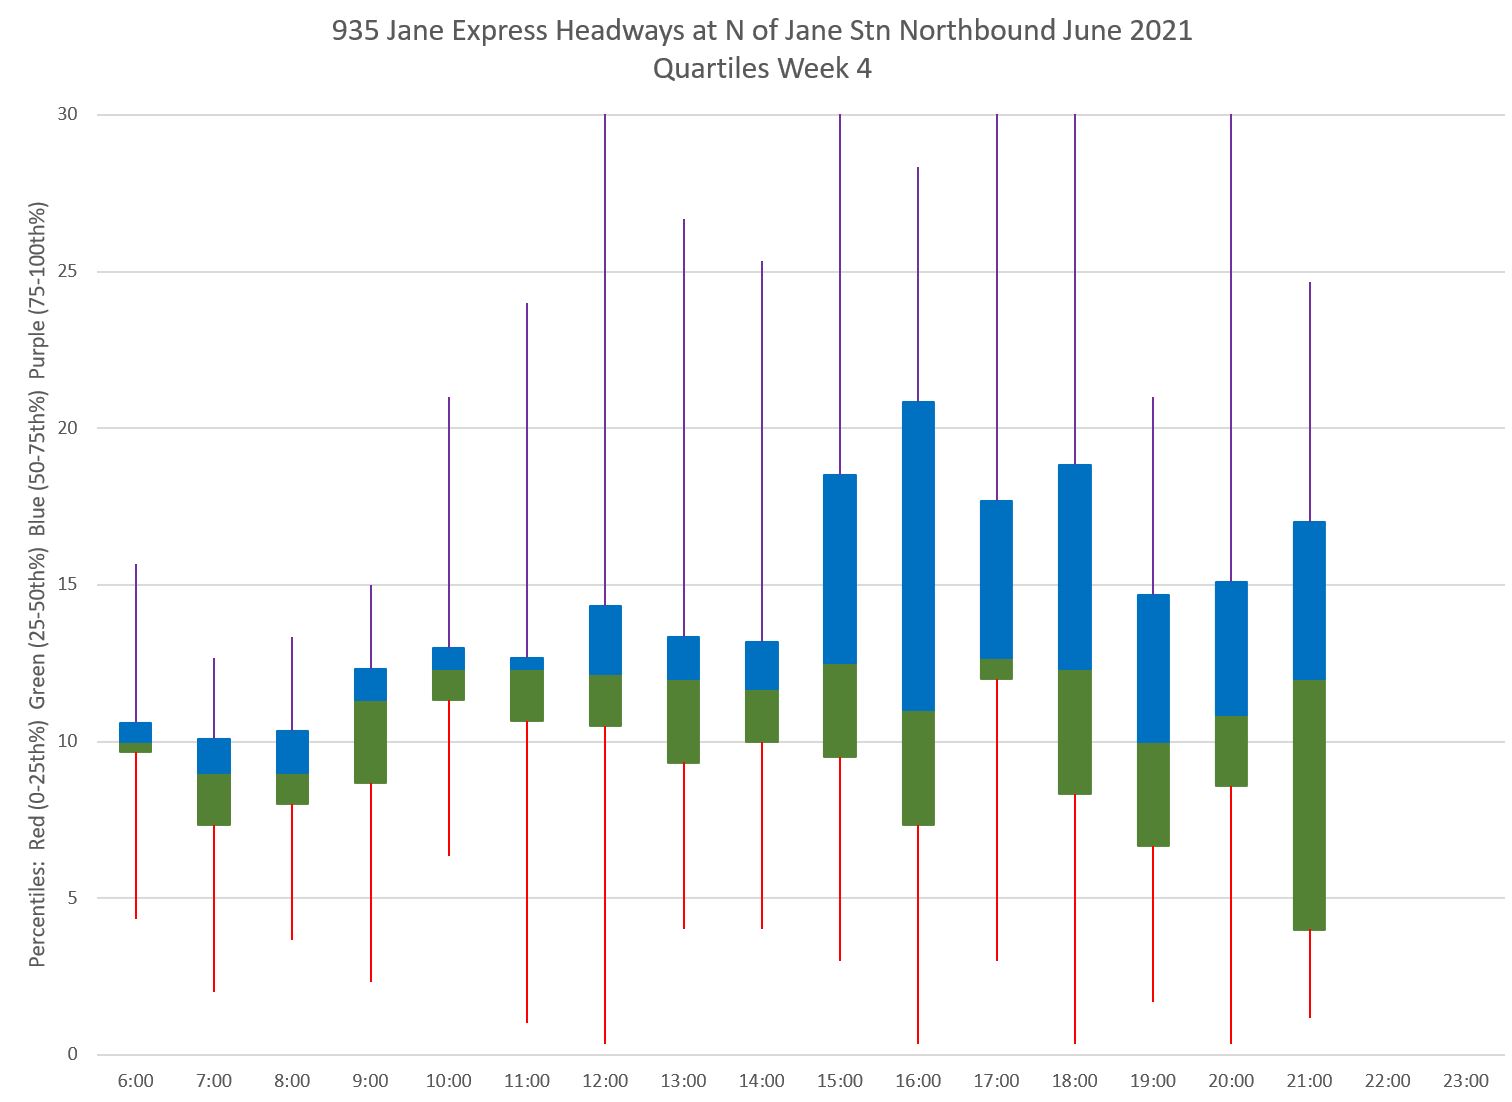
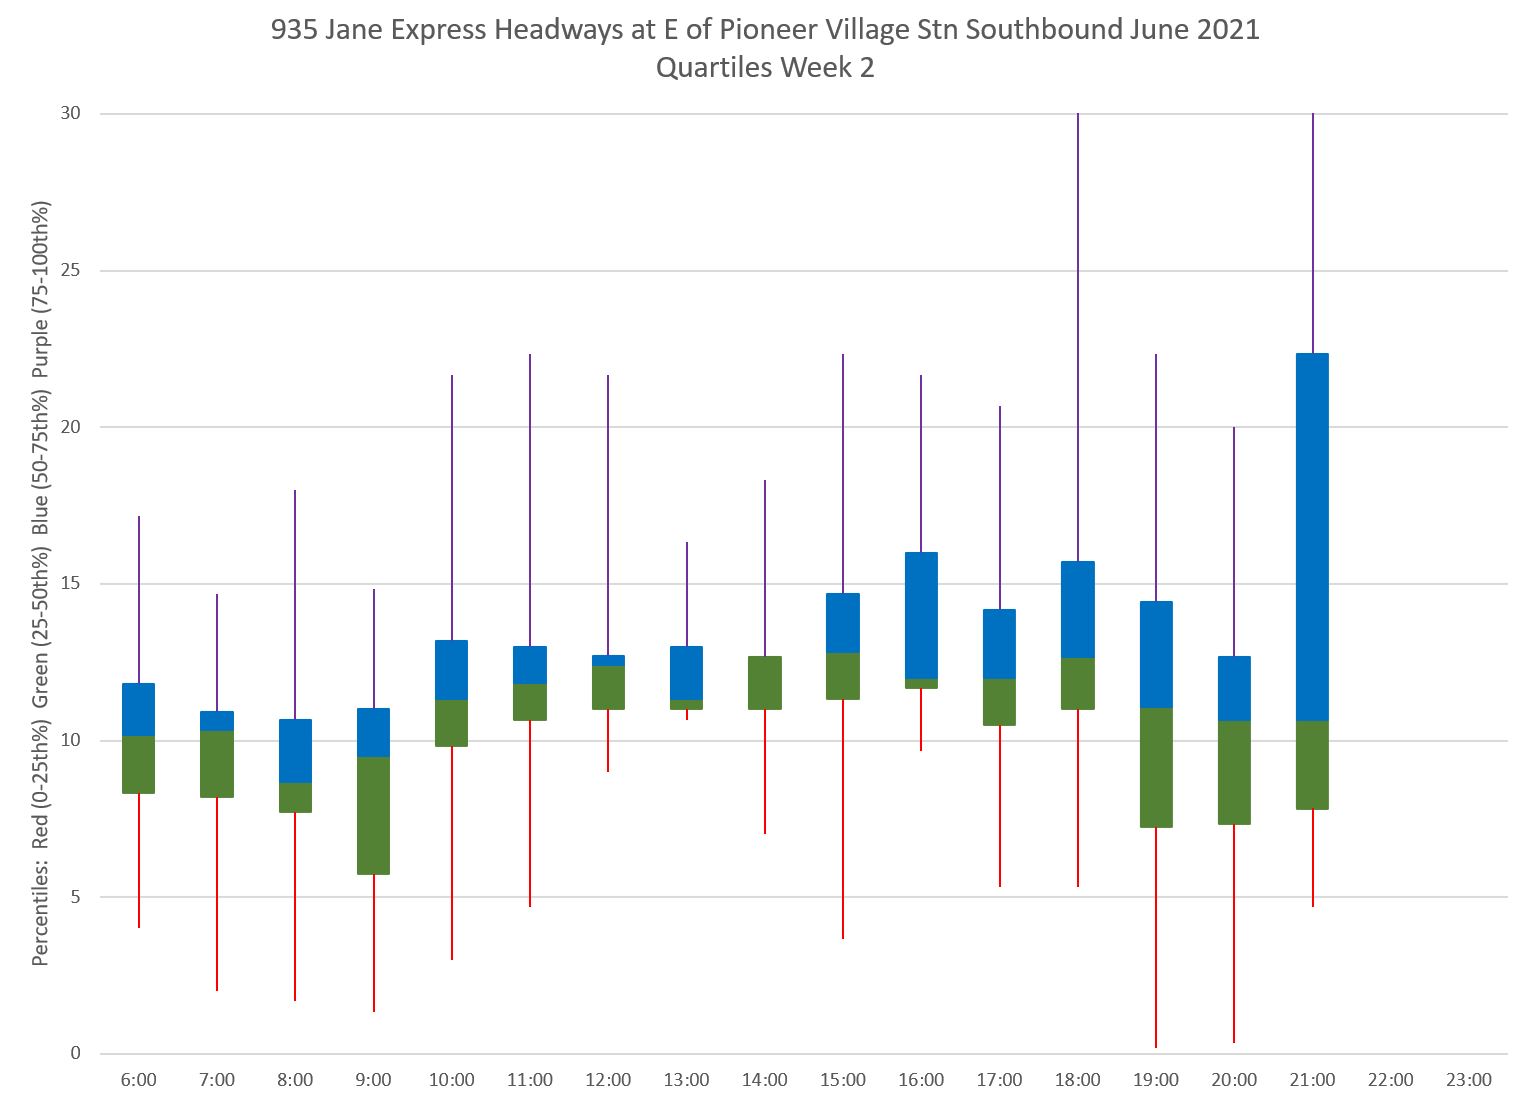
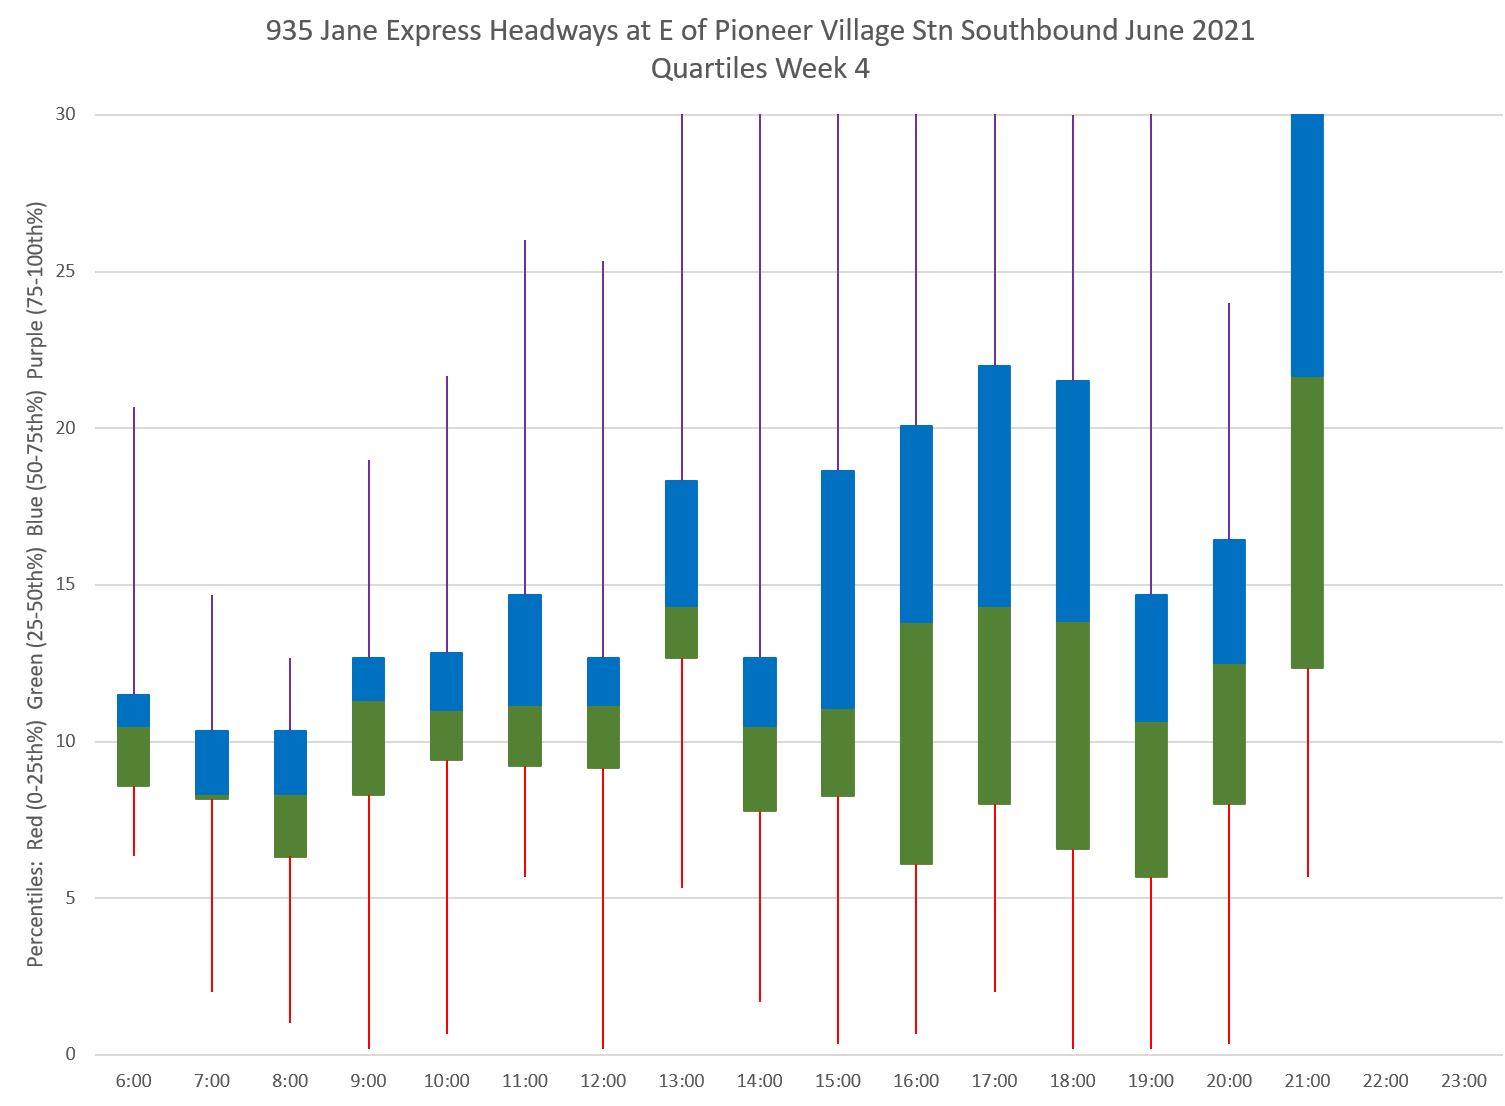
The quartile charts summarize the service by hour showing the range of headways. The central green and blue box represents half of the service while the tails above and below show the lowest and highest quartiles. Again the wider dispersion for week 4 values shows up notably in higher maximum values.

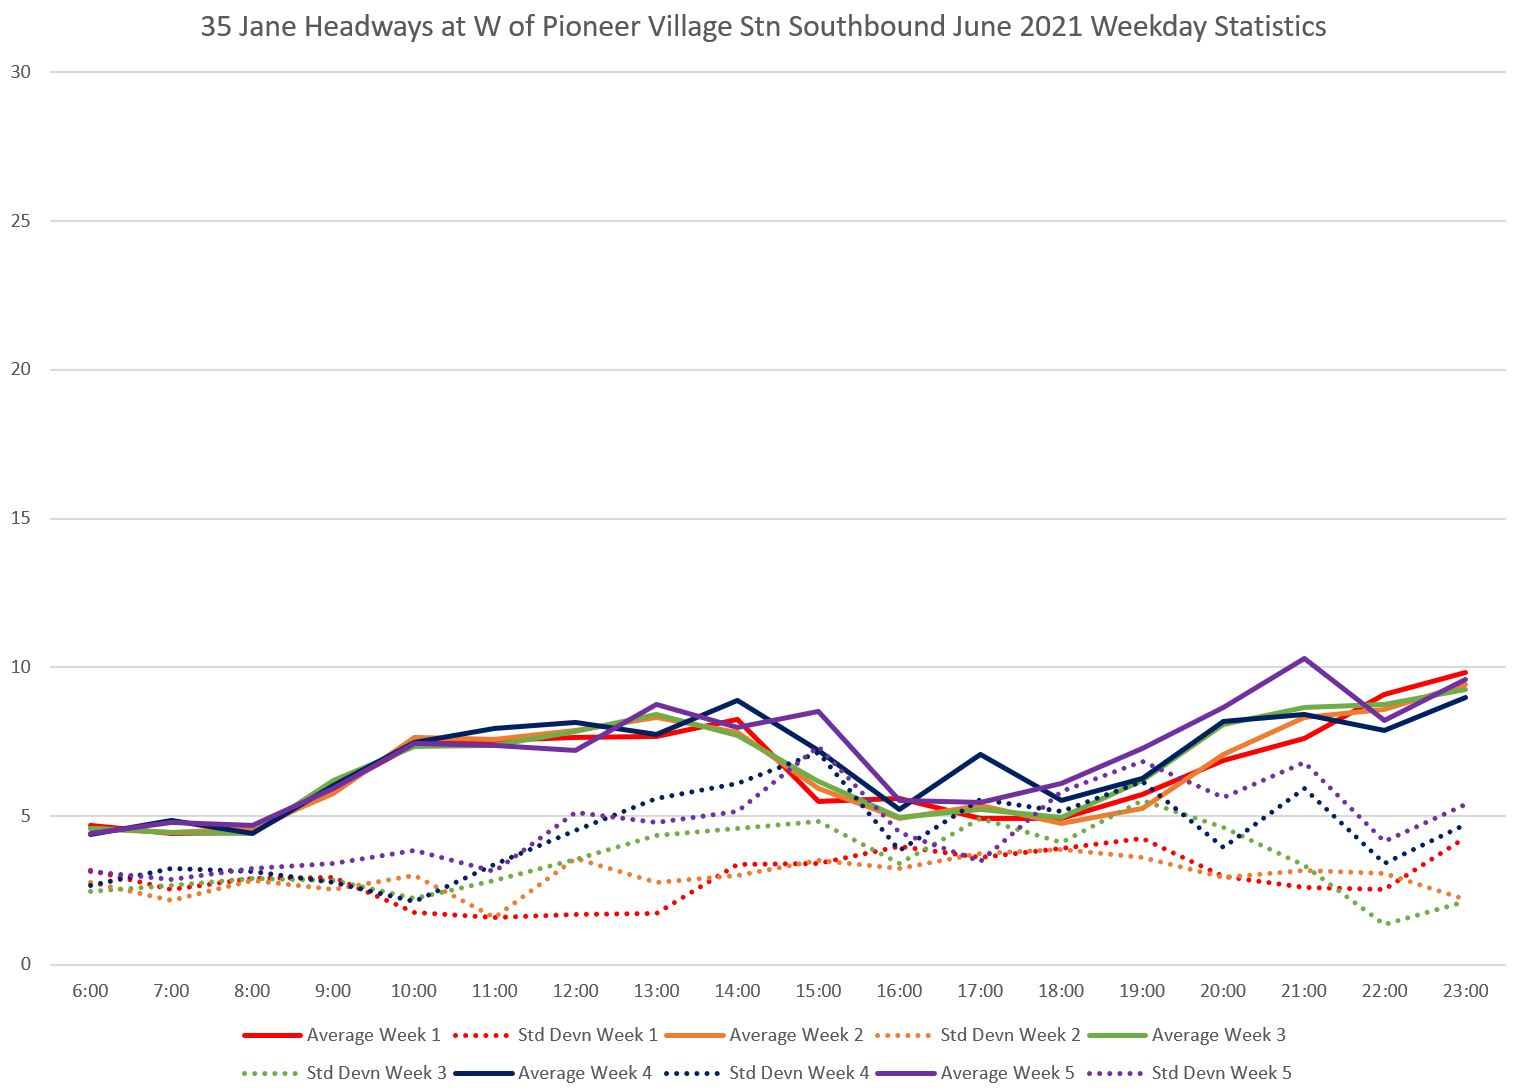
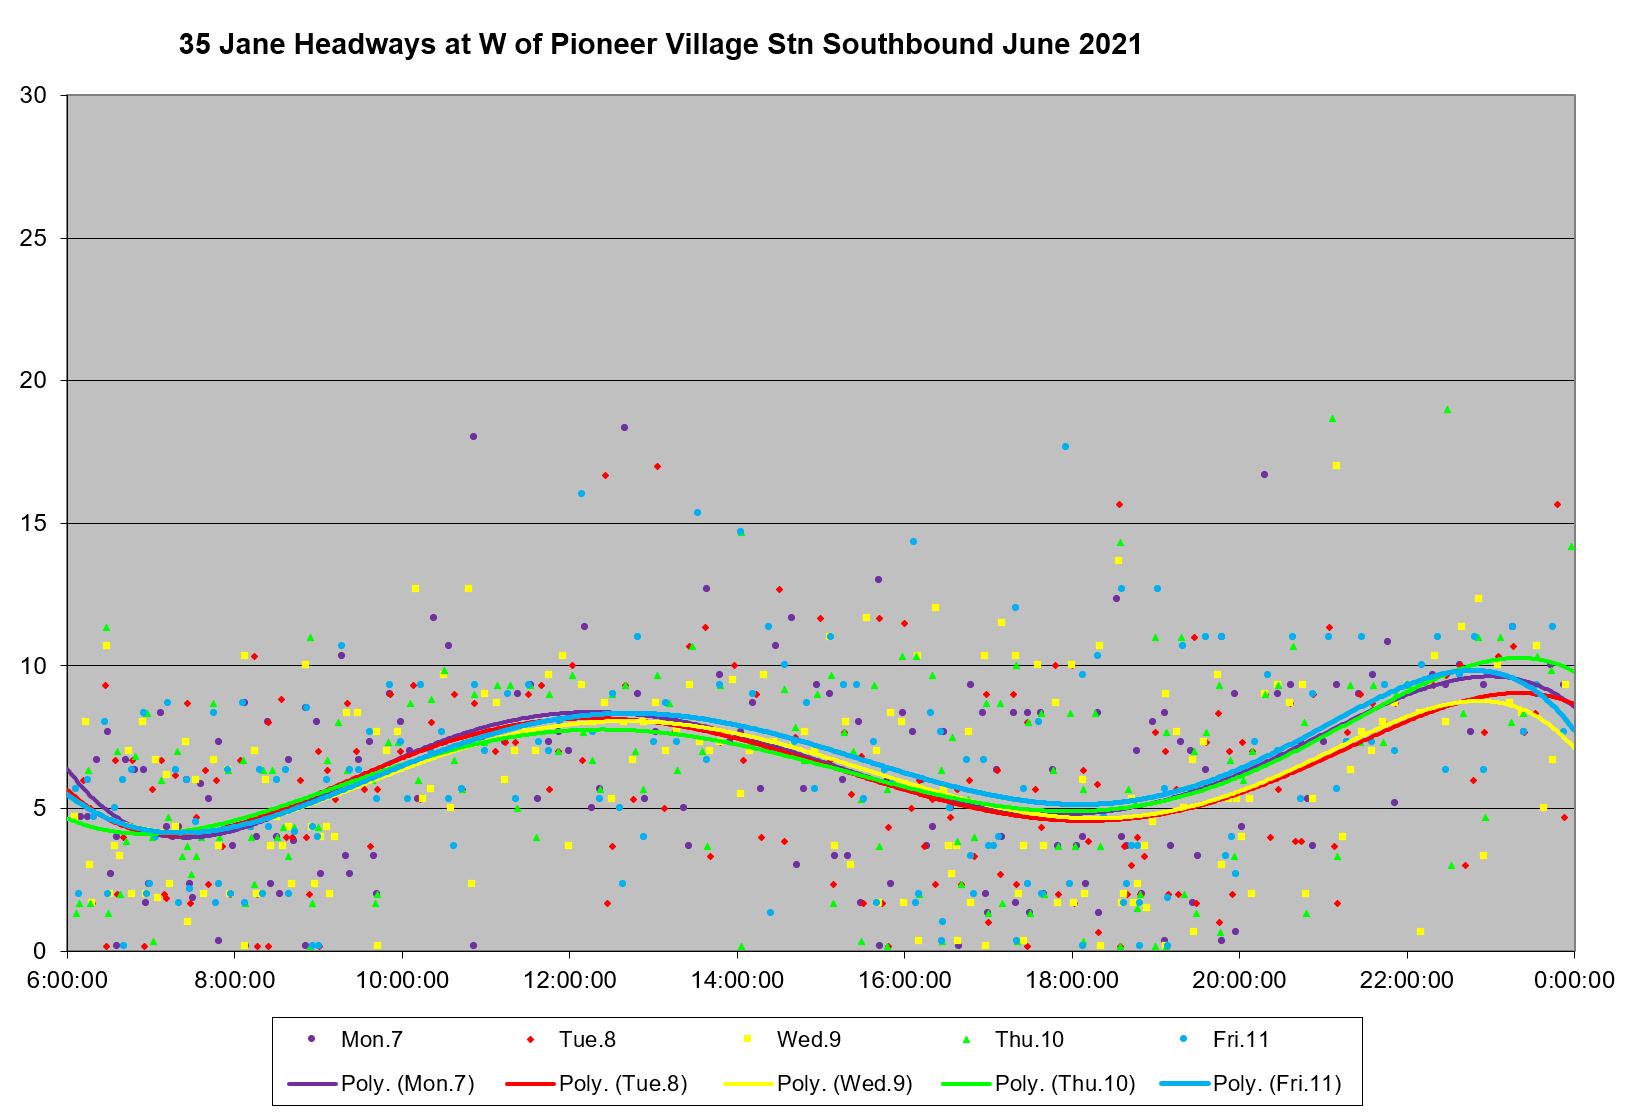
Local Service Southbound from Pioneer Village Station
The situation at Pioneer Village Station is similar to what was shown above for the south end of the route.
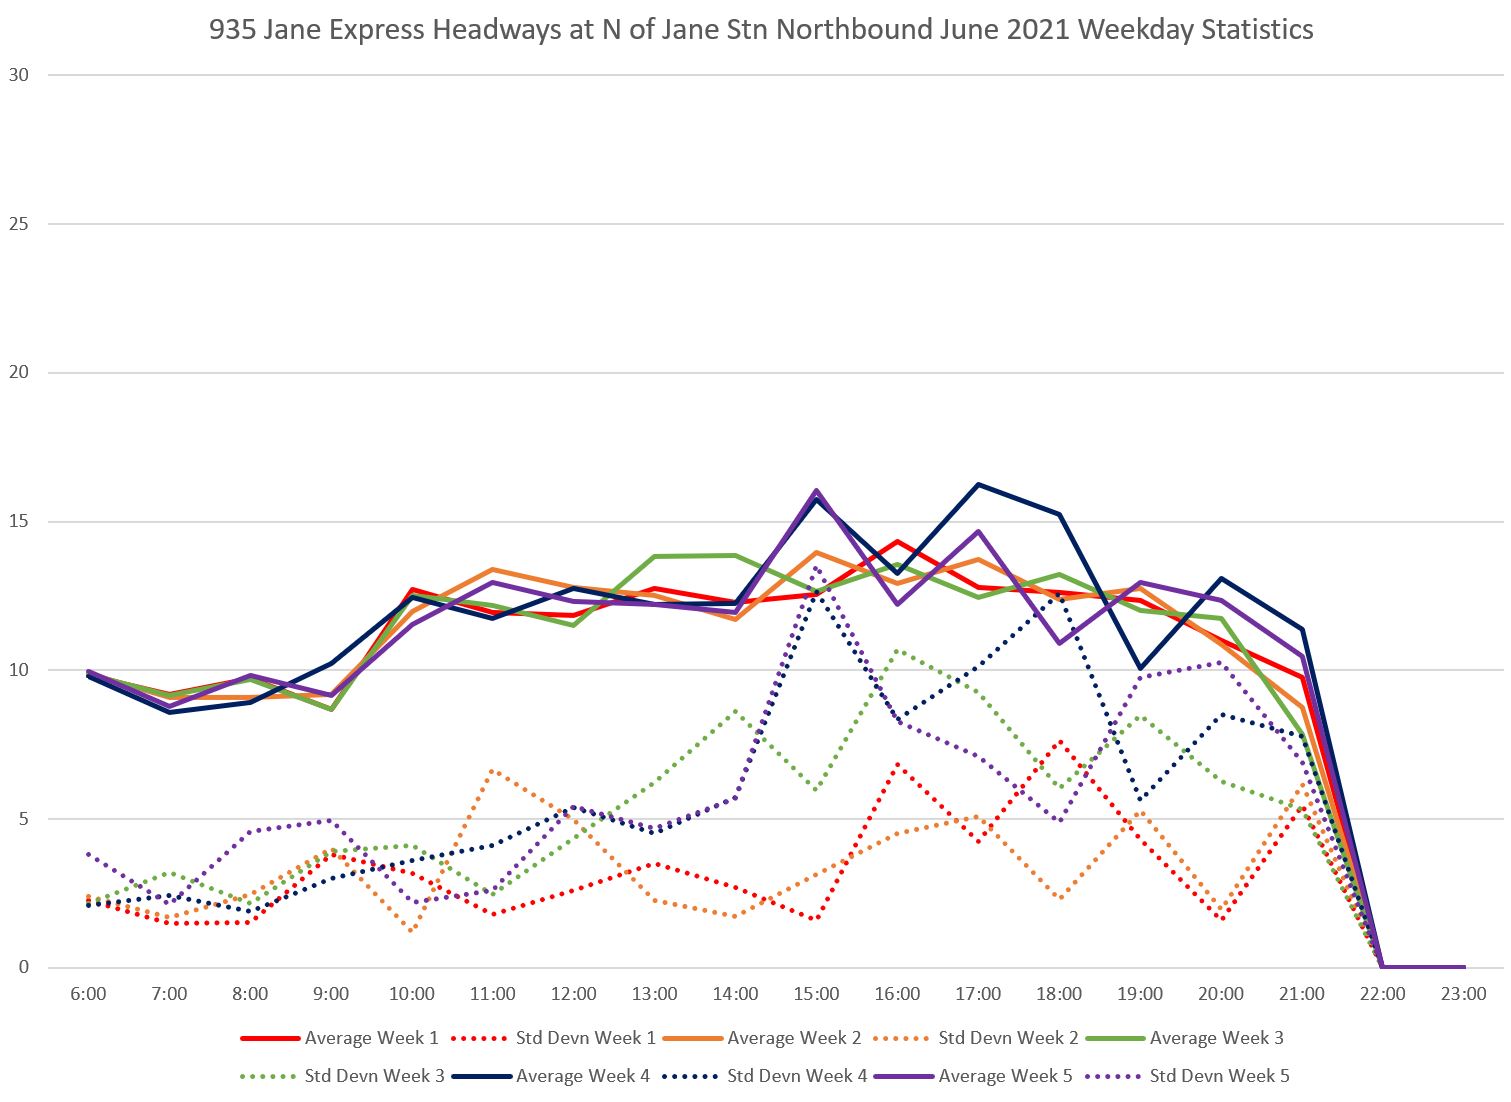
Express Service Northbound from Jane Station
As with the local service, the reliability deteriorates markedly in the afternoon especially later in the month. With a scheduled headway of 10 minutes and more, some of these variations represent very wide gaps in service to the extent that the unreliability wait for an express bus can undo the travel time benefit of limited stop service.
The quartile charts show quite strikingly the difference between service in weeks 2 and 4 with a much wider range of headways in week 4.

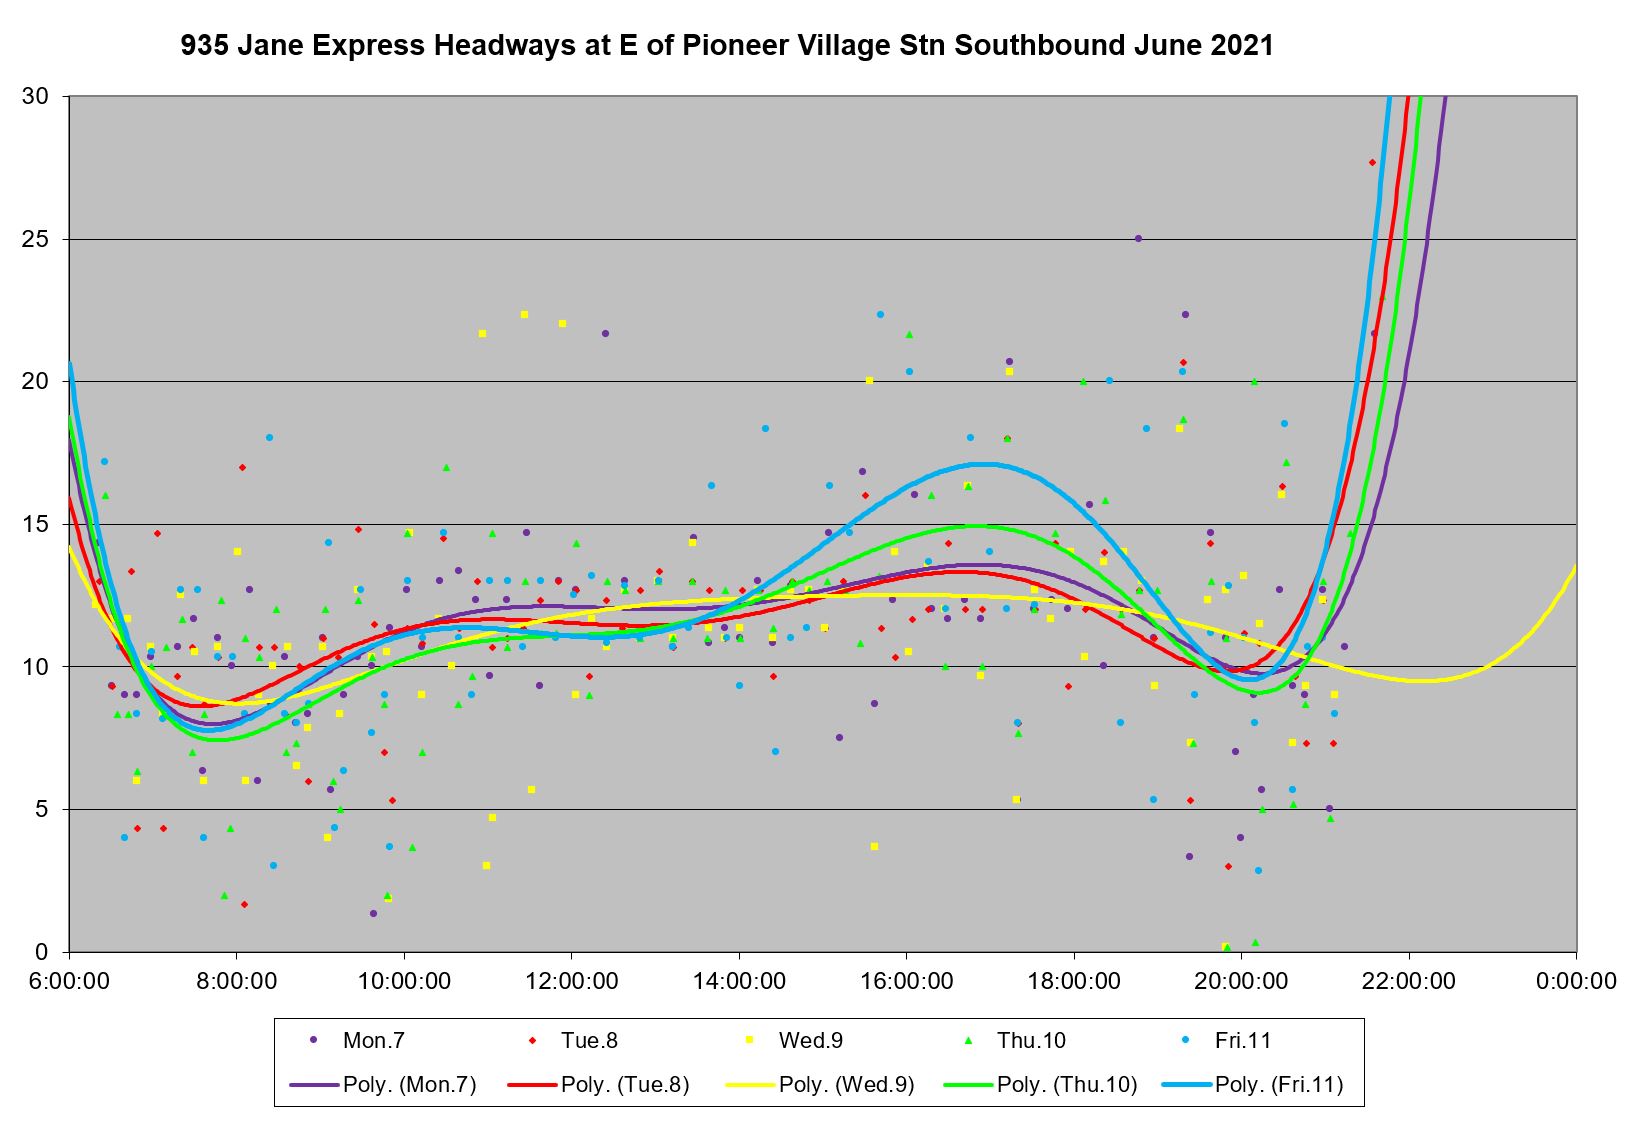
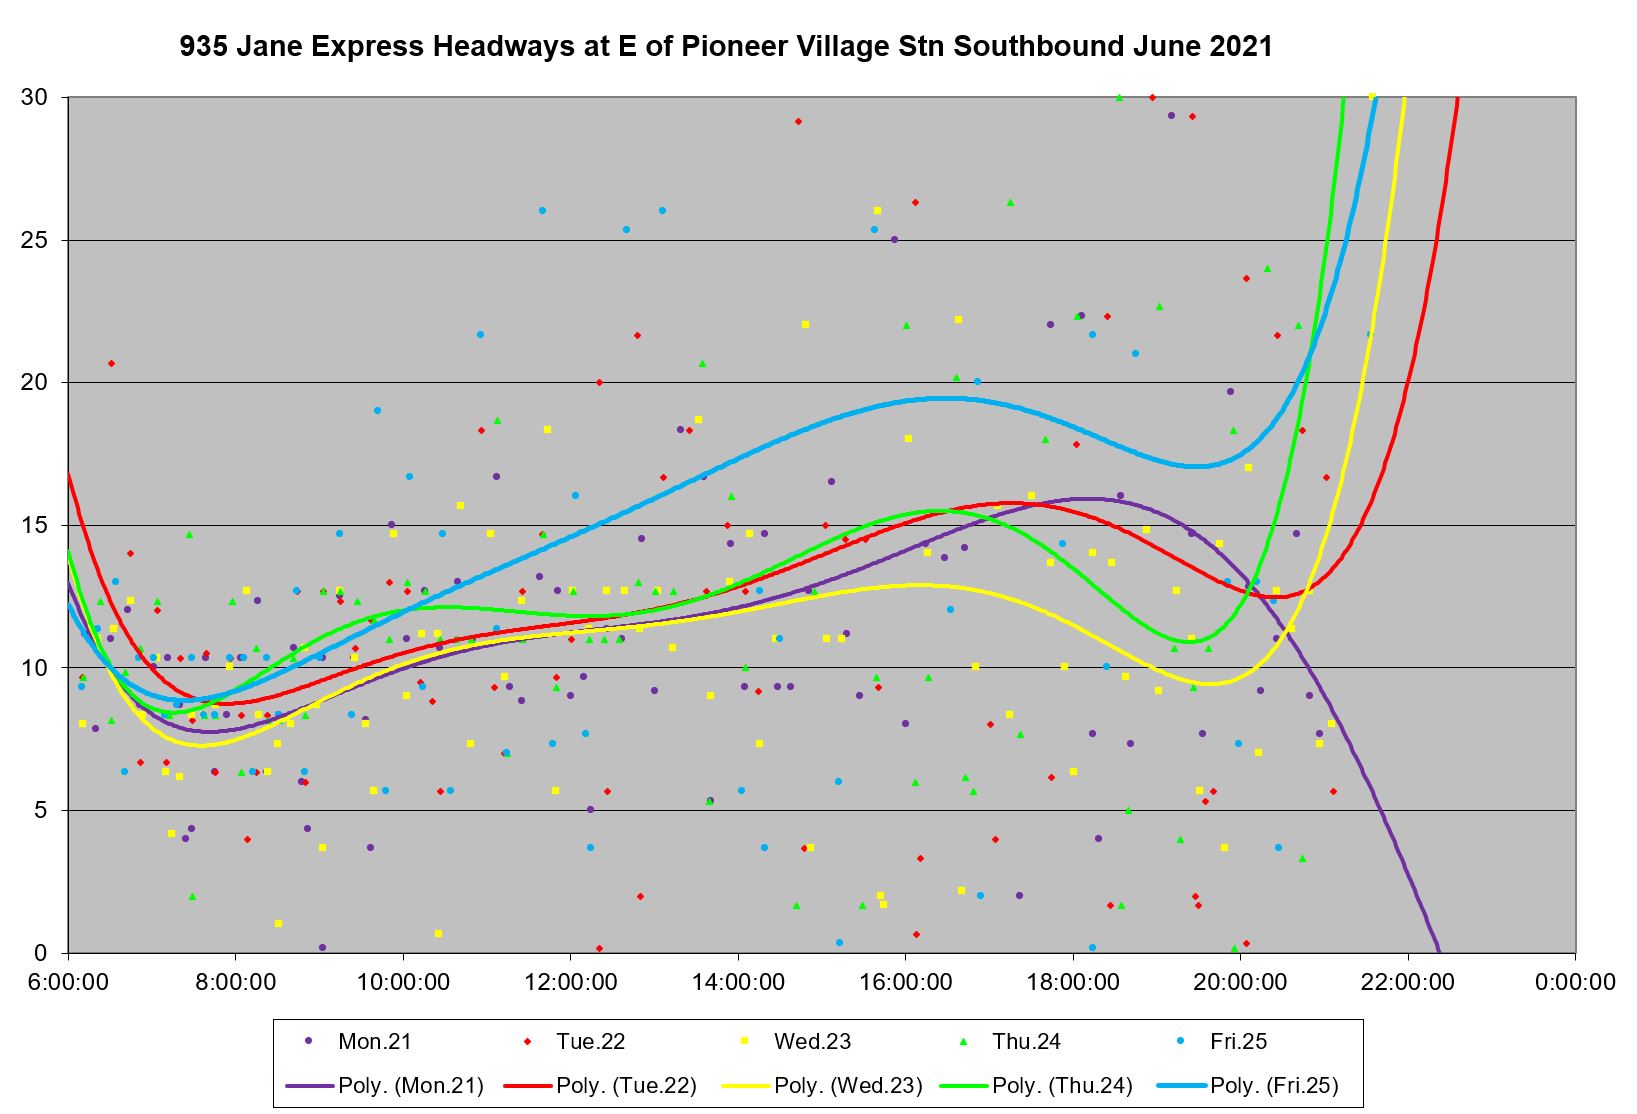
Express Service Southbound from Pioneer Village Station
Service from Pioneer Village Station mirrors the northbound data above with a rise in irregularity from midday onward and particularly later in the month.
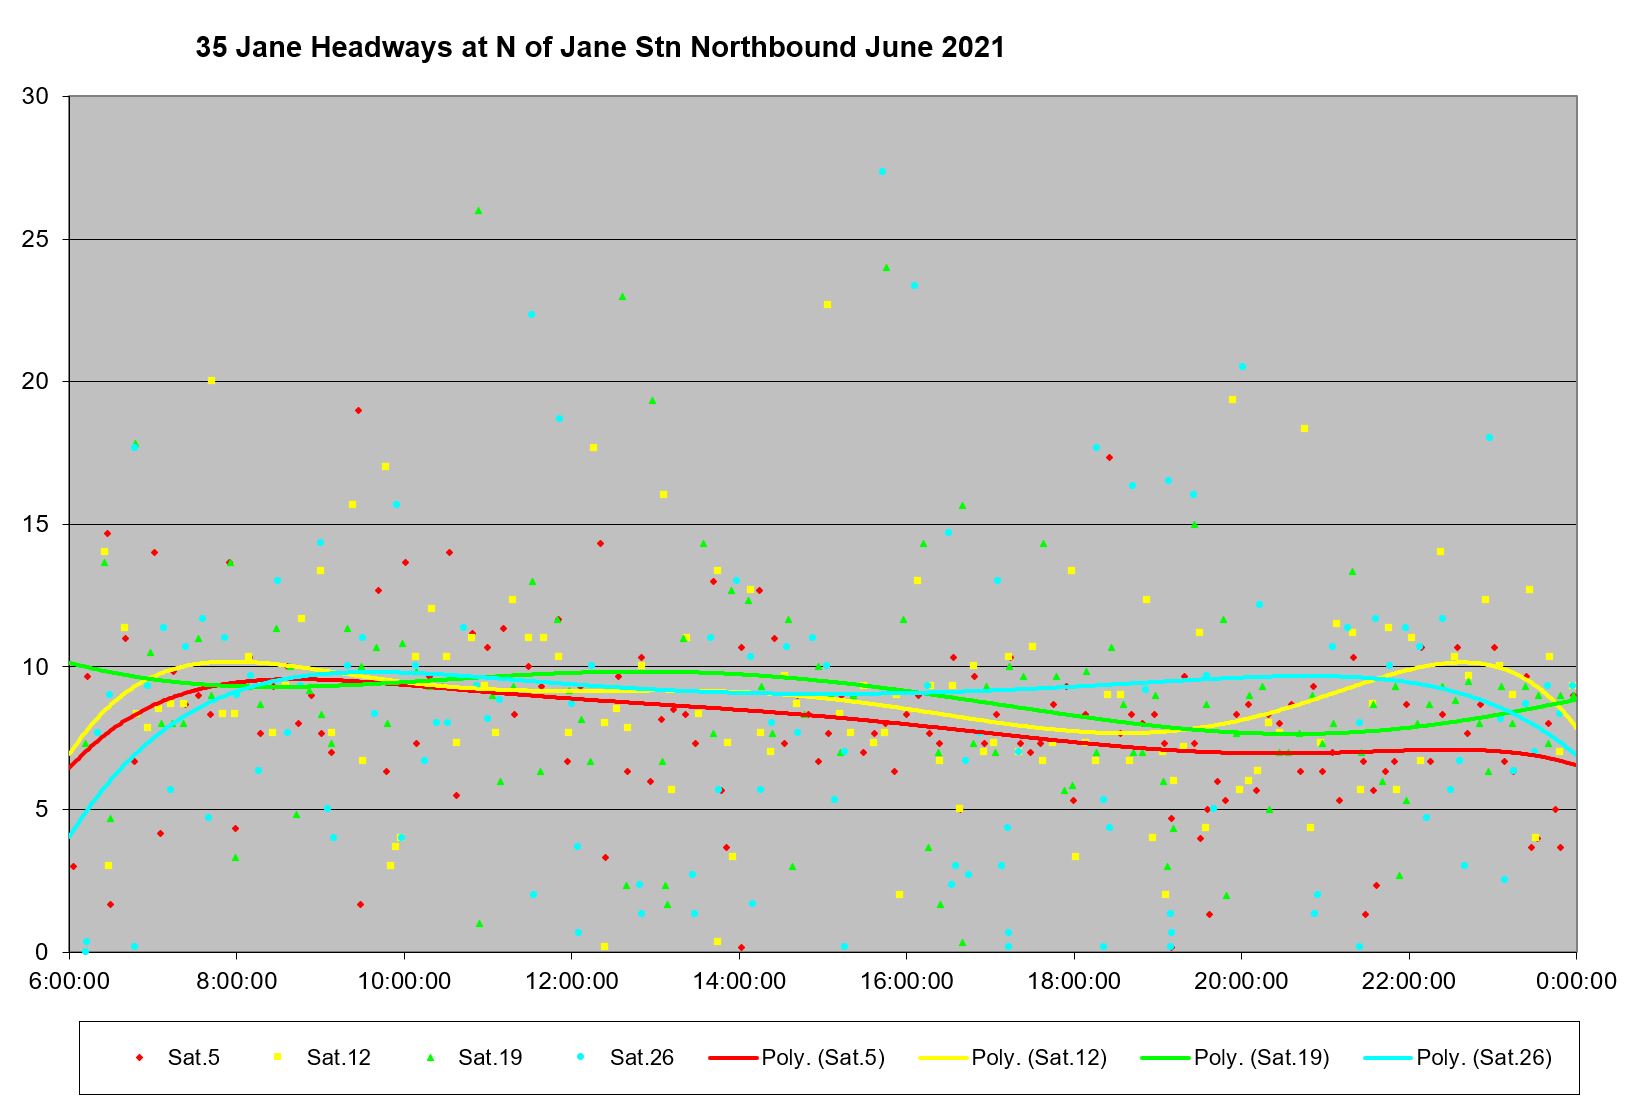
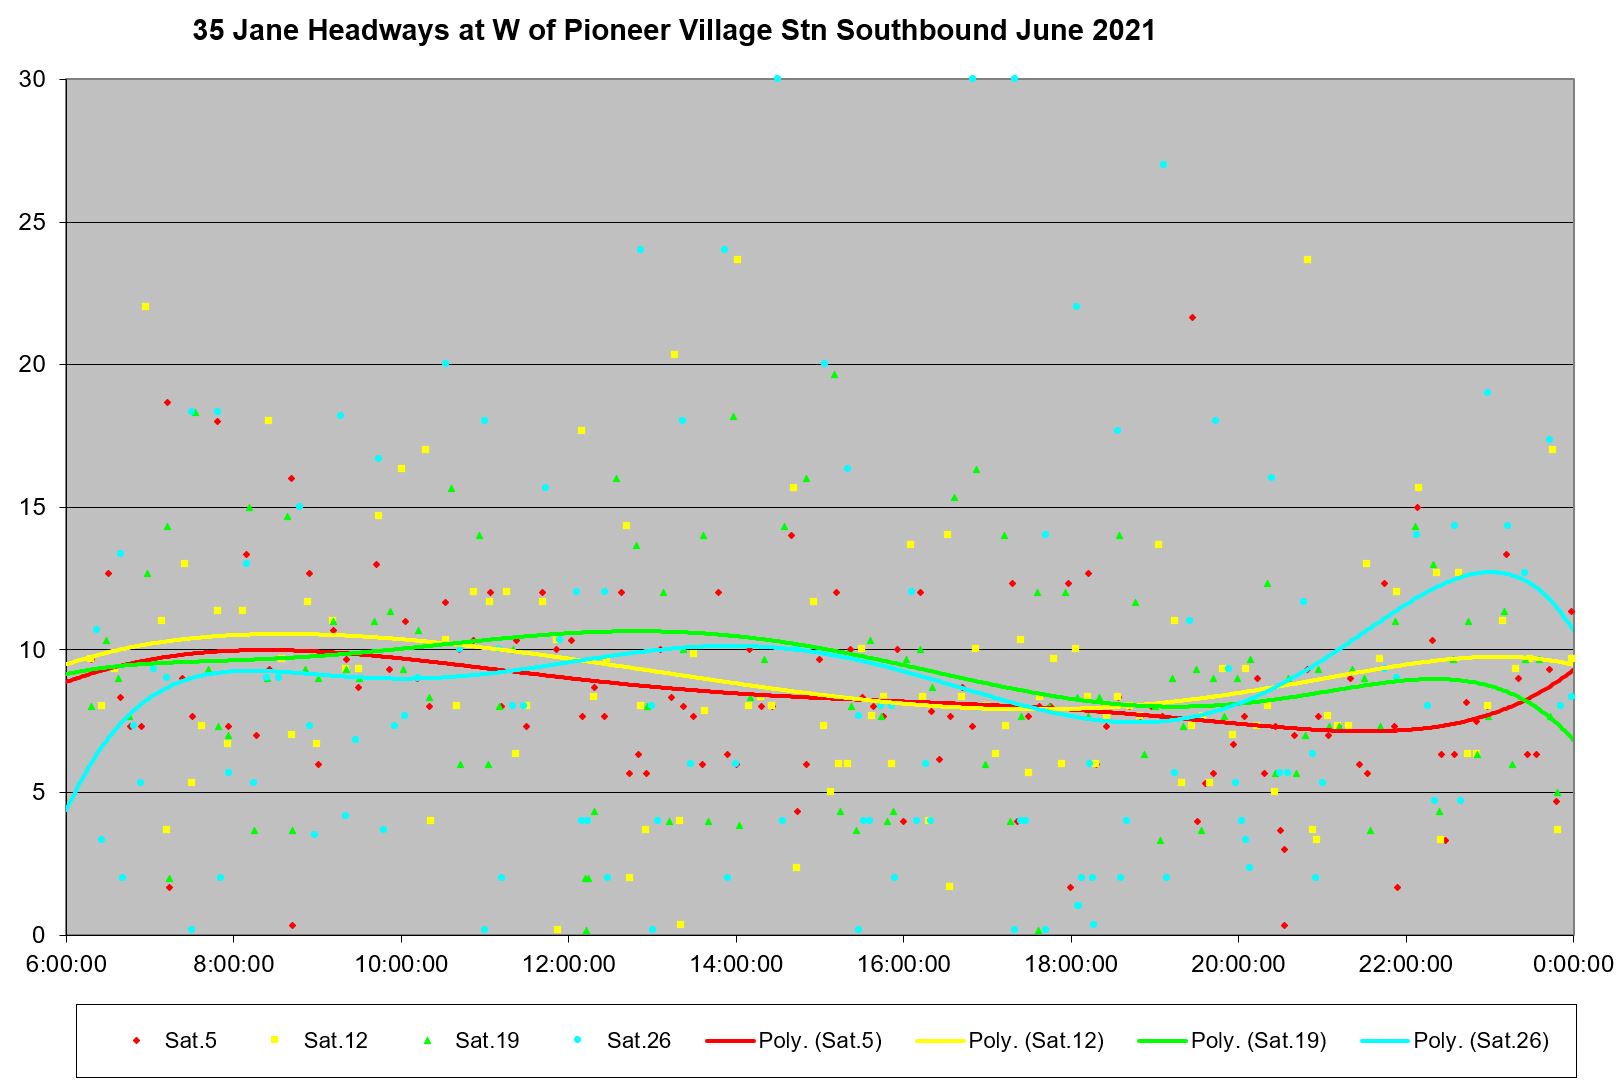
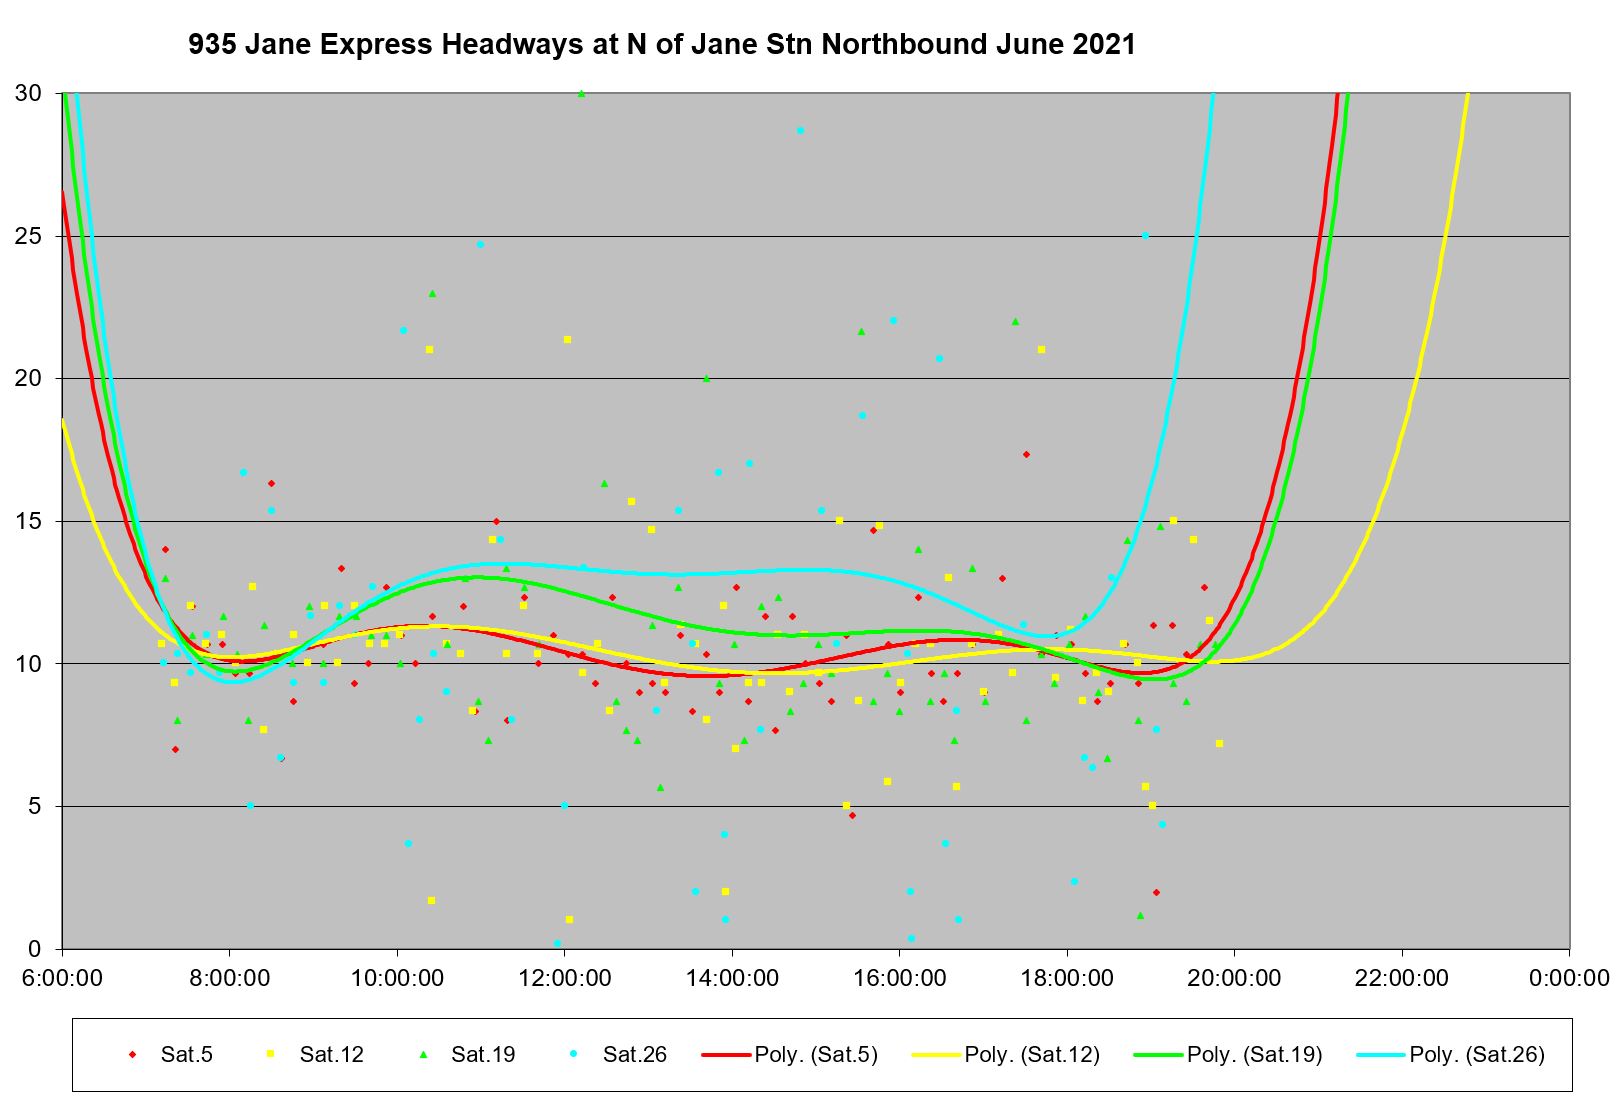
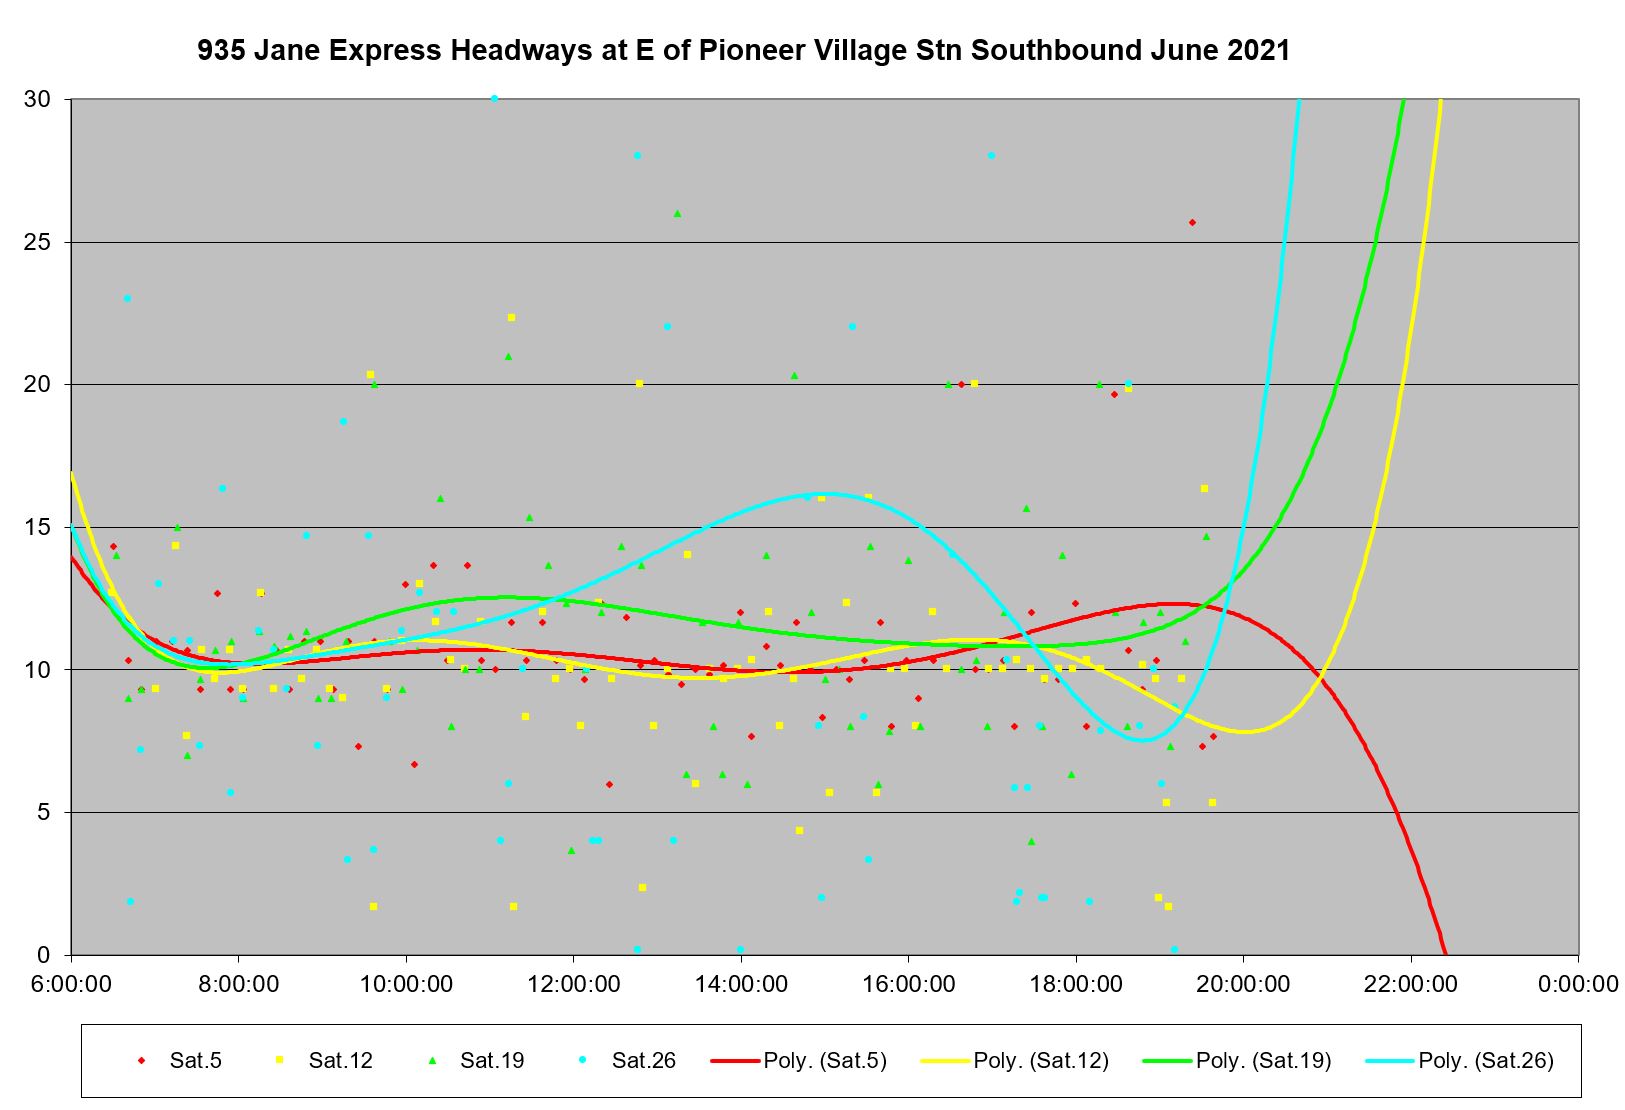
Saturday Service
Saturday service on the local and express routes suffers from many of the problems that beset the weekday service. Headways are scattered even on days before construction at Finch began to affect travel times.
Note that only the local 35 Jane schedules were changed on June 20, and the 935 Express service operated on the same weekend schedules throughout June. Wider express headways on June 26 imply that some of the scheduled service was not operated.
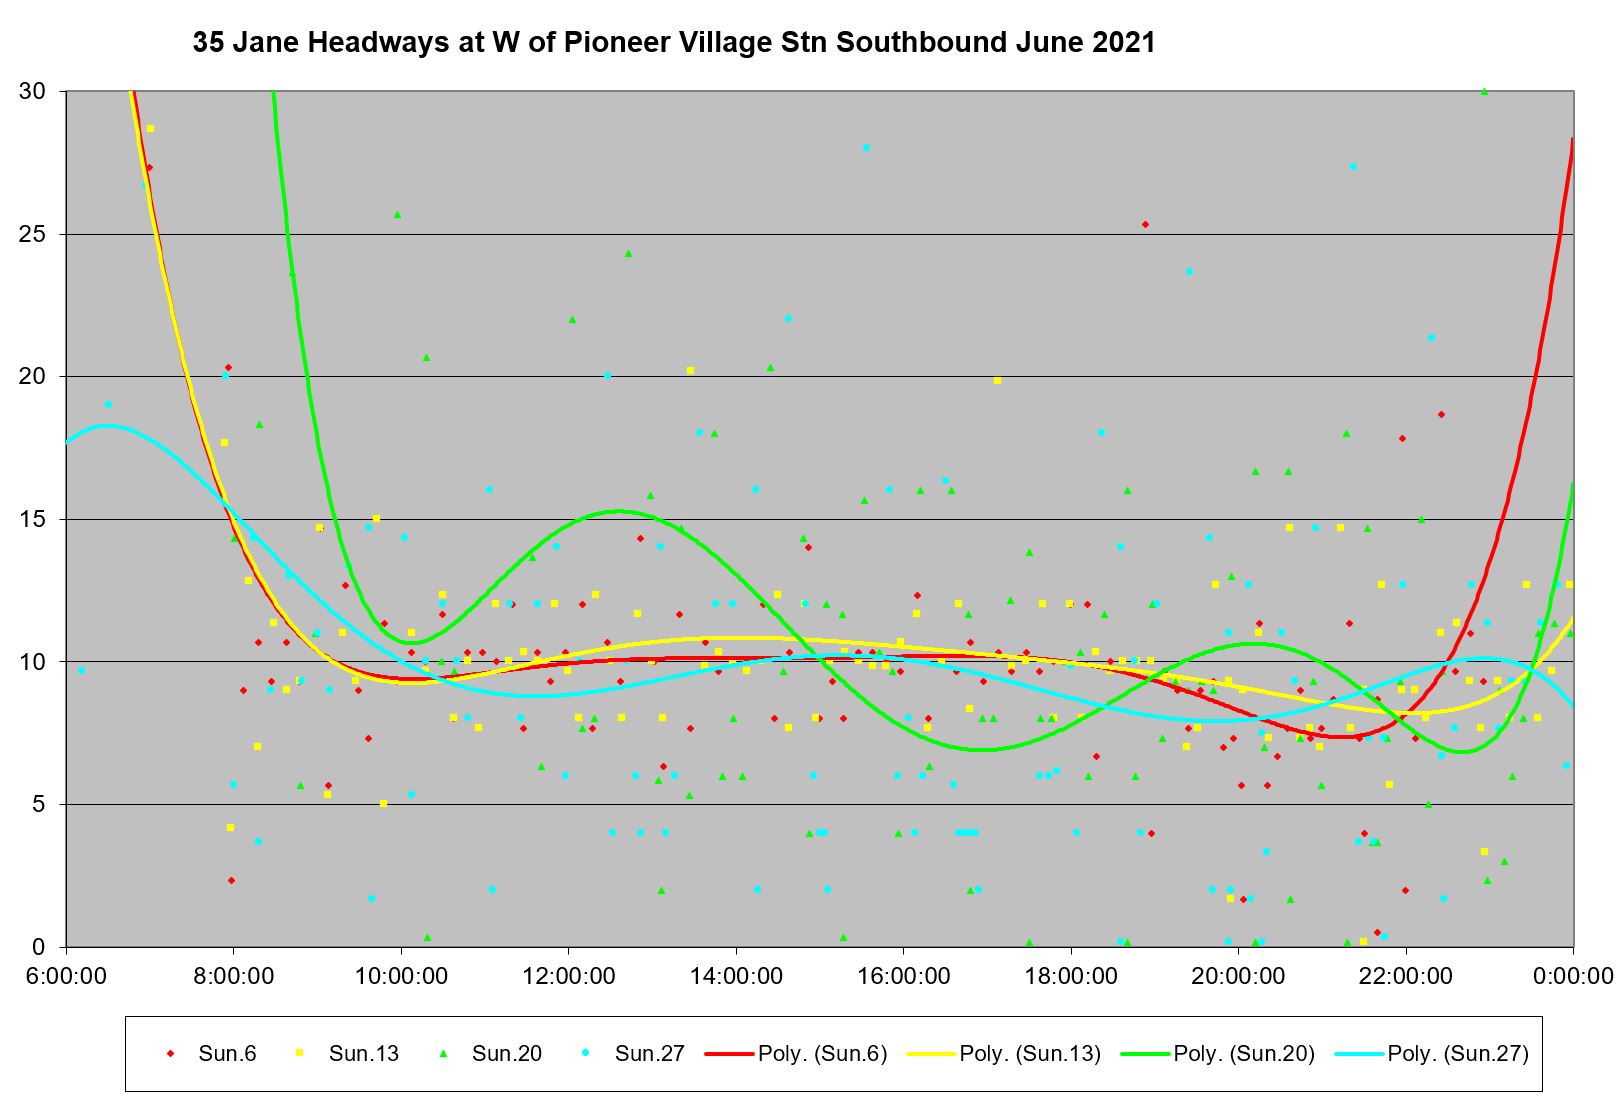
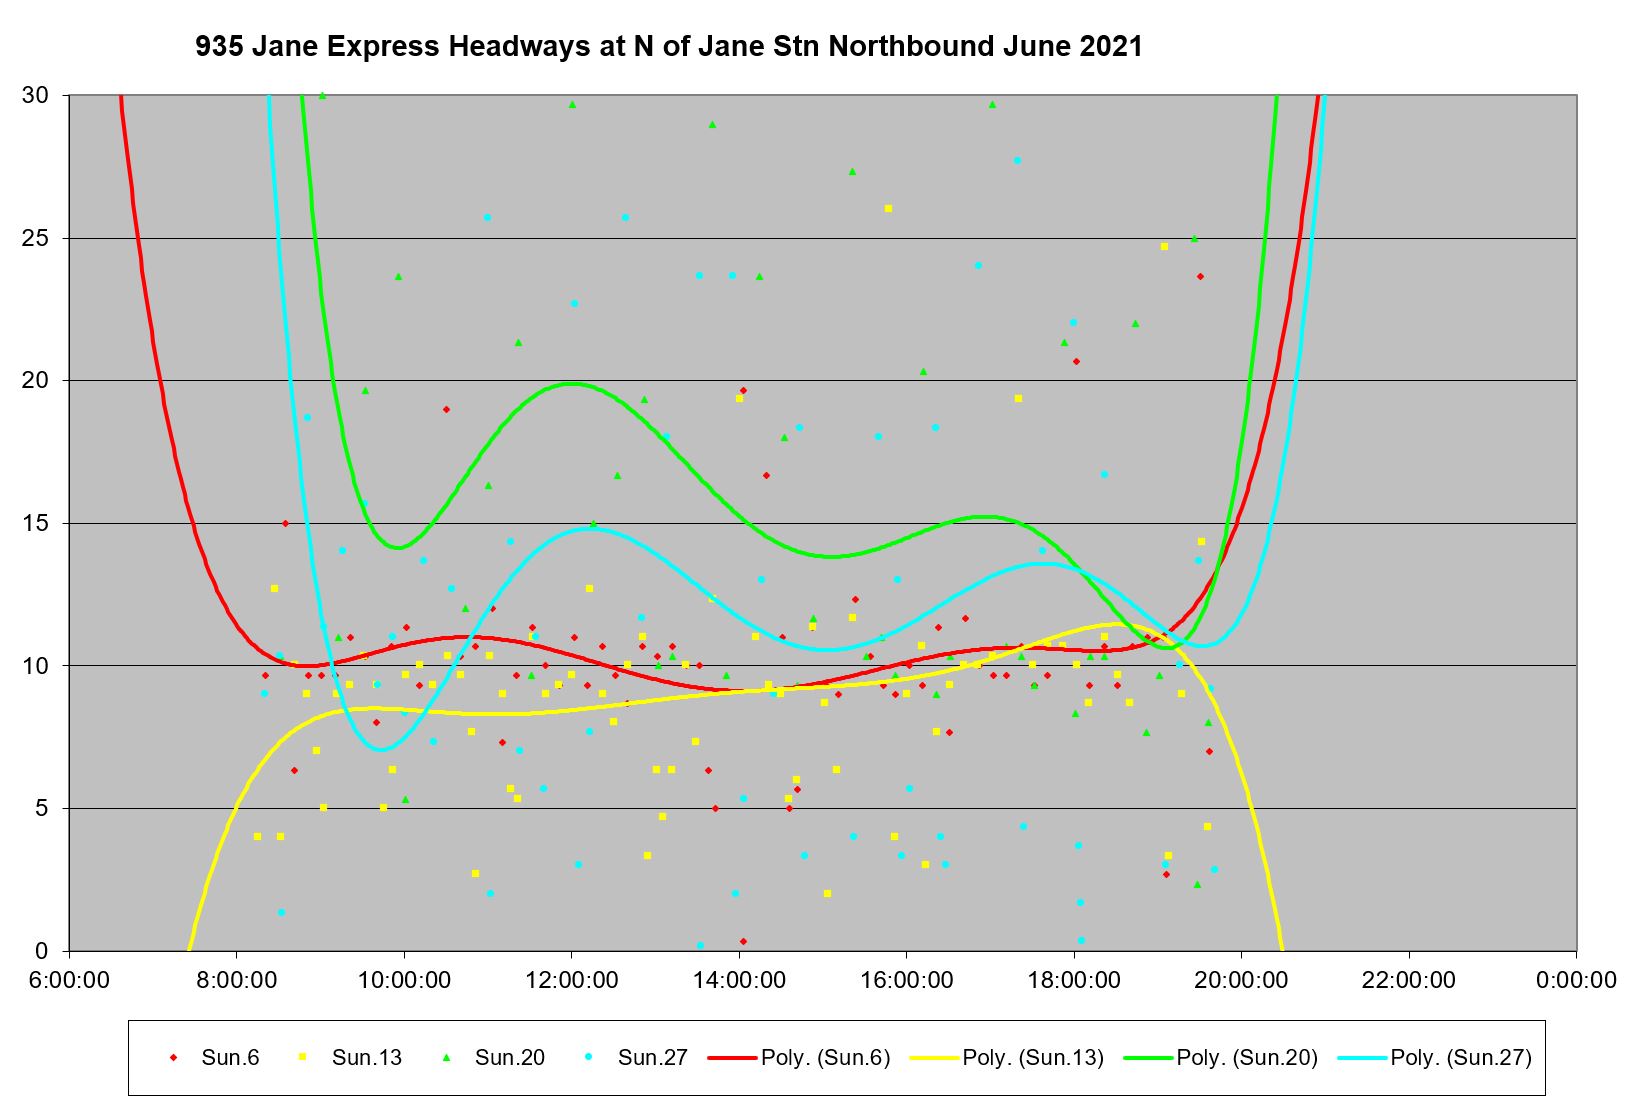
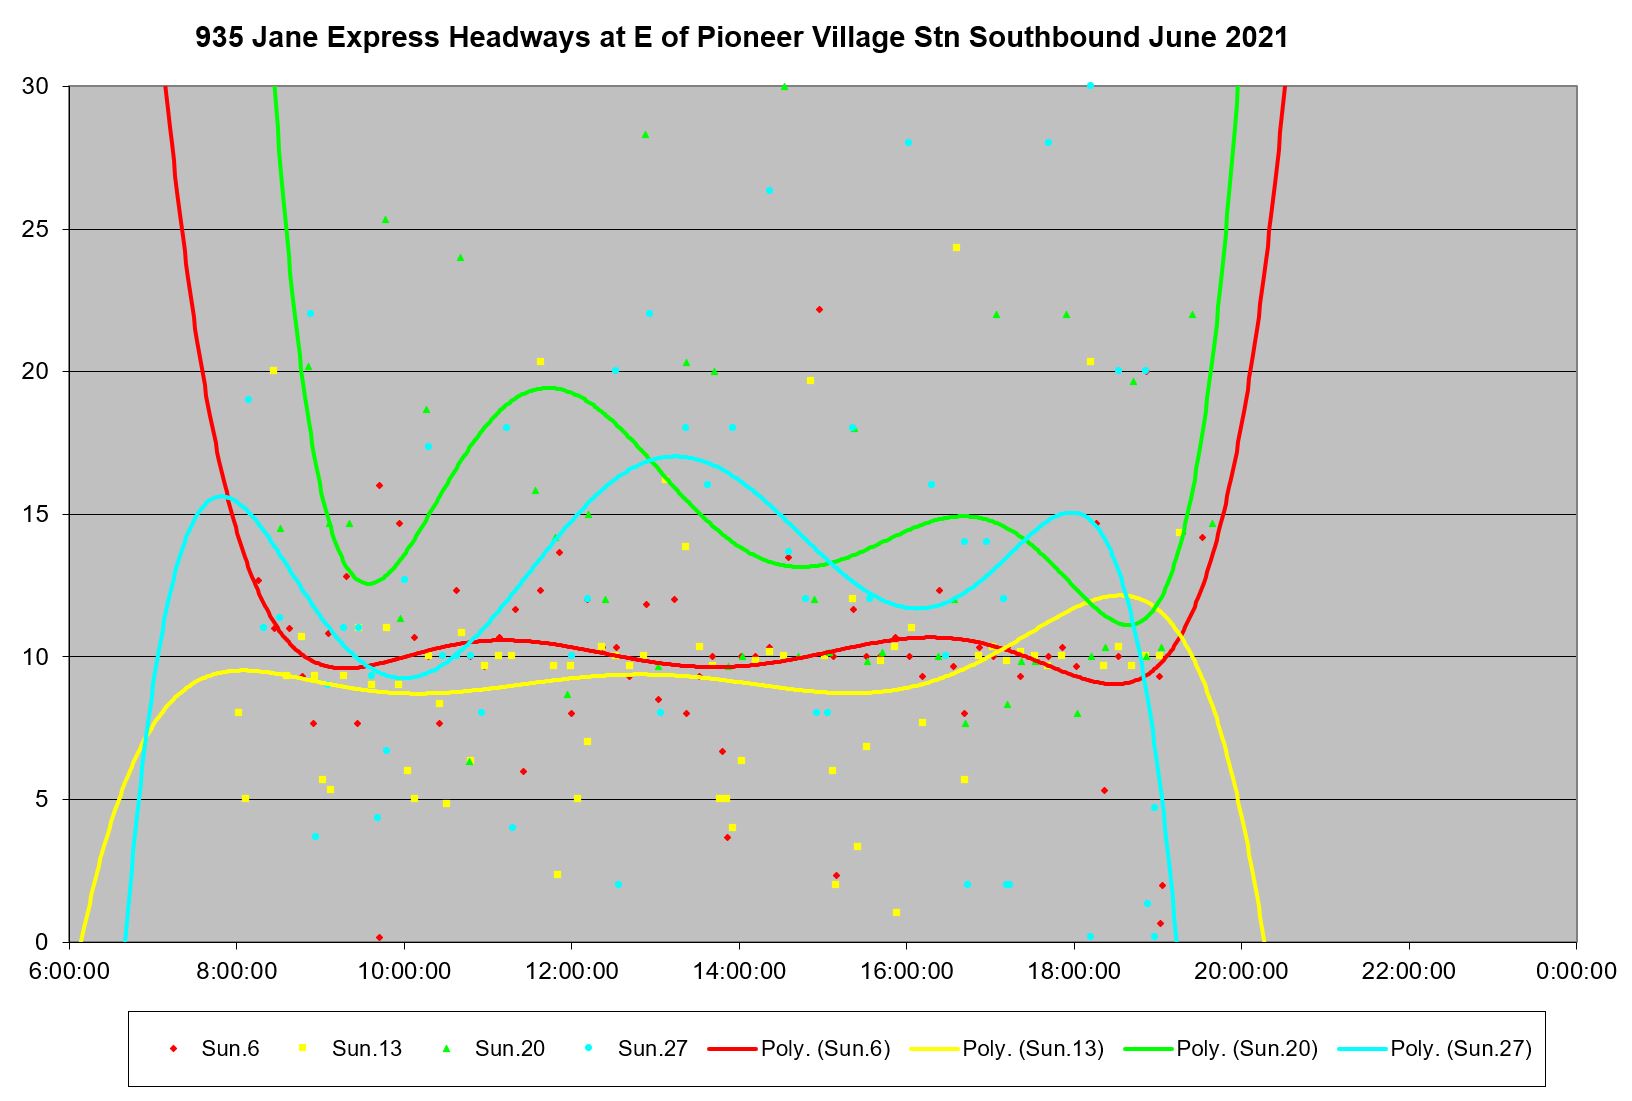
Sunday Service
As on Saturdays, scattered headways with bunching and gaps occur through the month although for the local service the problem is worse in the later weeks. How much of this is due to the new schedule and how much to construction delays is hard to tell. In the case of the express service, the much wider headways after June 20 suggest that some of the scheduled service was not actually operated.
Full Chart Sets
For those who want all of the gory details, here are the full sets of charts from which the illustrations in this article are taken.
Travel Time Charts
Speed Comparisons
- 35/935 Jane Local vs Express Northbound
- 35/935 Jane Local vs Express Southbound
- 35 Jane Mid May vs Late June Northbound
- 35 Jane Mid May vs Late June Southbound
Headway Charts

Meanwhile, the non-transit using commissioners on the TTC board will say, “Yeah, yeah, yeah. Next.” as they play solitaire on their smartphones at the board meetings.
Steve: That particular Commissioner, also the Deputy Mayor, deserves to be stripped of all responsibilities. Tory’s support for him says a lot about the Mayor’s judgement and priorities.
LikeLike