
Four routes in Scarborough benefit from the introduction of reserved lanes on Eglinton Avenue East, Kingston Road and Morningside Avenue.
- 86 Scarborough
- 186 Scarborough Express
- 116 Morningside
- 905 Eglinton East Express
In previous articles, I looked at the change in travel times with the onset of covid-era drops in traffic levels beginning in Spring 2020, and the effect of the “red lane” implementation in mid-October 2020. This is an update to bring the review to the end of June 2021.
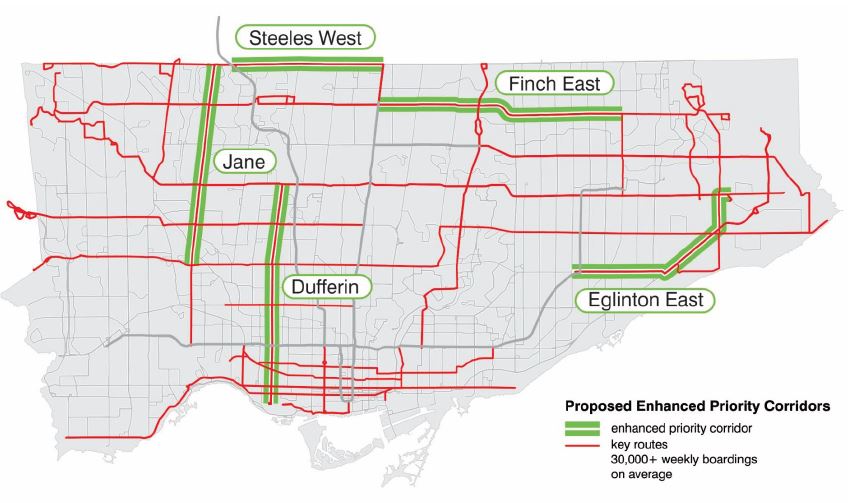
On five other corridors (Jane, Dufferin, Finch East, Steeles West, Lawrence East), there are plans for reserved lanes, although the proposals have not met with universal acclaim. In future articles I will bring the review of their routes’ behaviour up to date. The map below shows the affected routes as proposed in the Service Plan. Lawrence Avenue East was added to this list by the TTC Board.
My underlying premise is that pre-pandemic conditions are a reference point for travel times. Across the entire transit network, traffic congestion and boarding delays fell with the onset of covid. This has been building back gradually, but the effect varies from route to route. There are also external events such as the LRT construction on Finch Avenue West that affect intersecting streets. Finally, the transit red lanes were introduced concurrently with two other changes: the removal of some local stops and the restoration of express service.
This makes identification of the actual cause of shorter travel times more difficult to isolate, and the answer is probably “all of the above”. Each street and route is different, and the benefits, such as they are, of the red lanes should not be assumed to apply on every route segment in the city.
A concurrent issue for transit riders is the dependability of service. It may well be that five minutes is shaved off of their journey with a reserved lane, but if the service is erratic and the wait time for a bus is unpredictable, this benefit can be sabotaged. The situation is further complicated by a mix of local and express buses. If an express can serve a rider’s planned trip, it might save time thanks both to the red lanes and to the fewer stops enroute. However, if the likely wait for an express bus exceeds the time saving (and desire for certainty), a local bus could prove “faster” if it shows up first.
The TTC forever talks about optimization of service and schedule adjustments to make things work better. Problems should be “solved” with schemes like reserved lanes and express buses, so they say. However, headways (the time between buses) continue to be irregular leading to rider frustration and complaints, some of which are due to overcrowding caused by irregular service.
The TTC is good at getting the City to make changes to roads to “improve” service, but not so good at managing the service it has.
The short version of this article is that the red lanes on Eglinton/Kingston/Morningside improved travel times somewhat although we have not yet seen the real test of whether they prevent a return to pre-pandemic, pre-red lane conditions. The benefit varies from route to route, time of day, and day of the week. In spite of the claims that transit priority would lead to more reliable service, gapping and bunching remains a problem on most of the route using the red lane corridor.
This is a key issue for expanding the program: transit priority on its own does not guarantee regularly spaced and, by extension, evenly loaded vehicles.
A Note About Data
Since the idea of the red lanes first appeared, I began to collect data on the proposed routes. This was complicated by a few factors:
- The red lanes, aka RapidTO, were proposed in the Service Plan issued in December 2019, before the pandemic. In anticipation of studying their benefit, I began collecting vehicle tracking data for the affected routes in 2020.
- In some cases, because I was already tracking major routes, I had data from April 2018, but there is a big gap until late 2019 because this was the conversion period from the old CIS tracking system to the new Vision system. Data extracts were not available from Vision until late 2019. Therefore, I have very little pre-2020 data that is recent enough to be used for comparison.
- With the effects of the pandemic on traffic and riding levels in 2020, the travel times are no longer representative of worst case conditions. A silver lining is that for the period when traffic was very light, this gives a best case situation for transit travel, in effect setting a bound on the improvement we could expect if we could just make the traffic disappear.
- Almost all 900-series Express routes were dropped in Spring 2020, and they have only slowly been returning (more are planned later in 2021 or early 2022 including a few new routes). Therefore an express-vs-local comparison is not available on all corridors.
- Before the Express network existed, express trips (typically the “E” branch of a route) ran with the same route number and their data are mixed together with the local trips. It was not practical to attempt to fish the express trips out of the tracking data in part because local and express runs did not always make their trips as scheduled, and this varied from day to day. Some buses alternated between making express and local trips. Therefore, data from 2018 represent a mix of times for local and express trips. This understates the time needed for local trips and overstates the value for express trips.
I will not burden the reader with a discussion of the methodology for converting CIS and Vision data to the format used in my analyses. There are two articles on this:
- Understanding TTC Service Analysis Charts: A Primer
- Methodology for Analysis of TTC’s Vehicle Tracking Data
