
Four routes in Scarborough benefit from the introduction of reserved lanes on Eglinton Avenue East, Kingston Road and Morningside Avenue.
- 86 Scarborough
- 186 Scarborough Express
- 116 Morningside
- 905 Eglinton East Express
In previous articles, I looked at the change in travel times with the onset of covid-era drops in traffic levels beginning in Spring 2020, and the effect of the “red lane” implementation in mid-October 2020. This is an update to bring the review to the end of June 2021.
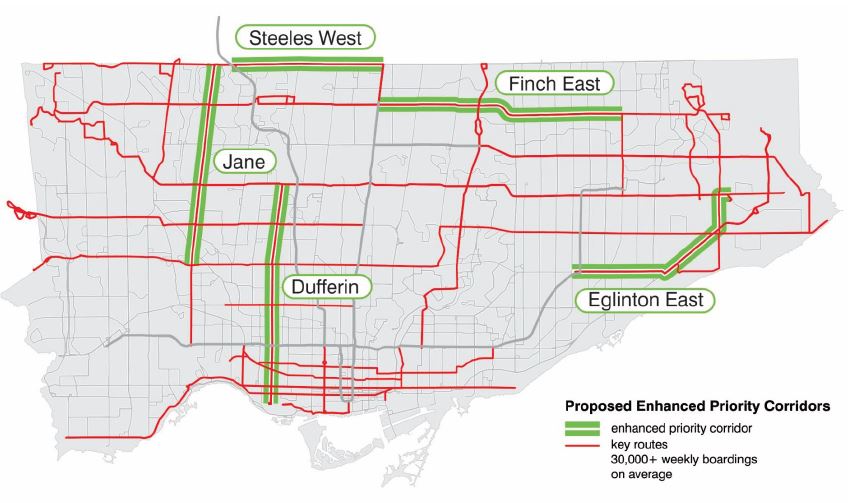
On five other corridors (Jane, Dufferin, Finch East, Steeles West, Lawrence East), there are plans for reserved lanes, although the proposals have not met with universal acclaim. In future articles I will bring the review of their routes’ behaviour up to date. The map below shows the affected routes as proposed in the Service Plan. Lawrence Avenue East was added to this list by the TTC Board.
My underlying premise is that pre-pandemic conditions are a reference point for travel times. Across the entire transit network, traffic congestion and boarding delays fell with the onset of covid. This has been building back gradually, but the effect varies from route to route. There are also external events such as the LRT construction on Finch Avenue West that affect intersecting streets. Finally, the transit red lanes were introduced concurrently with two other changes: the removal of some local stops and the restoration of express service.
This makes identification of the actual cause of shorter travel times more difficult to isolate, and the answer is probably “all of the above”. Each street and route is different, and the benefits, such as they are, of the red lanes should not be assumed to apply on every route segment in the city.
A concurrent issue for transit riders is the dependability of service. It may well be that five minutes is shaved off of their journey with a reserved lane, but if the service is erratic and the wait time for a bus is unpredictable, this benefit can be sabotaged. The situation is further complicated by a mix of local and express buses. If an express can serve a rider’s planned trip, it might save time thanks both to the red lanes and to the fewer stops enroute. However, if the likely wait for an express bus exceeds the time saving (and desire for certainty), a local bus could prove “faster” if it shows up first.
The TTC forever talks about optimization of service and schedule adjustments to make things work better. Problems should be “solved” with schemes like reserved lanes and express buses, so they say. However, headways (the time between buses) continue to be irregular leading to rider frustration and complaints, some of which are due to overcrowding caused by irregular service.
The TTC is good at getting the City to make changes to roads to “improve” service, but not so good at managing the service it has.
The short version of this article is that the red lanes on Eglinton/Kingston/Morningside improved travel times somewhat although we have not yet seen the real test of whether they prevent a return to pre-pandemic, pre-red lane conditions. The benefit varies from route to route, time of day, and day of the week. In spite of the claims that transit priority would lead to more reliable service, gapping and bunching remains a problem on most of the route using the red lane corridor.
This is a key issue for expanding the program: transit priority on its own does not guarantee regularly spaced and, by extension, evenly loaded vehicles.
A Note About Data
Since the idea of the red lanes first appeared, I began to collect data on the proposed routes. This was complicated by a few factors:
- The red lanes, aka RapidTO, were proposed in the Service Plan issued in December 2019, before the pandemic. In anticipation of studying their benefit, I began collecting vehicle tracking data for the affected routes in 2020.
- In some cases, because I was already tracking major routes, I had data from April 2018, but there is a big gap until late 2019 because this was the conversion period from the old CIS tracking system to the new Vision system. Data extracts were not available from Vision until late 2019. Therefore, I have very little pre-2020 data that is recent enough to be used for comparison.
- With the effects of the pandemic on traffic and riding levels in 2020, the travel times are no longer representative of worst case conditions. A silver lining is that for the period when traffic was very light, this gives a best case situation for transit travel, in effect setting a bound on the improvement we could expect if we could just make the traffic disappear.
- Almost all 900-series Express routes were dropped in Spring 2020, and they have only slowly been returning (more are planned later in 2021 or early 2022 including a few new routes). Therefore an express-vs-local comparison is not available on all corridors.
- Before the Express network existed, express trips (typically the “E” branch of a route) ran with the same route number and their data are mixed together with the local trips. It was not practical to attempt to fish the express trips out of the tracking data in part because local and express runs did not always make their trips as scheduled, and this varied from day to day. Some buses alternated between making express and local trips. Therefore, data from 2018 represent a mix of times for local and express trips. This understates the time needed for local trips and overstates the value for express trips.
I will not burden the reader with a discussion of the methodology for converting CIS and Vision data to the format used in my analyses. There are two articles on this:
- Understanding TTC Service Analysis Charts: A Primer
- Methodology for Analysis of TTC’s Vehicle Tracking Data
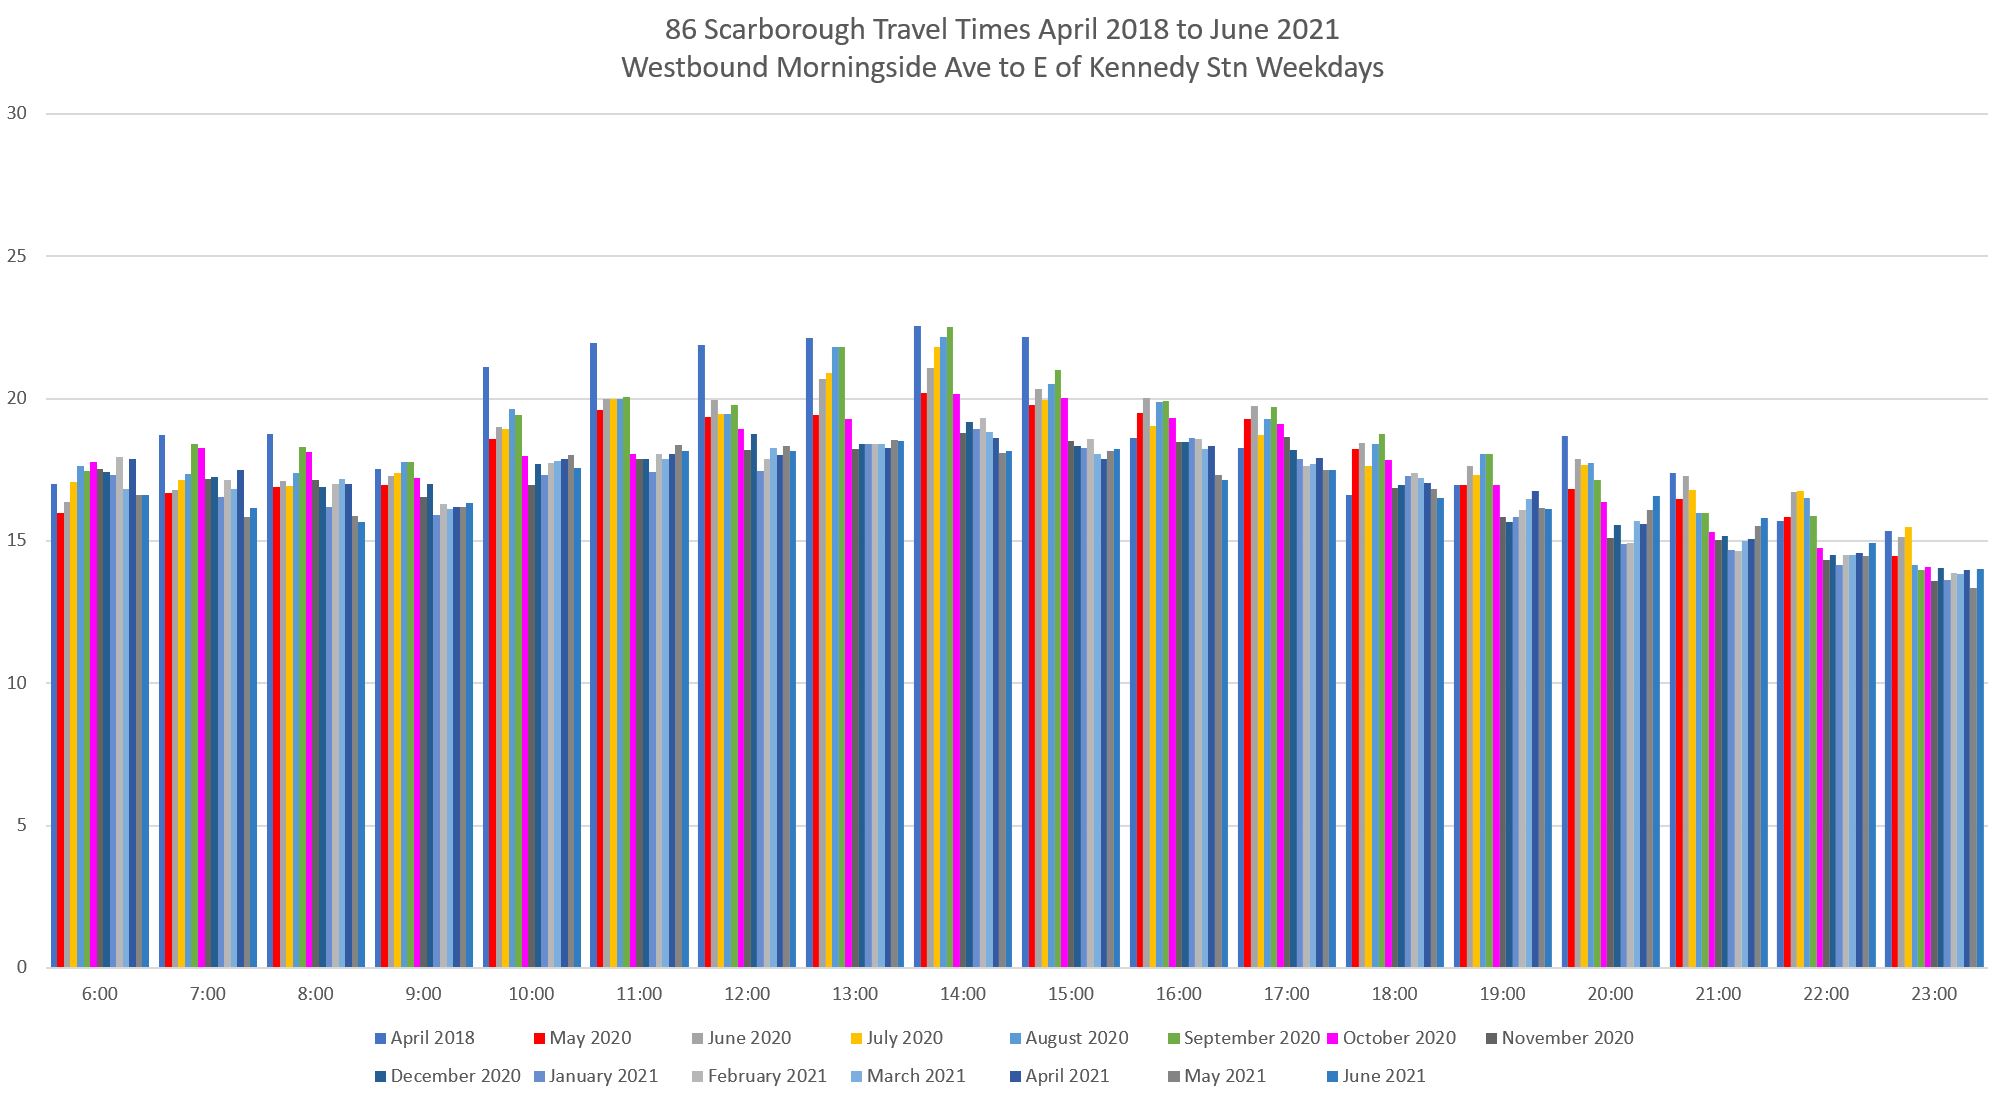
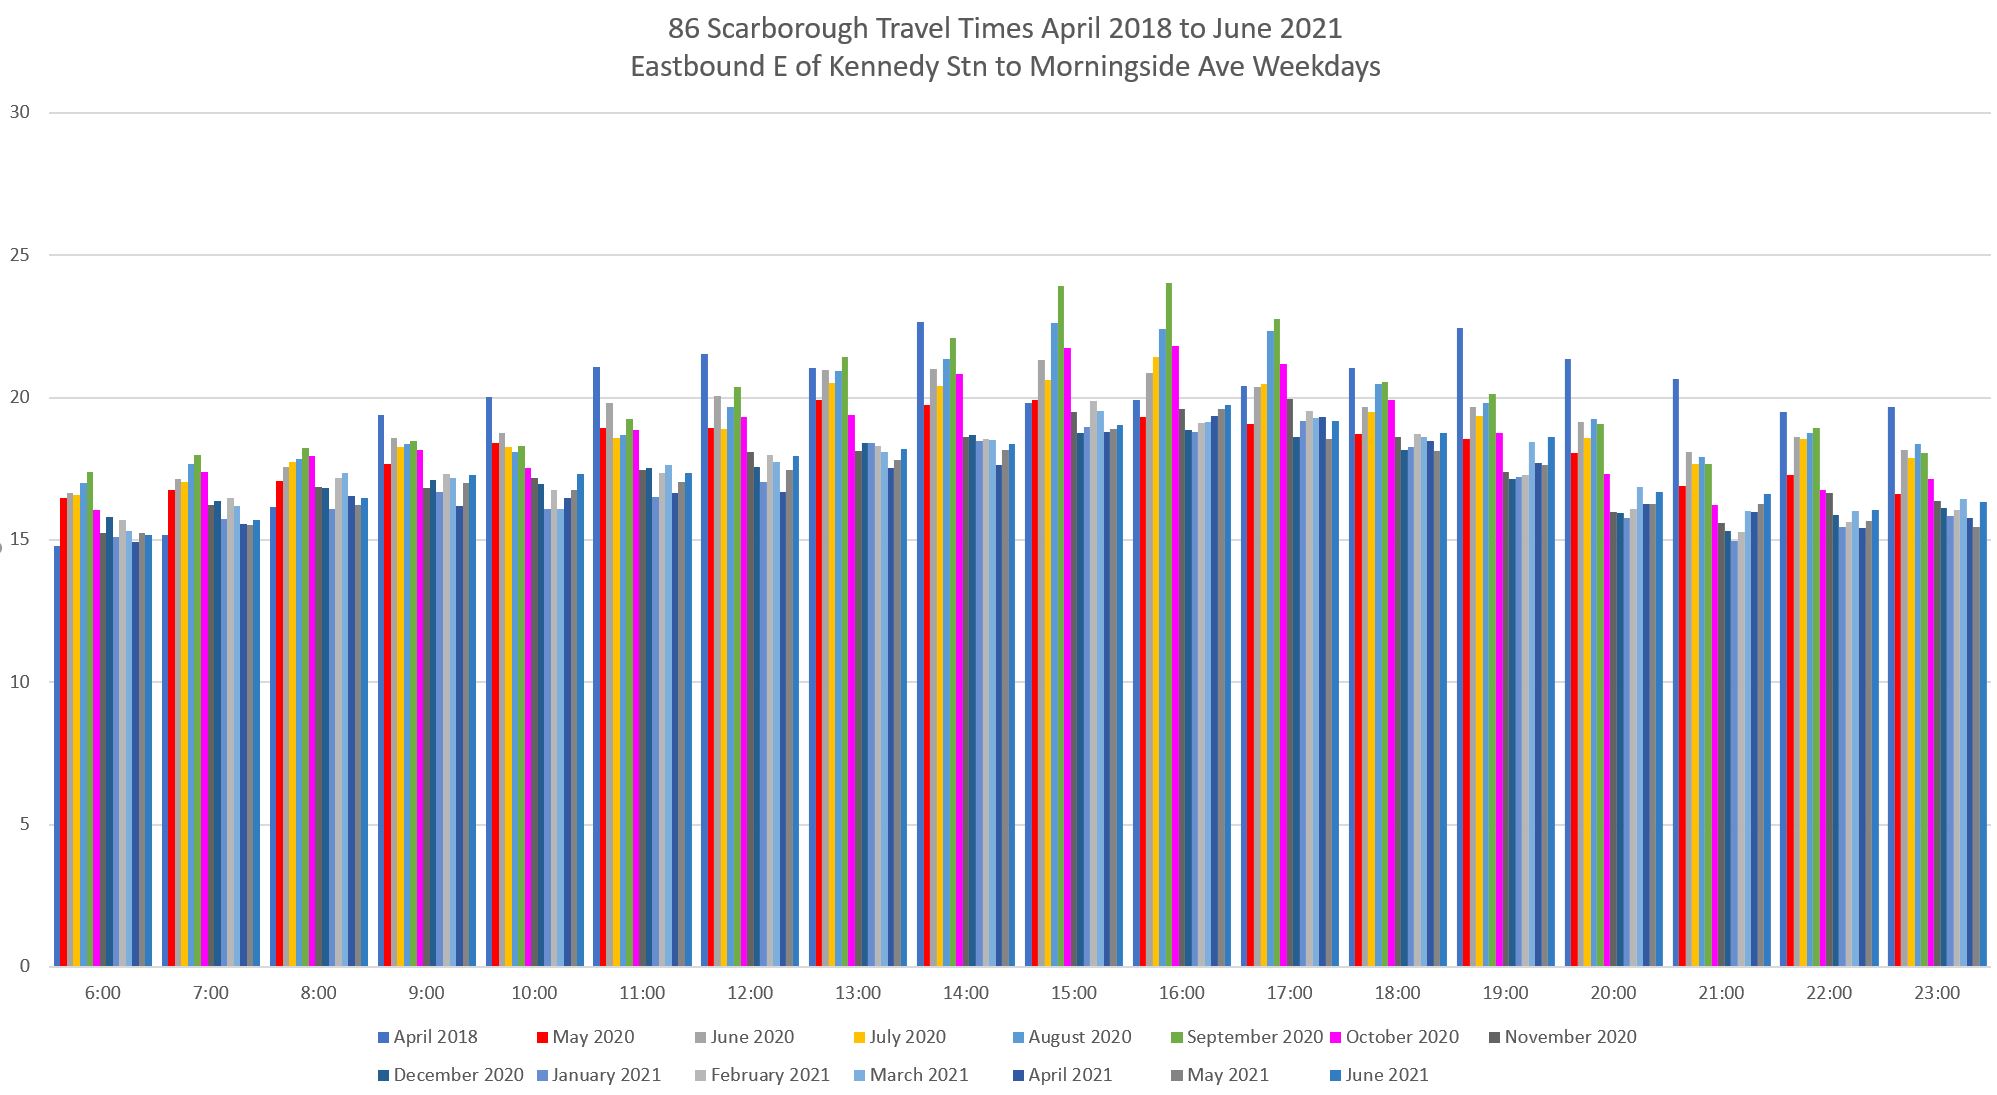
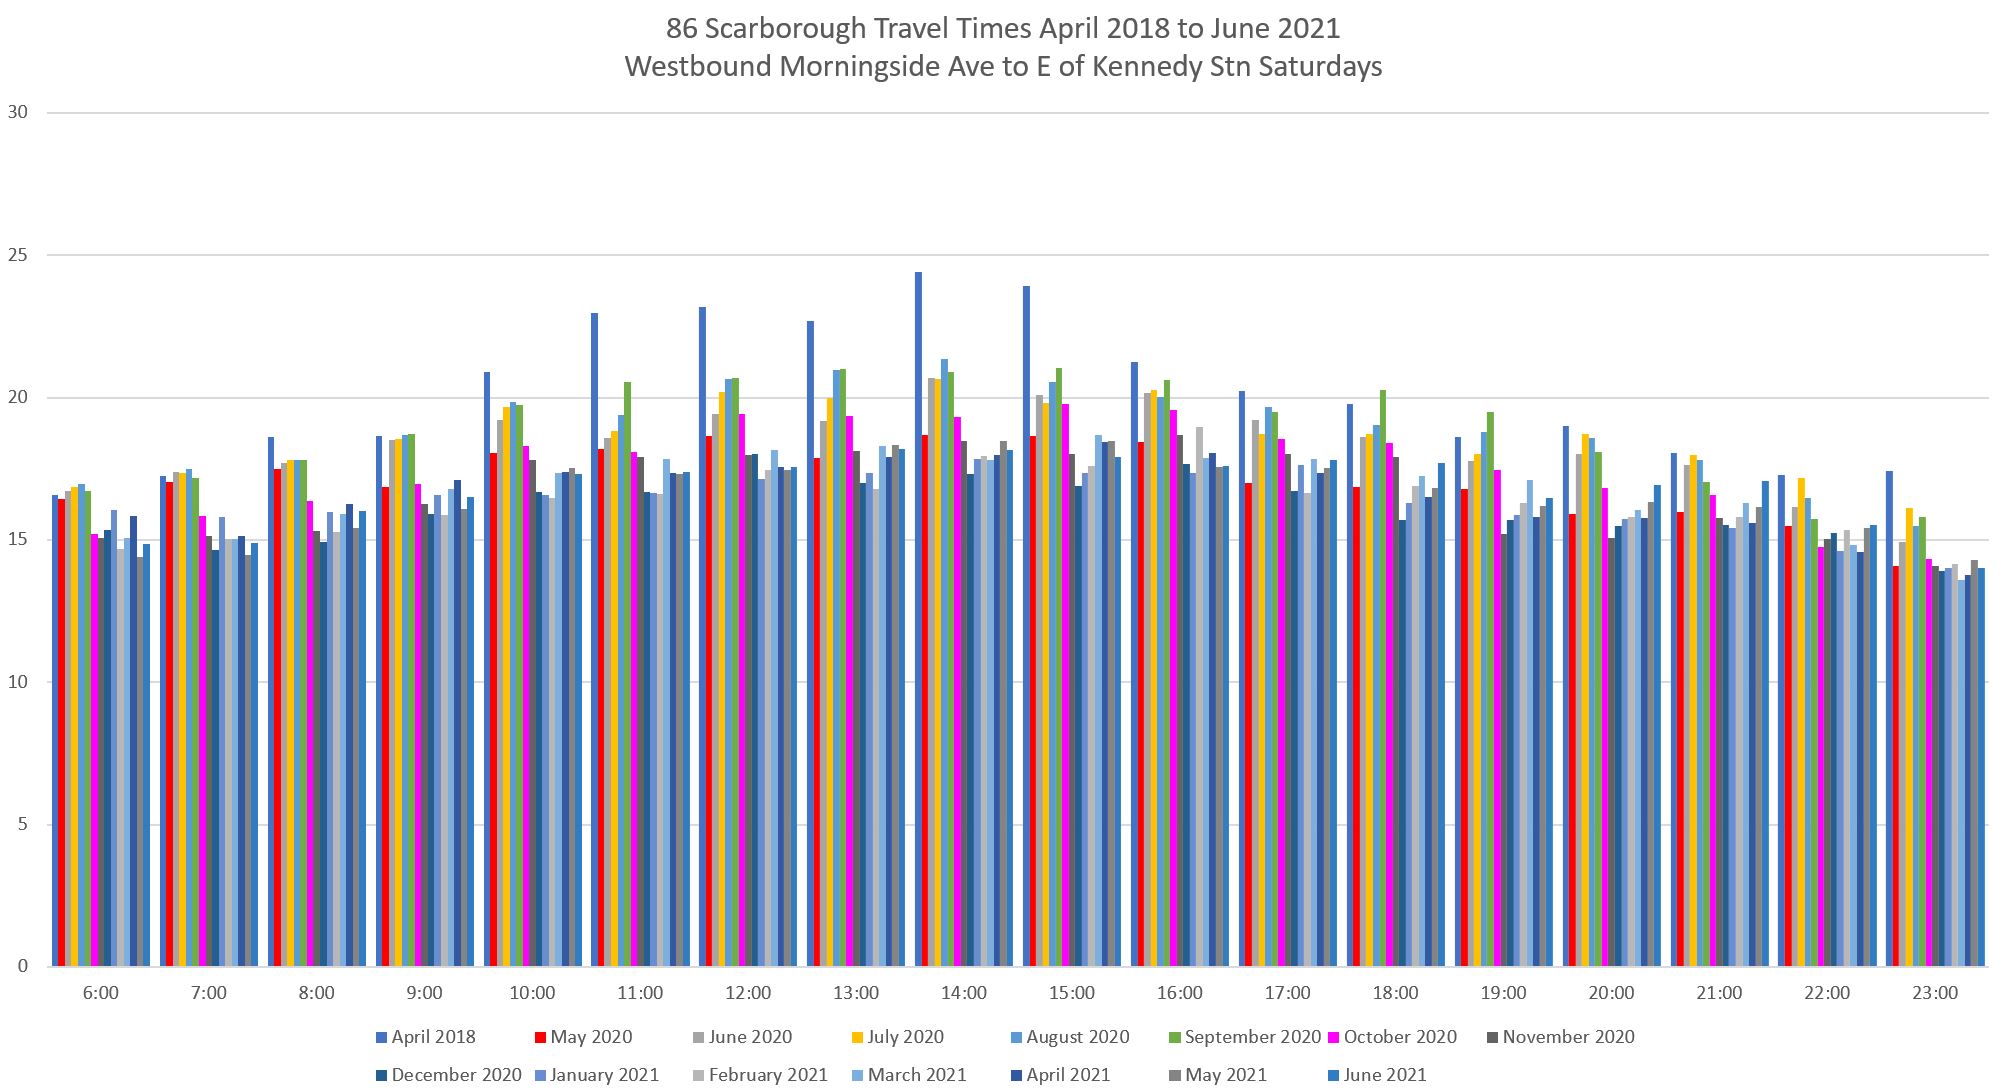
86/986 Scarborough
The 86 Scarborough route benefits from two of the three legs of the red lanes on Eglinton Avenue and Kingston Road. It also benefits from the concurrent removal of six local stops.
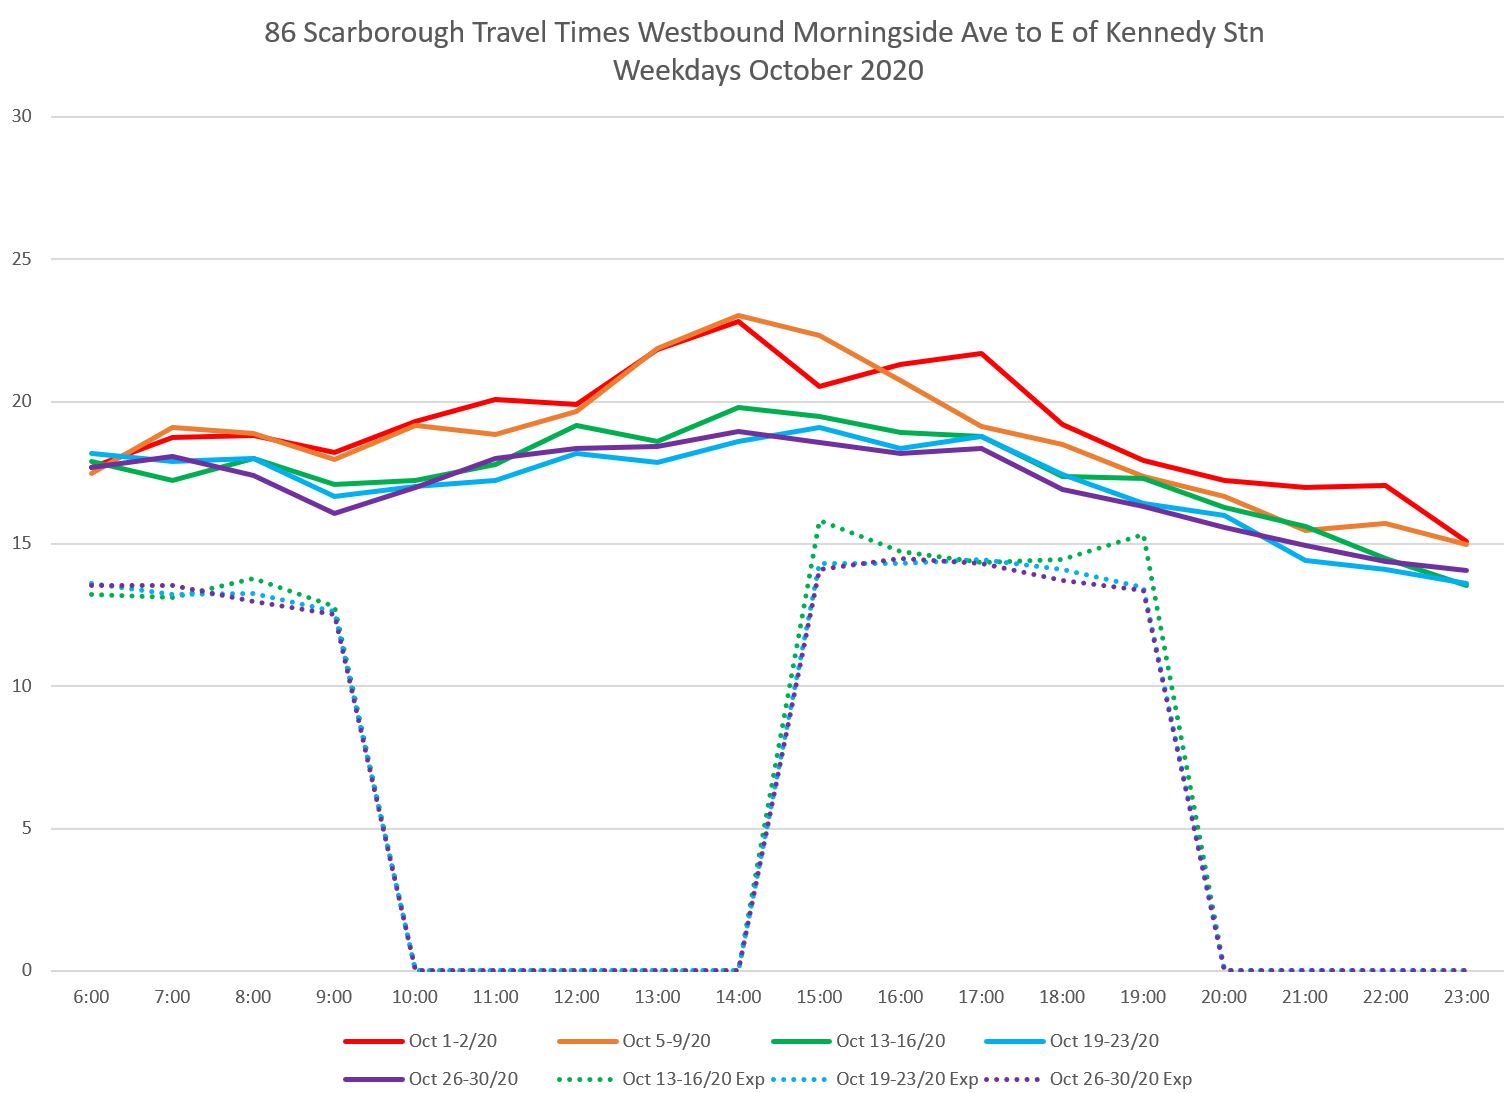
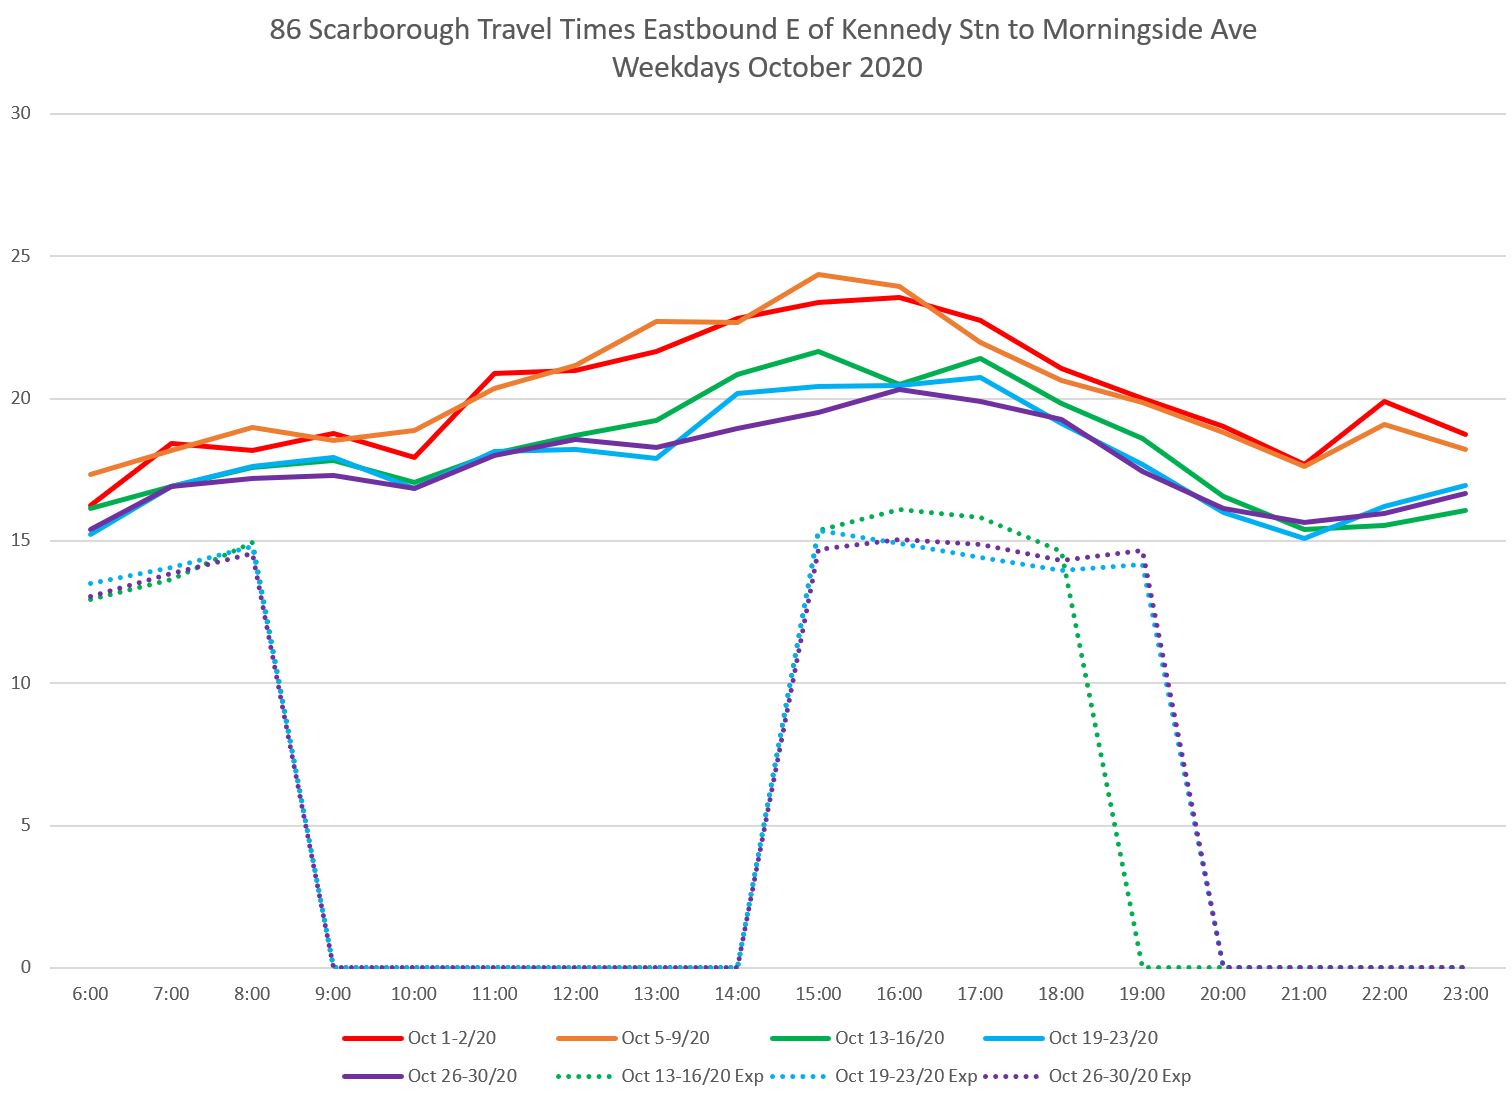
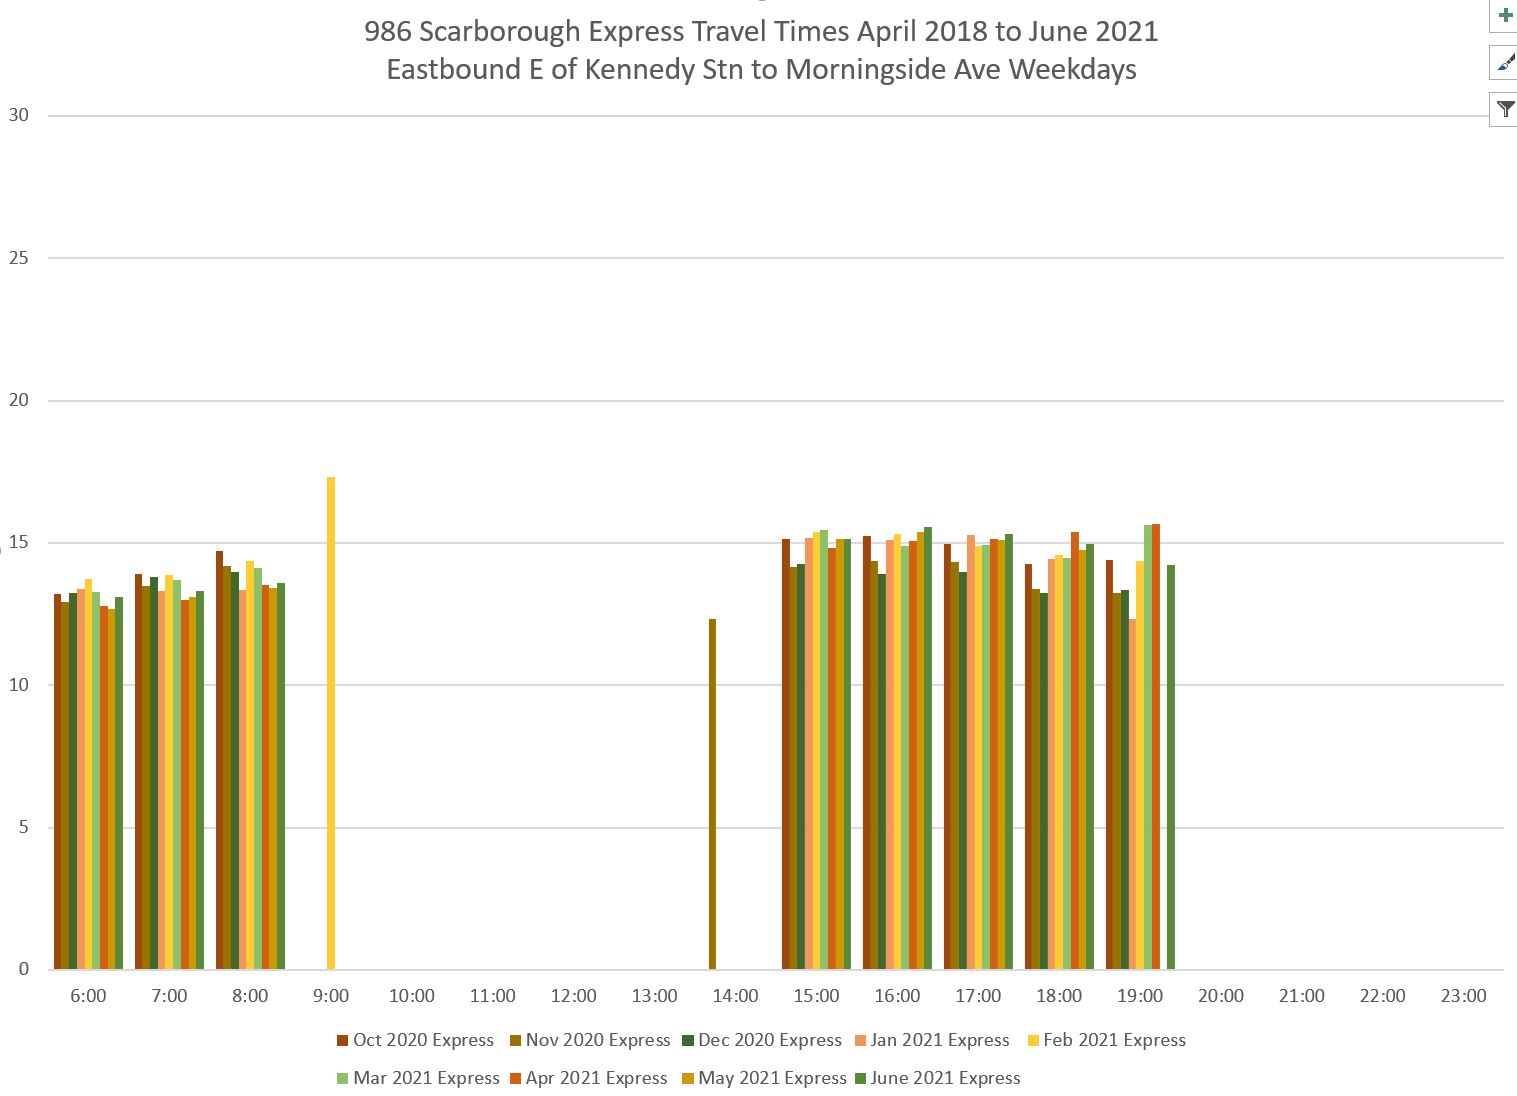
Looking at the week-by-week travel times in Fall 2020, one can see the point at which the lanes came into effect in October. Note that there is data for the 986 Express service only for weeks 3 to 5 of the month because it did not operate until October 13. The express service is notably faster than the local service.
The saving in travel time with the red lanes occurs at different times of day for the two directions. Westbound this is most evident in the afternoon, while the eastbound effect begins earlier and extends into the late evening.
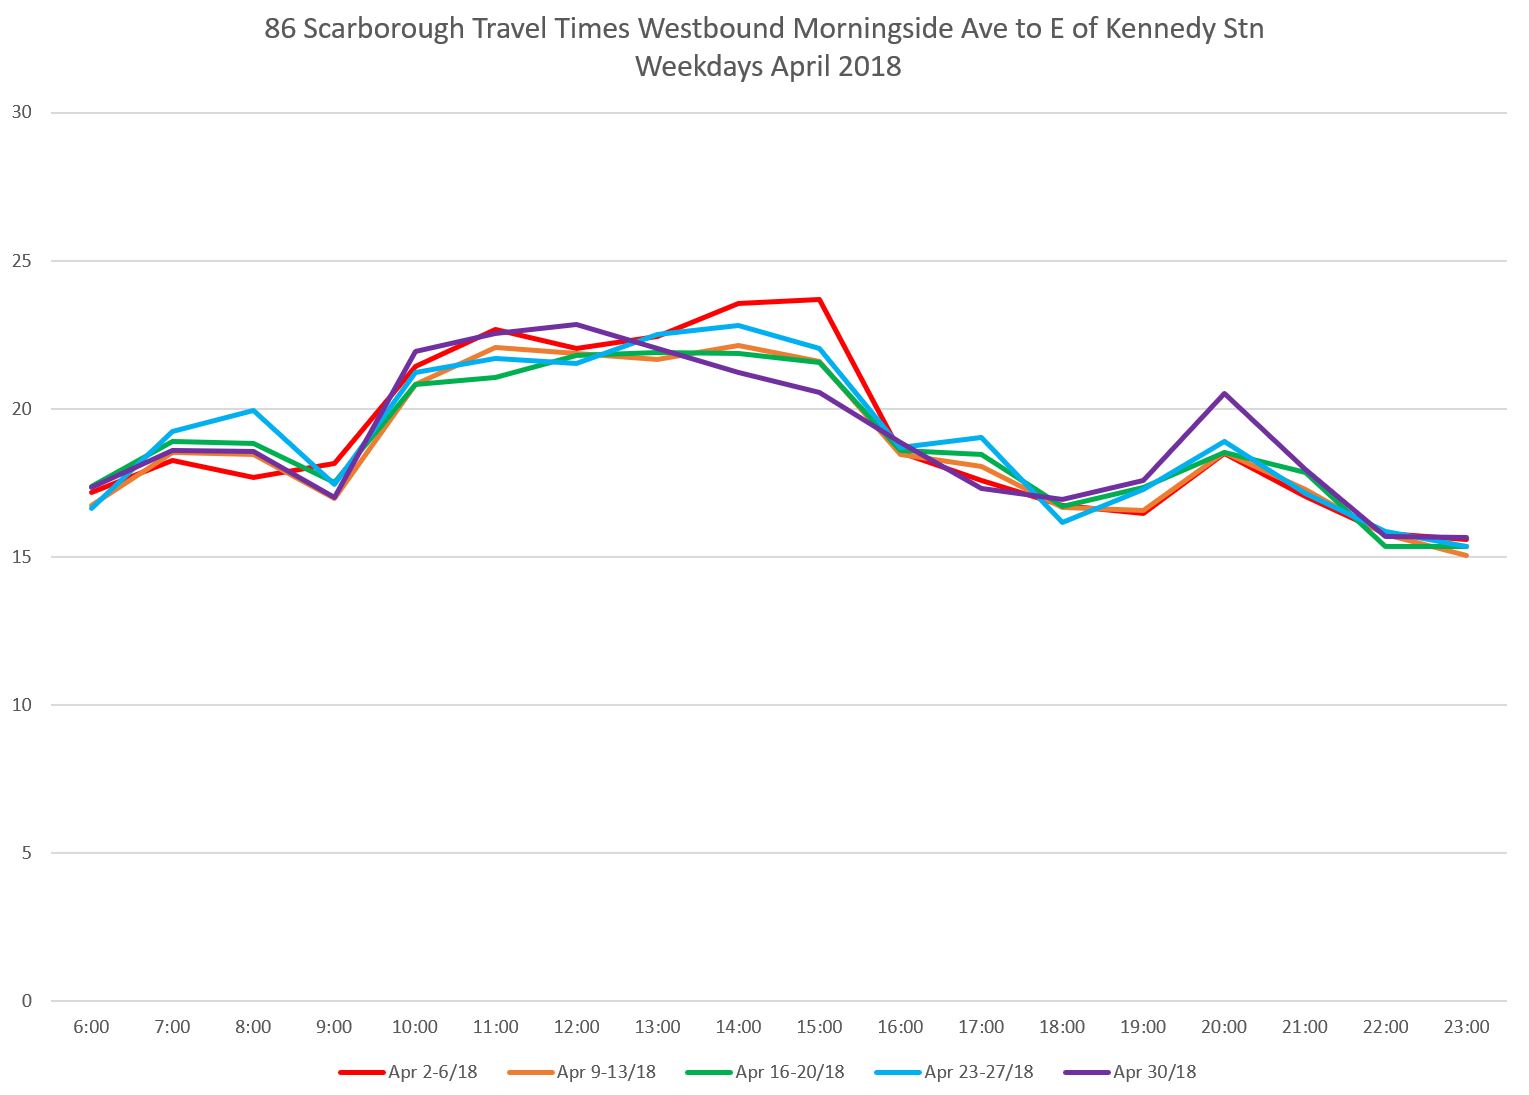
For pre-pandemic conditions, I have April 2018 data. Note that for peak periods, the values combine travel times of local and express buses as noted above. This could explain the apparent absence of traditional peak periods because the faster express trips pull down the averages.
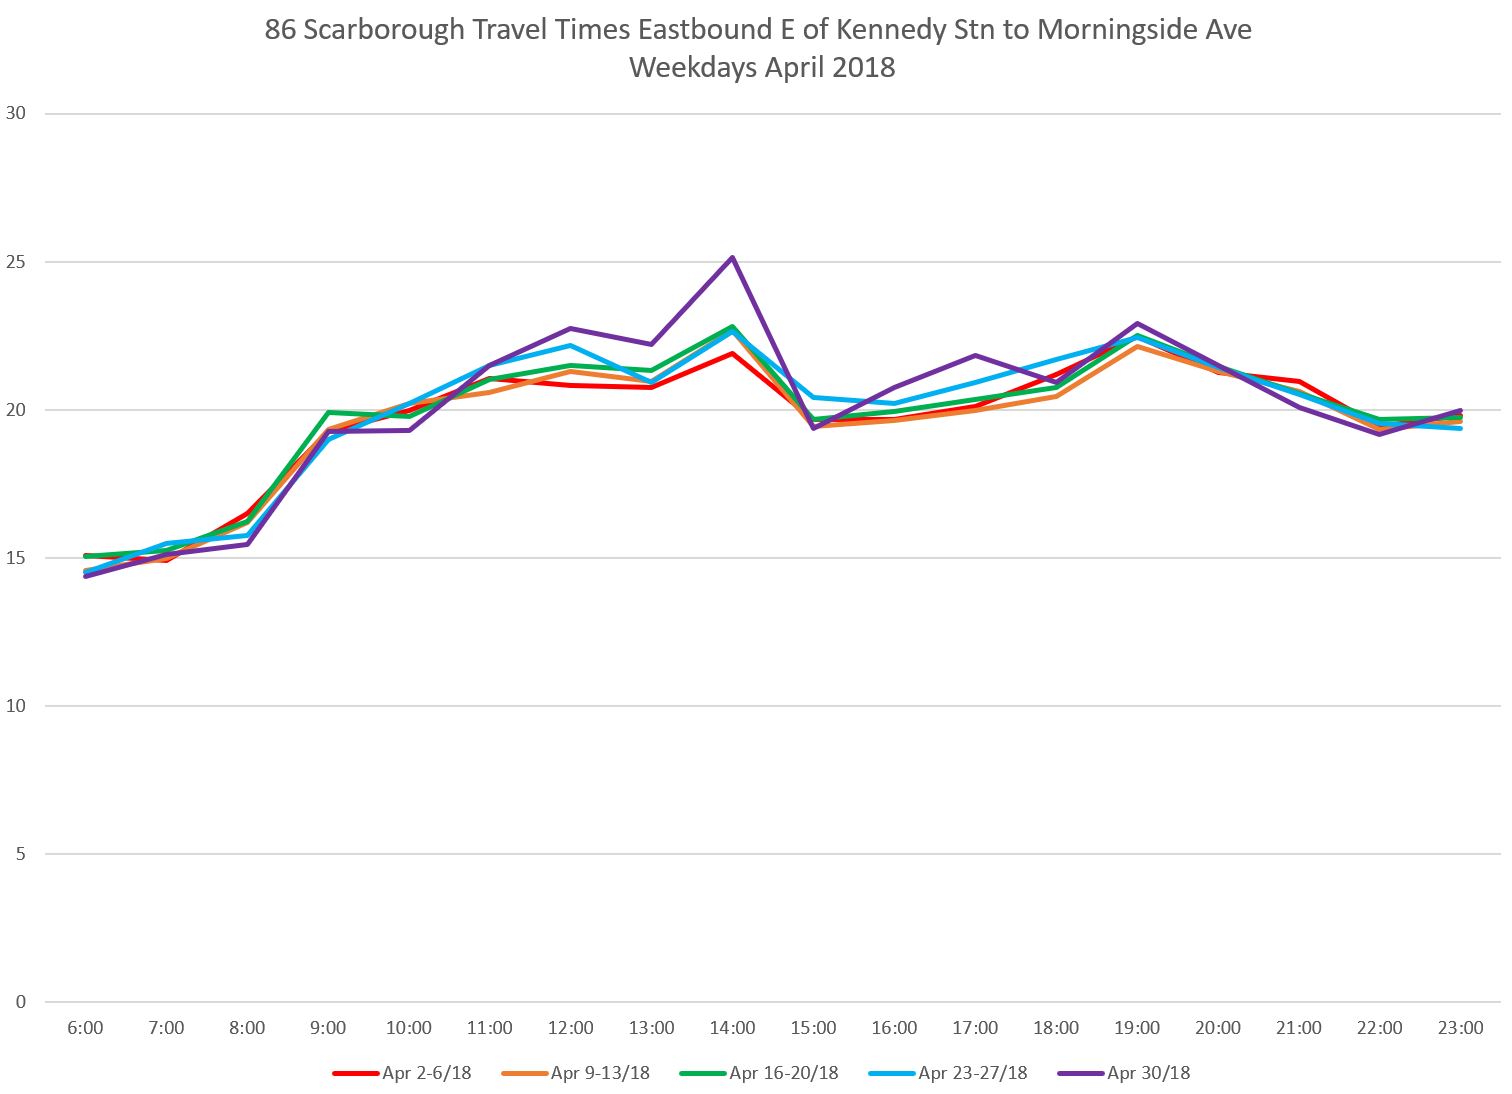
Looking at the data on a monthly rather than weekly basis, one can see the effects of the pandemic-induced fall in travel times as well as the effect of the red lanes plus stop removals. The data in the charts below are for only the 86 local service except in April 2018 when express data are included. The peak period values for April 2018 would be higher than shown here if the express trips were excluded. [Click on the charts to open a higher resolution version.]
The data for May 2020 with the pandemic effect in place are shown in red. The data for October 2020, the transitional month to the red lanes, are shown in pink.
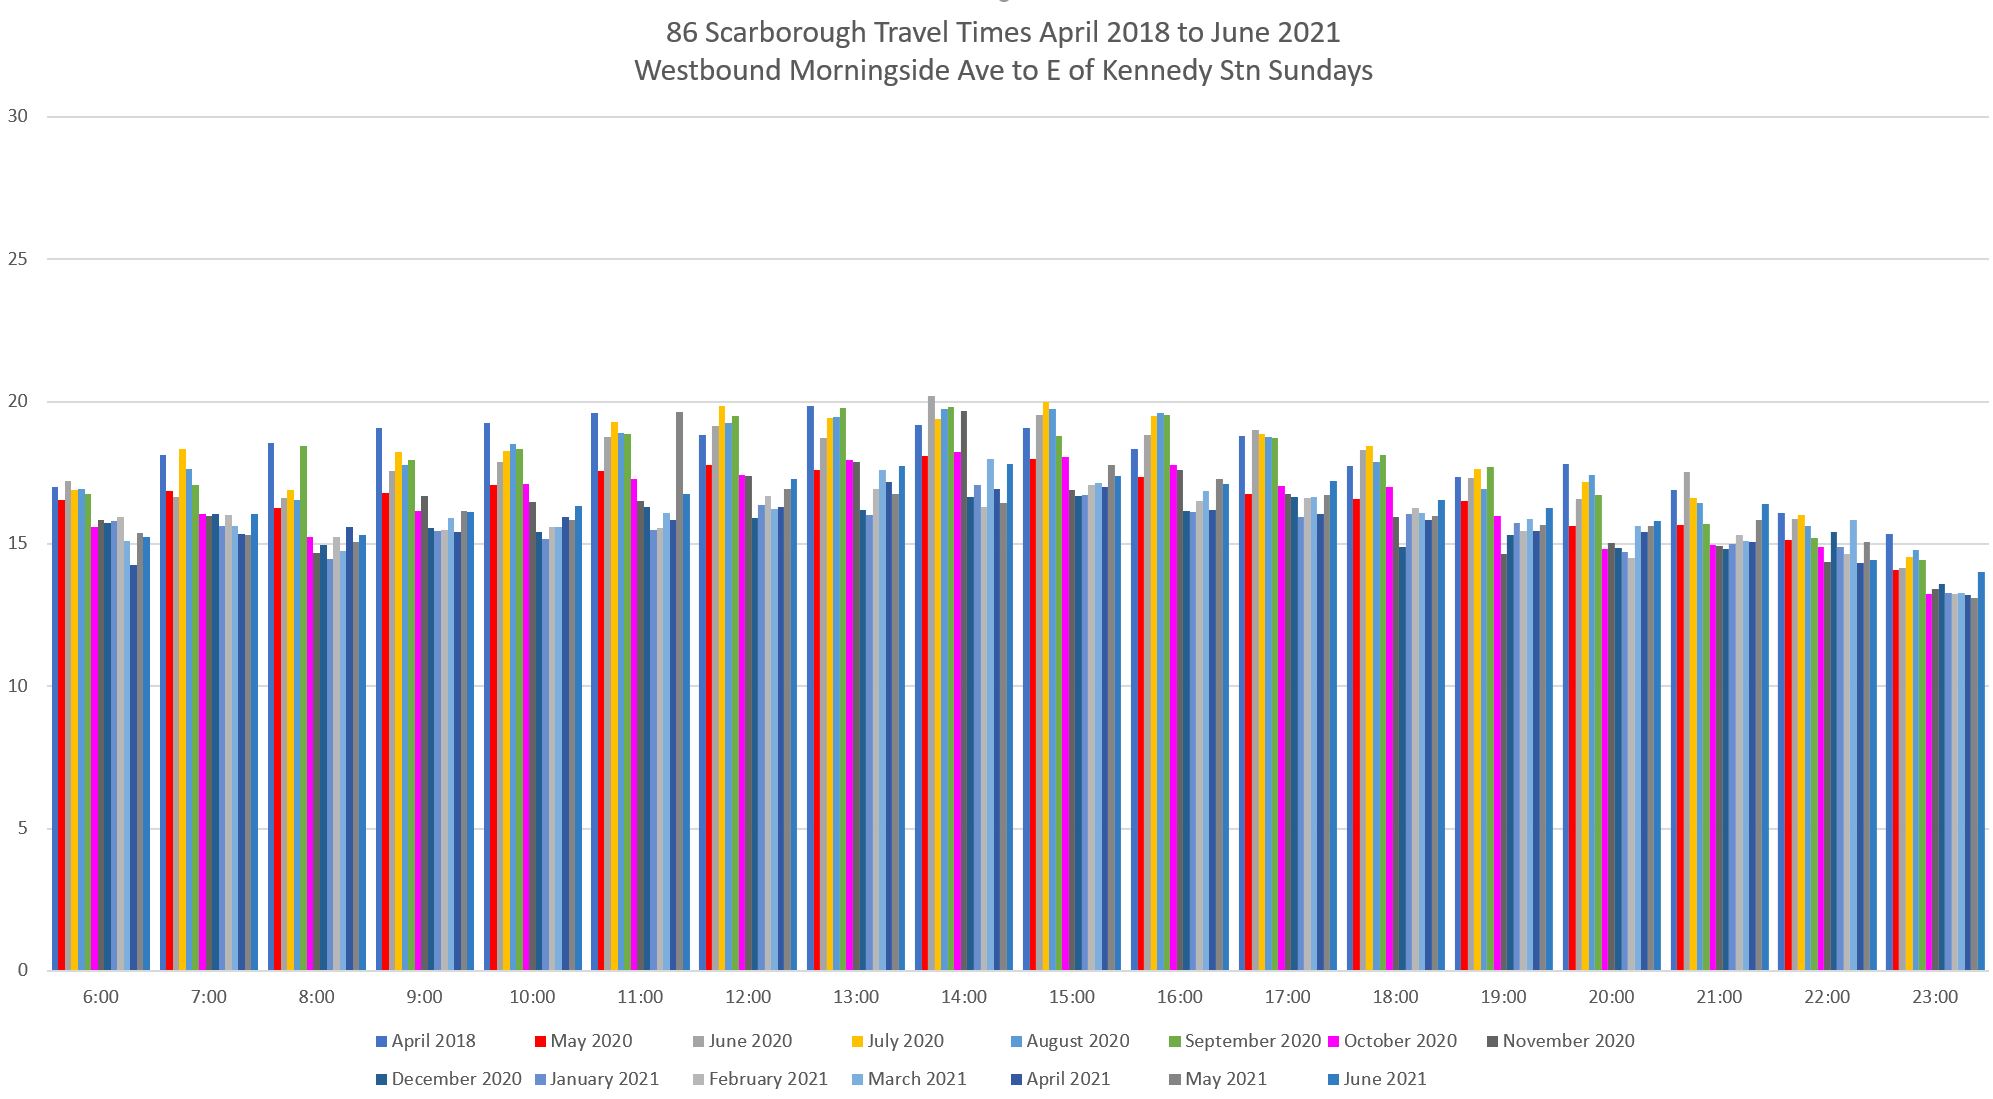
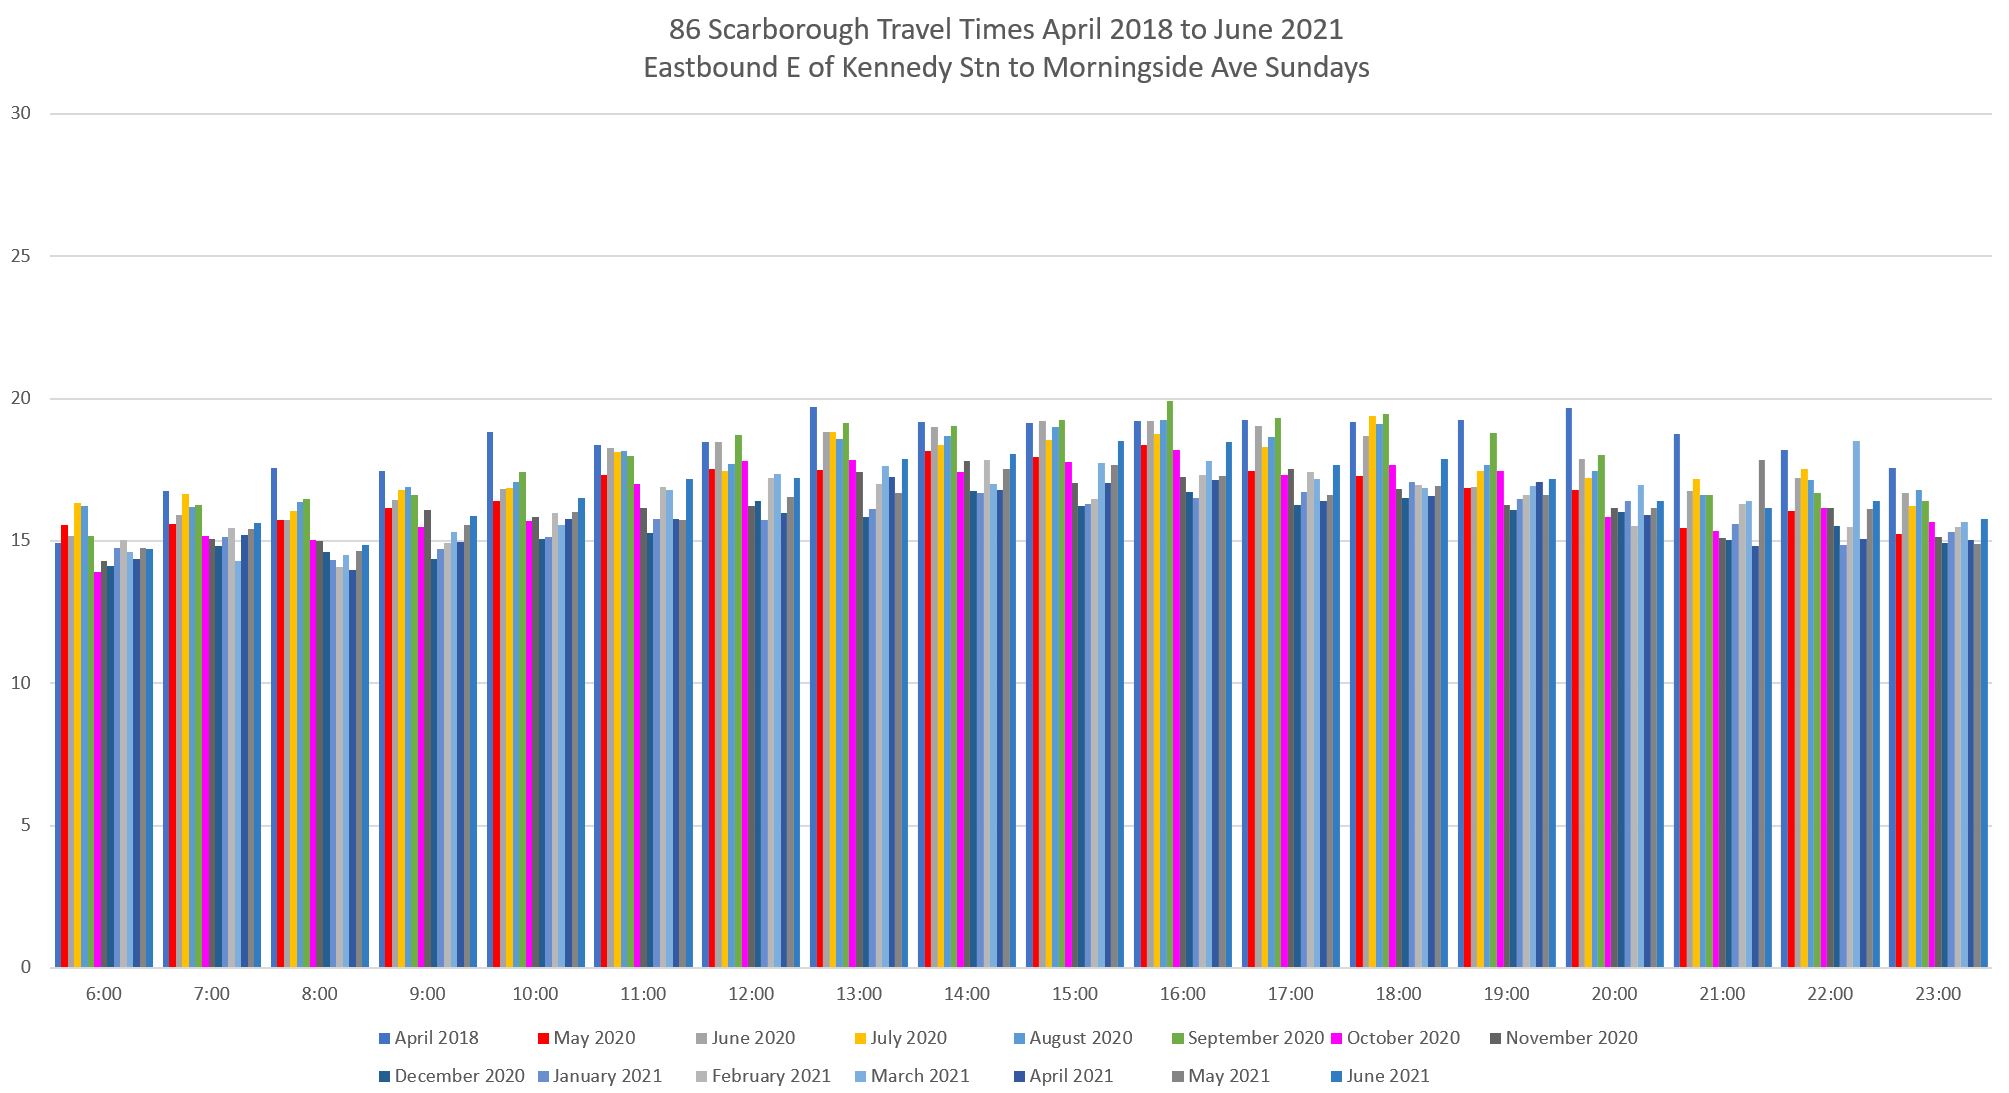
The effects are also visible on weekends. Here are the Saturday data. Note that there are no express trips in April 2018, and so the values shown here are for local trips during all months. The red bars in May 2020 show the drop in travel times due to lower traffic, but the times rise again through the Summer of 2020. The pink bars mark the change to red lanes and travel times stay at a lower level after they are in place.
That said, the saving is relatively small, and the real benefit is relative to pre-pandemic traffic conditions mainly during Saturday midday eastbound. The saving westbound is smaller.
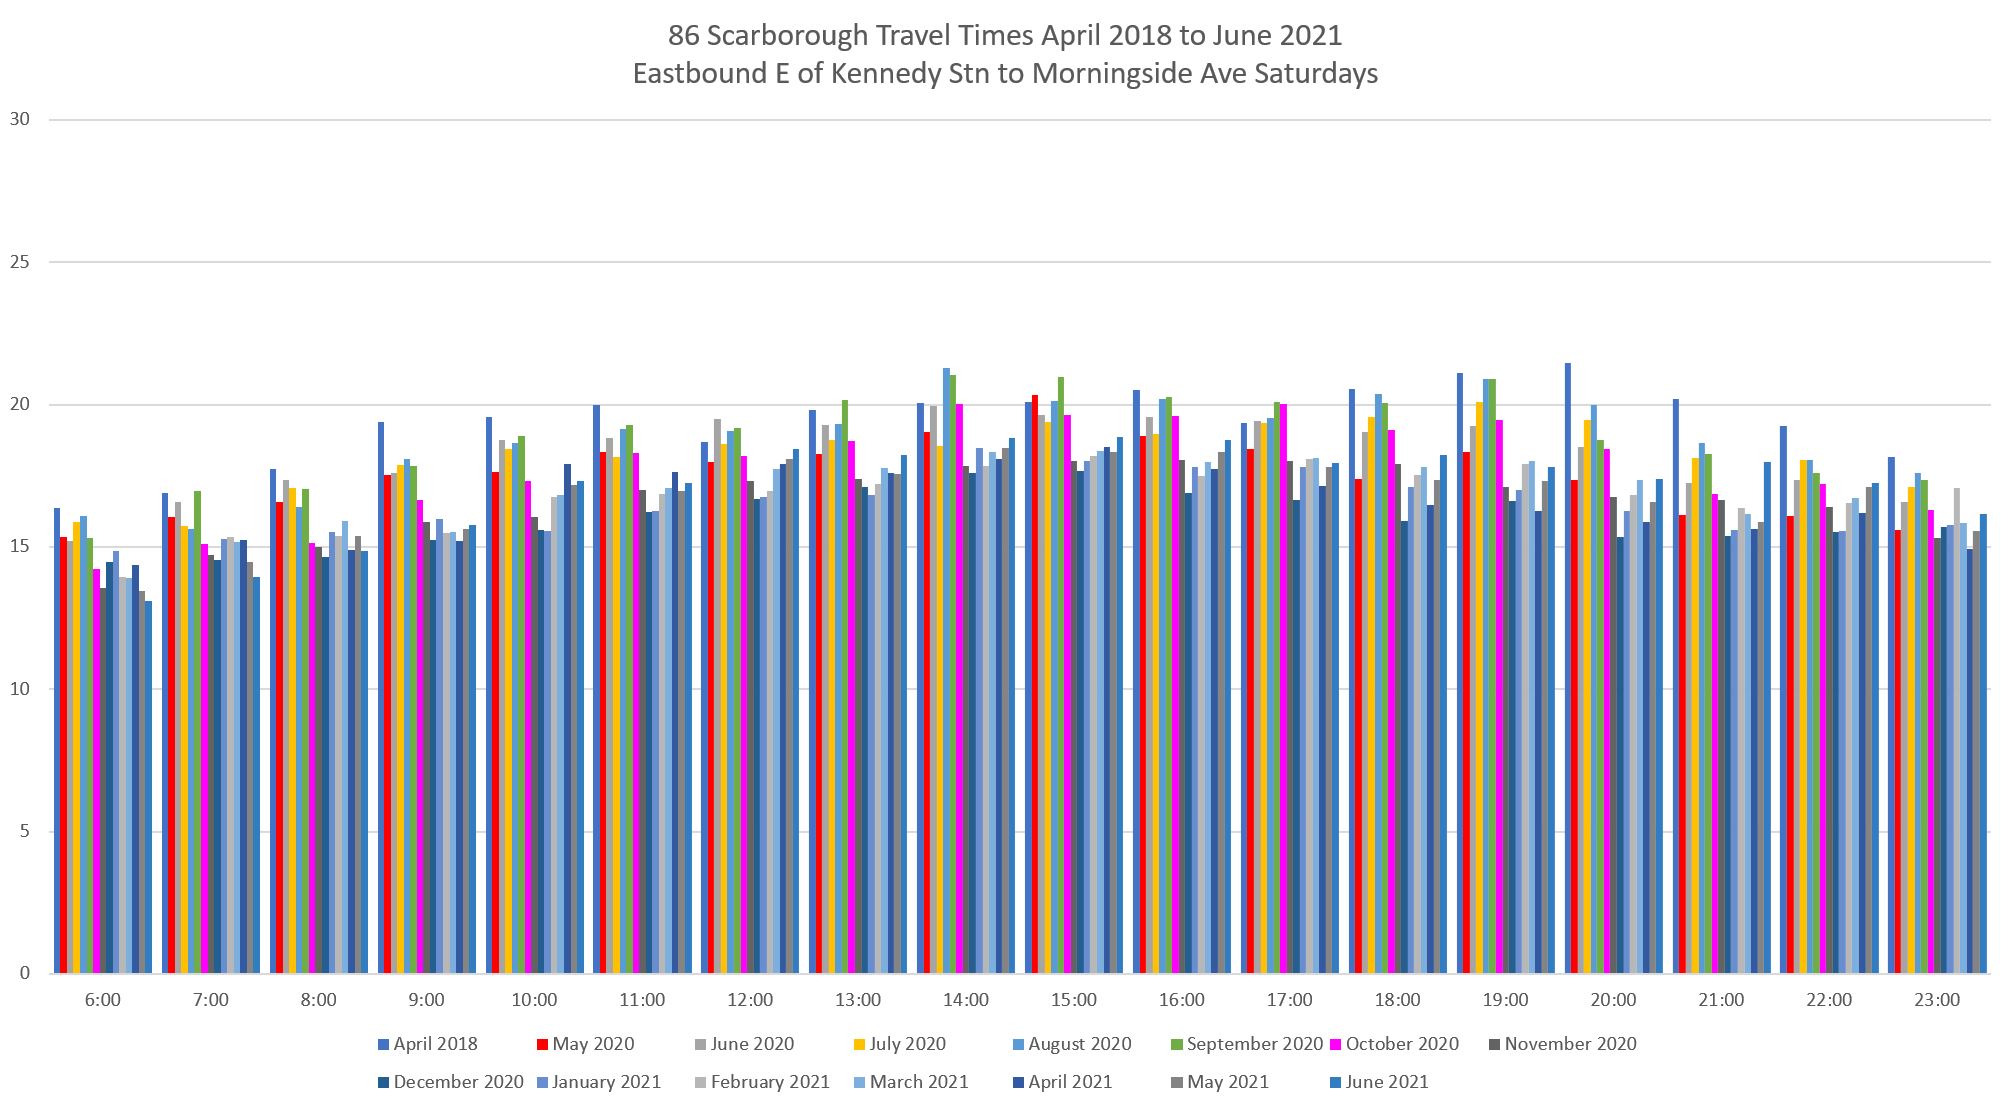
On Sundays, there is only a negligible effect from traffic reduction (red bars) and in many cases travel times rise until they drop back thanks to the red lanes and stop eliminations.
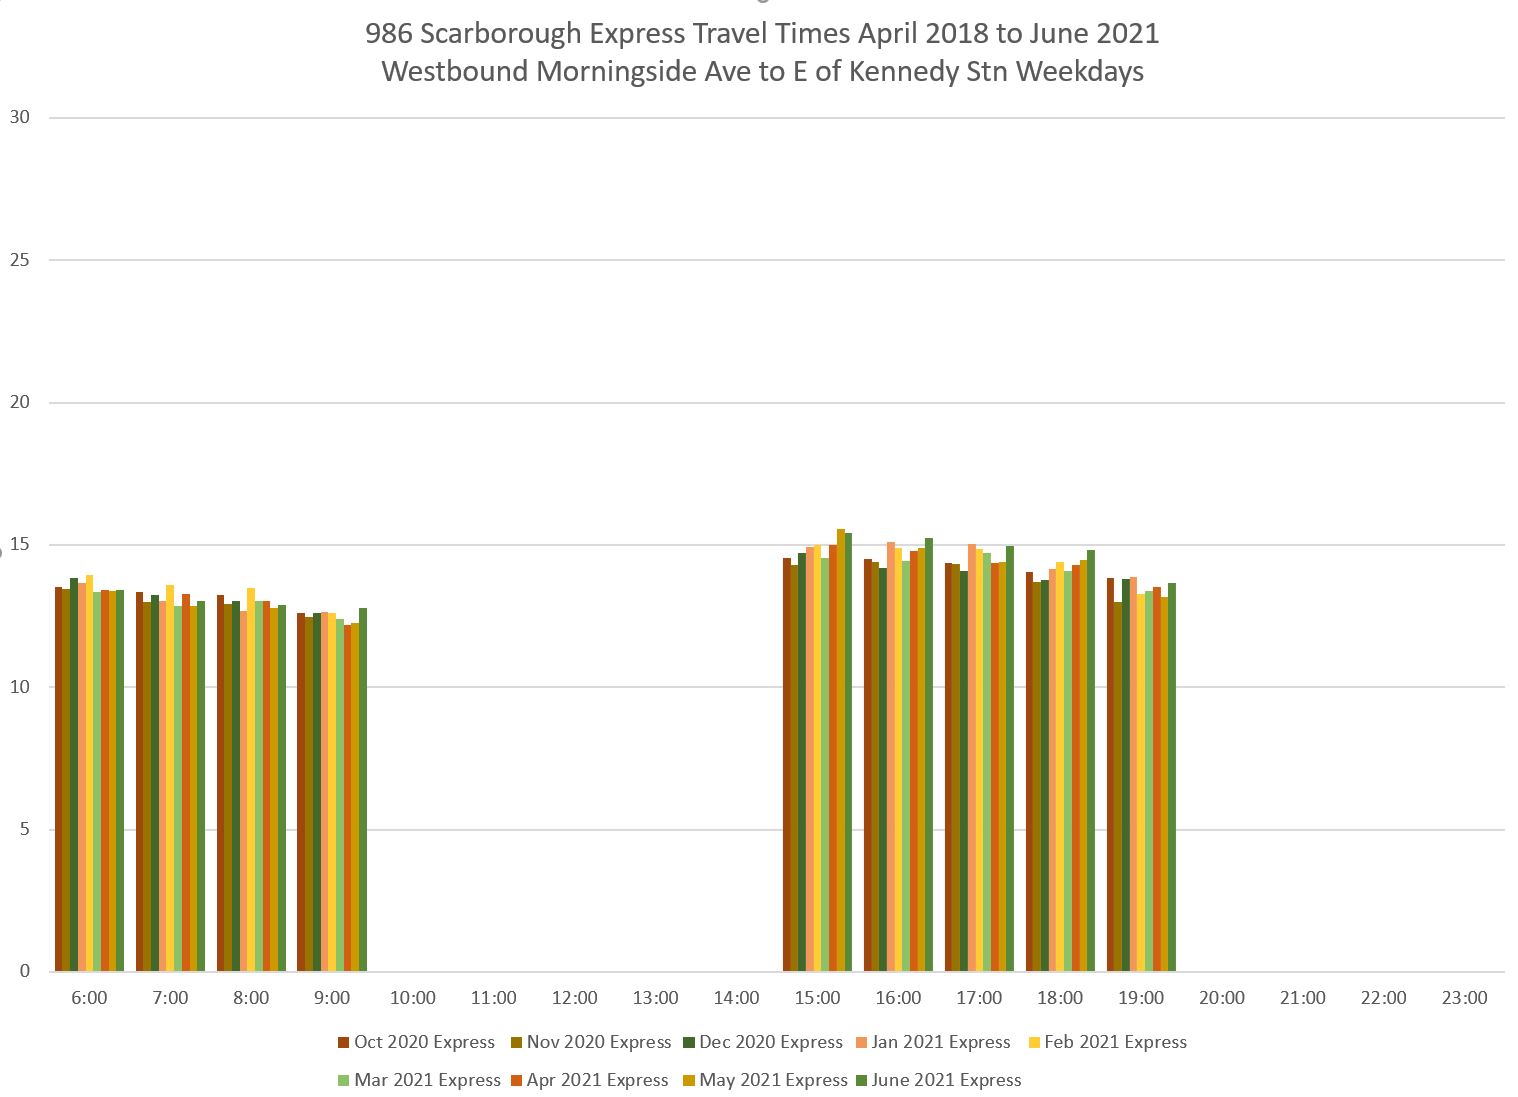
The 986 Scarborough Express began to operate in mid-October 2020, and its travel times have remained consistent through to June 2021.
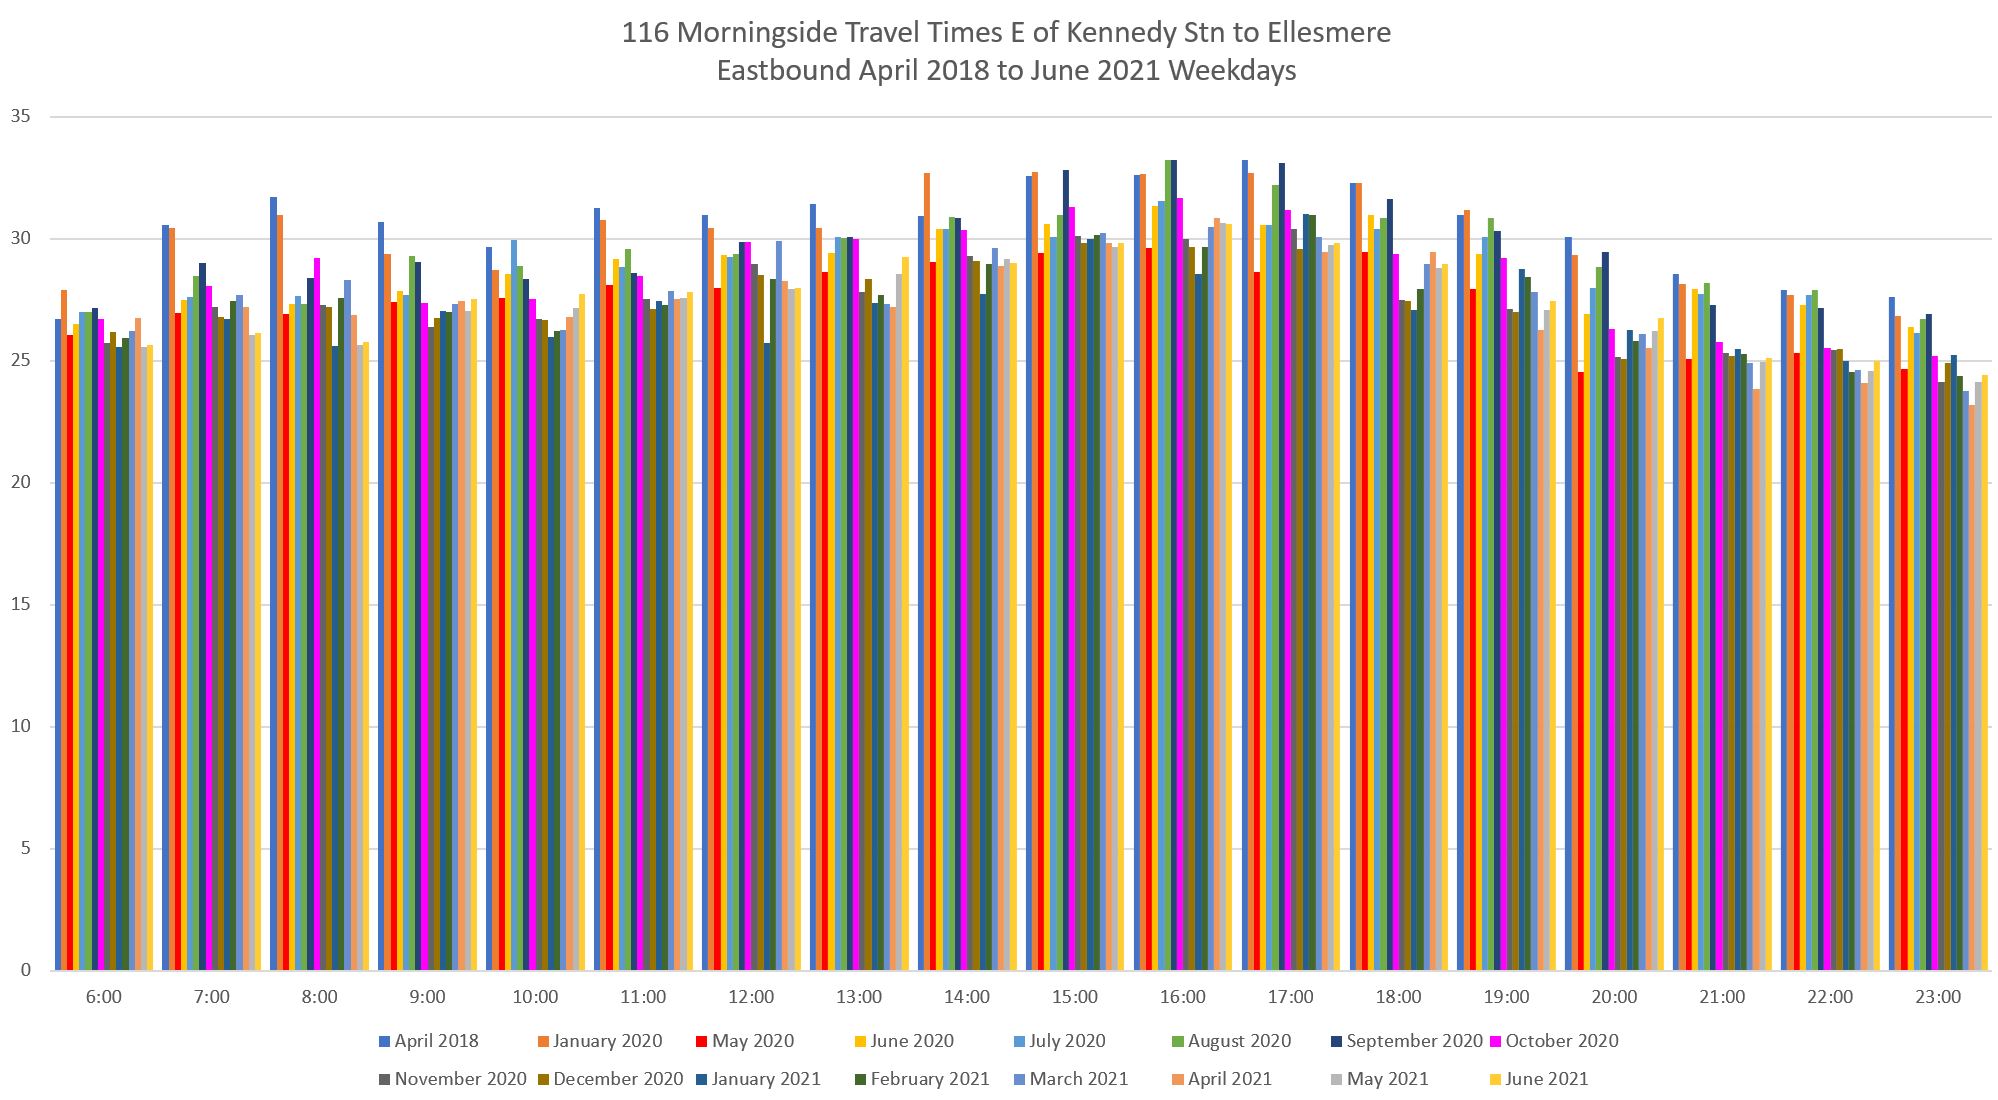
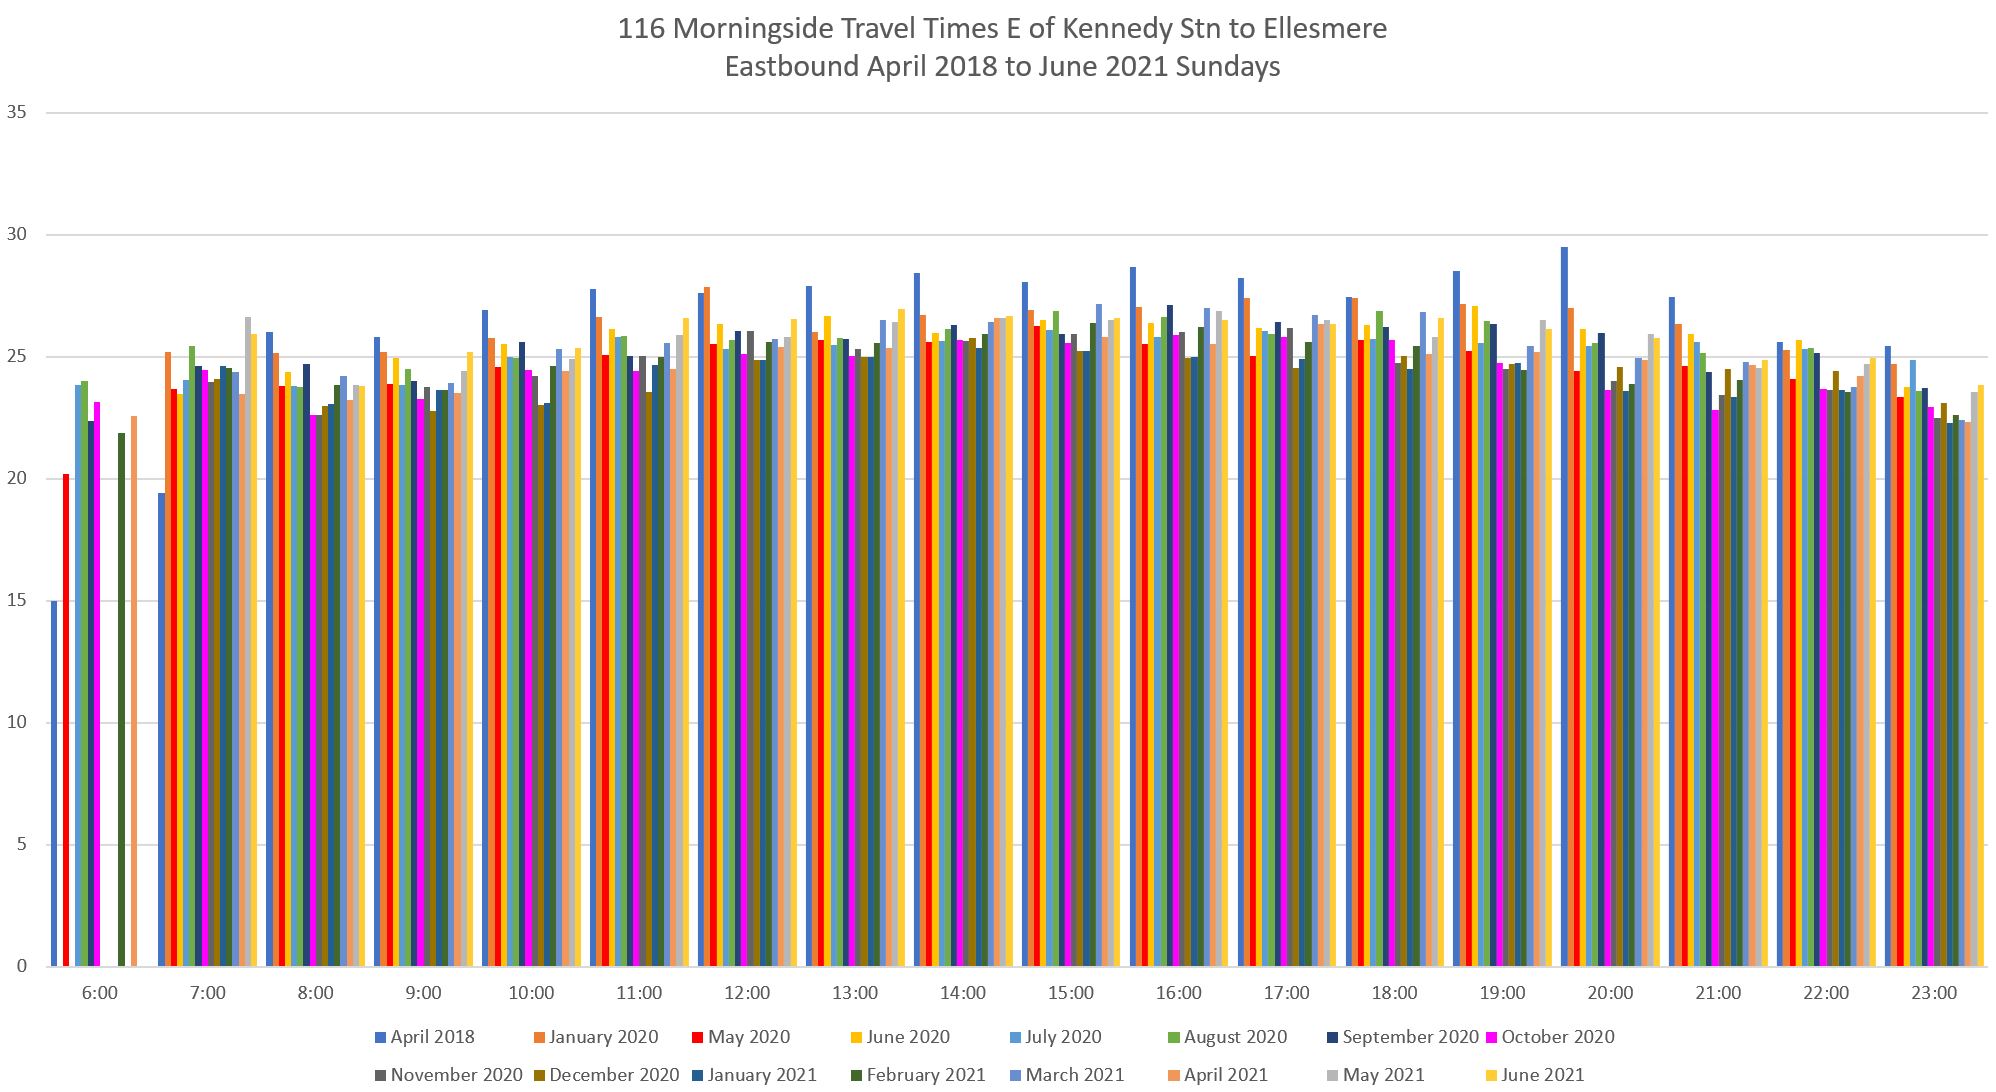
116 Morningside
The 116 Morningside bus has no direct express equivalent, although the 905 Eglinton East Express (see following section) does duplicate the inner and outer parts of the 116 route.
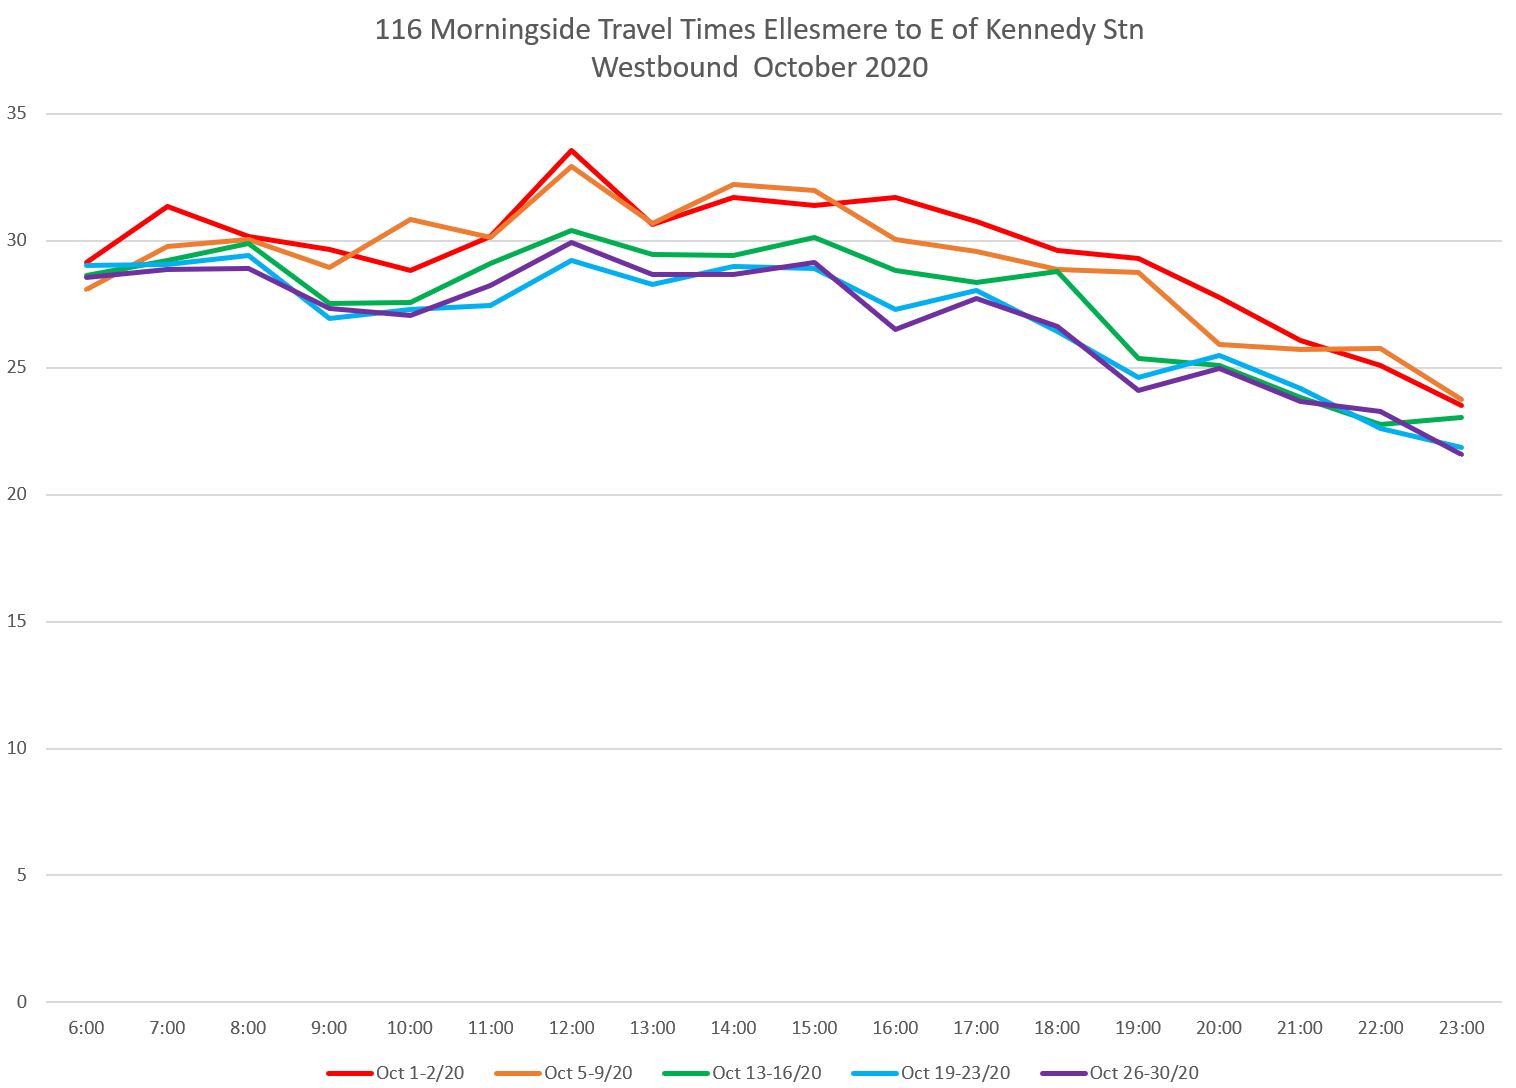
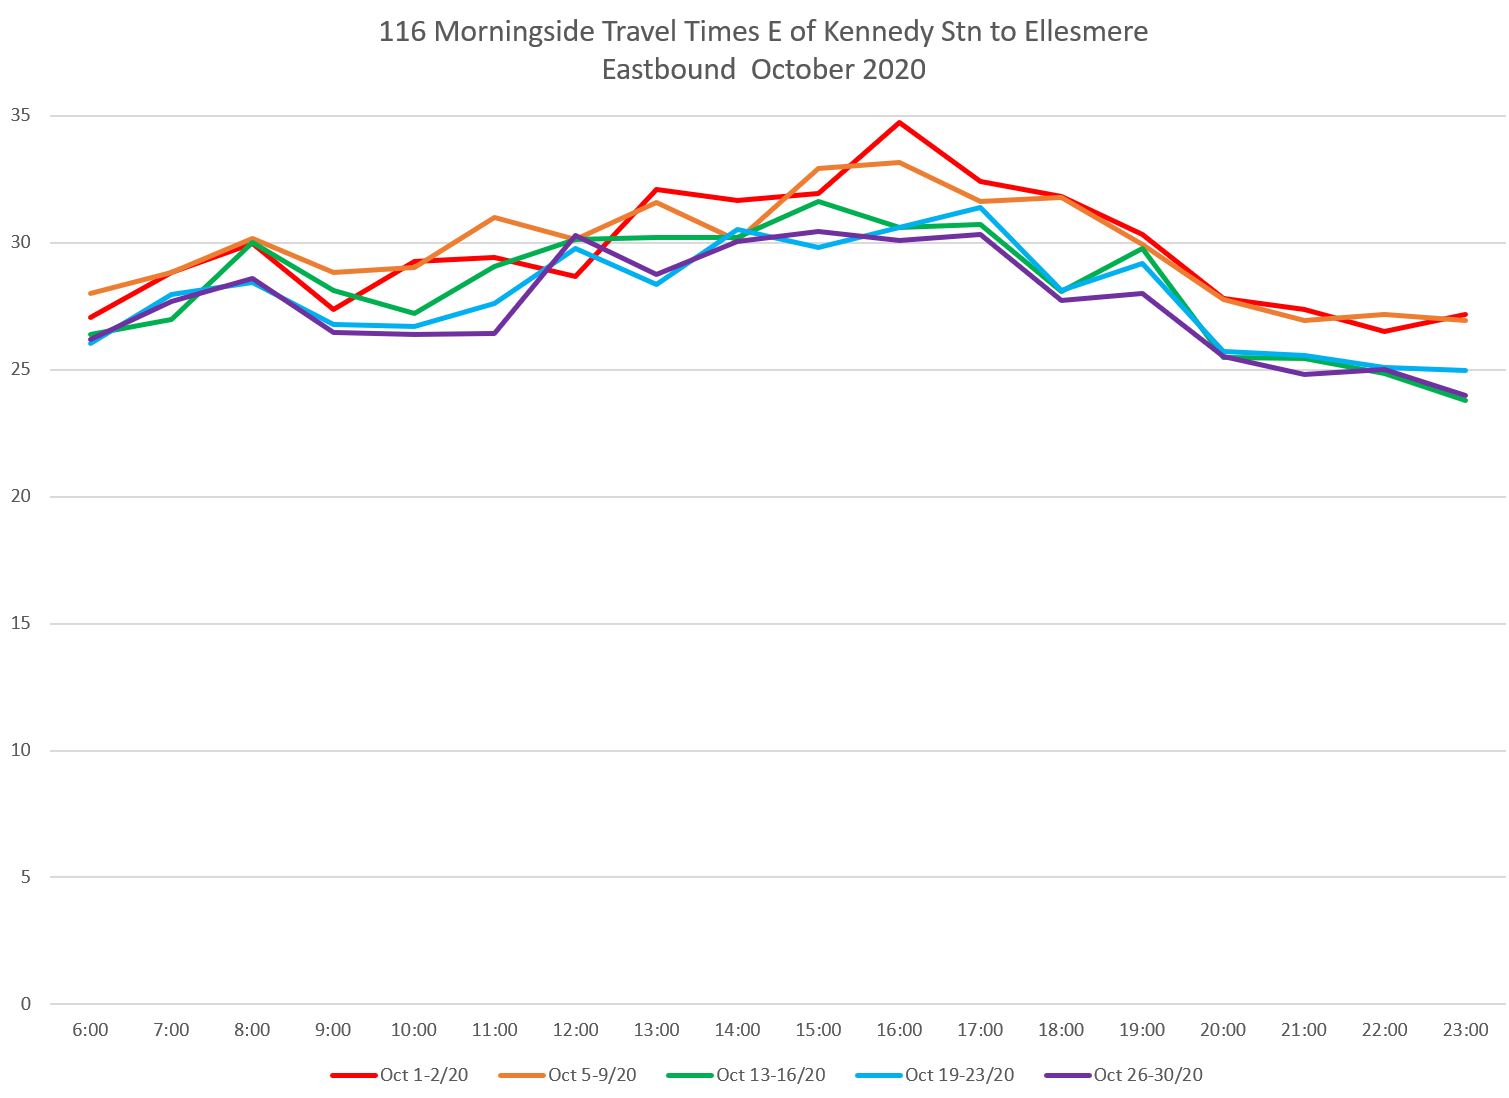
The 116 Morningside bus runs on red lanes on Eglinton Avenue and Kingston Road to Guildwood Parkway, and on Morningside from Kingston Road to Ellesmere.
The change in travel time in mid-October 2020 is not as striking for the 116 as it was on the 86 Scarborough above.
Looked at over a range of months, there is a drop in May 2020 (red bars) corresponding to reduced traffic although this is partly recovered in following months. The introduction of red lanes in October 2020 brings some improvement although that is being whittled away. (Remember that October is a transitional month with two weeks of pre-red lane data. The following month shows the full effect of the red lanes such as it is.)
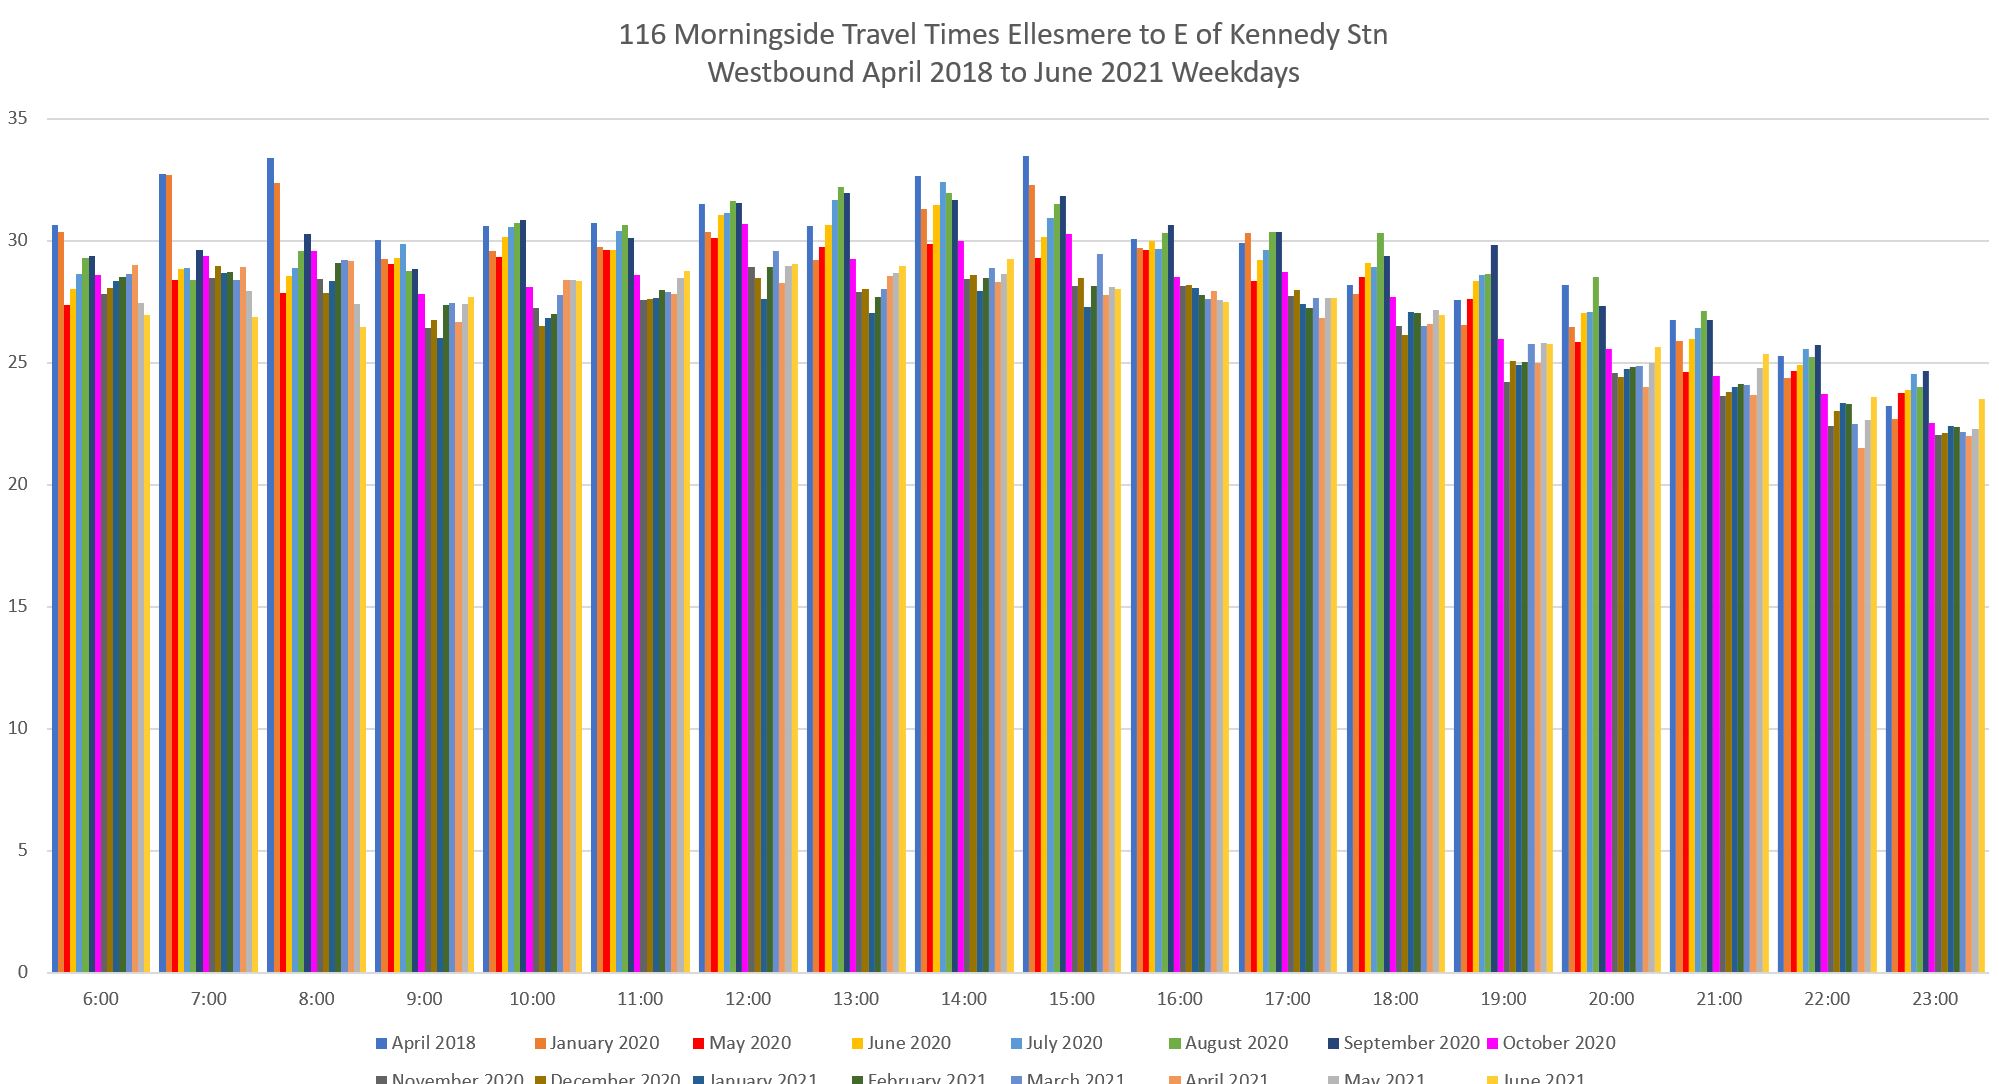
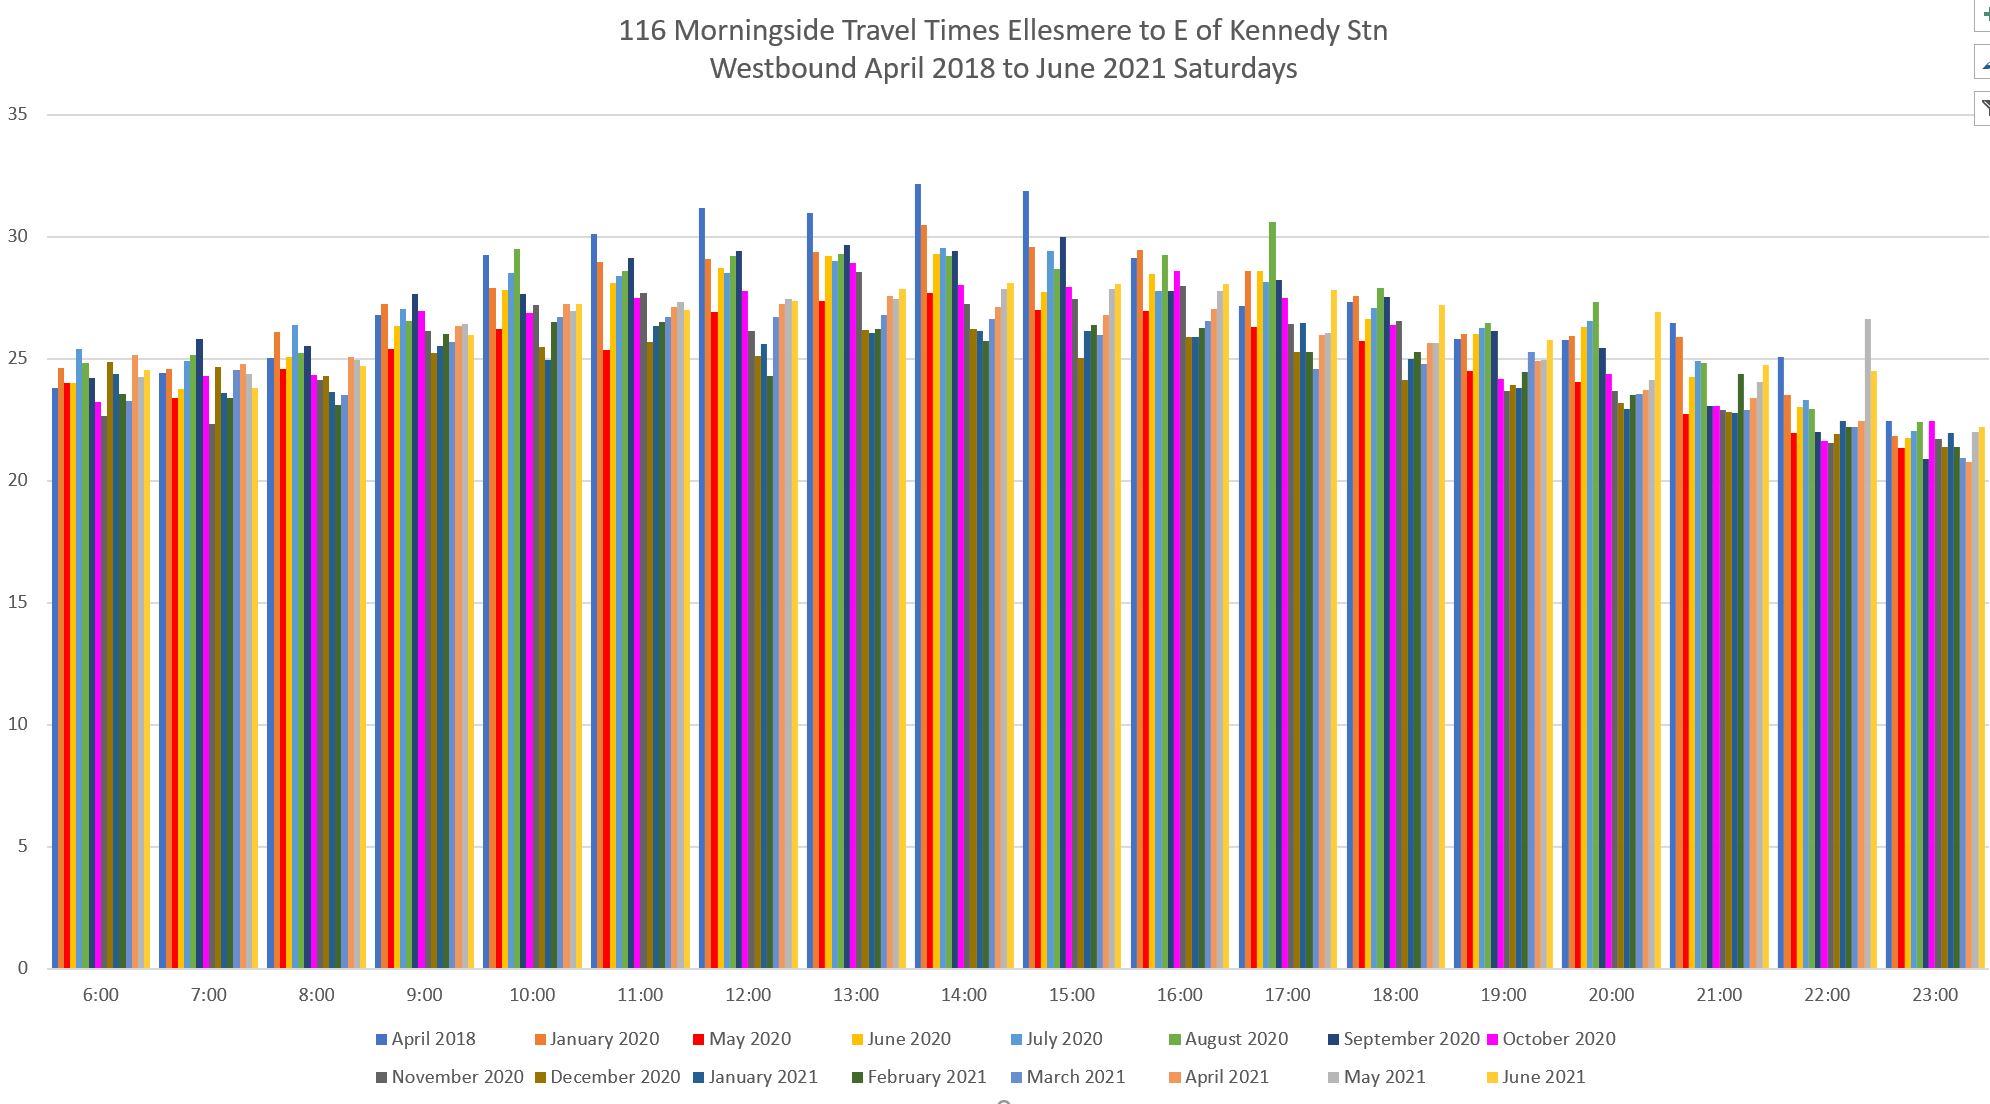
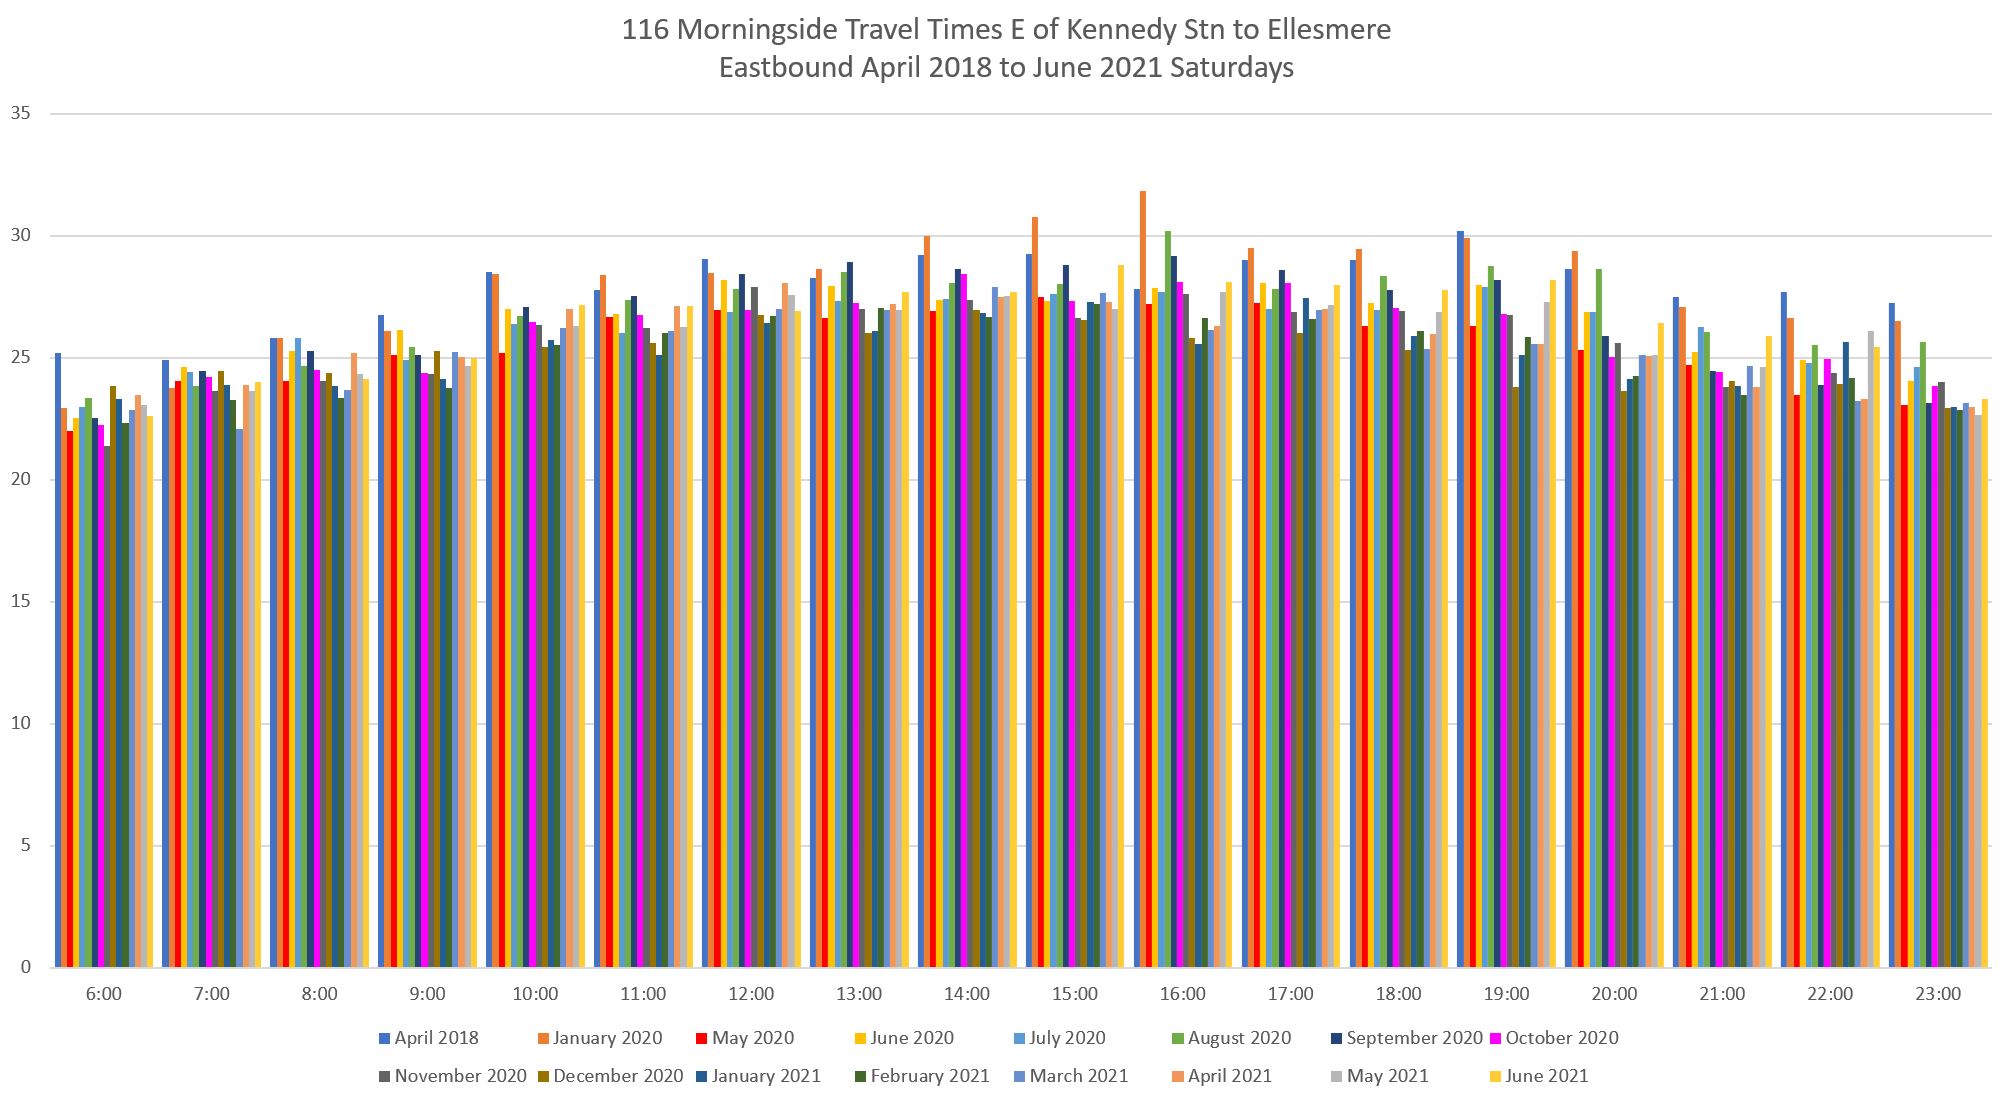
Saturdays show some reduction in travel times in May 2020, and a smaller change, some of which has been lost since, in October 2020.
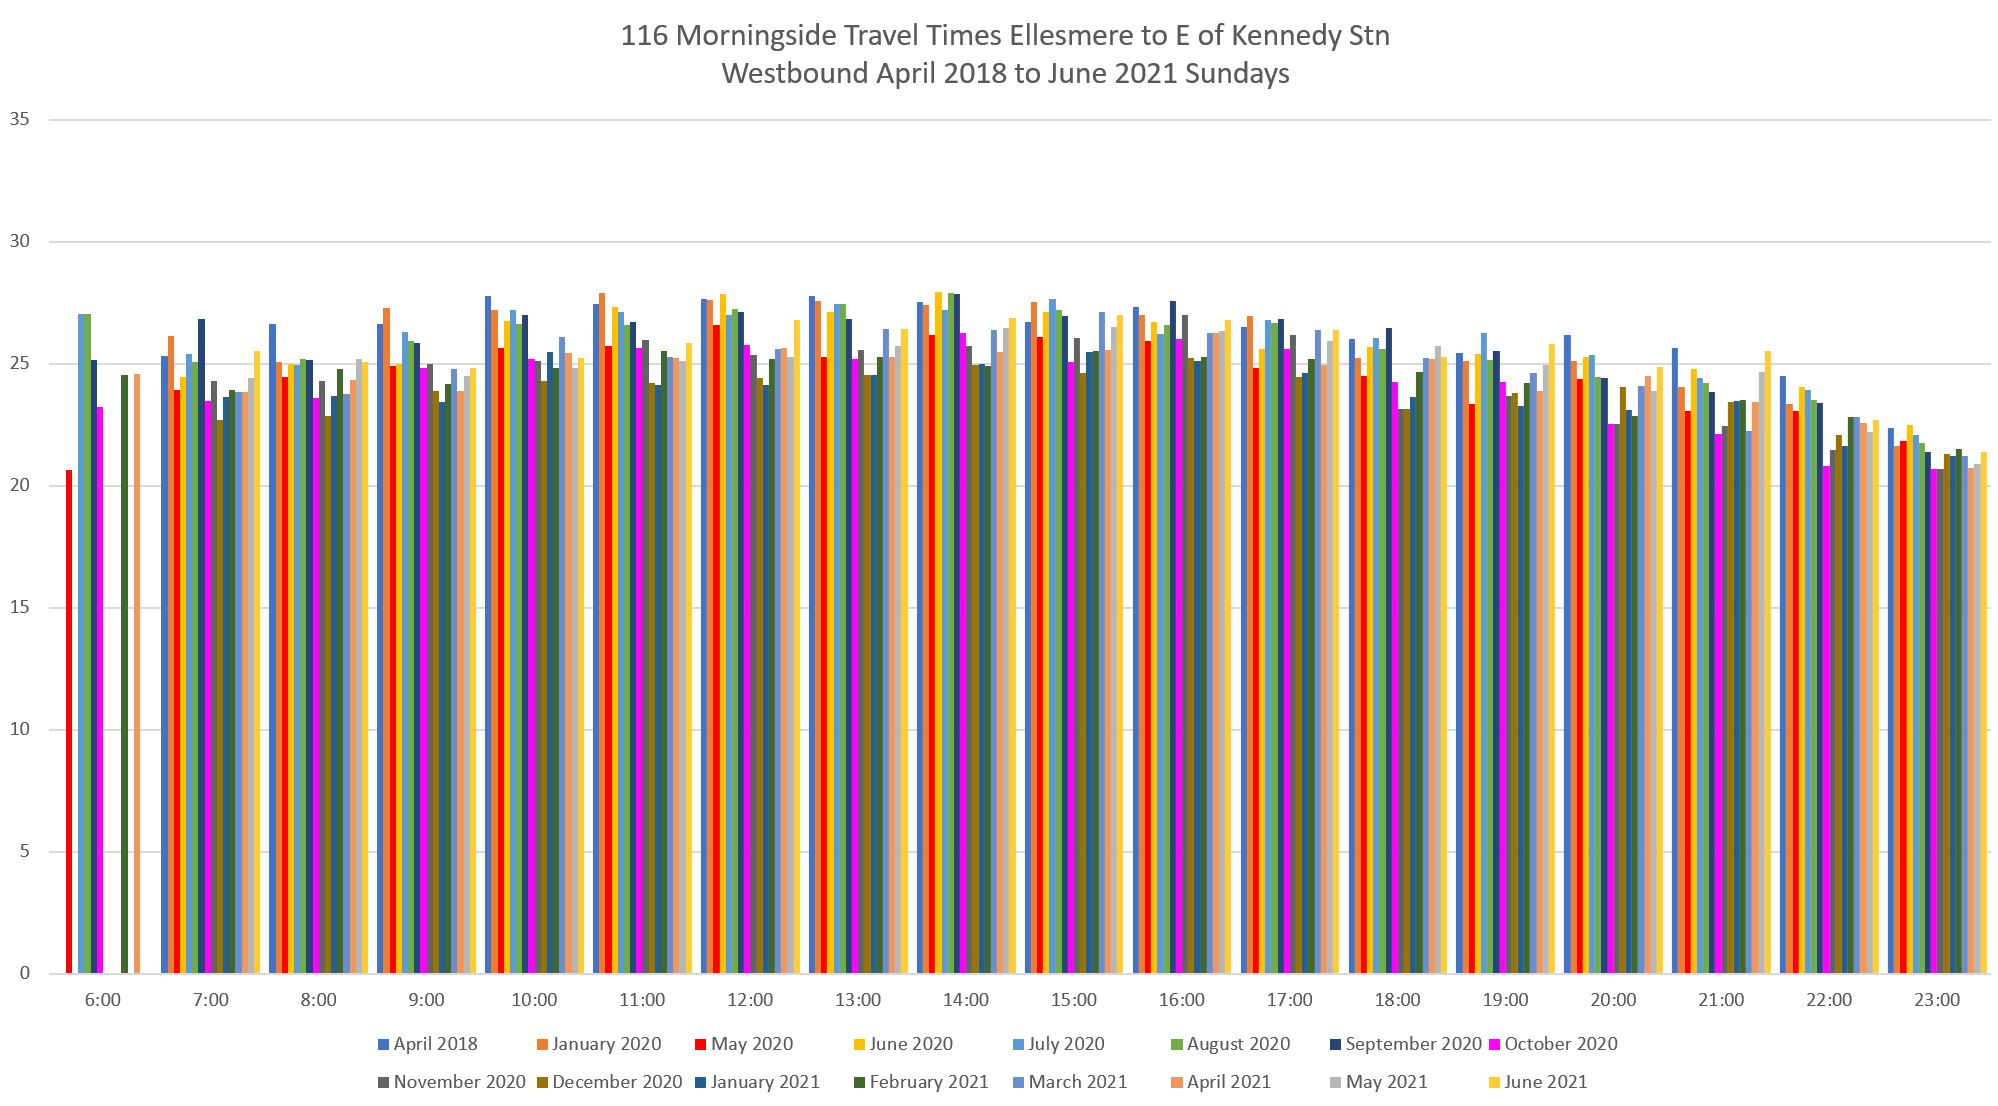
Sundays show even less difference between the three eras of pre-pandemic, pre-red lanes and post-red lanes.
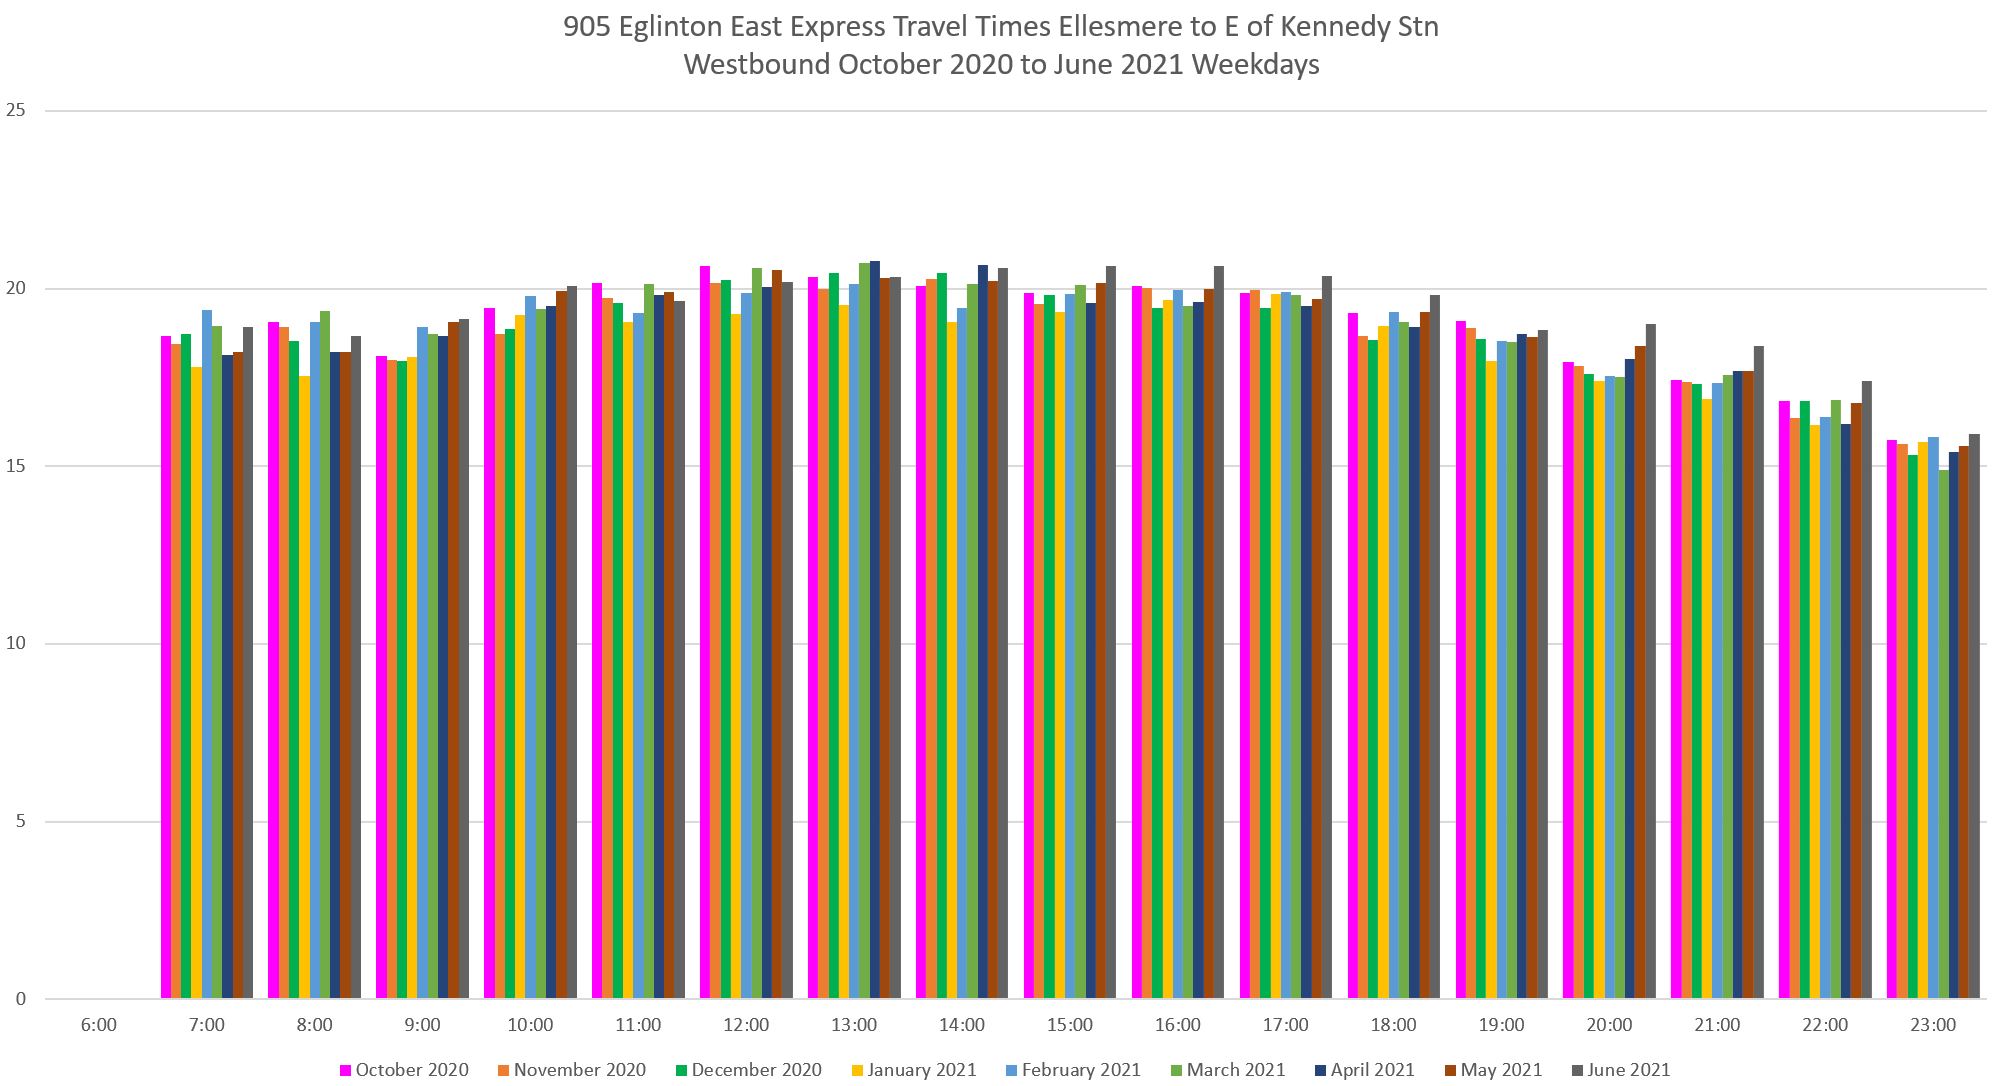
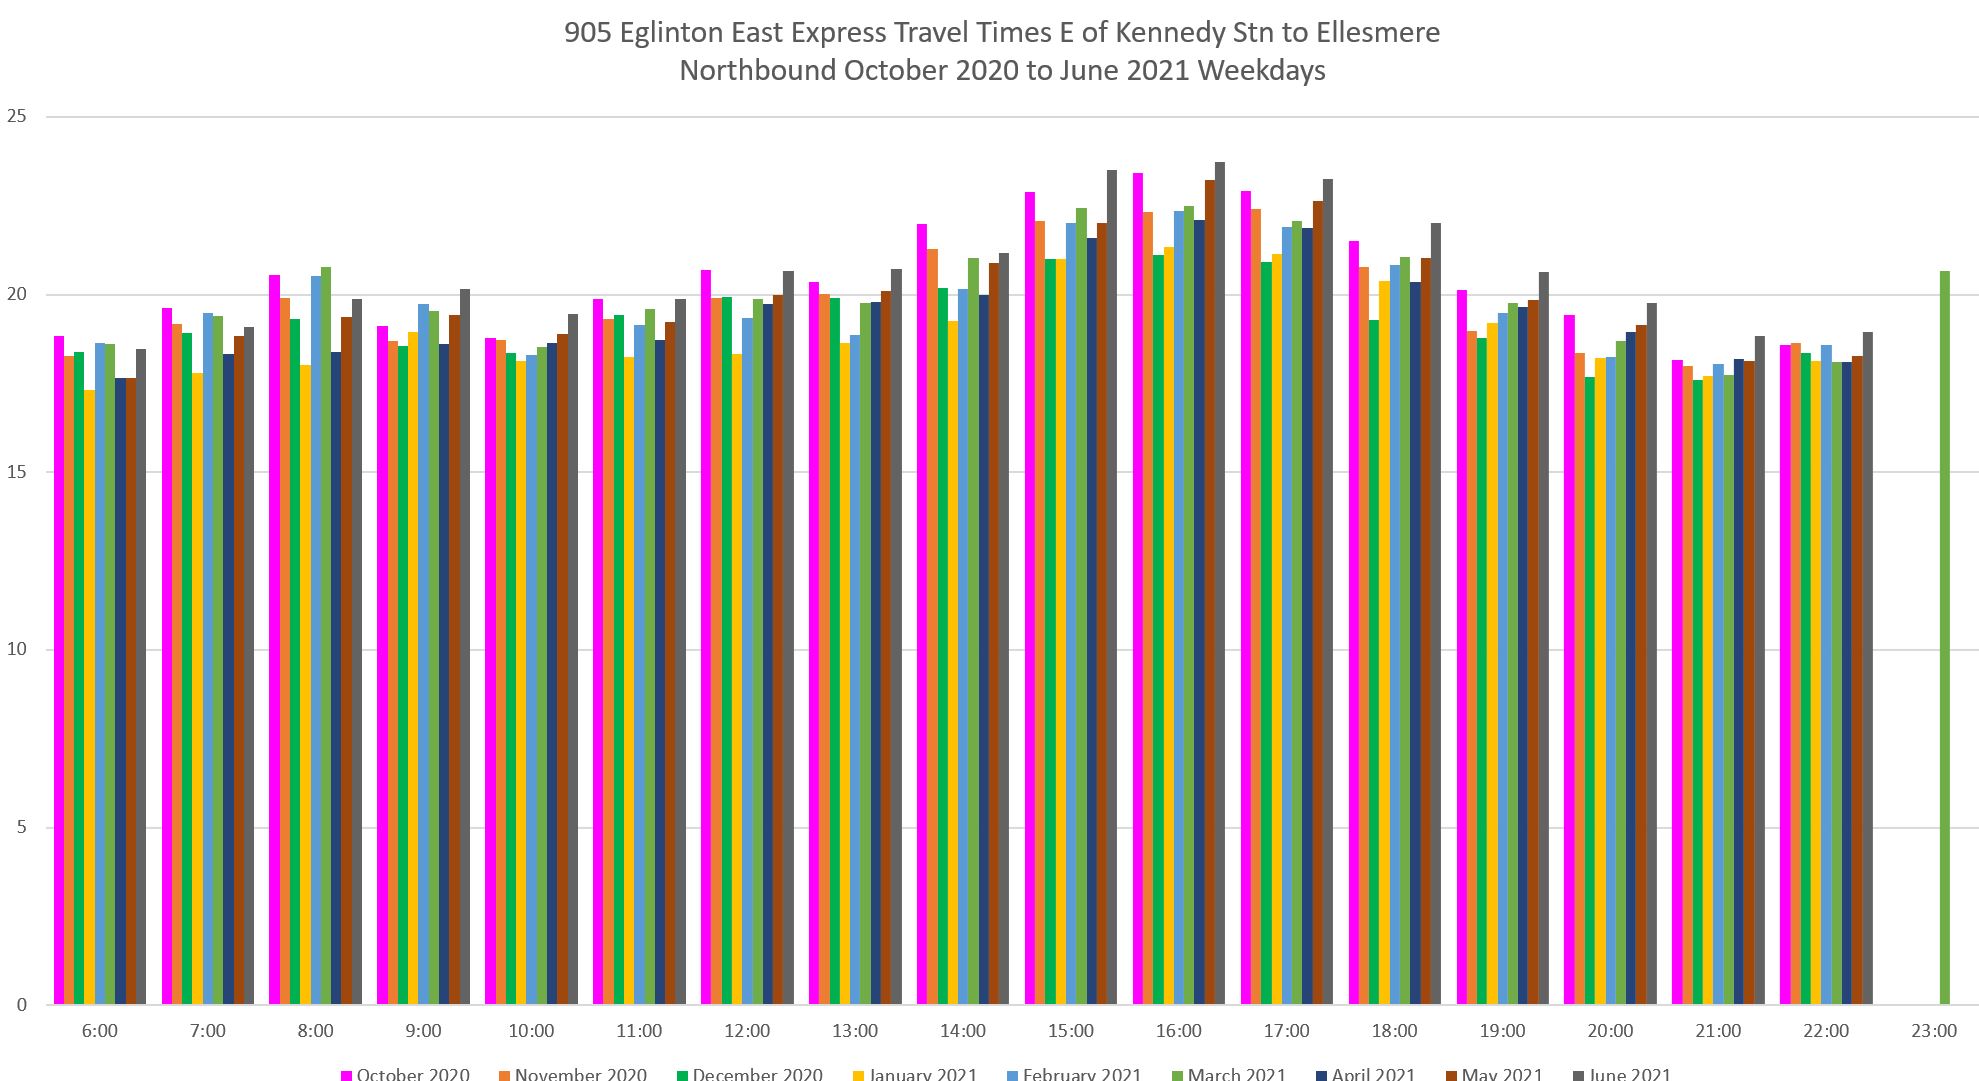
905 Eglinton East Express
The 905 Eglinton East Express operates over the entire length of the red lanes from east of Kennedy Station to Morningside and Ellesmere. However, I have no “before” data for this route I was not tracking the 905 nor its predecessor 198 UTSC Rocket before the express services were suspended for the pandemic.
The data below begin with the route’s restoration in October 2020. There is a slight dip in travel times in December and January 20/21 which is caused by the holiday period, but otherwise the travel times have stayed quite constant on this route. Weekend times show a similar pattern (the charts are available in the Full Chart Sets section at the end of the article).
Headway Management
All of the benefits, such as they are, of faster trips, however they might be achieved, can be undermined if service is unpredictable. Even if riders “get lucky” on some days and make good connections, they have to plan on arriving at stops during a service gap. That adds to their travel time possibly undoing the benefit of faster on-board trips, and affects the perceived quality of service because wait time annoys riders more than on-vehicle time, especially during periods of bad weather. In the pandemic era, there is also the possibility that the first bus to show up will be more crowded than some riders will tolerate.
In this section, I will review actual headways (the time between buses) near terminals of various lines, the only location where the TTC even measures reliability, for June 2021.
86 Scarborough
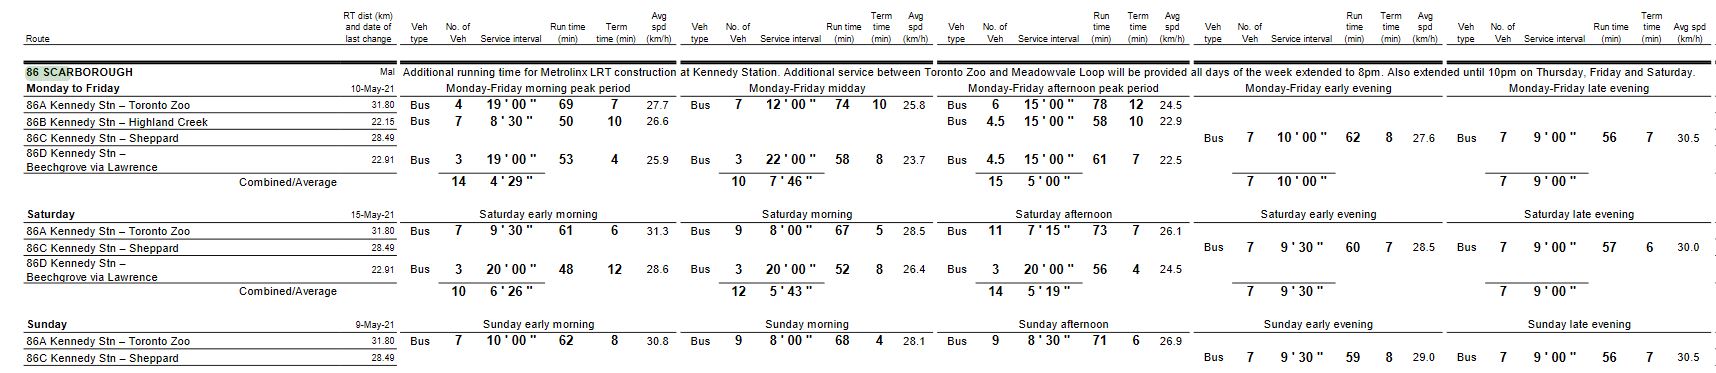
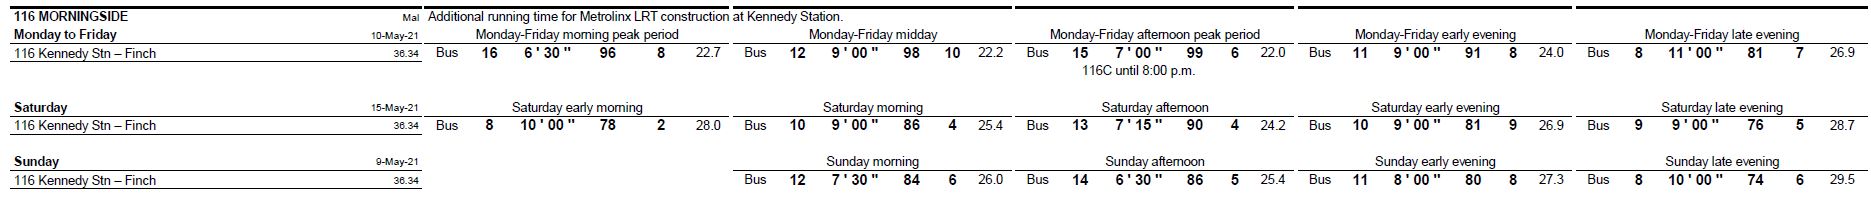
For reference, here are the scheduled headways on 86 Scarborough. During the AM peak there are two services, 86A and 86D on a common 19 minute headway that should blend to every 9’30”. There is a separate 86B service running only to Highland Creek every 8’30” that cannot blend with the other two branches. In the PM peak, all three services operate every 15 minutes and should in theory blend to provide a 5 minute combined headway over the common portion of their route.
Midday and weekend headways on the 86A Zoo and 86D Beechrove services do not blend and irregularity is “built in” to the schedule.
Here is what the actual service in the first week of June looks like eastbound from Kennedy Station. Each dot is one bus, and the colour indicates the day. The actual range of headways leaving the terminal vary from zero to over 15 minutes.
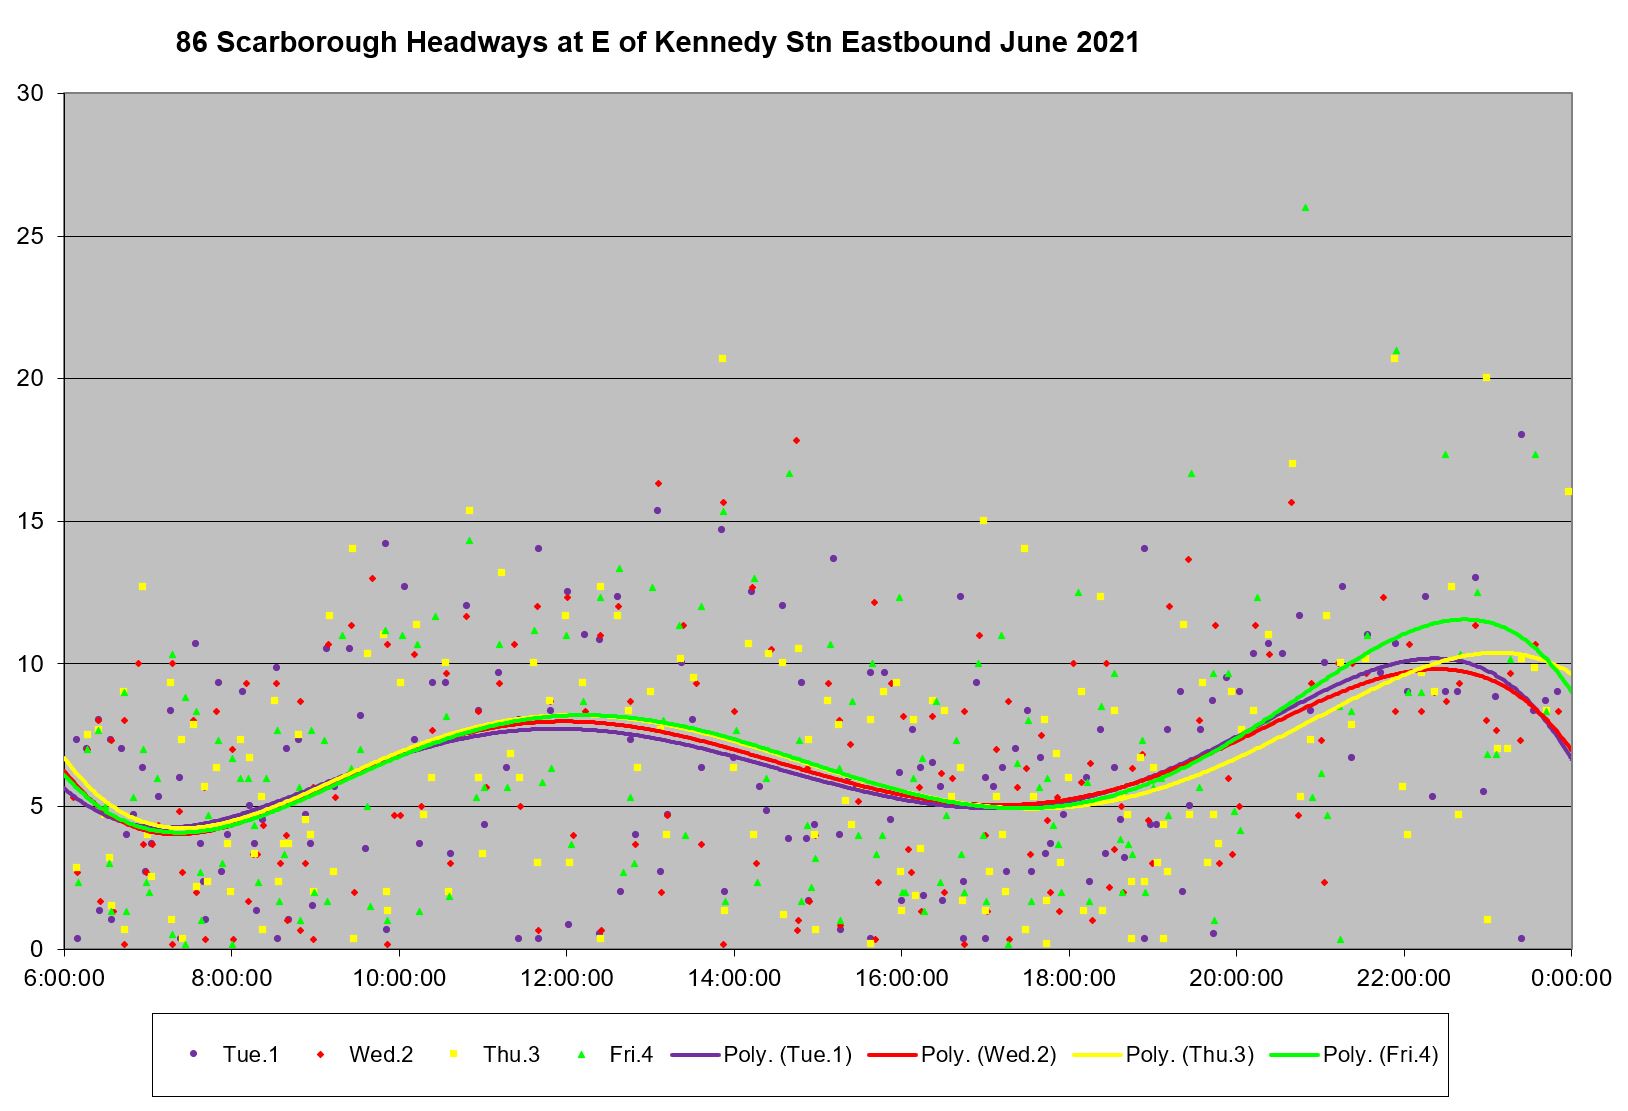
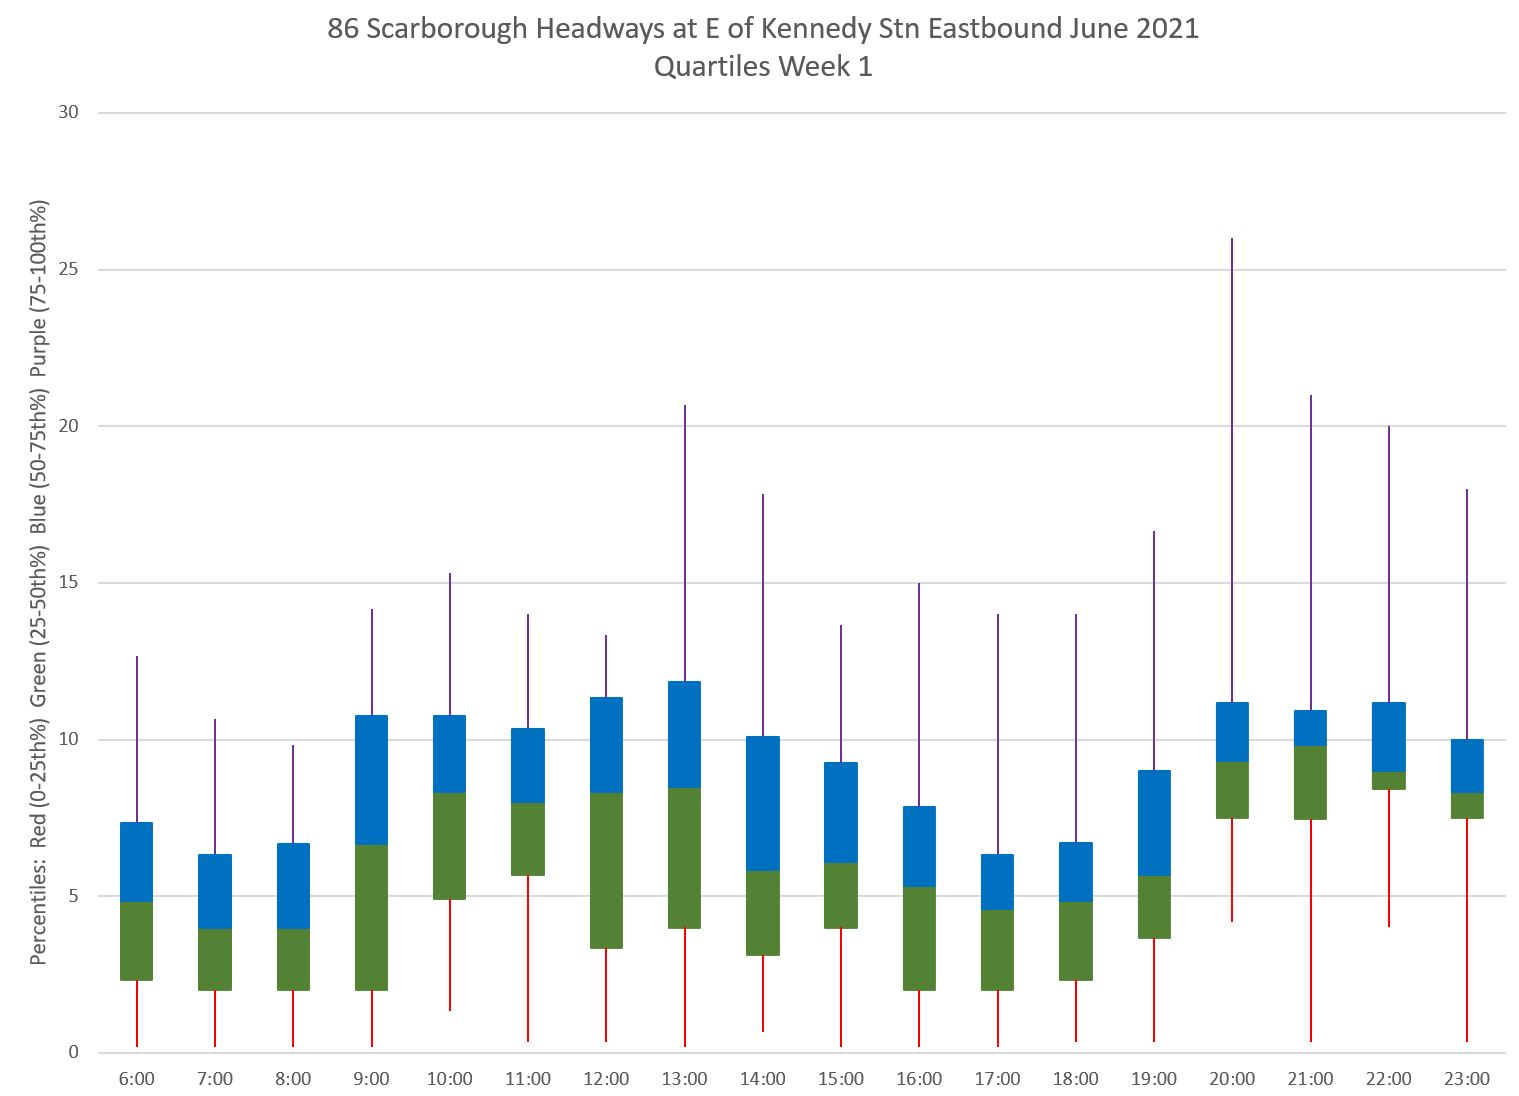
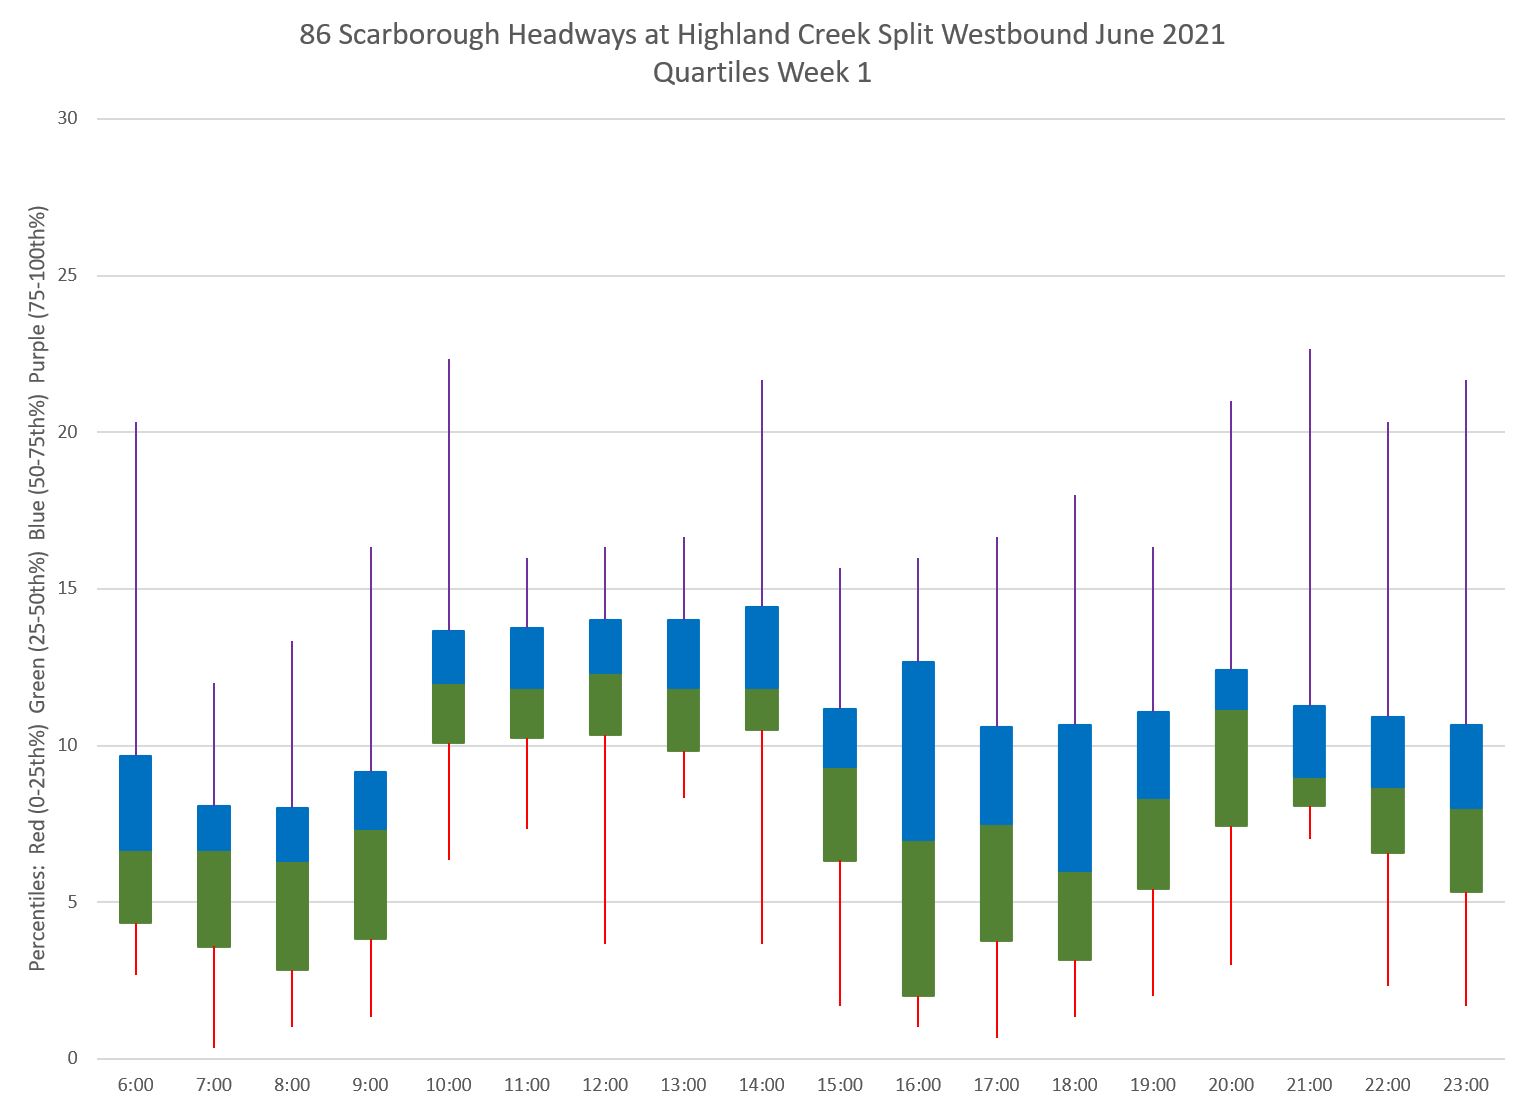
Another way to look at this is to split the range of values for each hour, combining the five weekdays together, into quartiles. The blue and green blocks in the middle of each bar show the range of the second and third quartiles (half of the service) while the red and purple tails are the outer half. This is most definitely not a service that meets the TTC’s goal of a six-minute allowable range of headways (no more than 1 minute early, and up to 5 minutes late).
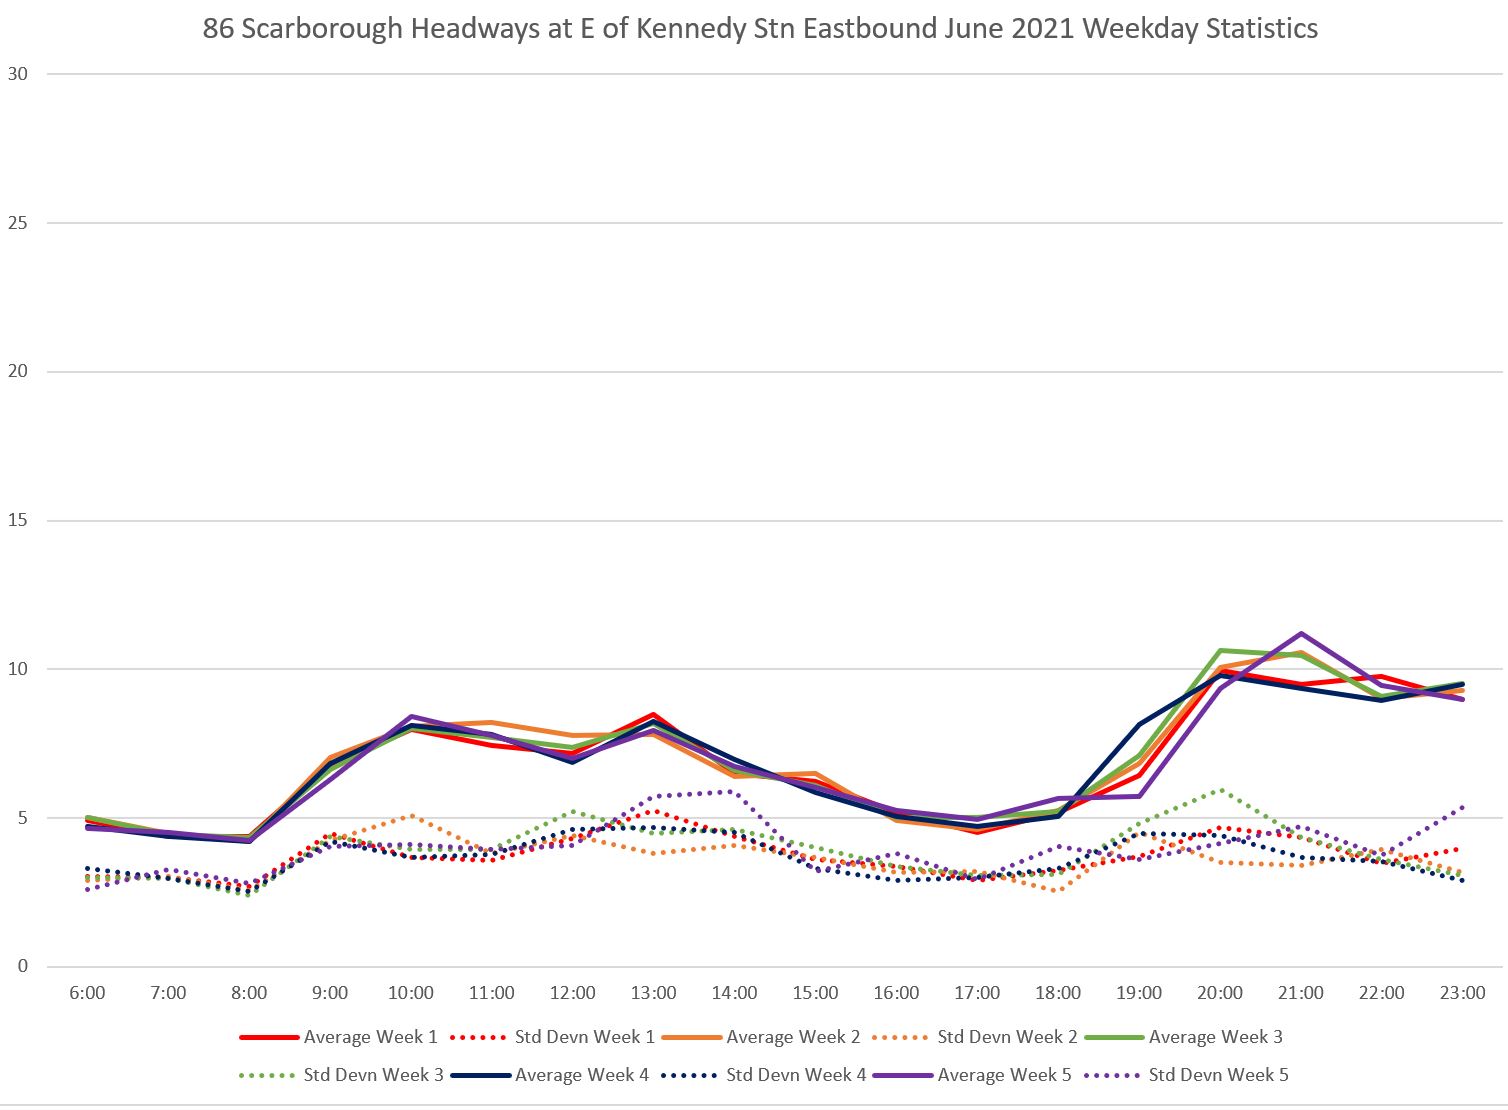
Looking at the full month with each week’s data on the same chart gives the plot shown below. This shows how averages can give a false sense that “everything’s just fine”. The average values for all five weeks follow more or less the same path, but the big problem is the dotted lines showing the standard deviation in the values. This is quite high, cresting over 5 minutes in places, and shows that the individual values can lie well away from the average. That is what we see in the cloud of dots above and the wide ranging quartiles.
The situation westbound is complicated by three merging branches. A common situation on branched routes is that there is no headway management where services combine together, and that is even if each branch operates on a common headway.
Leaving the Zoo, scheduled headways are wider, and service variations can cause bigger gaps. The service is reasonably well-behaved most of the time with a few outliers among the values.
This shows up in the quartile charts where, for the most part, headways are clustered around the median value (the boundary between the 2nd (green) and 3rd (blue) quartiles.
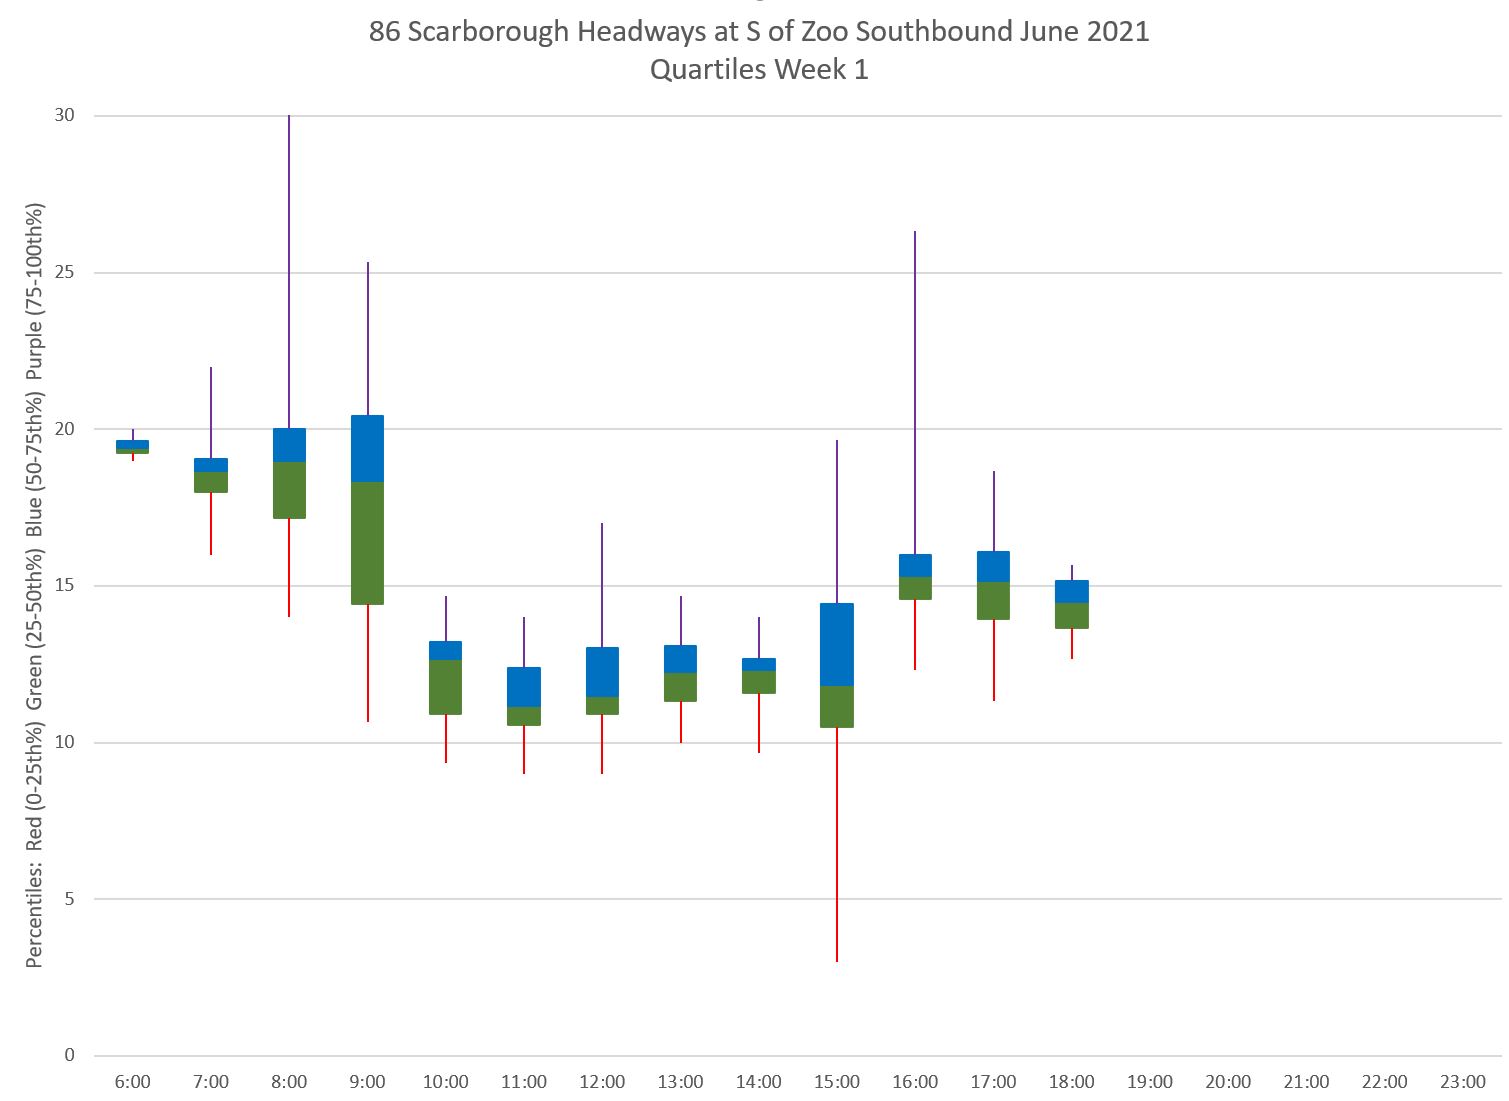
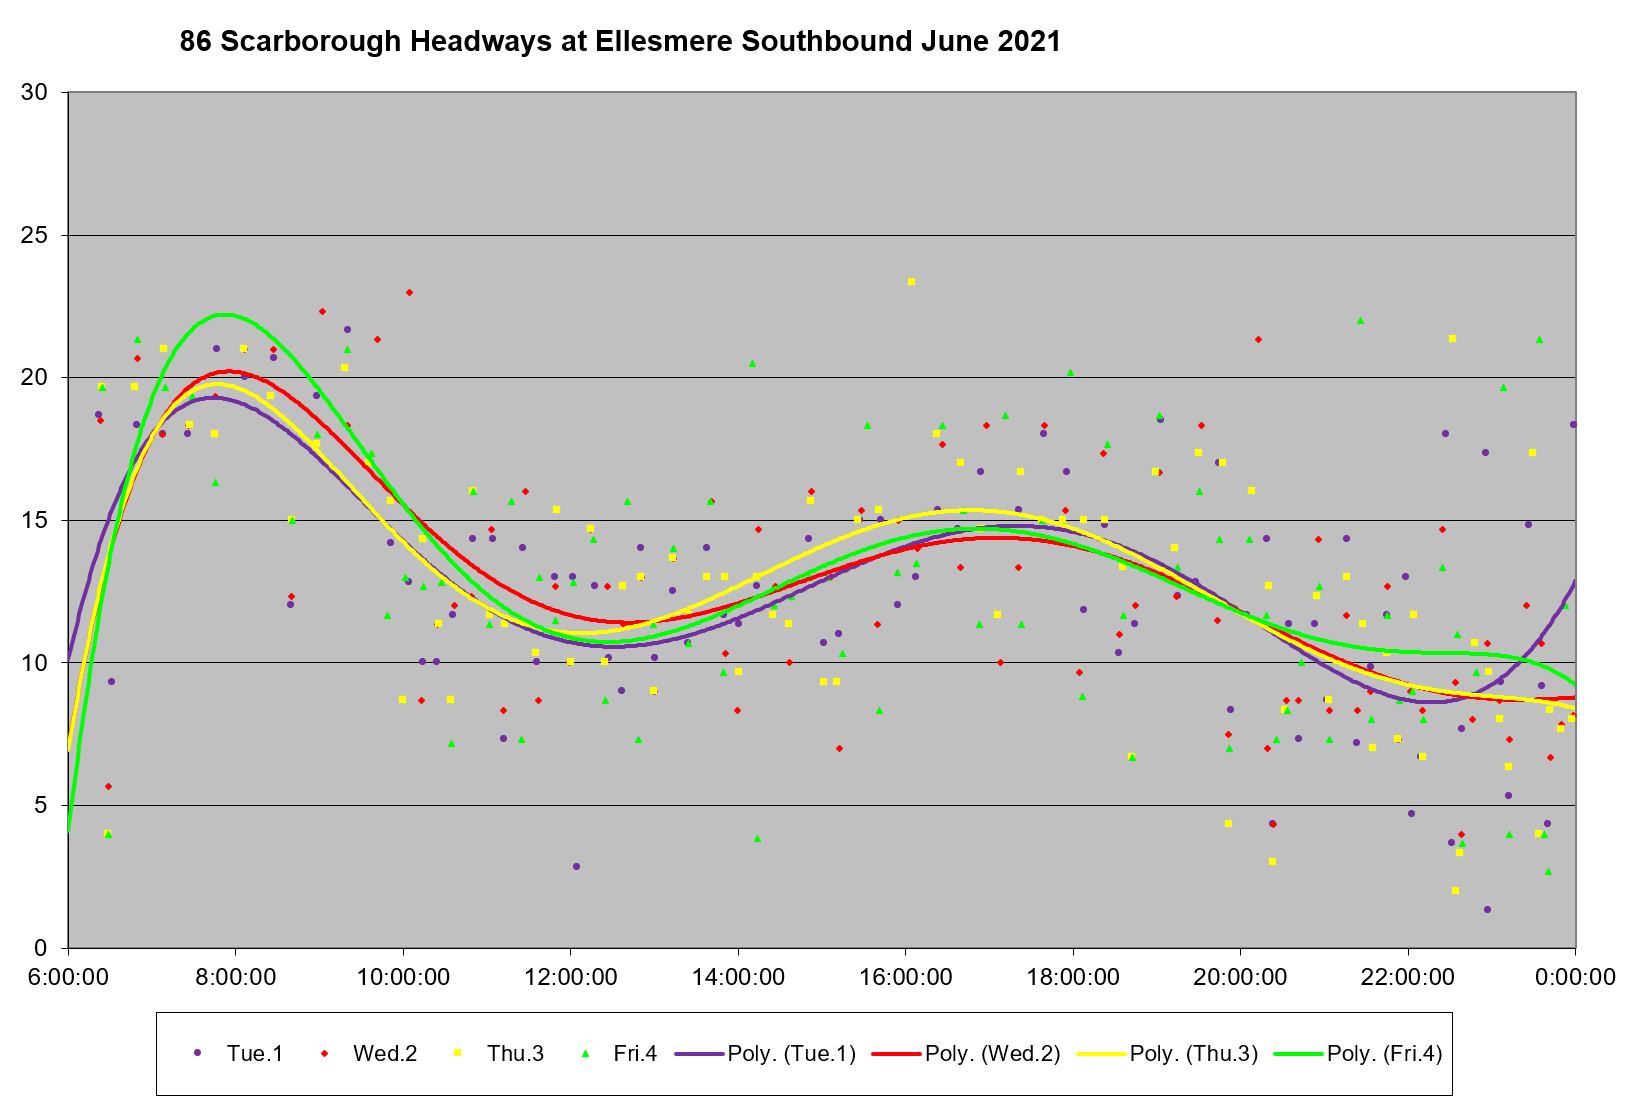
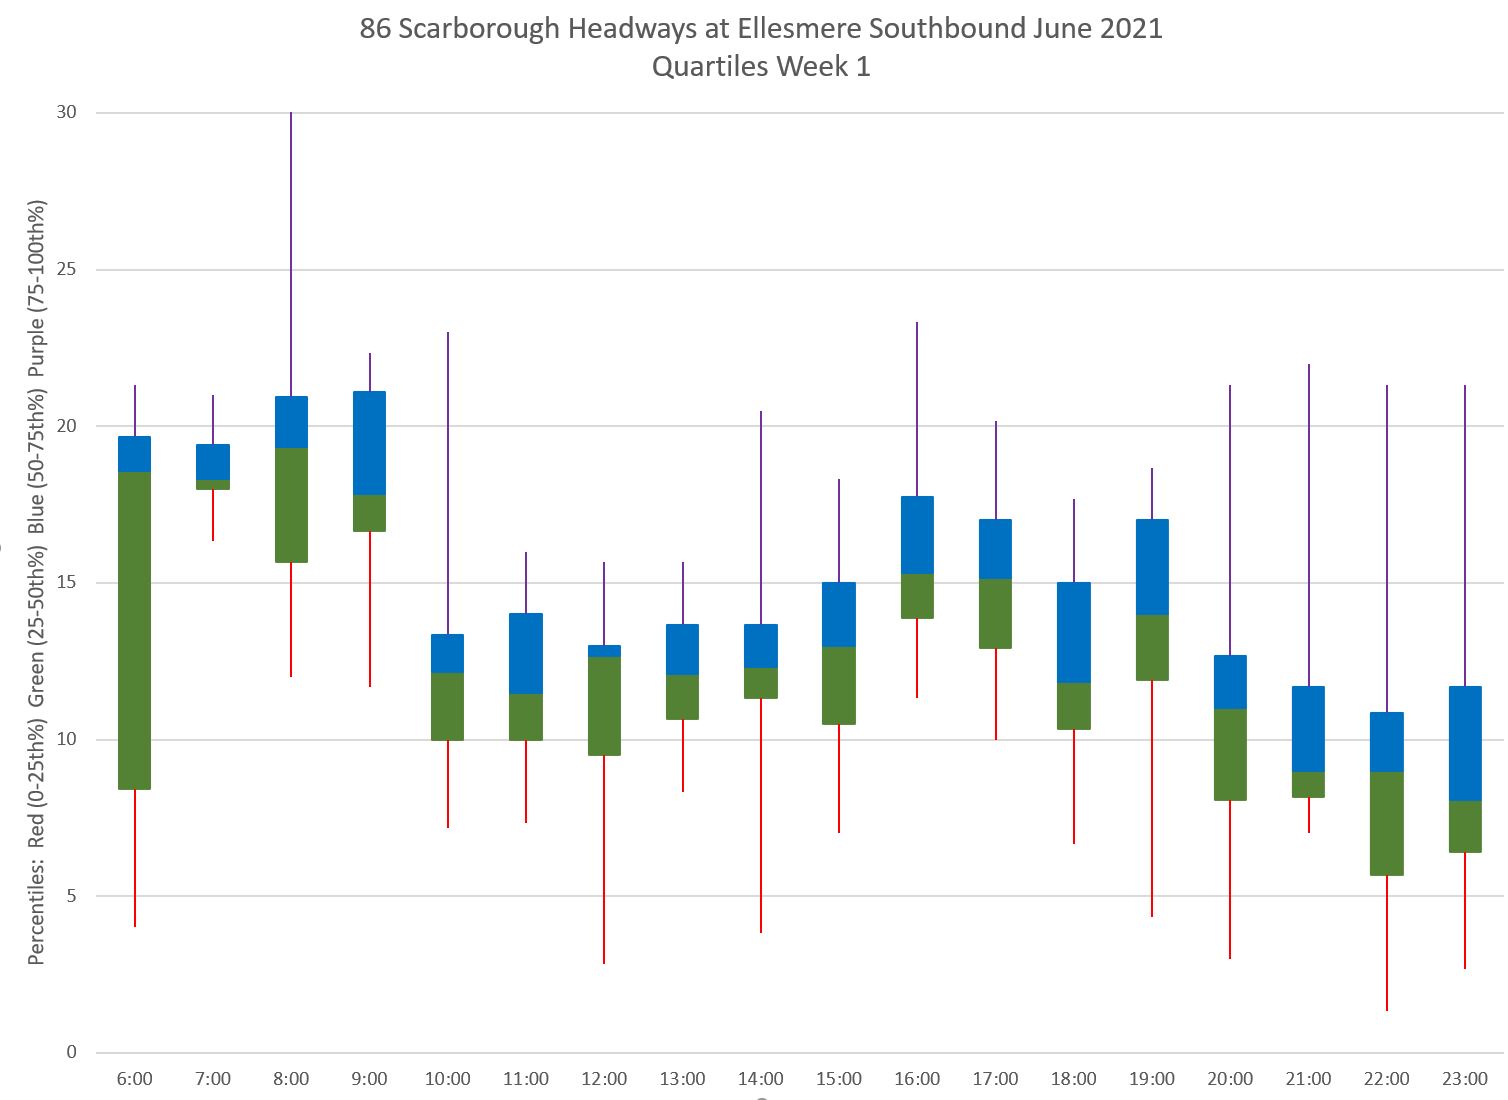
By the time the service reaches Ellesmere, the headways are starting to spread out especially in the evening.
At Highland Creek, the average headway is shorter, but the individual values are scattered over a wide range particularly in the late afternoon and evening.
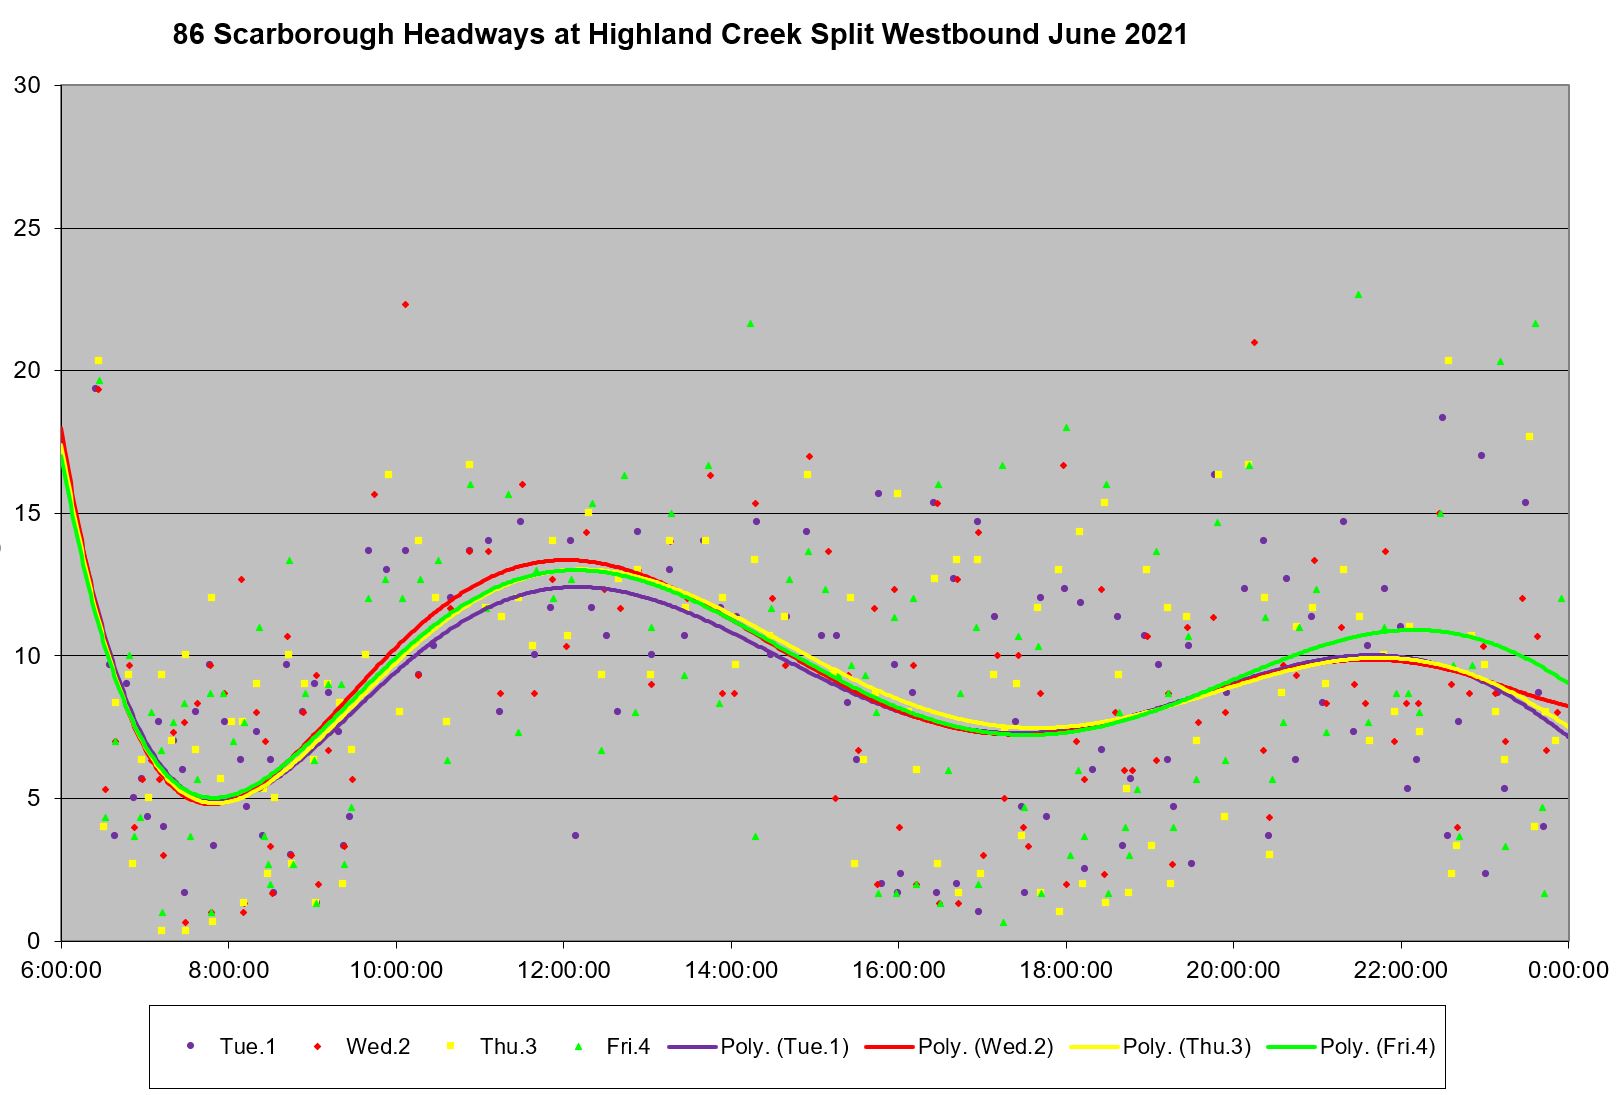
I have shown only the charts for the first week of June, but the situation is quite similar through the rest of the month and on weekends. This is chronically bad service. (Interested readers can browse the Full Chart Set section.)
986 Scarborough Express
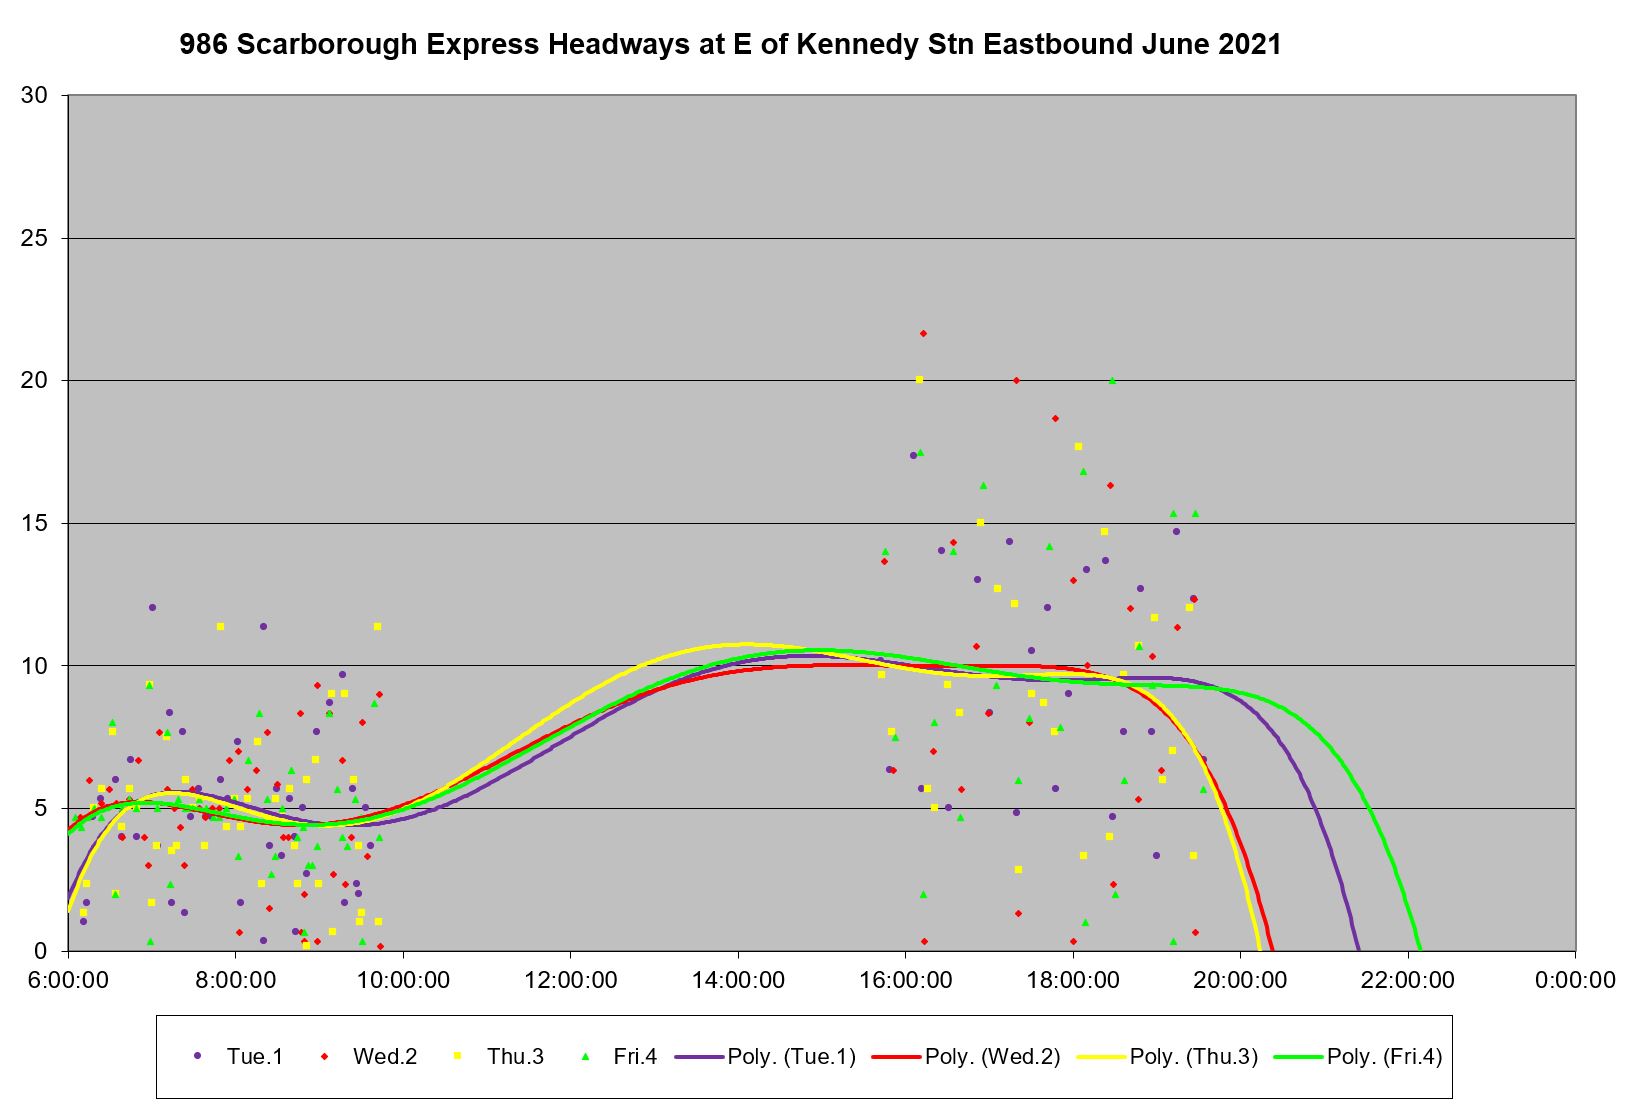
Service leaving Kennedy Station on the 986 Scarborough Express is very erratic, particularly in the afternoon when the headways are wider. Note that the scheduled service change in late June and headways during both peak periods were widened.


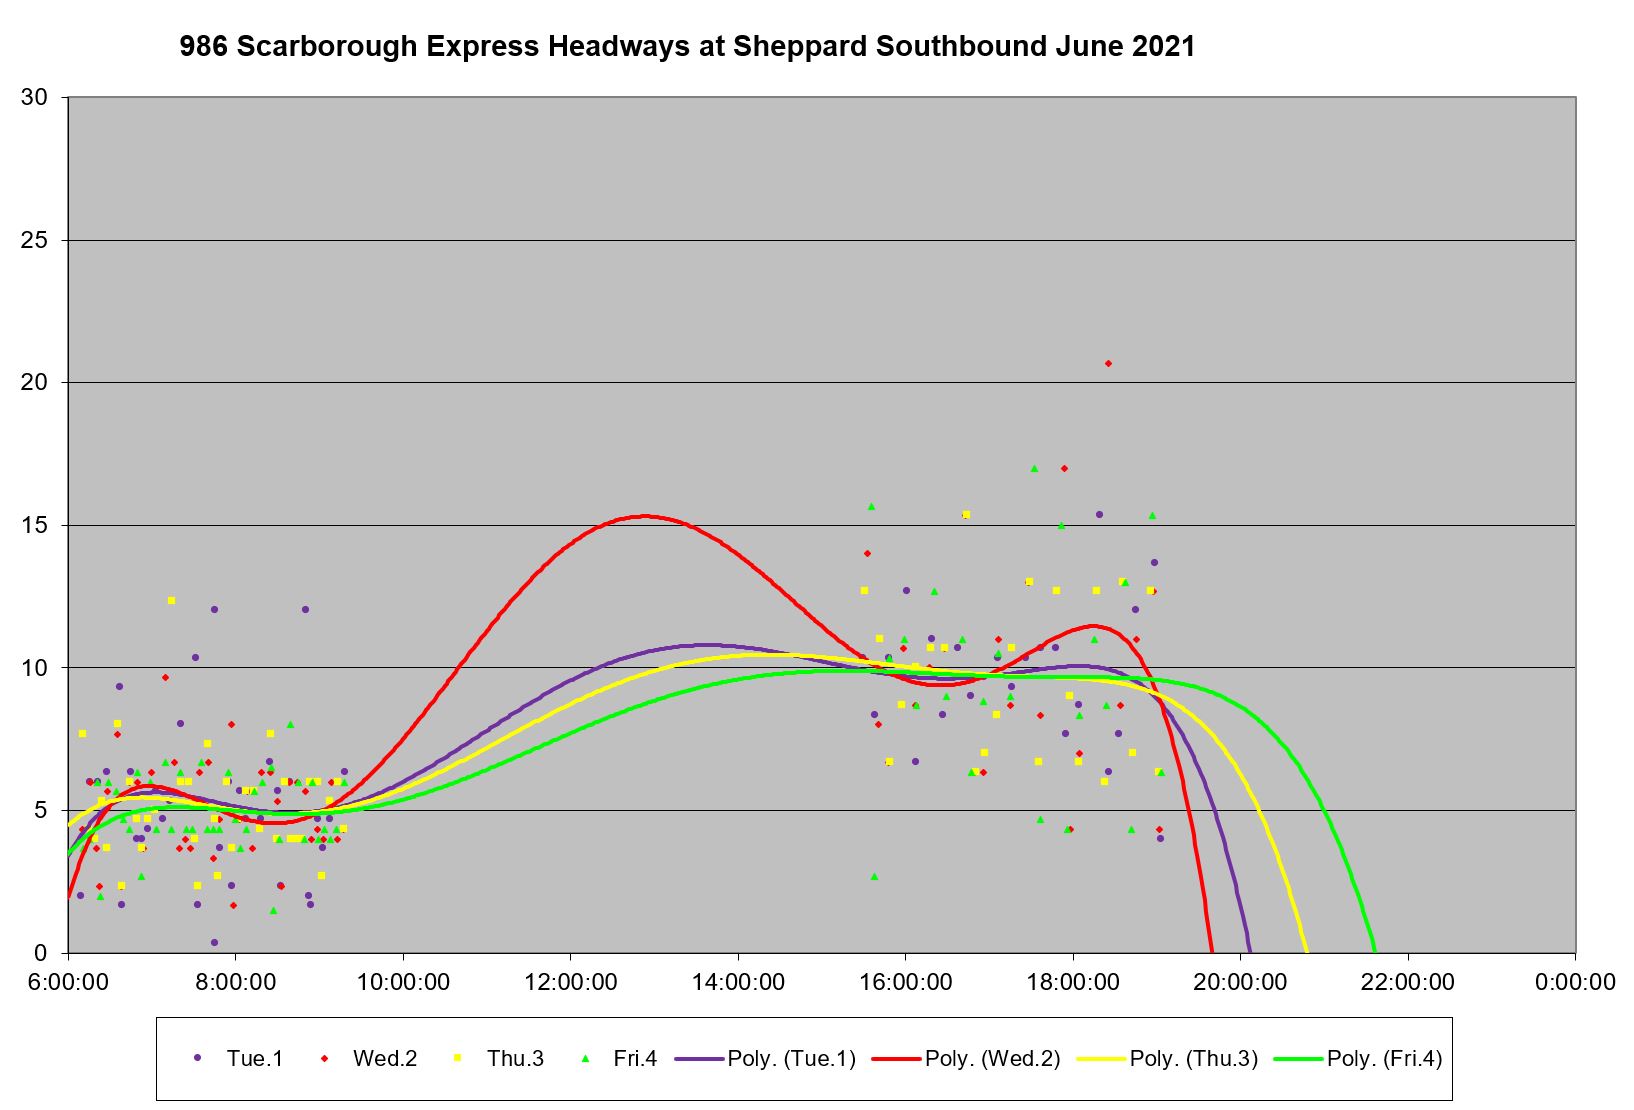
Inbound service southbound at Sheppard is only modestly better.
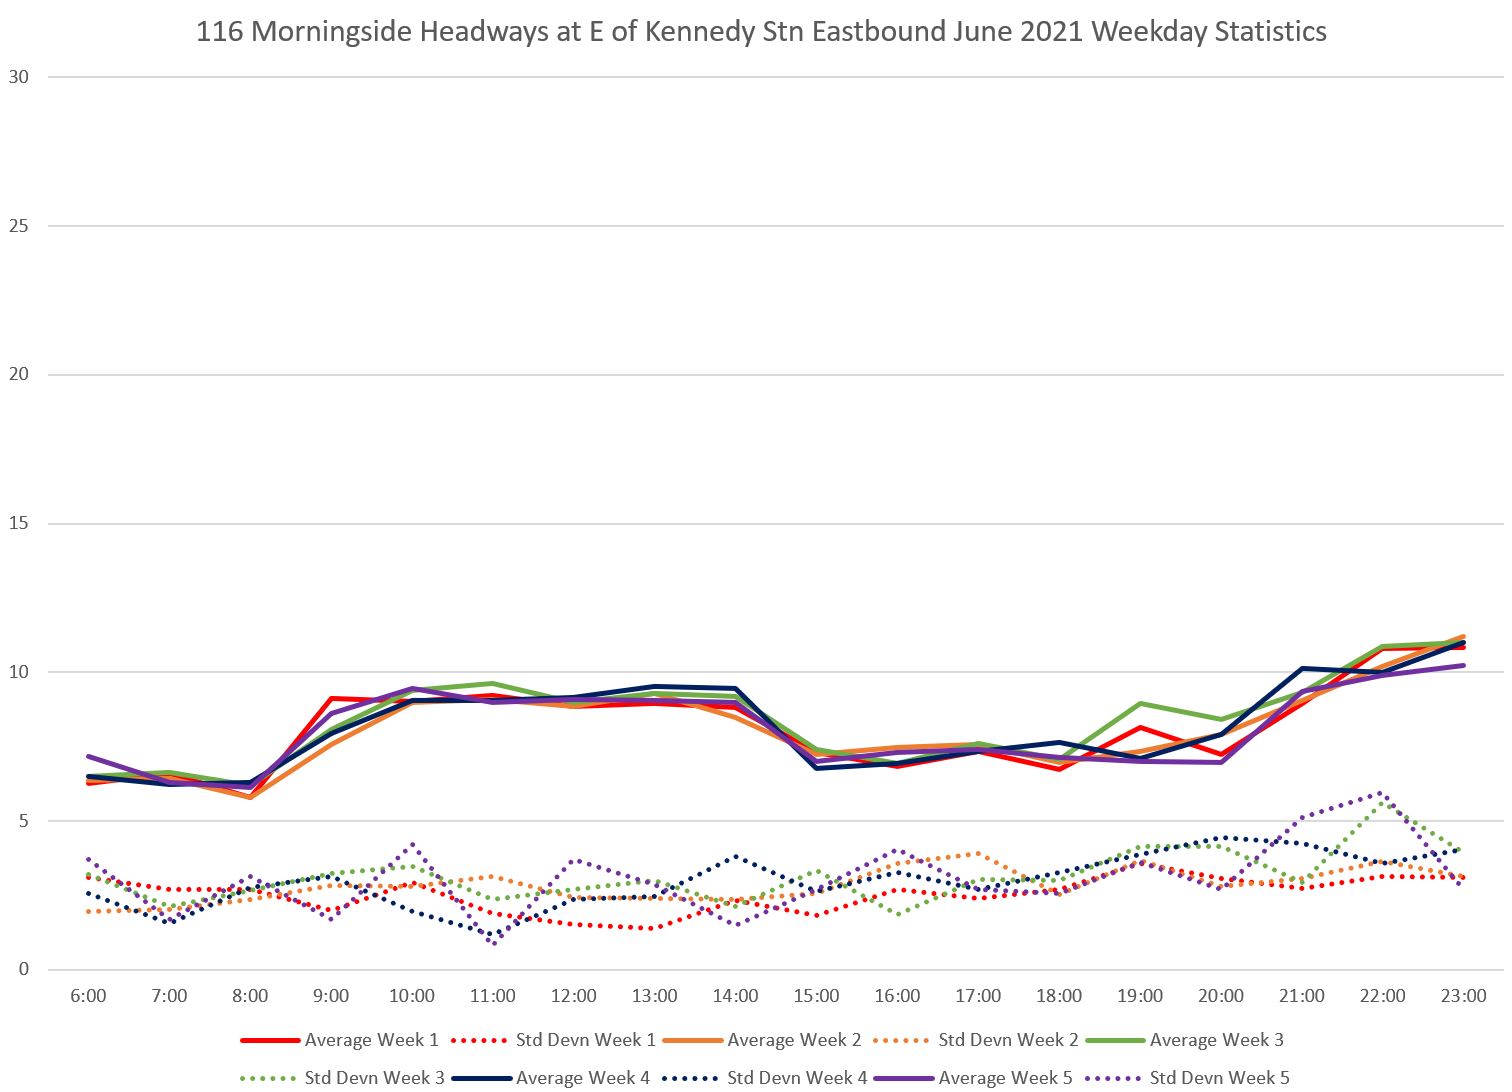
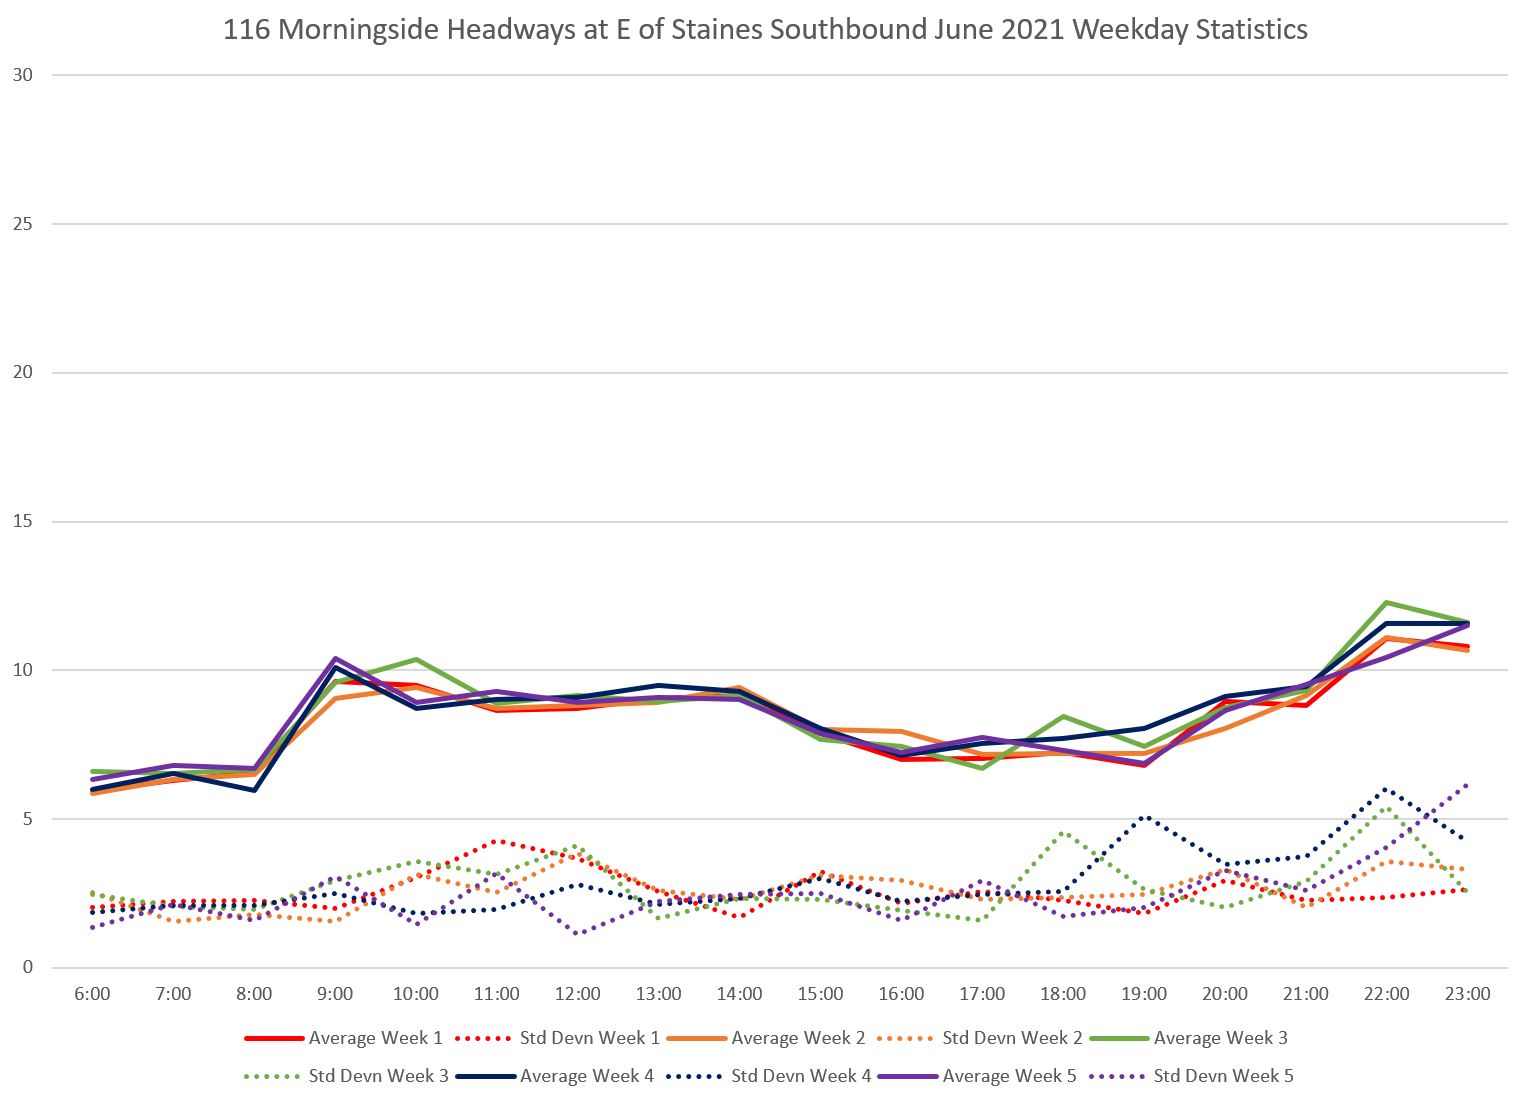
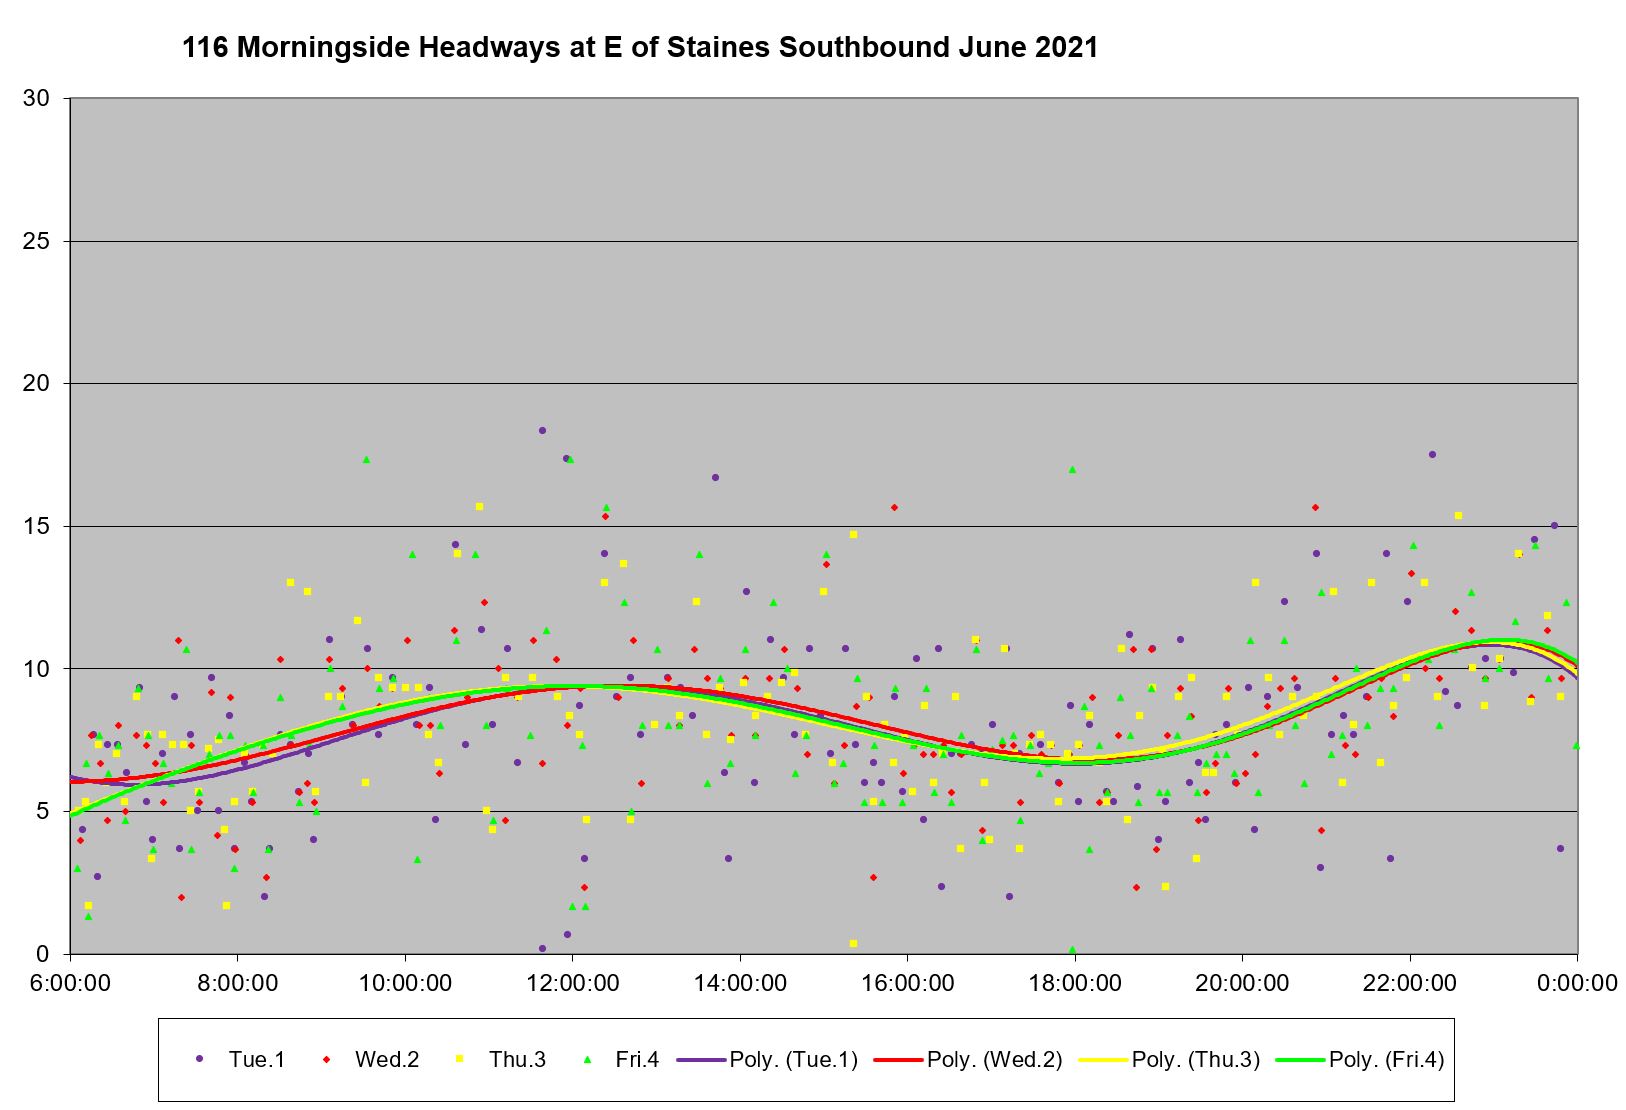
116 Morningside
Service leaving Kennedy Station on 116 Morningside is somewhat more reliable than on the 86/986 Scarborough routes, but this is only a matter of degree. As with the other routes, the average headway in each hour follows a common path through the day, but the standard deviation of the values is lower than on 86 Scarborough indicating that there is less dispersion in the headways. That shows up in the “cloud” chart where each headway is represented by a dot, and the dots are better clustered around the trend lines for 116 Morningside than for the 86/986 routes. That said, the headways do vary quite a bit particularly in the late afternoon and evening (note how the SD values rise in the chart below in corresponding hours).
The schedule for route 116 is much simpler as it only has one branch.
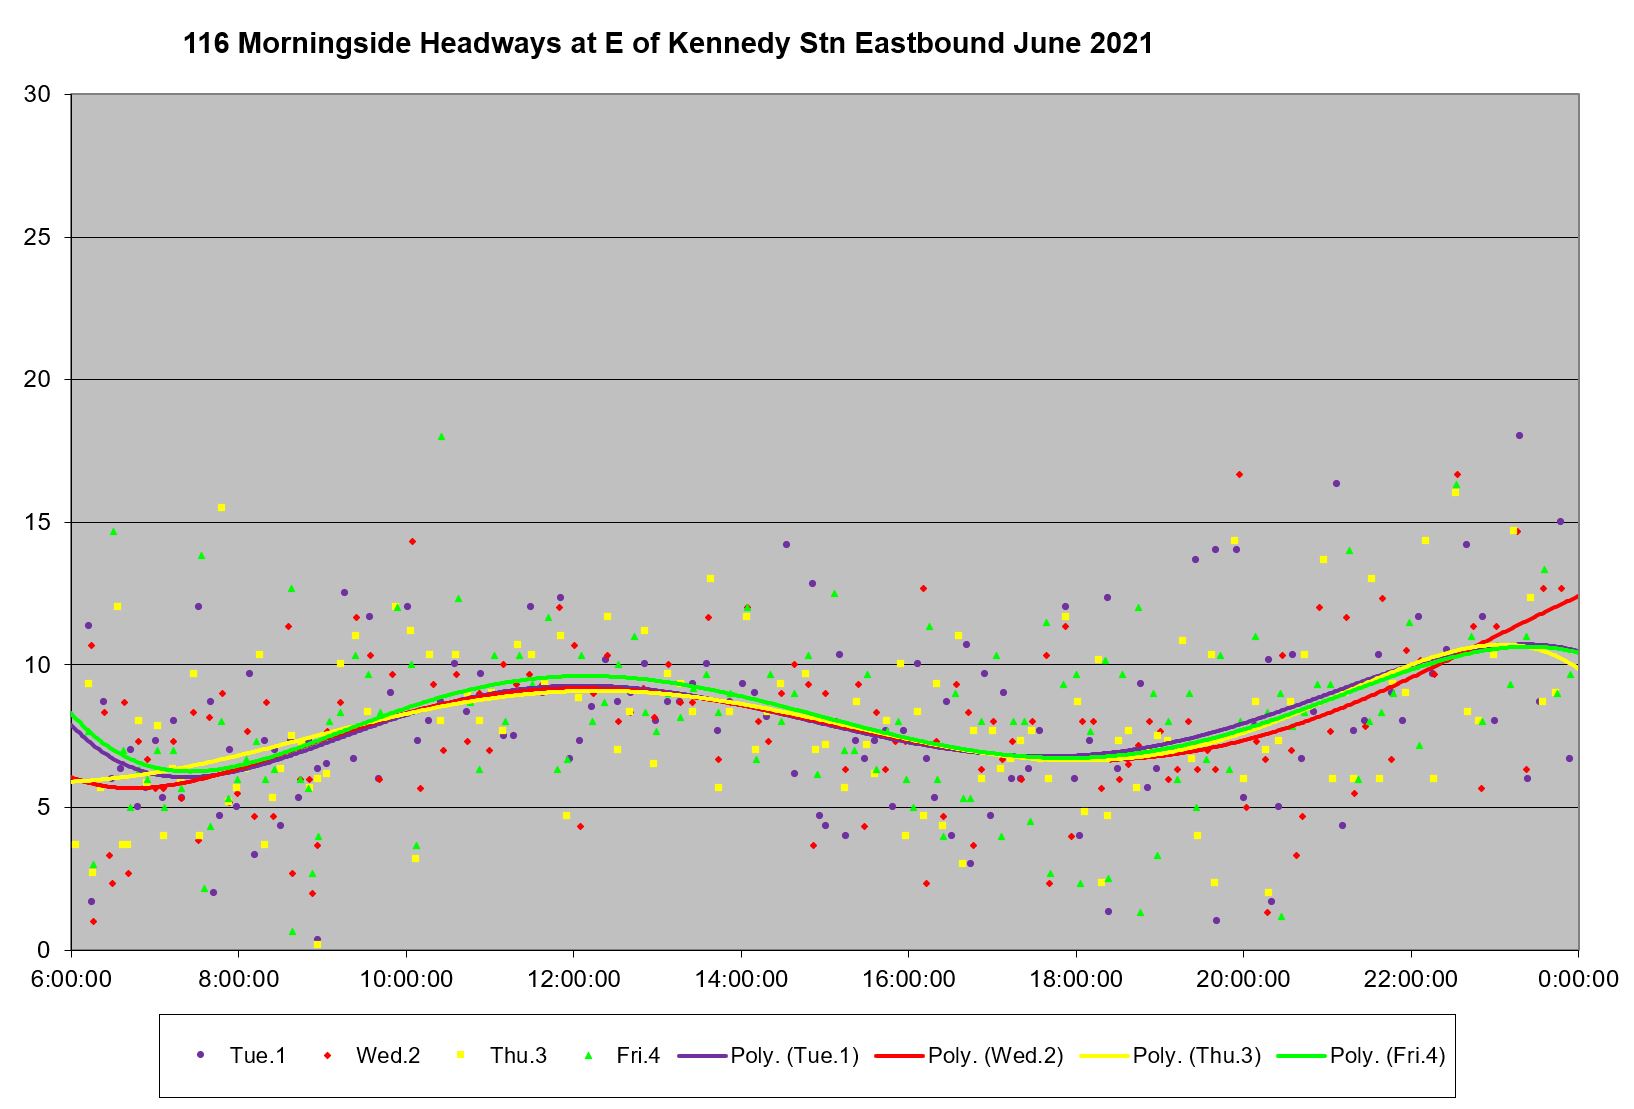
Seen as quartiles, the data are more tightly grouped around the median, but there is still a considerable range in the outer quartiles.

Inbound from Staines Avenue, the situation is similar to that at Kennedy. Buses leave the terminals on irregular headways and this only worsens as they proceed along the route and the pairs close up while the gaps widen.
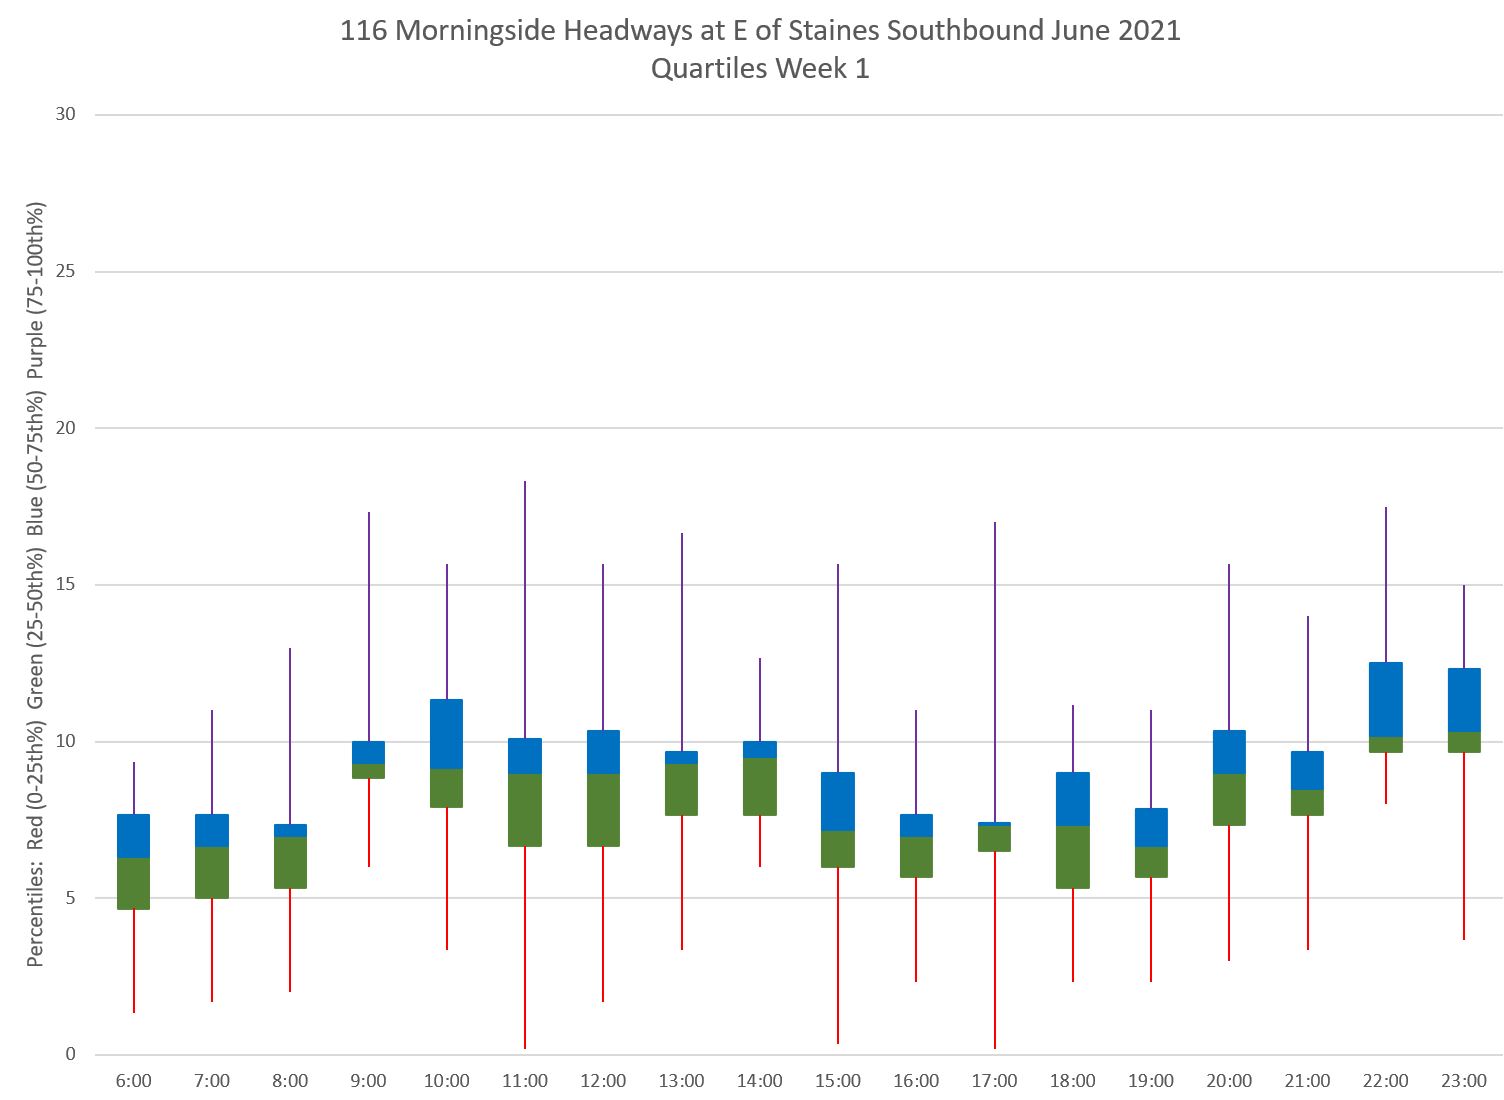
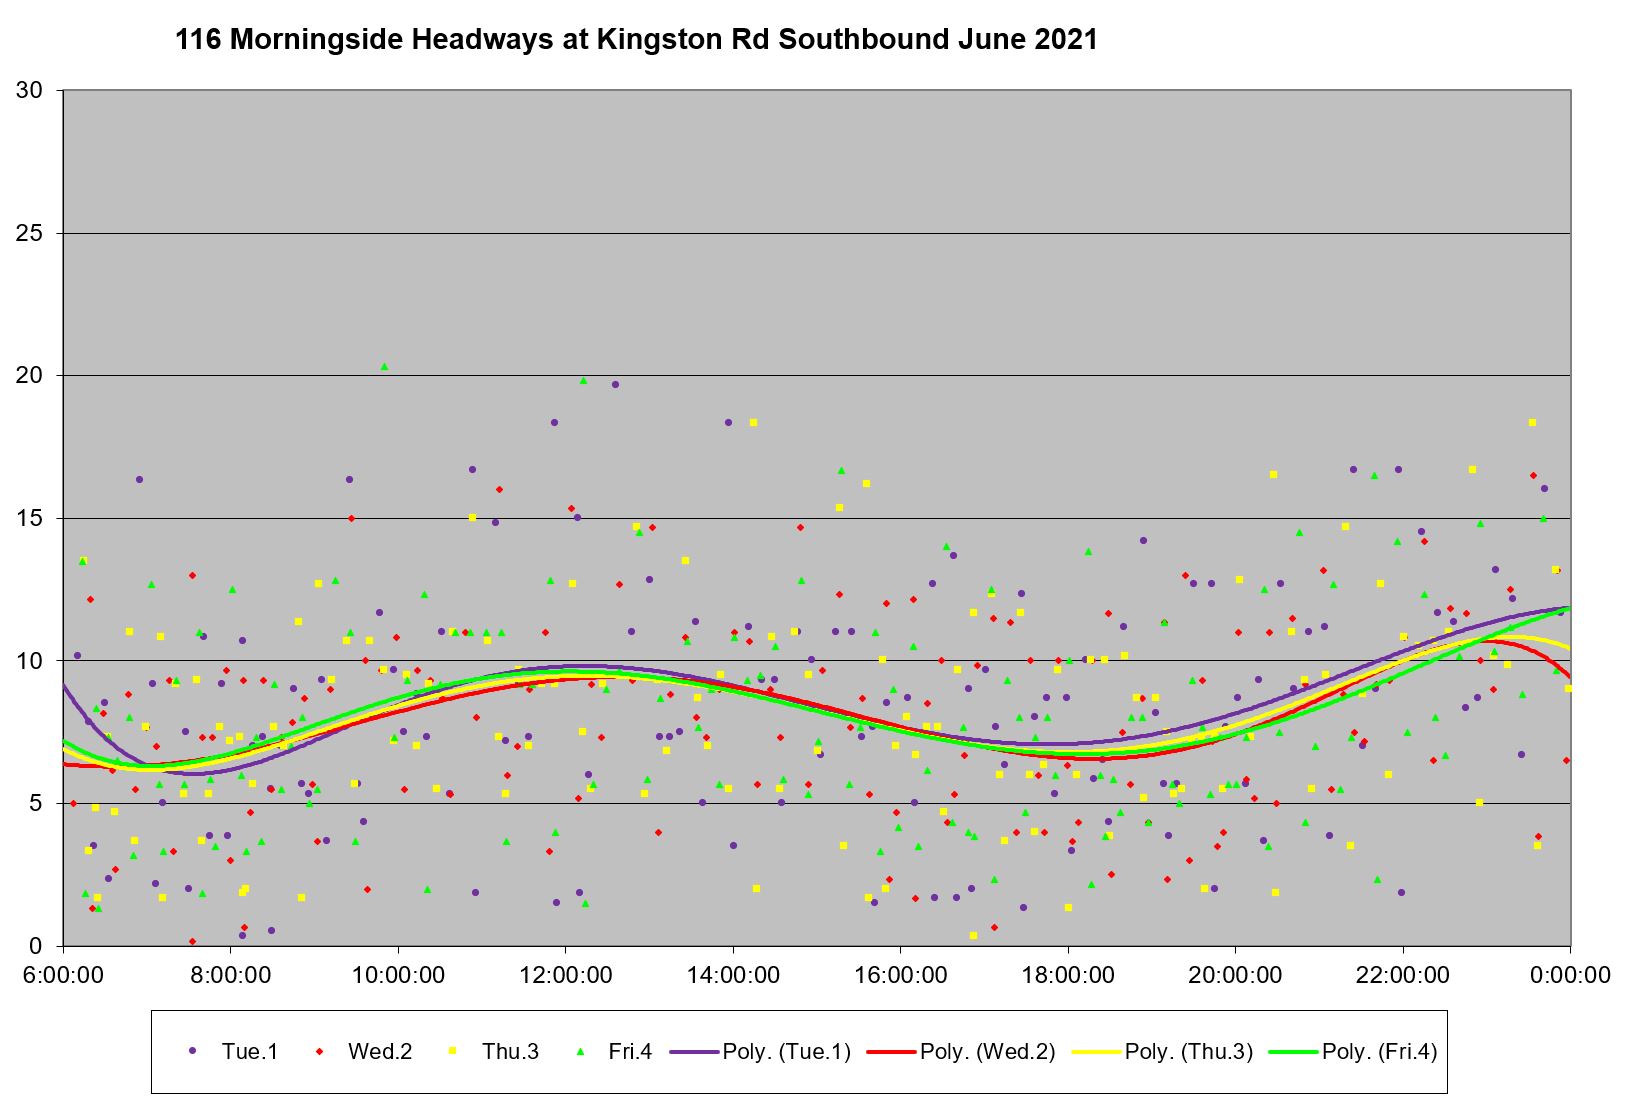
By the time the service reaches Kingston Road southbound, there are many buses running on short headways (bunched), and corresponding gaps with headways much wider than advertised.
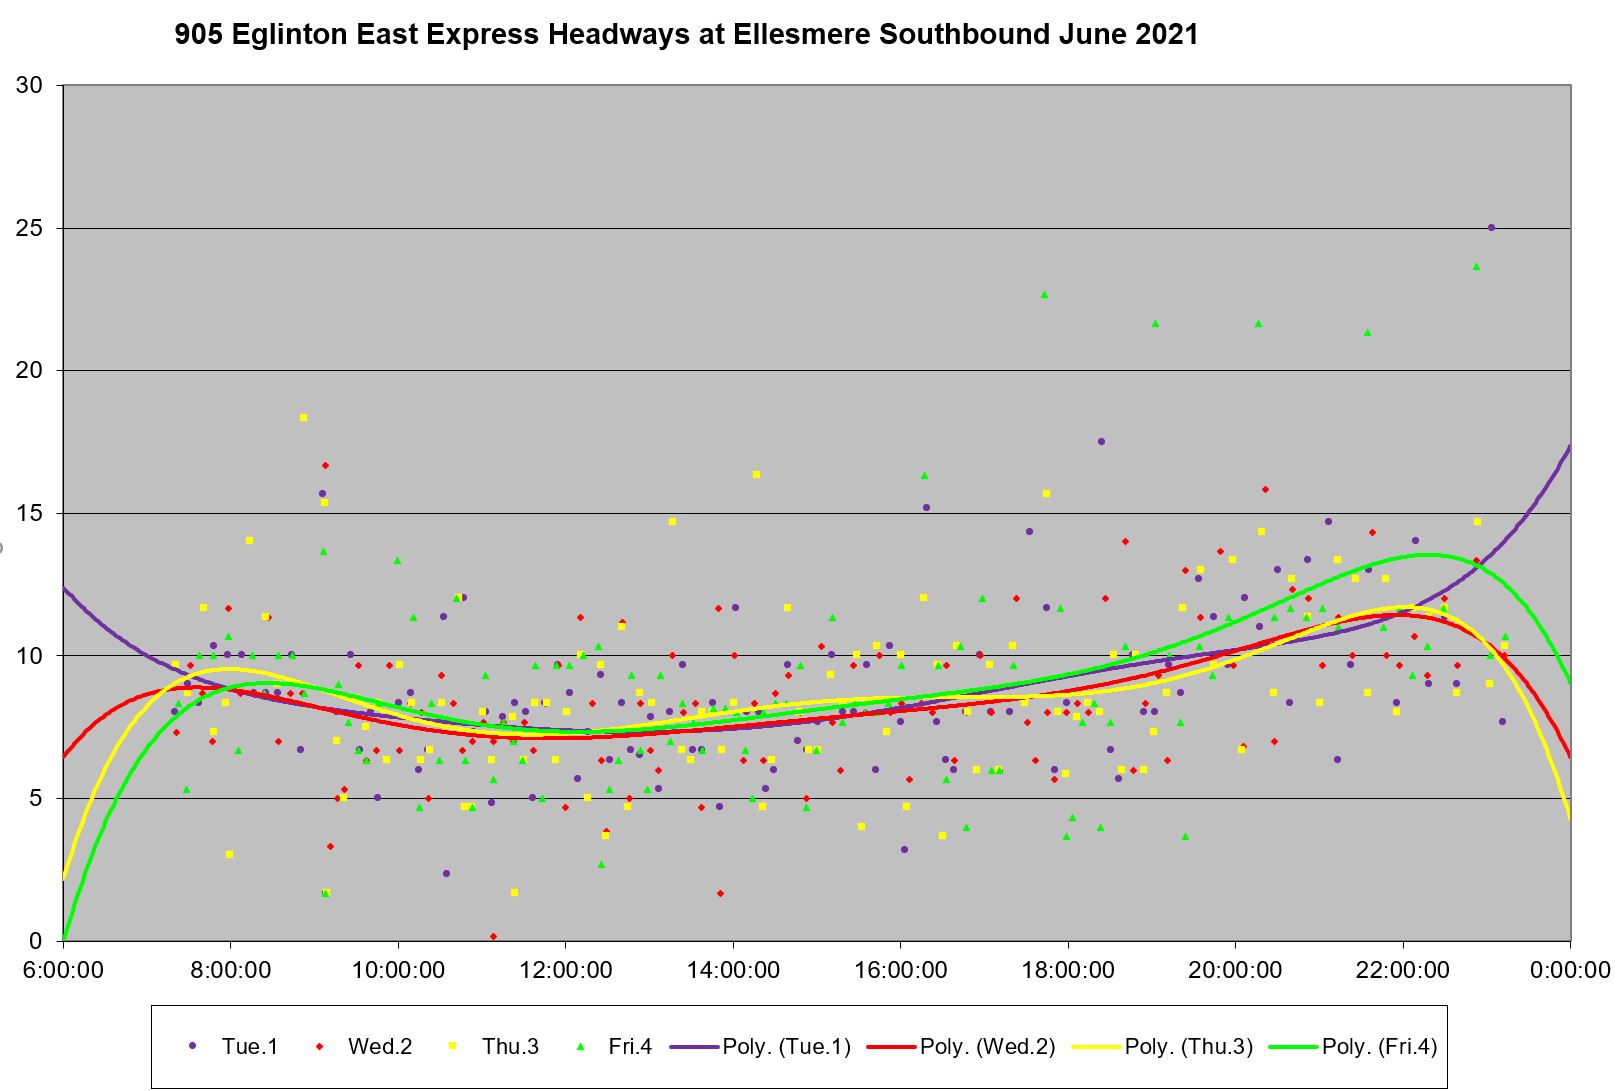
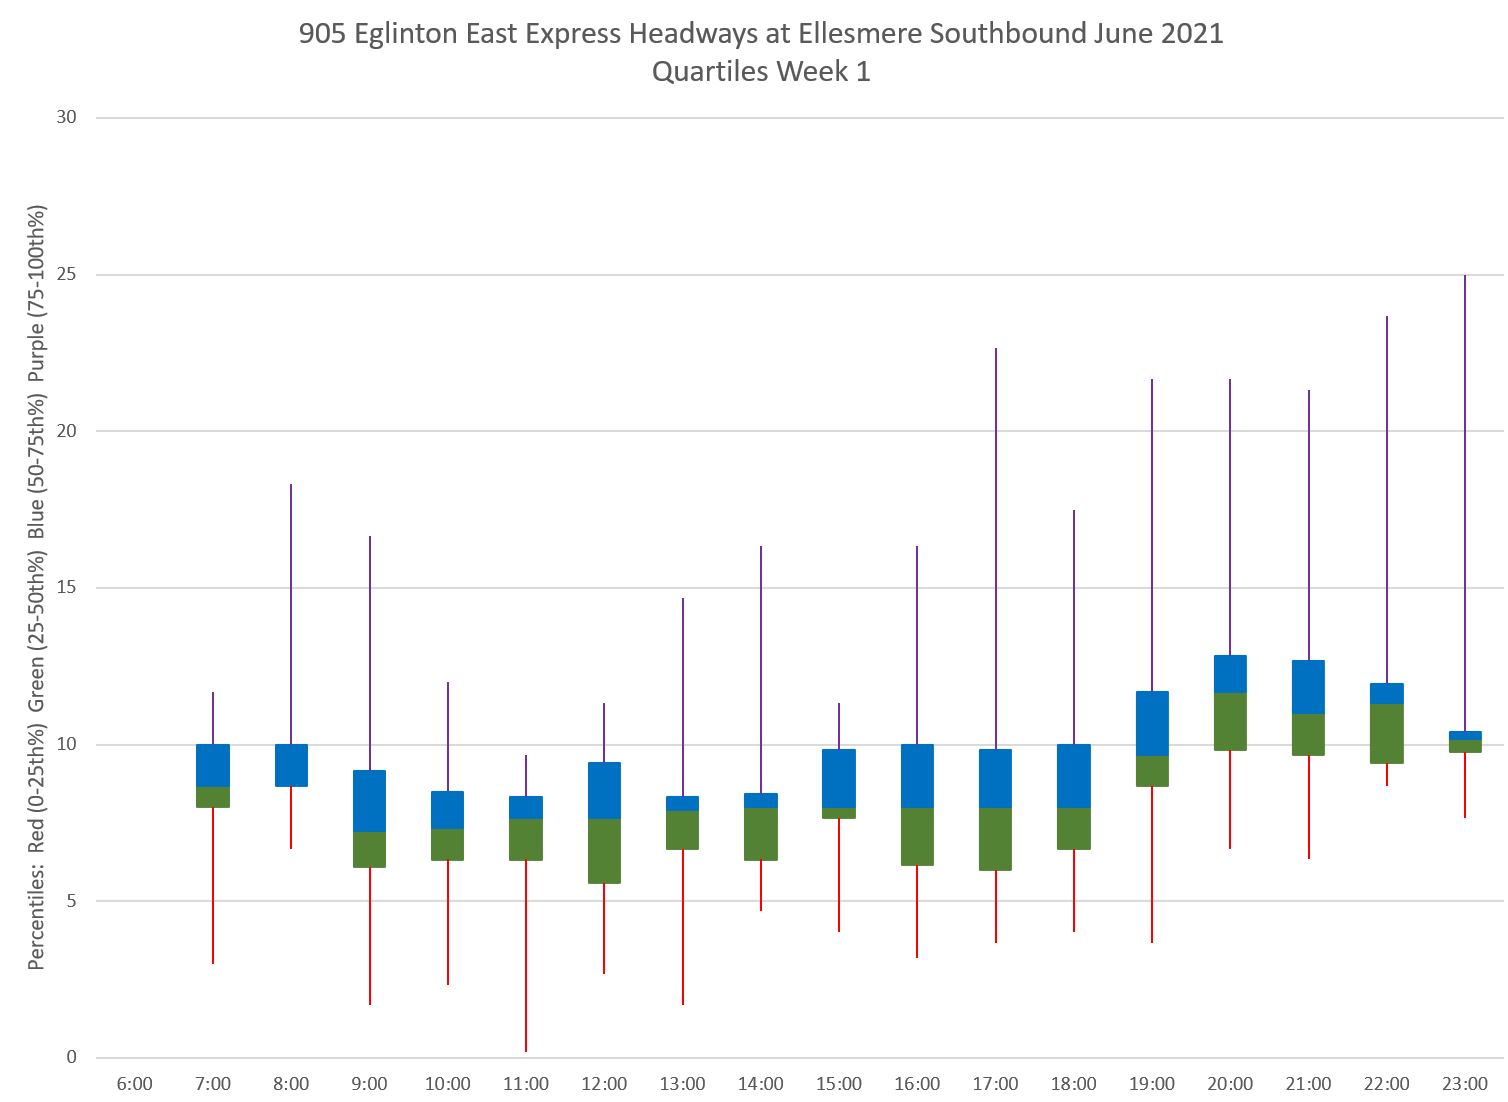
905 Eglinton East Express
The 905 Eglinton East Express, like its local counterpart 116 Morningside, has only one branch and should be comparatively easy to keep on a reliable basis.

Service eastbound from Kennedy Station is quite reliable as shown by the clustering of data points around the trend lines, and by the narrow range for the middle two quartiles of values.
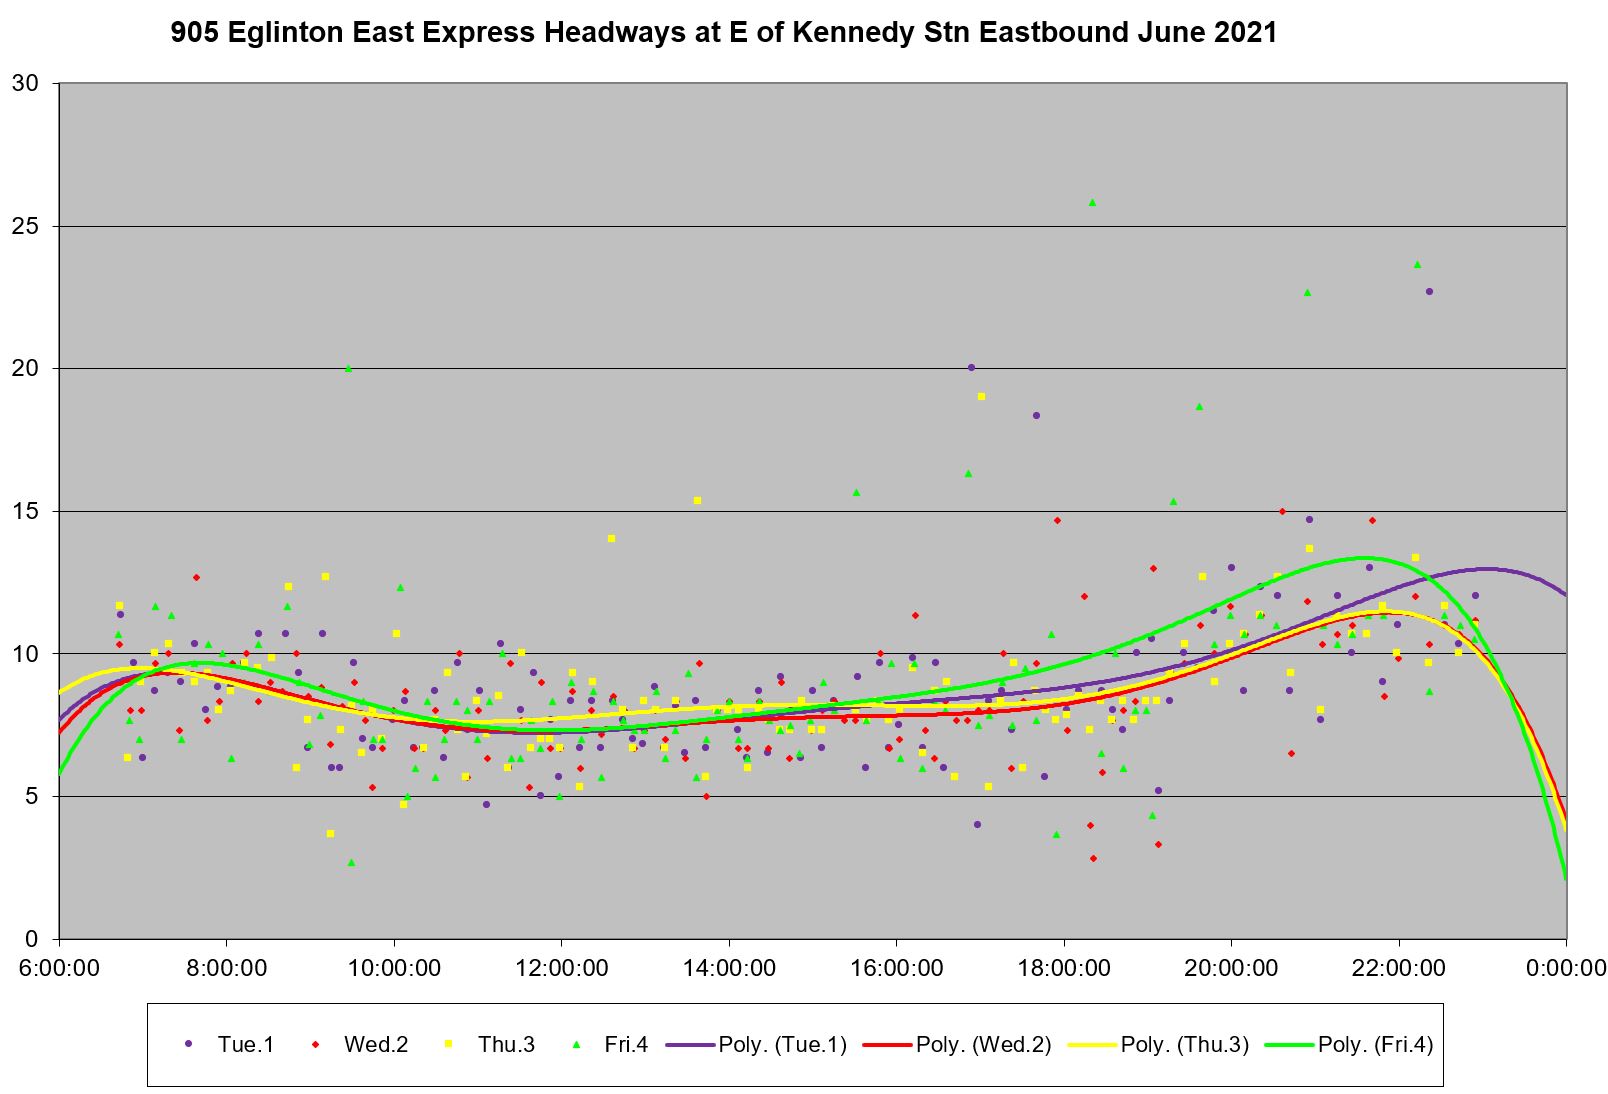
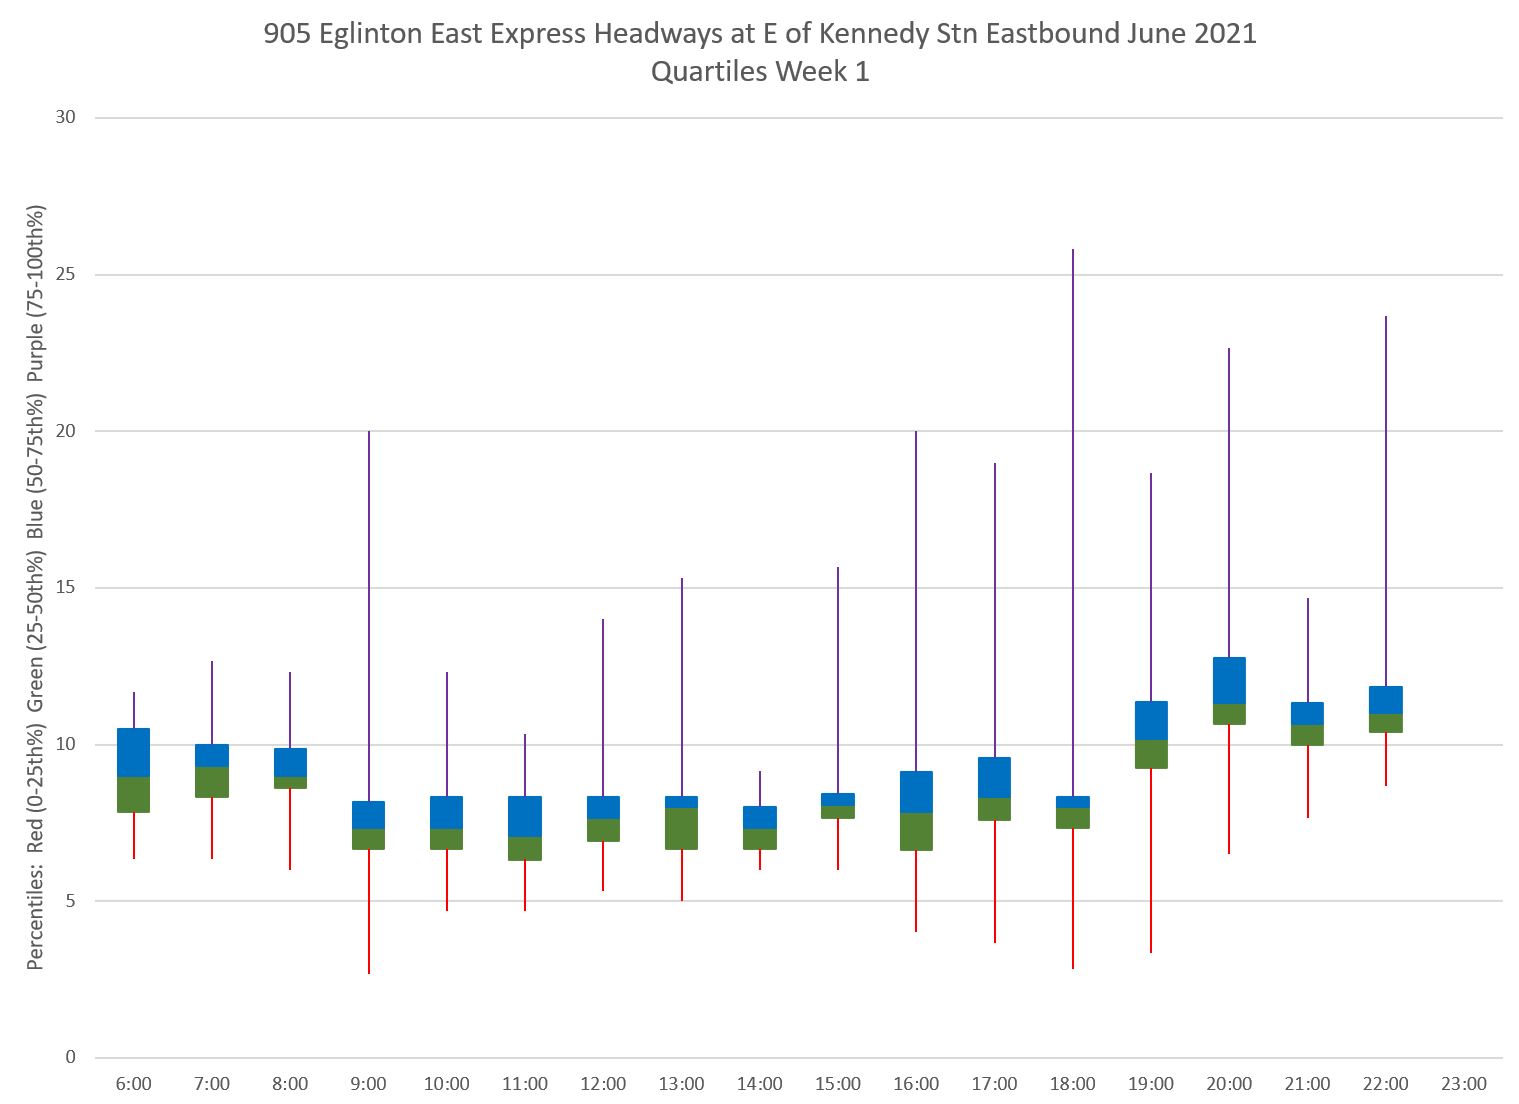
Headways inbound are slightly more scattered. (Note that the values shown here are for Ellesmere souithbound because determining exactly when a bus has departed from UTSC can be tricky given the looping arrangement.)
Full Chart Sets
For those who cannot get enough of these charts, here are all of the gory details.
86/986 Scarborough
- Morningside to east of Kennedy Station Travel Times
- Kennedy to Morningside Travel Times
- 86 Headways east of Kennedy Station EB
- 86 Headways south of the Zoo SB
- 86 Headways at Ellesmere SB
- 86 Headways at Highland Creek WB
- 986 Headways east of Kennedy Station EB
- 986 Headways at Sheppard SB
116 Morningside
- Ellesmere to Kennedy Station Travel Times
- East of Kennedy Station to Ellesmere Travel Times
- East of Staines Road Headways SB
- East of Kennedy Station Headways EB
