
This article is another in a series reviewing the behaviour of routes where RapidTO “red lanes” exist or are proposed.
Updated August 8, 2021: A reader pointed out that the 929 Dufferin Express existed pre-pandemic, although I did not include any data for it in this article. I was not tracking this route between its debut in October 2018 and February 2020 because historical bus tracking data from the new Vision tracking system were not available until mid-2019. I do have March 2020 data and have added this to the article. It shows very clearly the transition in travel times as demand and road traffic fell during that month.
Previous articles in the series:
- Red Lanes, Express Buses and Service Reliability in Scarborough
- A Dashboard for Scarborough Red Lanes
- Service Reliability on 35/935 Jane
The 29 and 929 Dufferin services operate between either from the western gate Dufferin Loop or the eastern gate Princes’ Gate Loop to Wilson Station. Except for the stopping pattern, the routes are identical between King and WIlson Station, the portion of the route reviewed here.
The 929 Dufferin Express bus began operation in mid-November 2020 with standard sized buses, but converted to the larger artics in the second week of May 2021 at roughly the same headway thereby increasing route capacity. The 29 Dufferin local service has been operating with articulated buses throughout the period of the data presented here.
Schedules for both the local and express services were adjusted on May 9, 2021, to add more running time for reliability.
This article deals with:
- The change in travel times for the local 29 Dufferin Jane service between King and Wilson (the portion of the route proposed for Rapid TO) from pre-pandemic traffic conditions and their evolution through the low point of demand and congestion in 2020 through to June 2021.
- The difference between local and express services.
- The reliability of service.
The High Points
Although the Dufferin corridor saw a drop in travel times co-incident with the pandemic’s onset, this effect was short-lived and travel times have grown in the past year, in some cases above April 2018 (the reference date for “before” conditions).
(Why April 2018? This was the point where bus tracking started the transition from the old “CIS” monitoring system to the new “Vision” system and historical tracking data for bus routes were not reliably available for an extended period.)
Dufferin has suffered from construction interference at Eglinton on-and-off for several years, although this effect varies. However, that is not the only location where slowdowns occurred. Any review of red lanes needs to consider which locations will provide the greatest benefit, although these tend to be places where resistance to dedicating capacity to transit will be very strong.
There is a consistent difference in travel speeds between local and express services, although for some periods and locations, the pre-pandemic service was faster.
Headways on Dufferin are quite irregular and much of the service is bunched. In late June, travel times rose markedly due to construction, and headway reliability declined even more. This condition probably persisted into July, and the data for that month are still to come.
Reliability issues occur in the off-peak and on weekends, not just during the traditional peak periods.
An important distinction in discussing transit priority lanes will be the degree to which they contribute to service reliability. The King Street transit mall was a very different location from the bus routes where red lanes are proposed. King Street has very frequent transit service and strong transit demand, not to mention pedestrian activity and crowd-generating events year-round. It also has parallel streets to which traffic could shift.
How much benefit can actually be achieved on Dufferin is quite another question. A political challenge lies in the fact that there are problem areas on Dufferin, but not all of the time. Red lanes are a 7×24 change in a street’s configuration and their overall benefit must be strong enough to survive challenges. A good analogy on King Street is the carve-out for taxis that was implemented and contributed to motorists generally ignoring the traffic rules even before 2020.
Evolution of Travel Times on 29 Dufferin
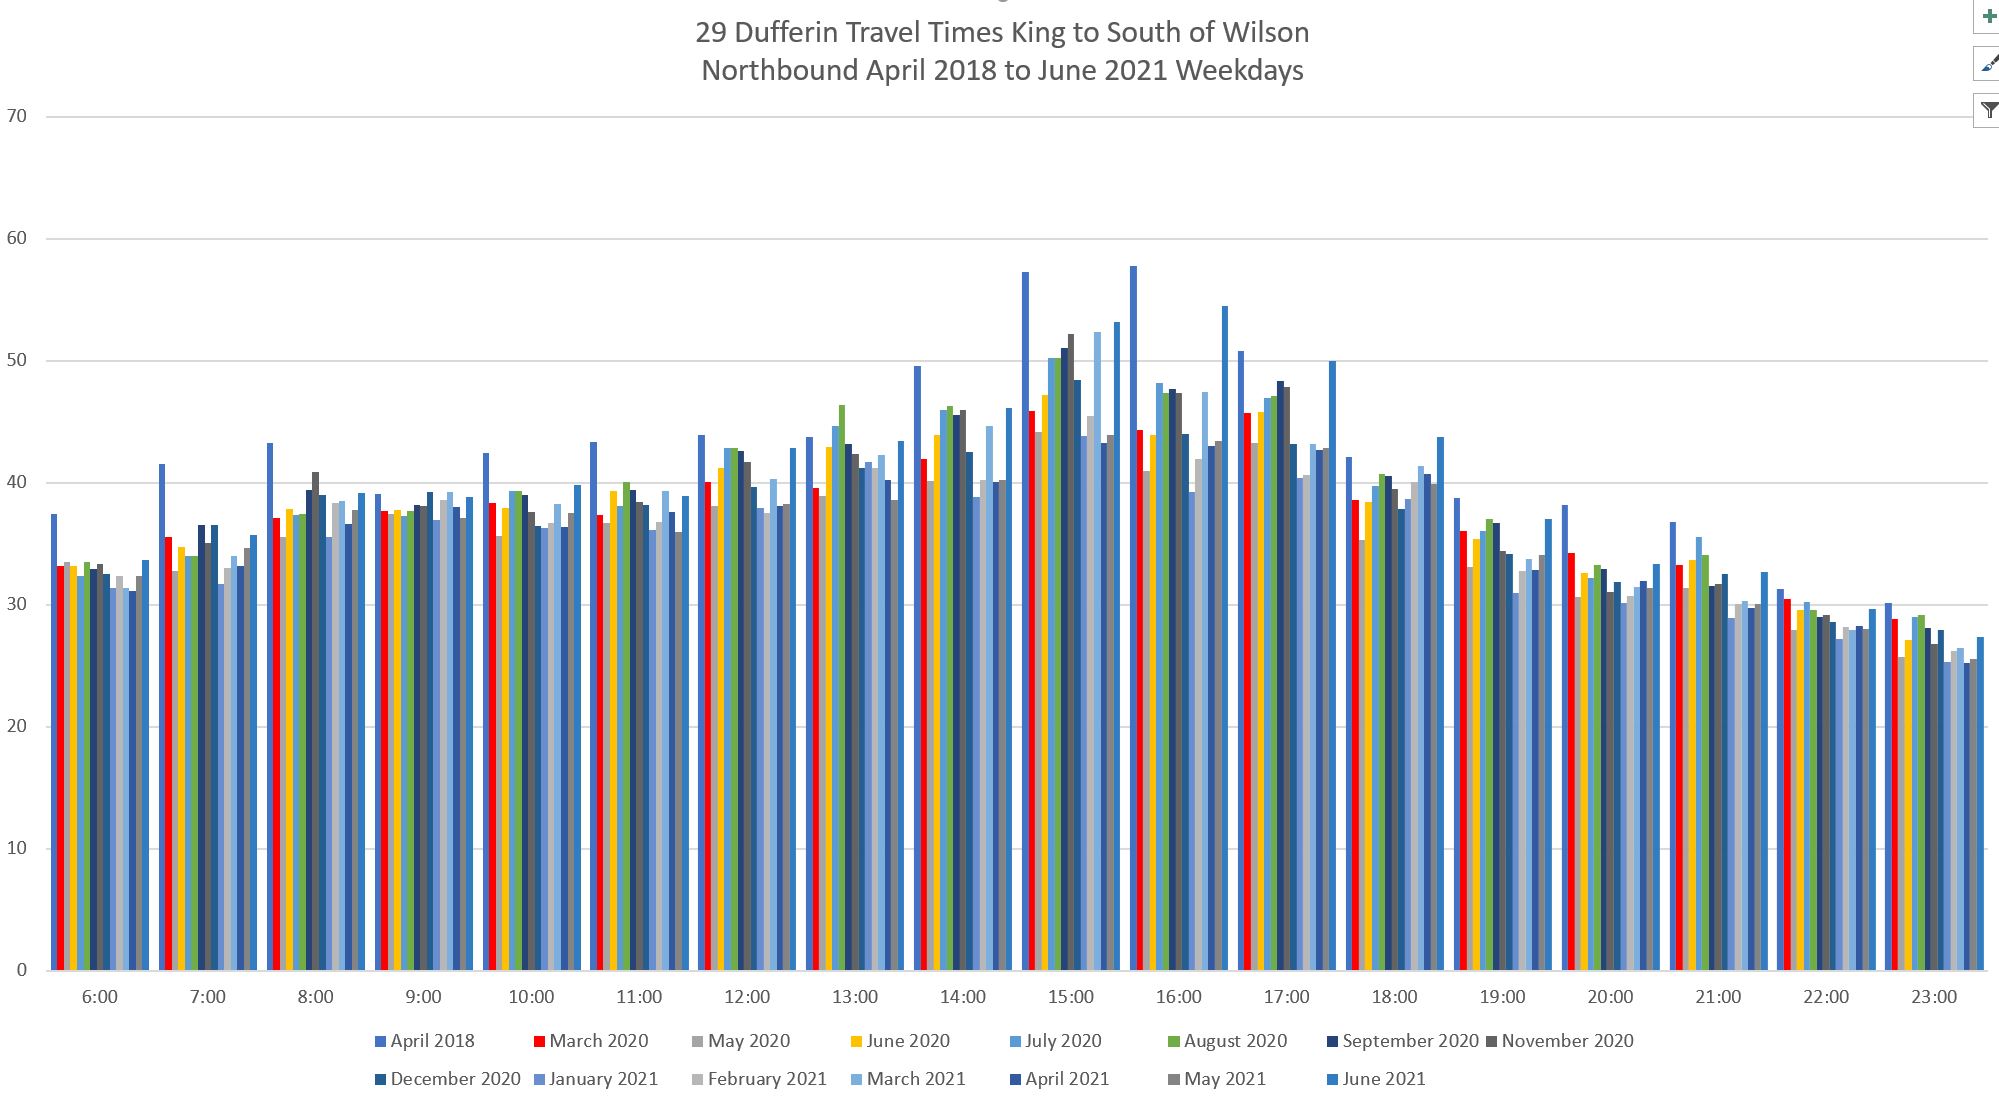
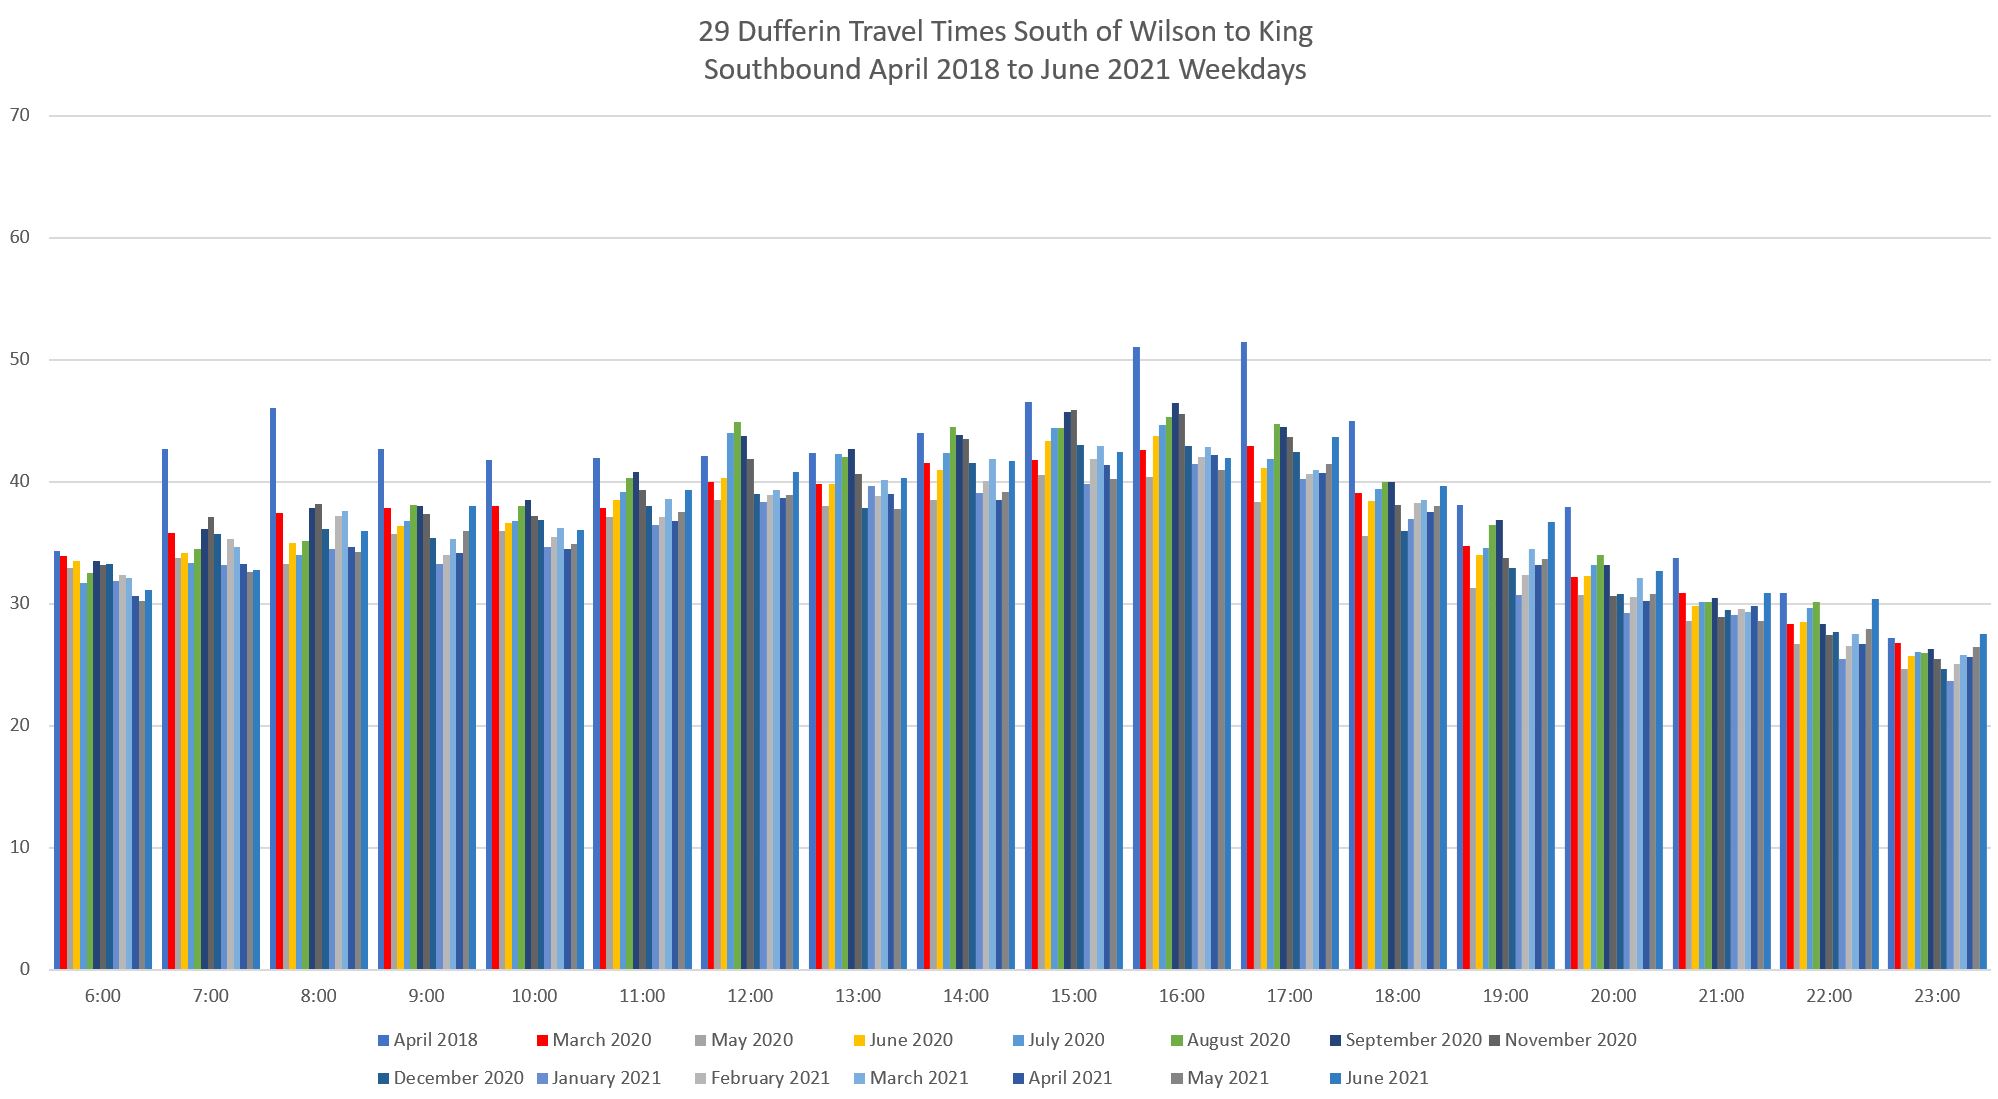
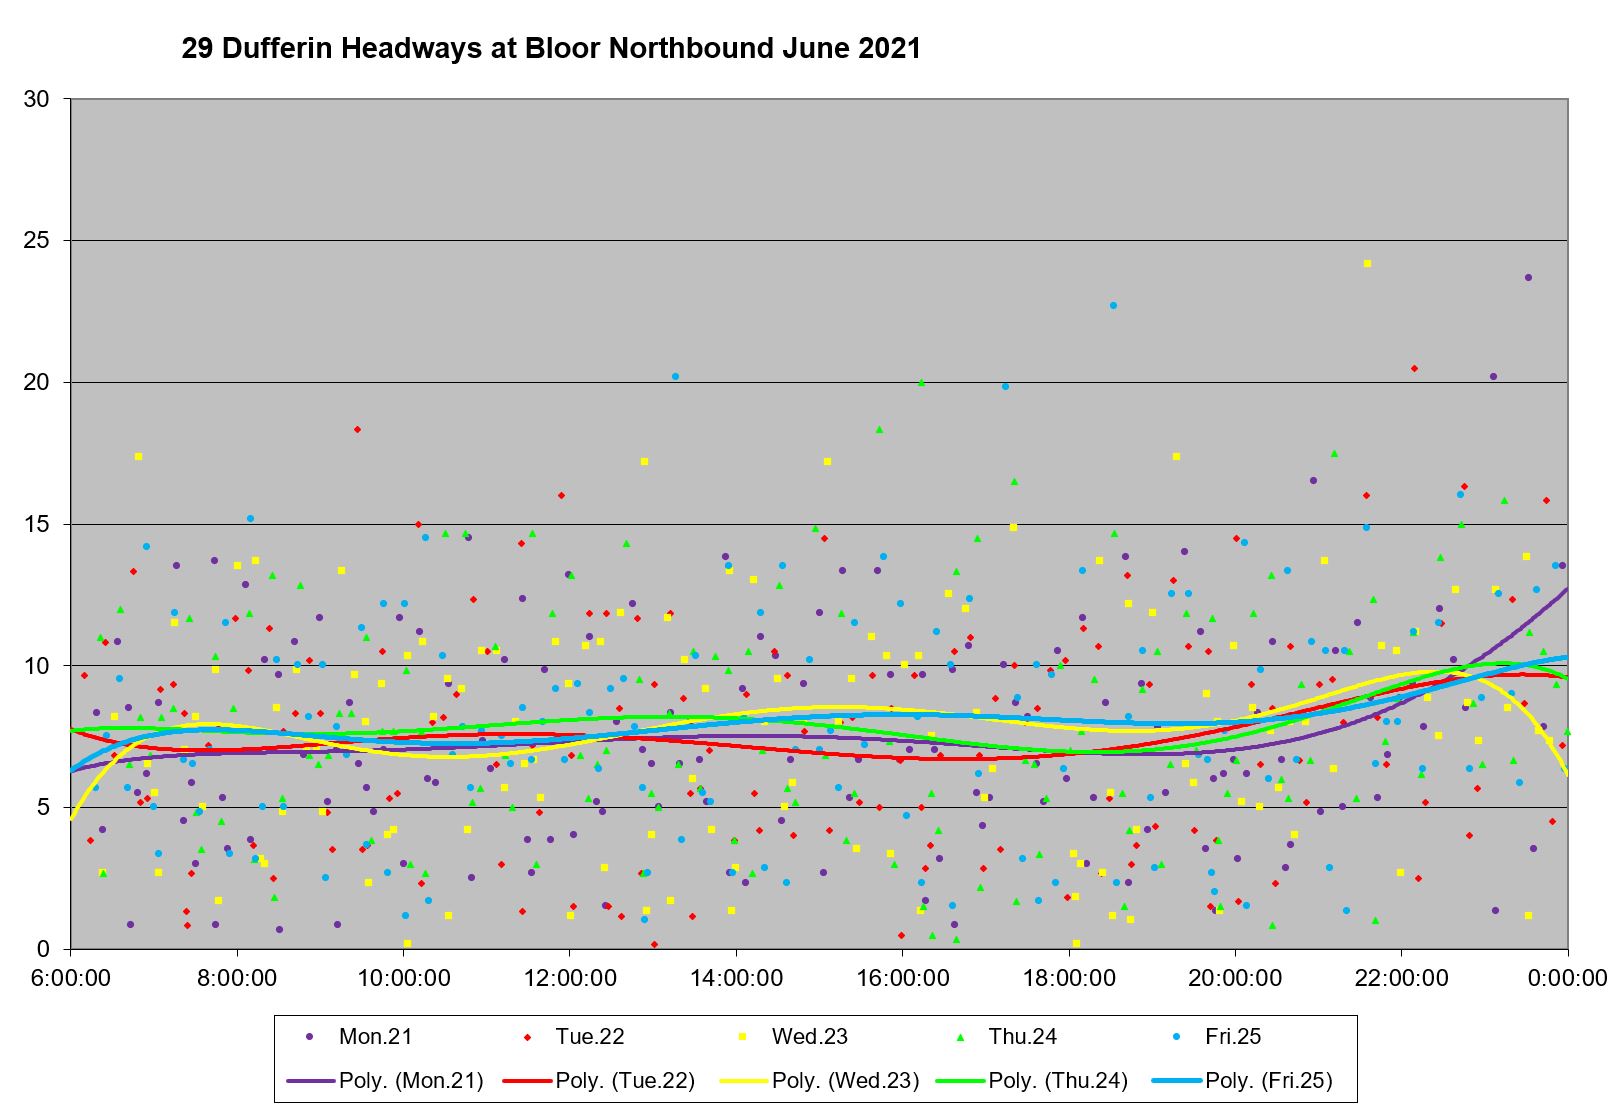
As with all routes in Toronto, travel times dropped with the onset of the pandemic in early 2020. In the charts below showing travel times in each direction between King and Wilson May 2020 is highlighted in red. The blue bar to the left of this shows the averages in April 2018, roughly two years earlier. They are generally higher than even current data, although the degree of difference varies by time of day and day of the week.
Another important consideration in monthly average values is that short-term service interruptions tend not to make much difference in a month of weekdays, and it takes a chronic change such as a long-running construction project to push up these averages. Later in the article I will review a few examples of significant, but short-lived, delays.
The May 2020 values are probably representative of “as good as it gets” travel times because of the lower auto traffic and passenger demand. In effect, this gives some idea of the change available through red lanes. Express service also has some effect, but it is not available to all riders on a route, only those travelling between express stops.
Although there is a visible AM peak on the April 2018 data, for the most part the values on local and express services are flat until early afternoon when they rise for a more “conventional” PM peak, and then fall through the evening.
Travel times rise between May 2020 and the Fall, but drop off again in early 2021. In “normal” years there is a spike on Dufferin northbound in December due to congestion at Yorkdale Mall. This did not occur in 2020.
929 Express Service
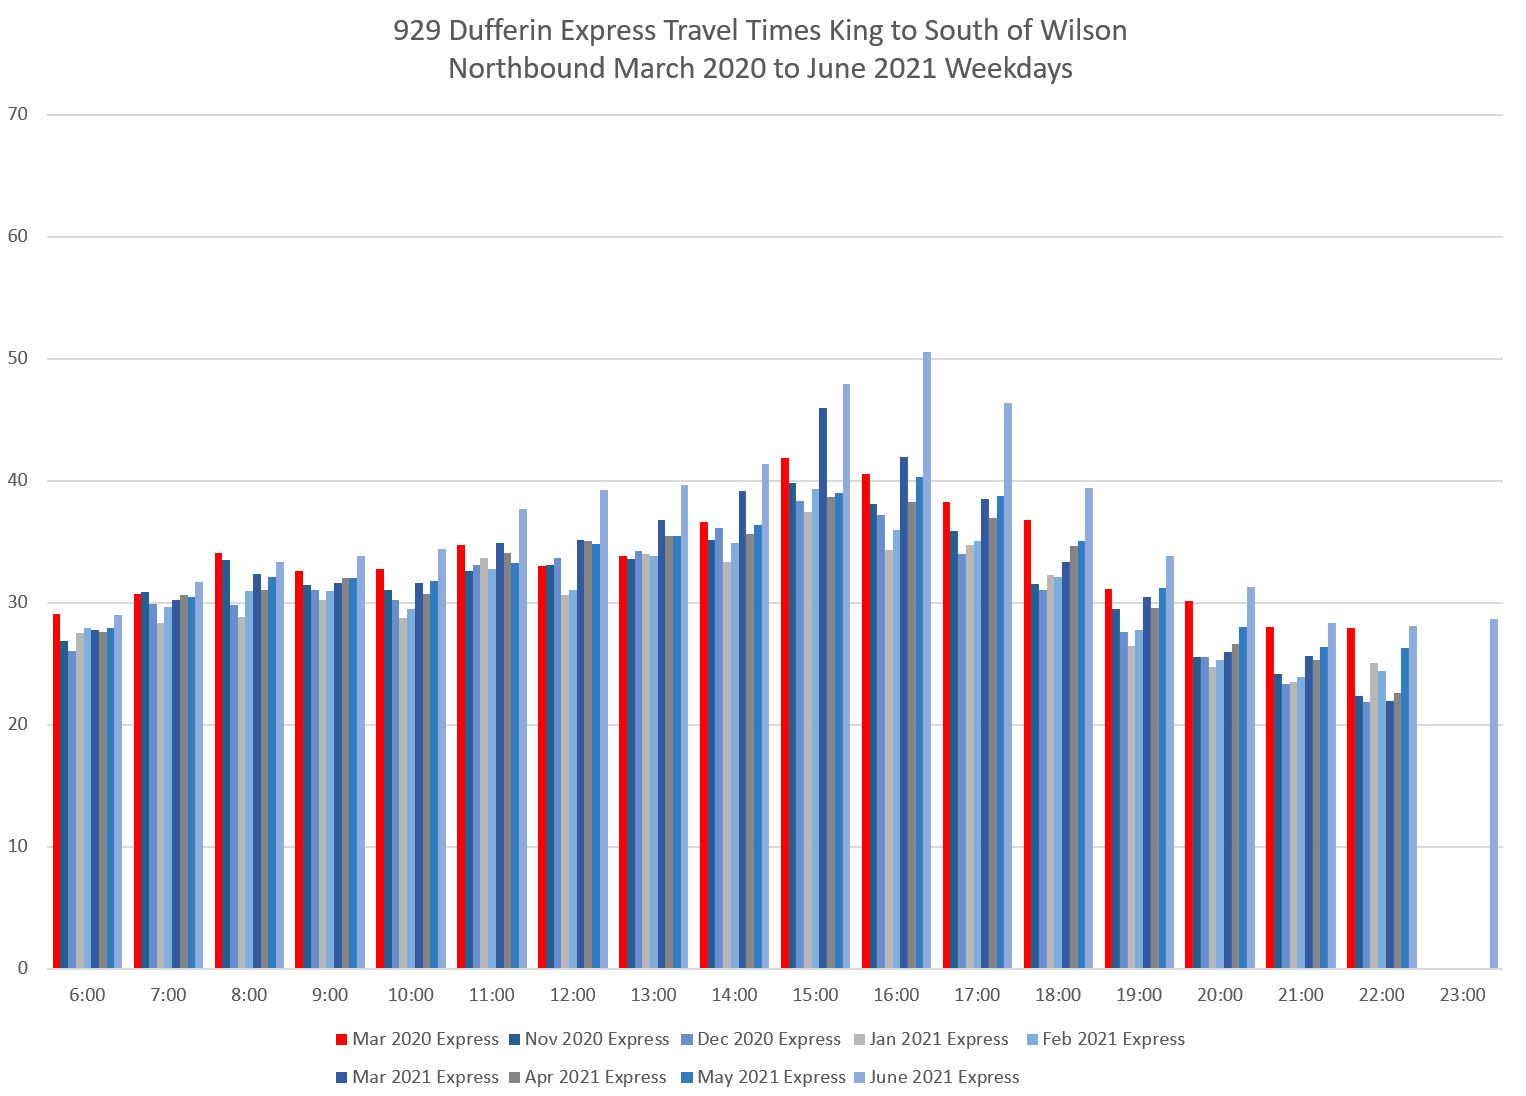
The 929 Express did not exist in April 2018, nor was there a “29E” express service. Therefore, all data shown for that month are for local buses only, not a mixture of locals and expresses.
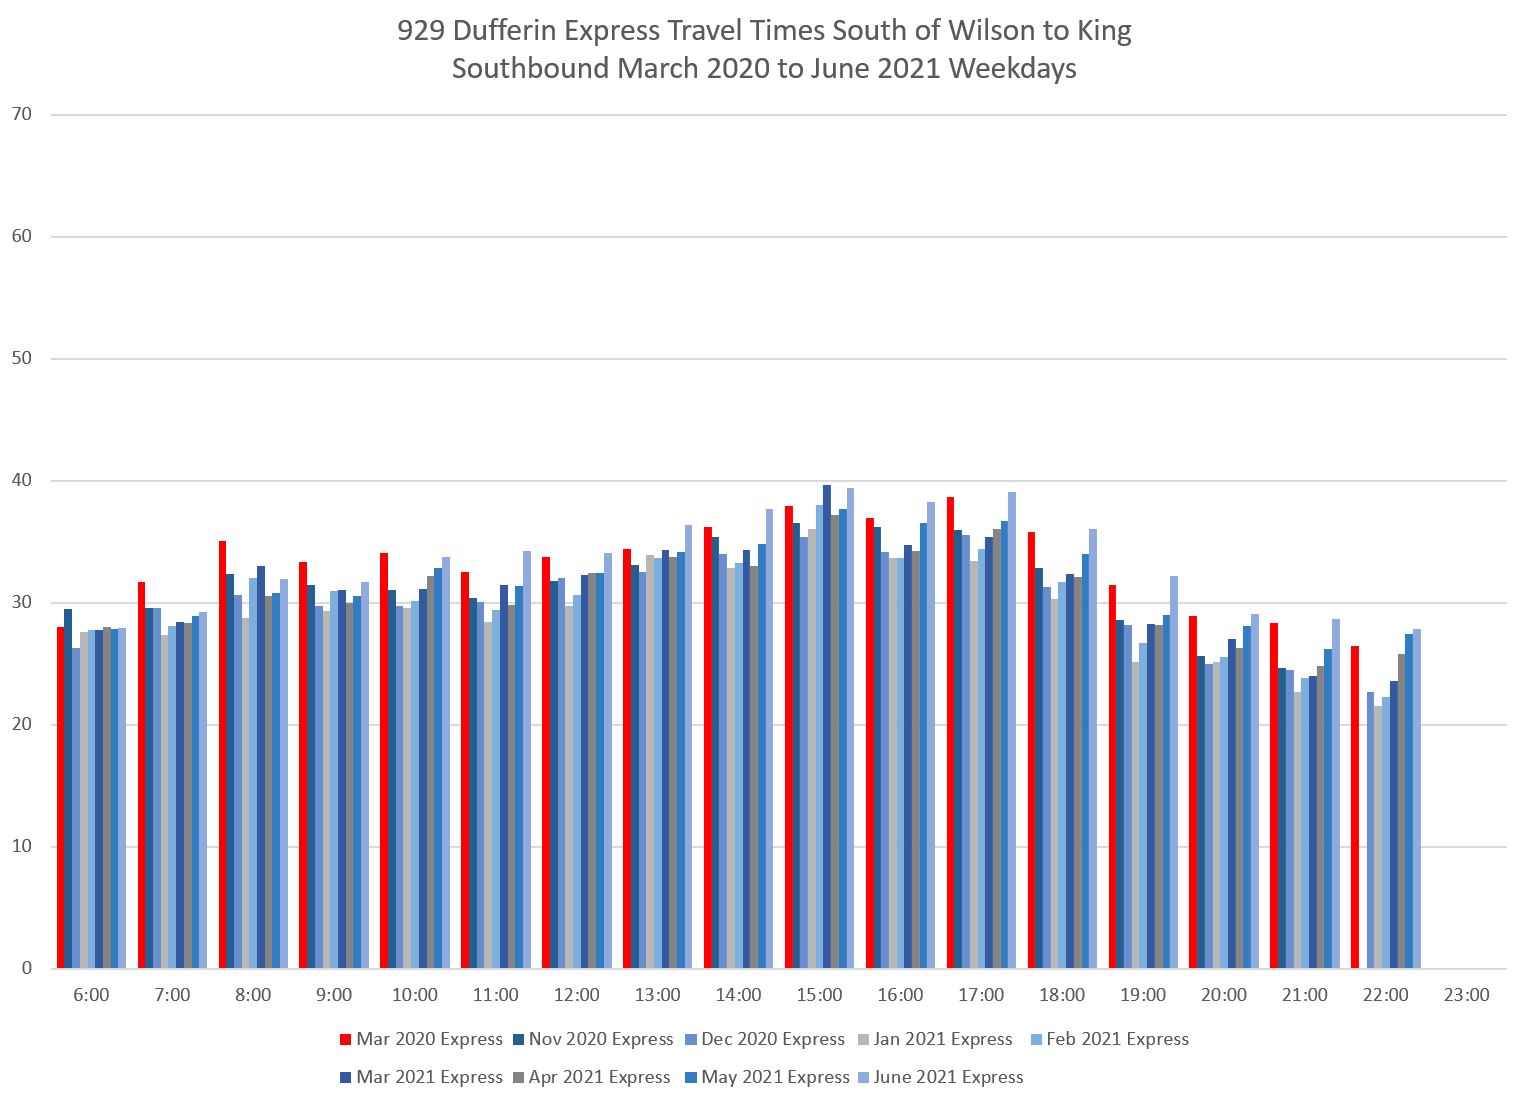
The express service began in October 2018, but lasted only until March 2020 when most express routes were shut down for the pandemic. It resumed operation in November 2020. Here are its average travel times since then.
Note that these times have been growing slowly since November. On Dufferin, it is tempting to blame the Eglinton LRT for delays. While there are some cases of slow operation through the Eglinton/Dufferin area, this is not the only place on the route with delays, notably near Yorkdale. Note that the effect is stronger northbound than southbound.
The illustrations below were replaced on August 8, 2021, to include data for March 2020. See also the week-by-week breakdown in the following section.
Weekly Breakdowns
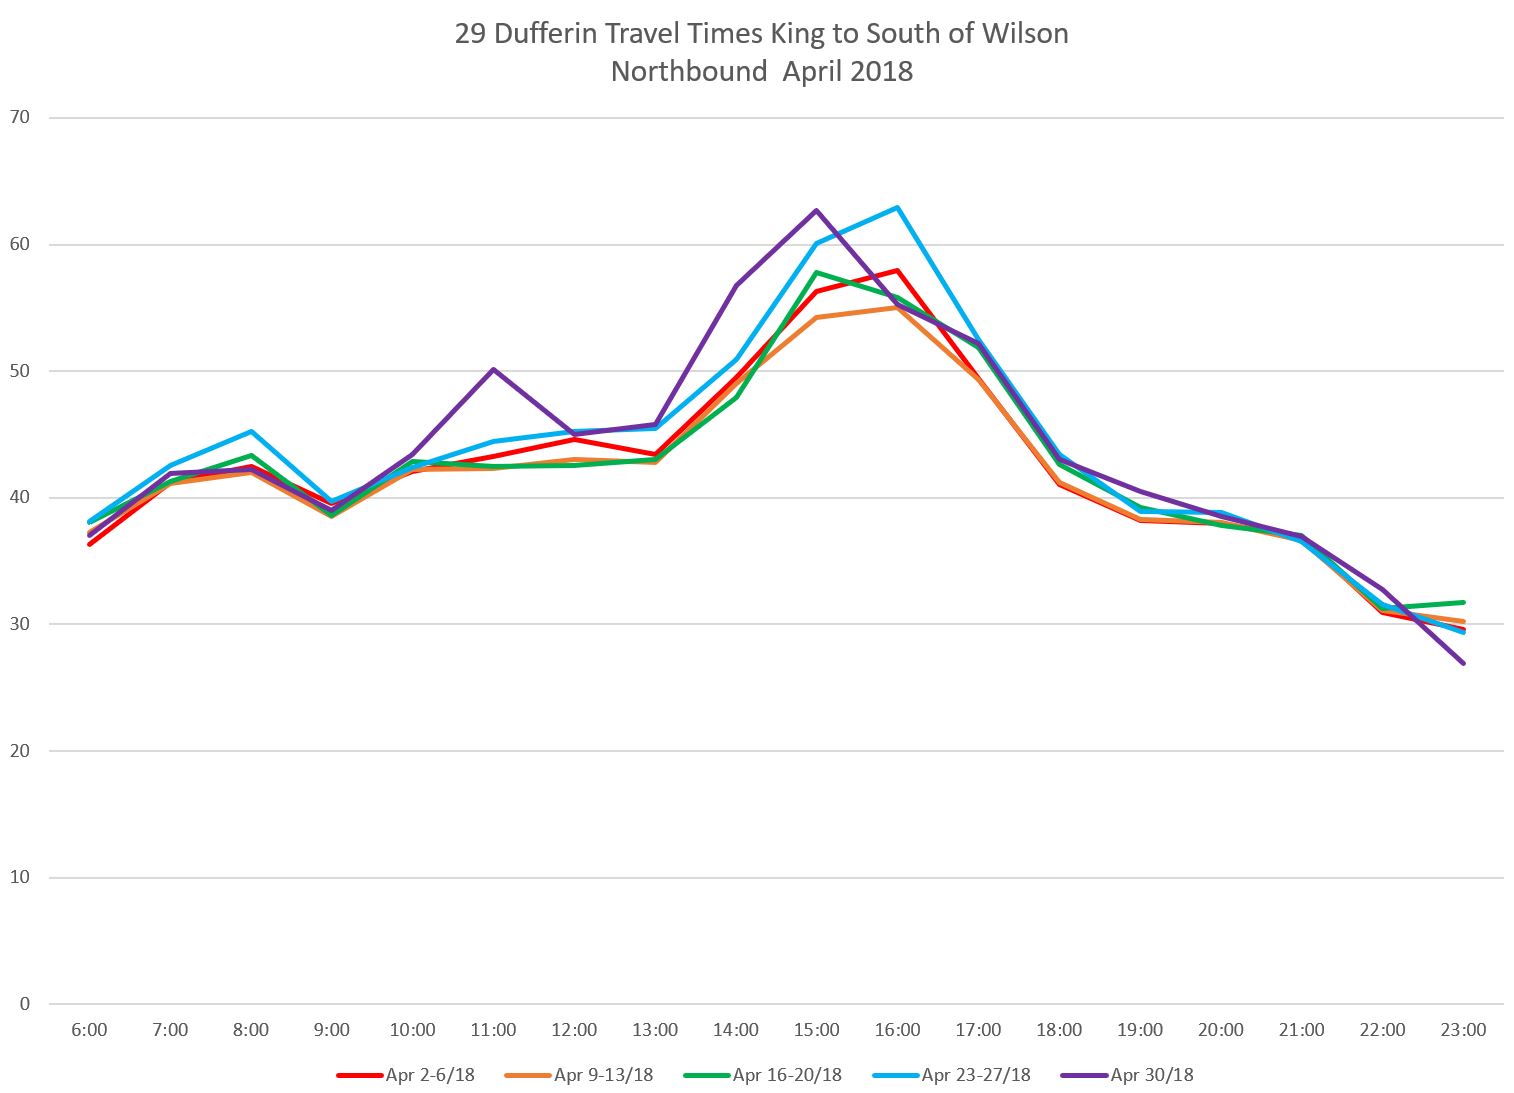
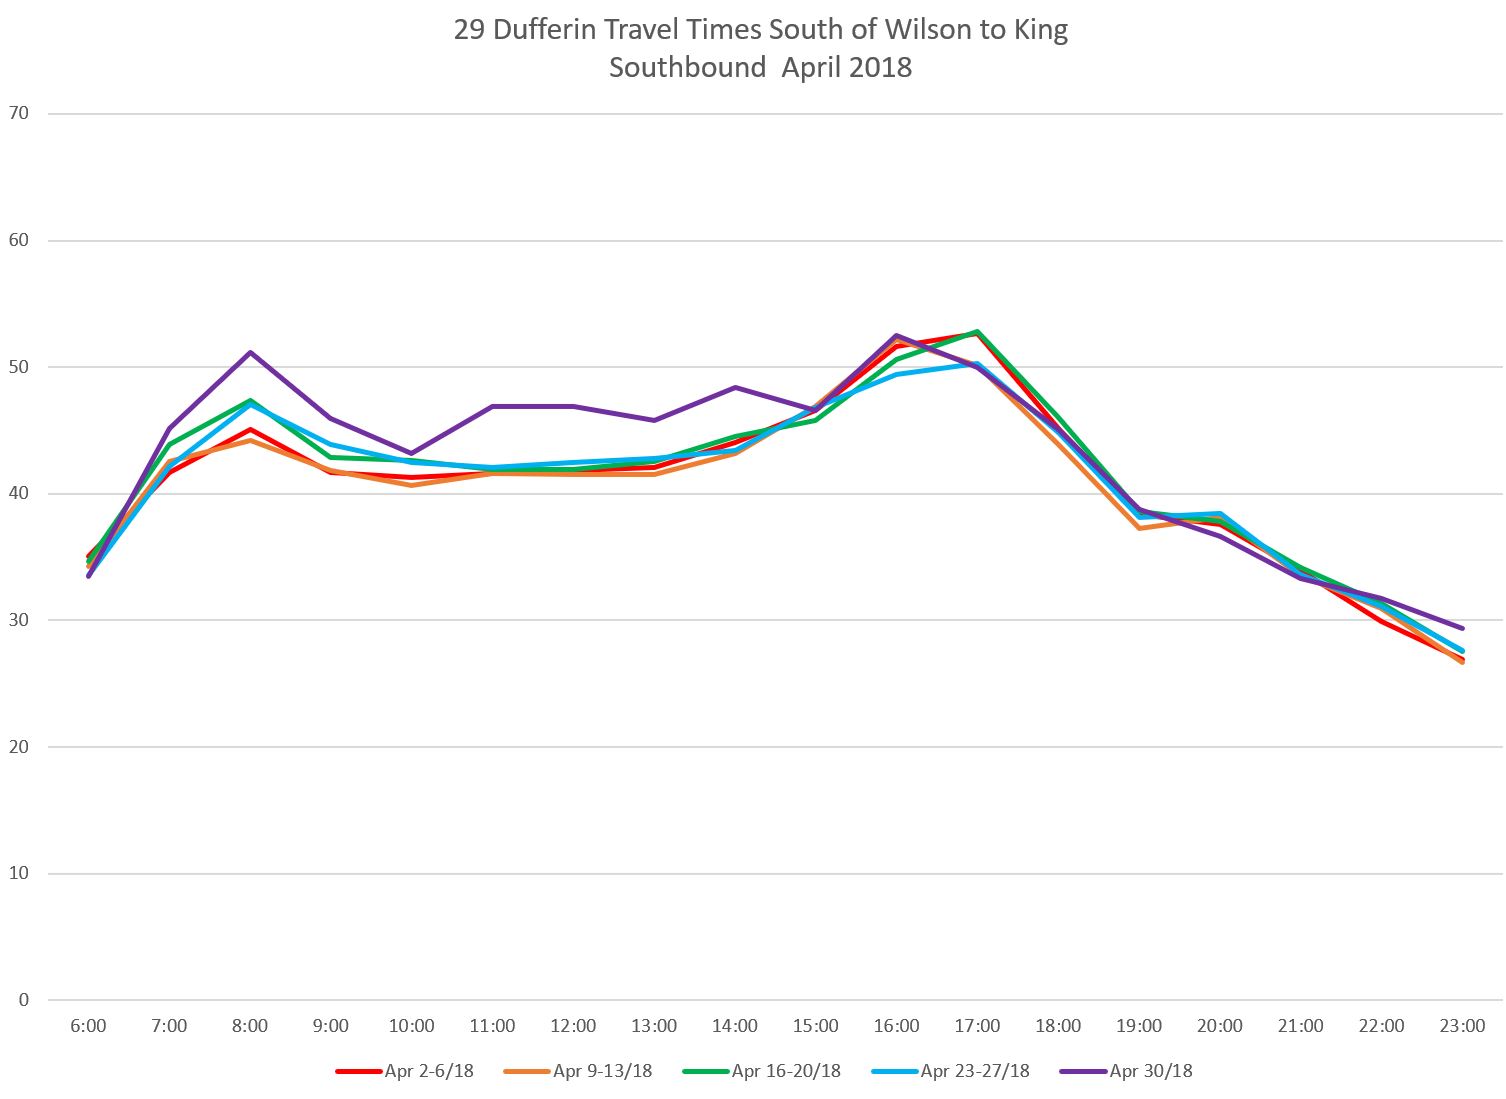
April 2018
The difference in travel time profiles is more evident when the data are broken down weekly rather than monthly. Here are the April 2018 charts for 29 Dufferin. The PM Peak is particularly strong northbound, whereas the two peaks are more closely balanced southbound.
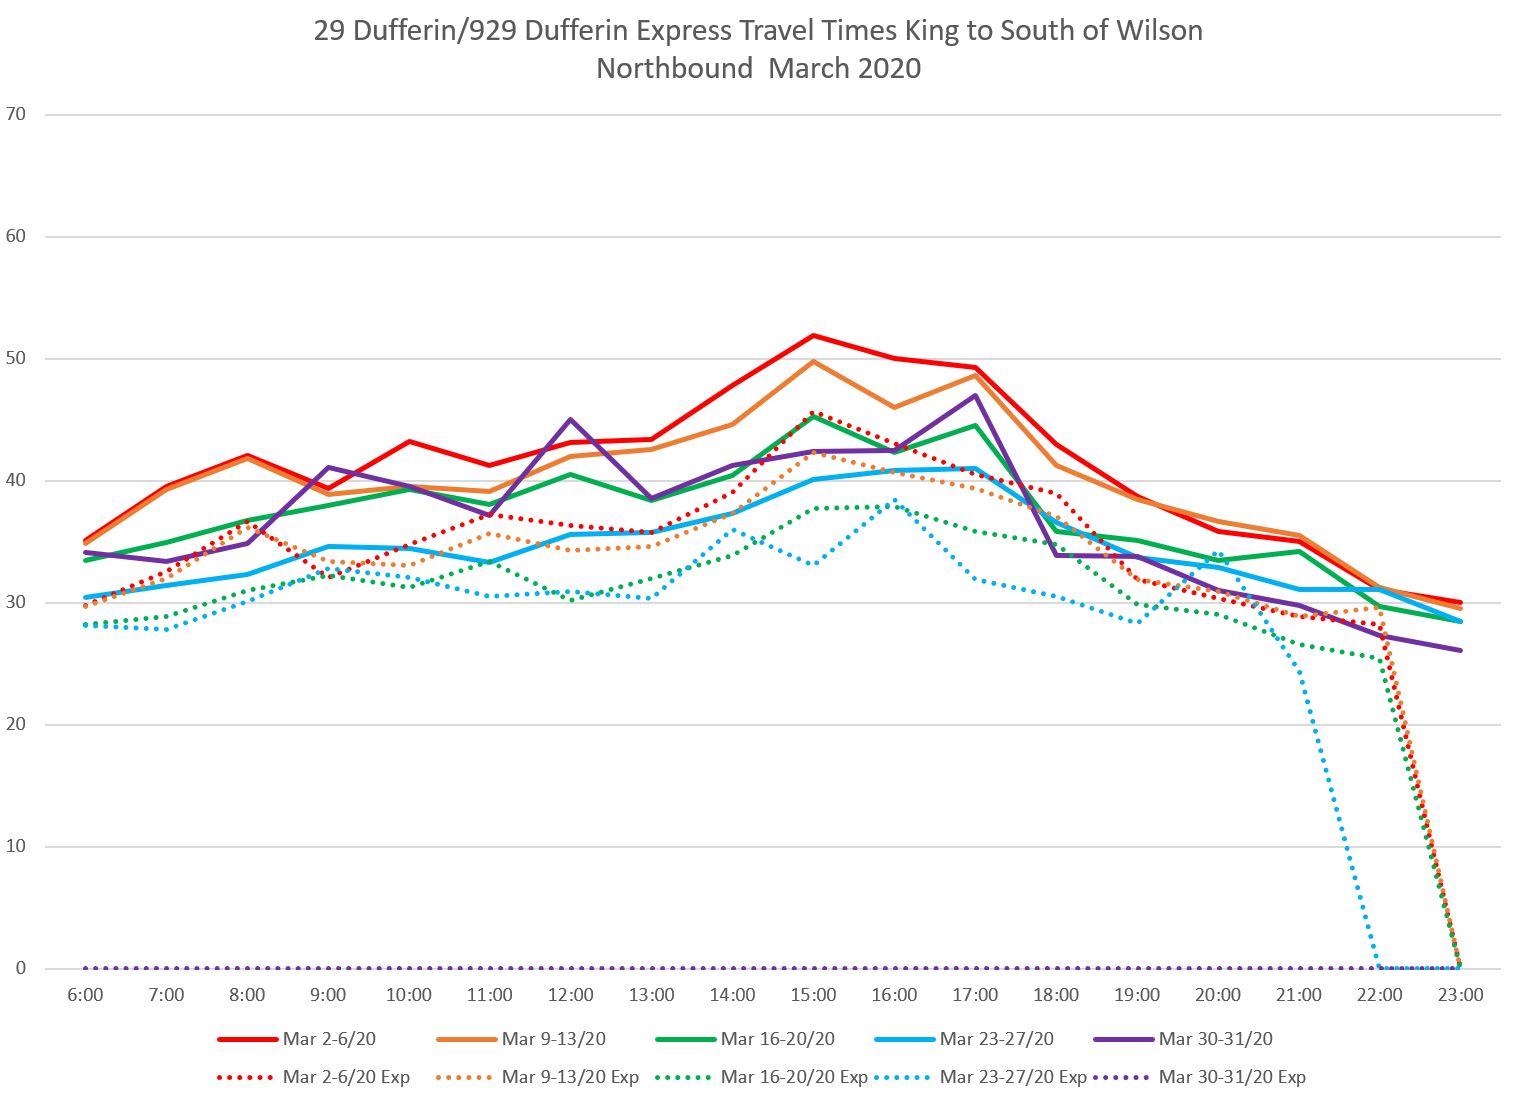
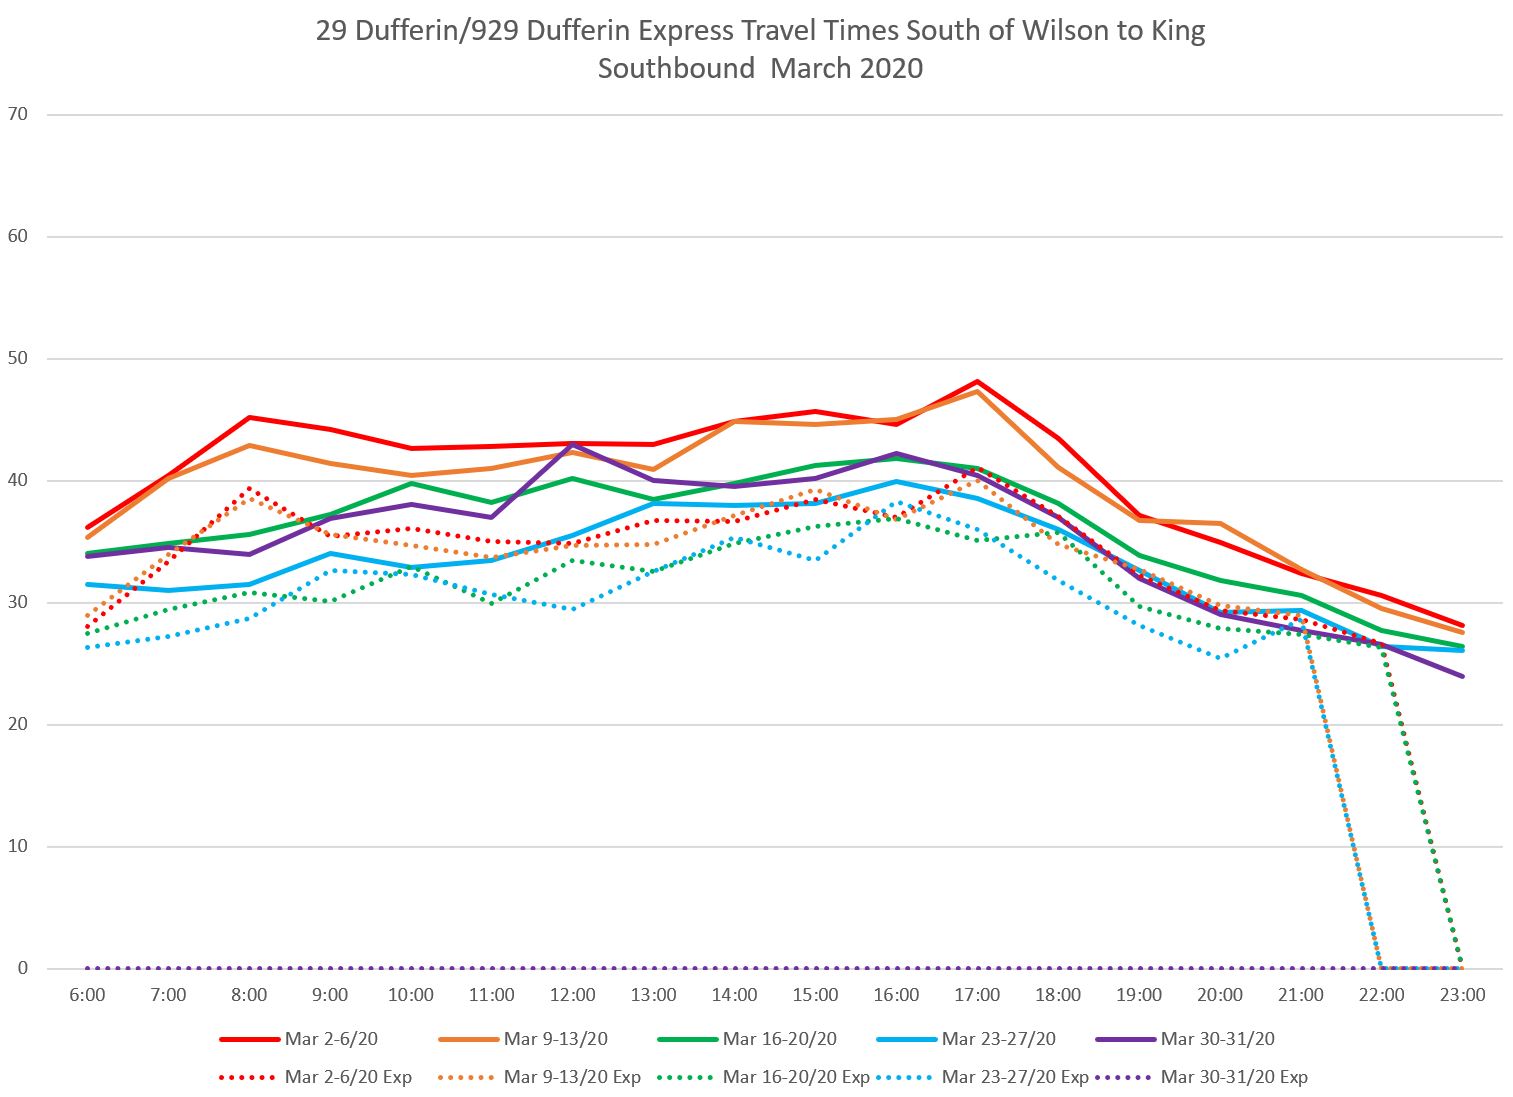
March 2020
This section was added on August 8, 2021, to illustrate the change in travel speeds during the transitional month as demand and traffic levels fell.
The onset of the pandemic and the city’s shutdown can be seen in the change in travel times for the local and express services. Week 1 (red) has the highest times with week 2 (orange) slightly below. There is a big drop in weeks 3 and 4 (green and turquoise), and then a rise again in week 5 (purple). The values for the express service in week 5 are zero because all express trips were cancelled and the 929 Dufferin Express, along with much of the Express Bus Network, ceased to operate.
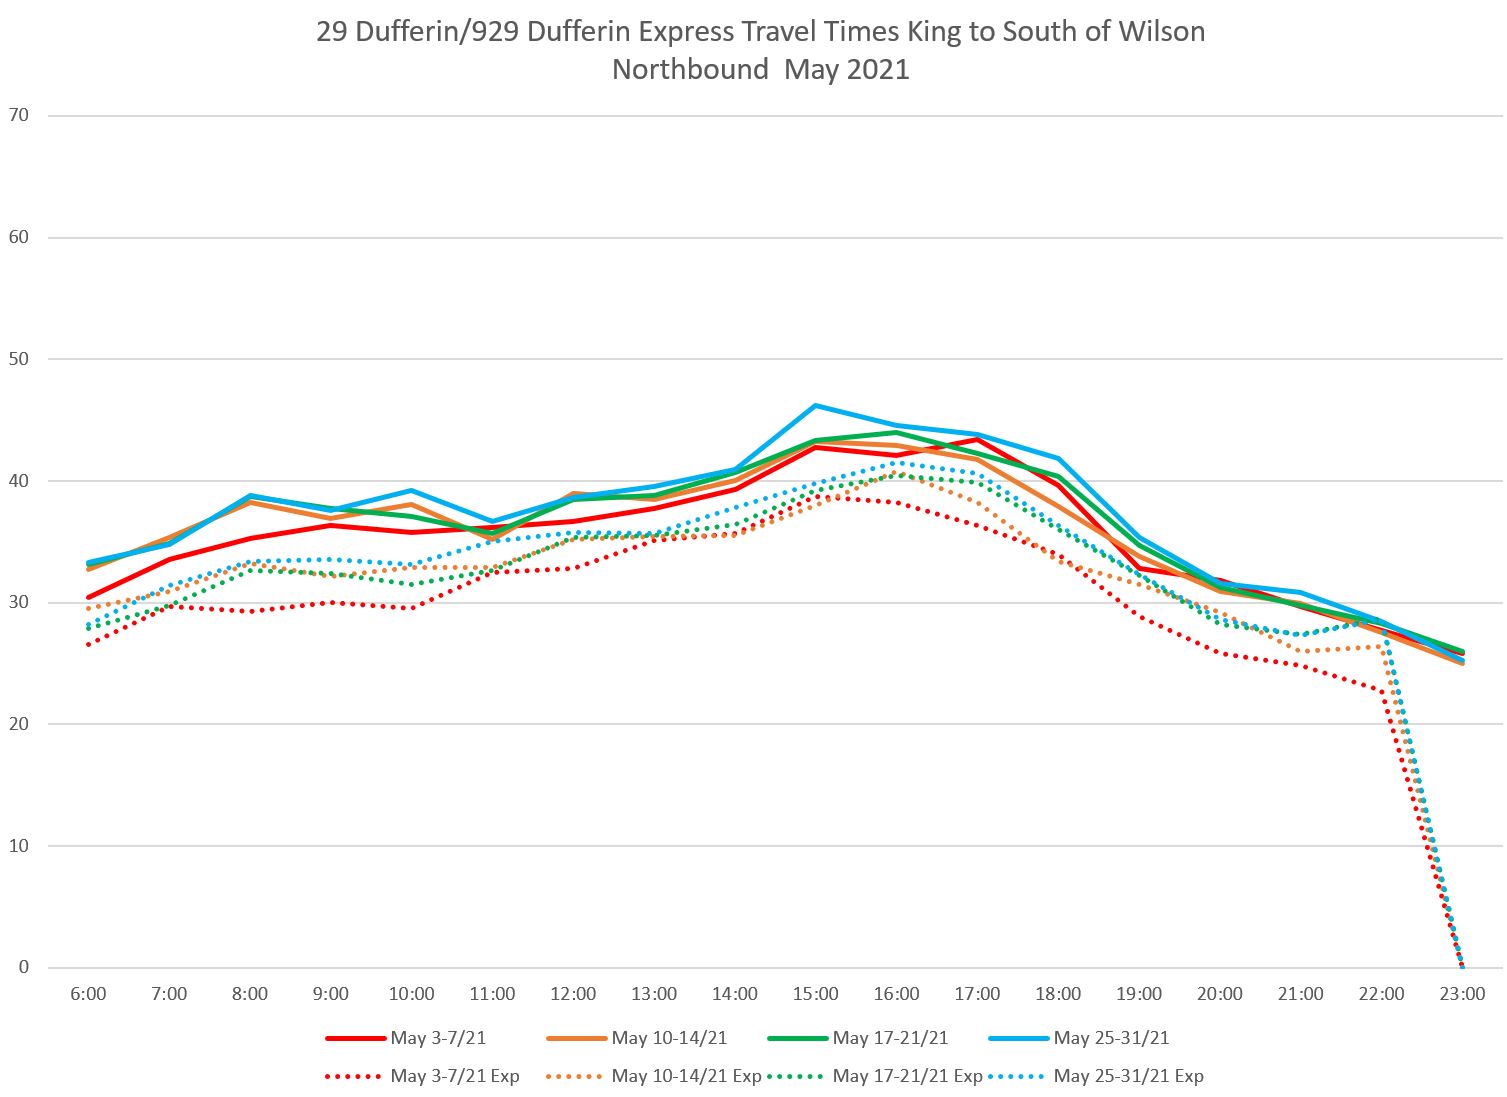
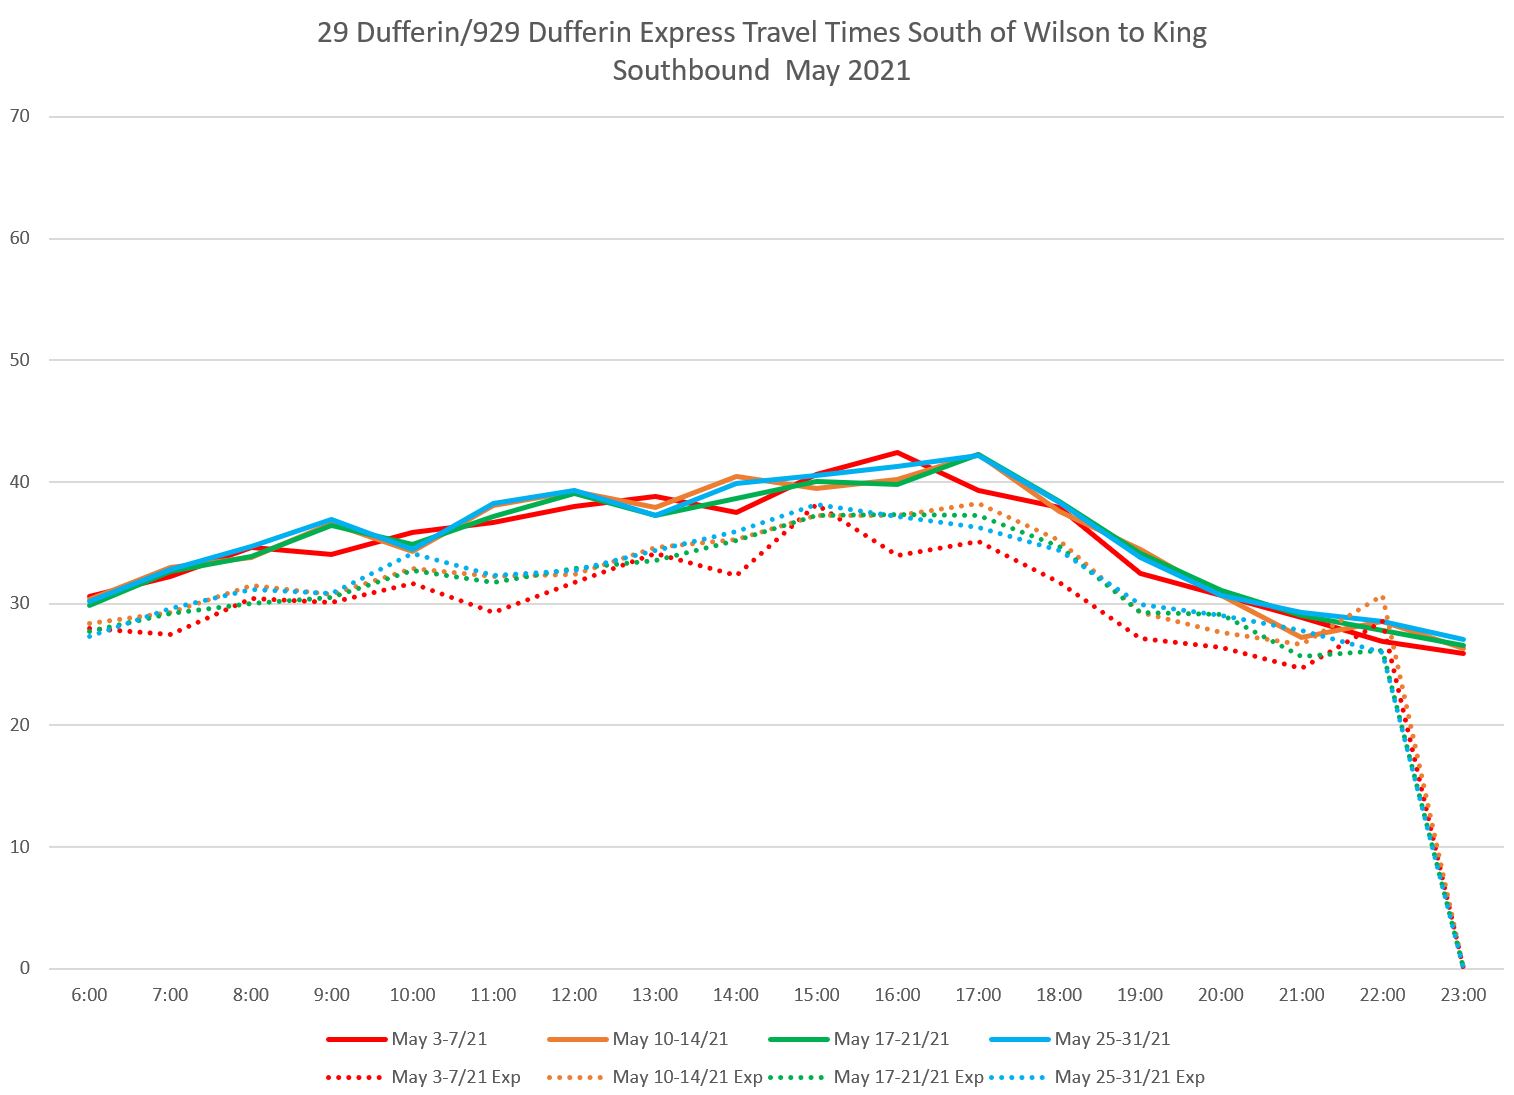
May 2021
In May 2021, the peaks are noticeably lower. Note that there is not a large difference between express and local travel times in the afternoon and early evening.
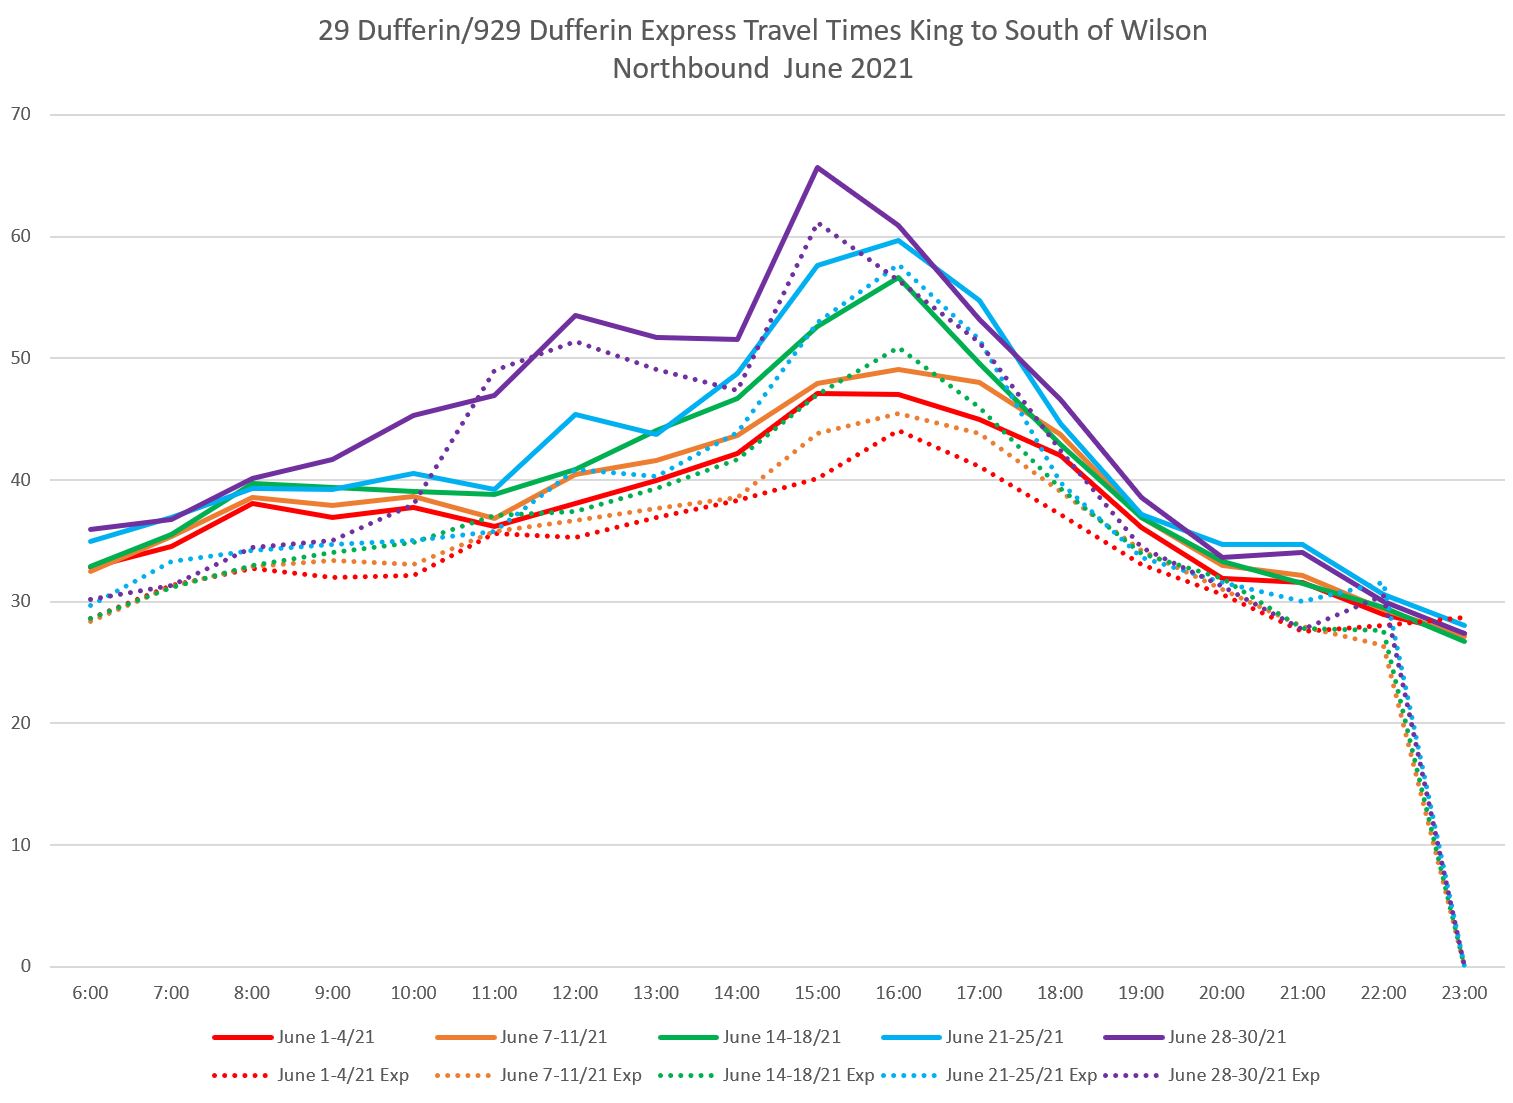
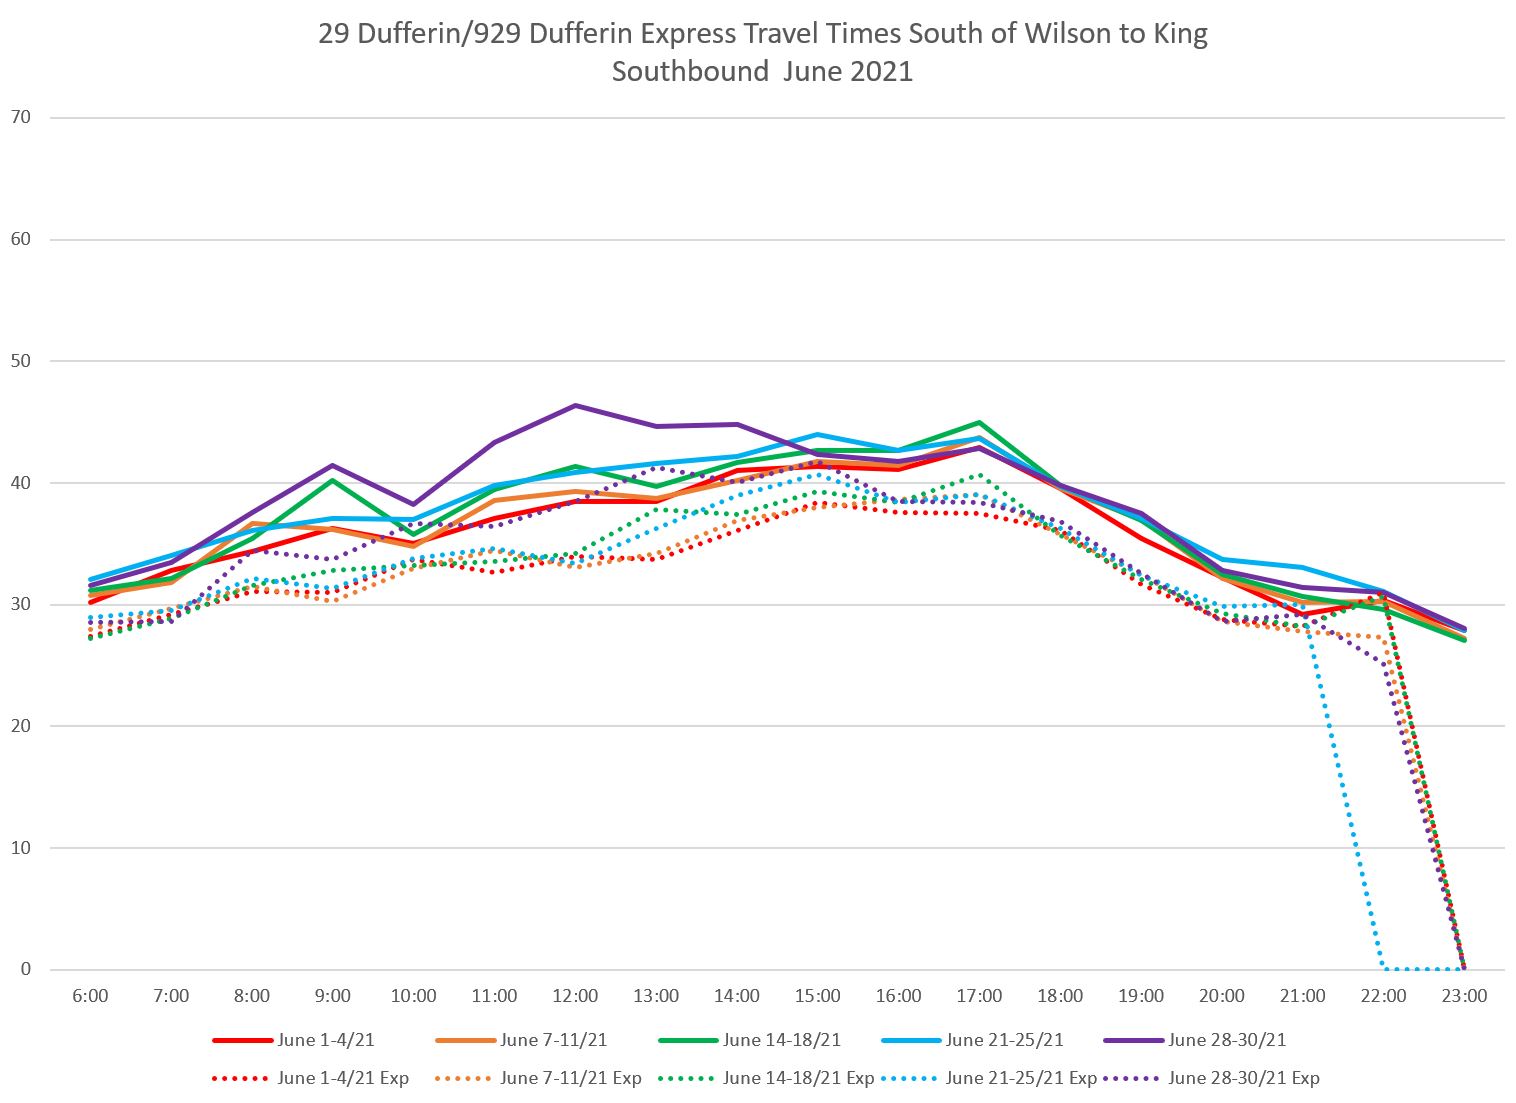
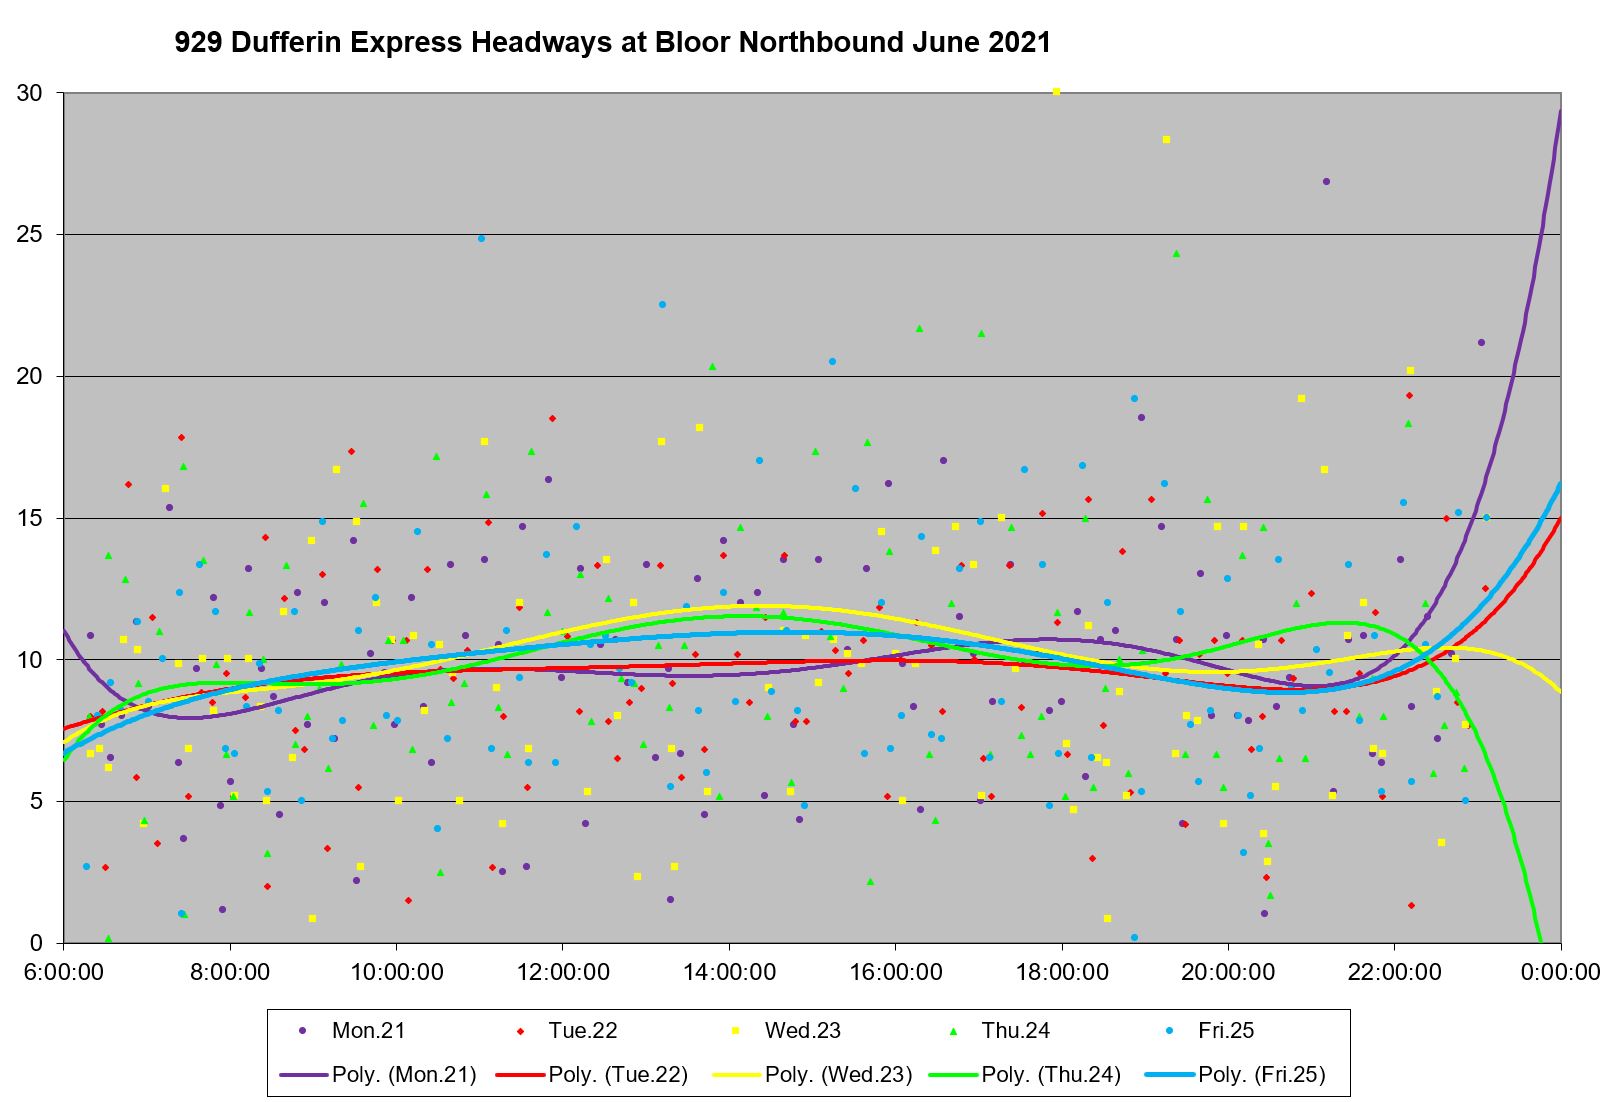
June 2021
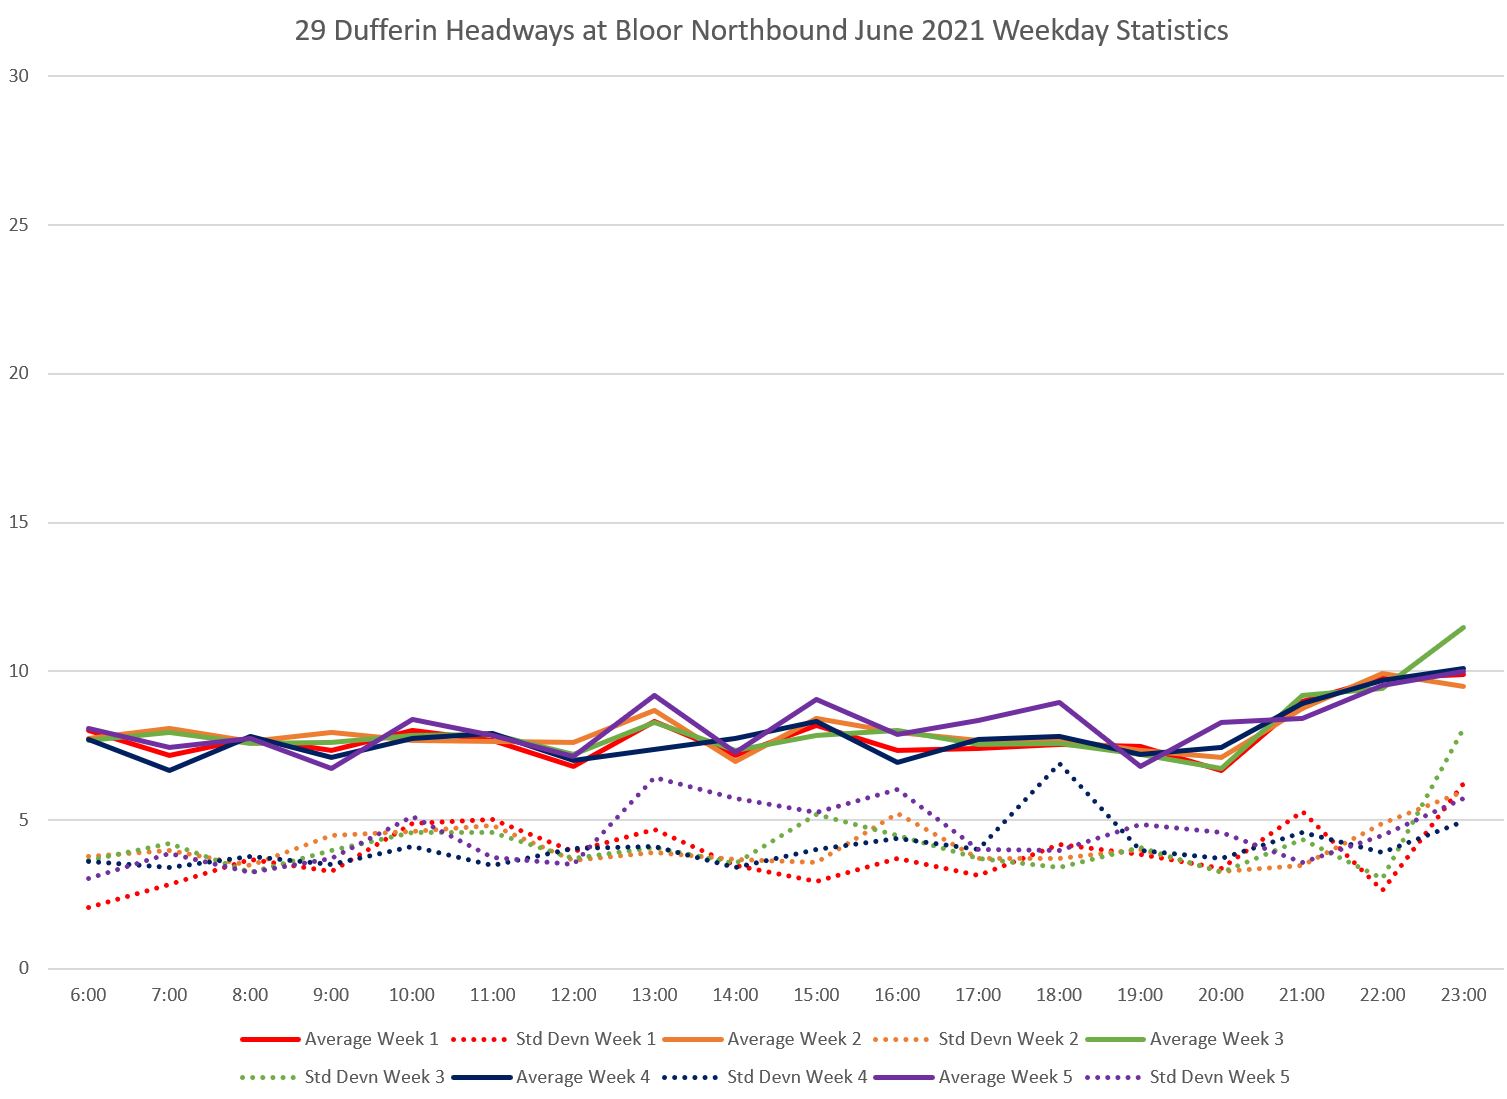
June 2021 shows, beginning in week 3 (green), the effect of growing congestion and delays on the route that affects both the local and express service. This is predominantly a northbound problem. Only week 5 (purple) southbound has slightly longer travel times, and these are at midday, not in the PM peak.
An important point here is that routes do suffer delays in some times and places, but the effect is not necessarily permanent or bidirectional. (I will update these charts with July 2021 data when available to track the evolution of this situation.)
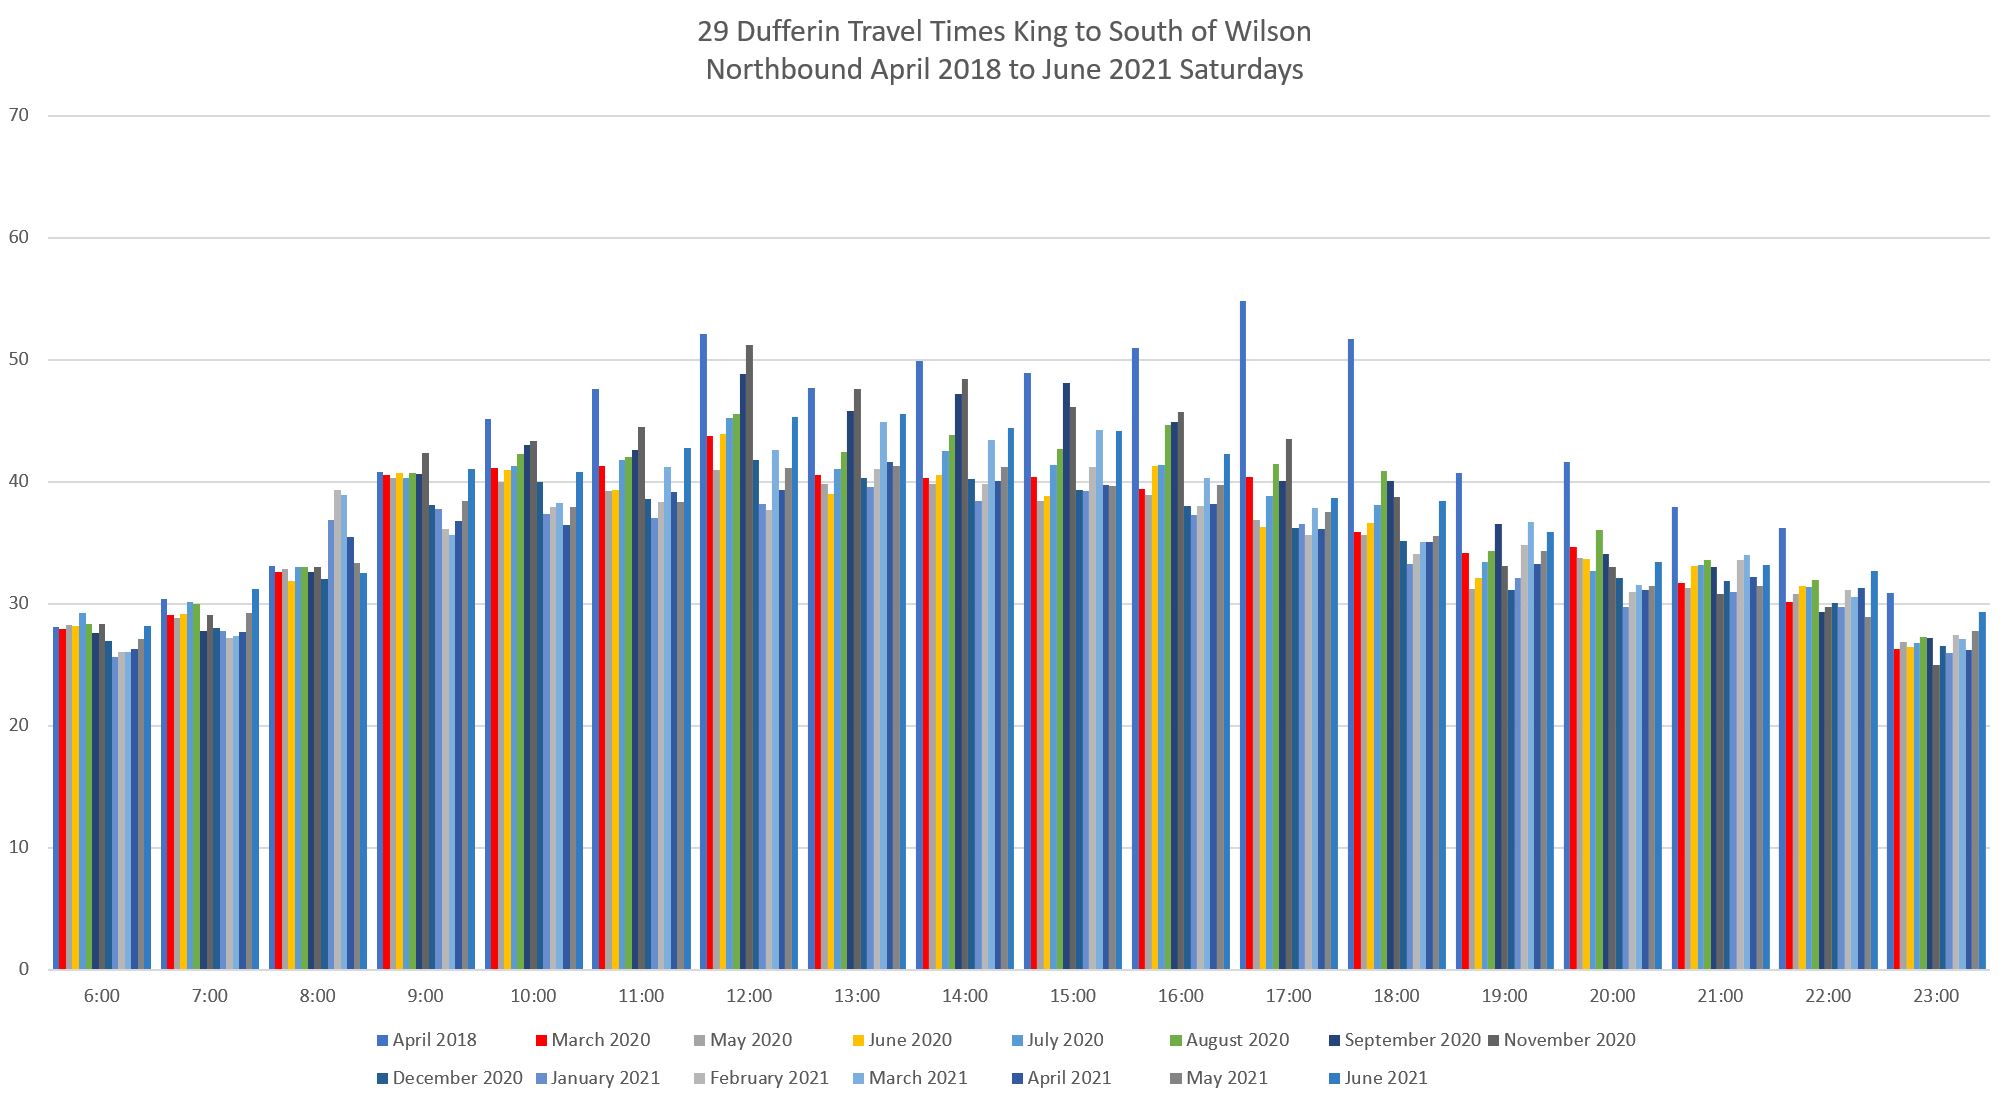
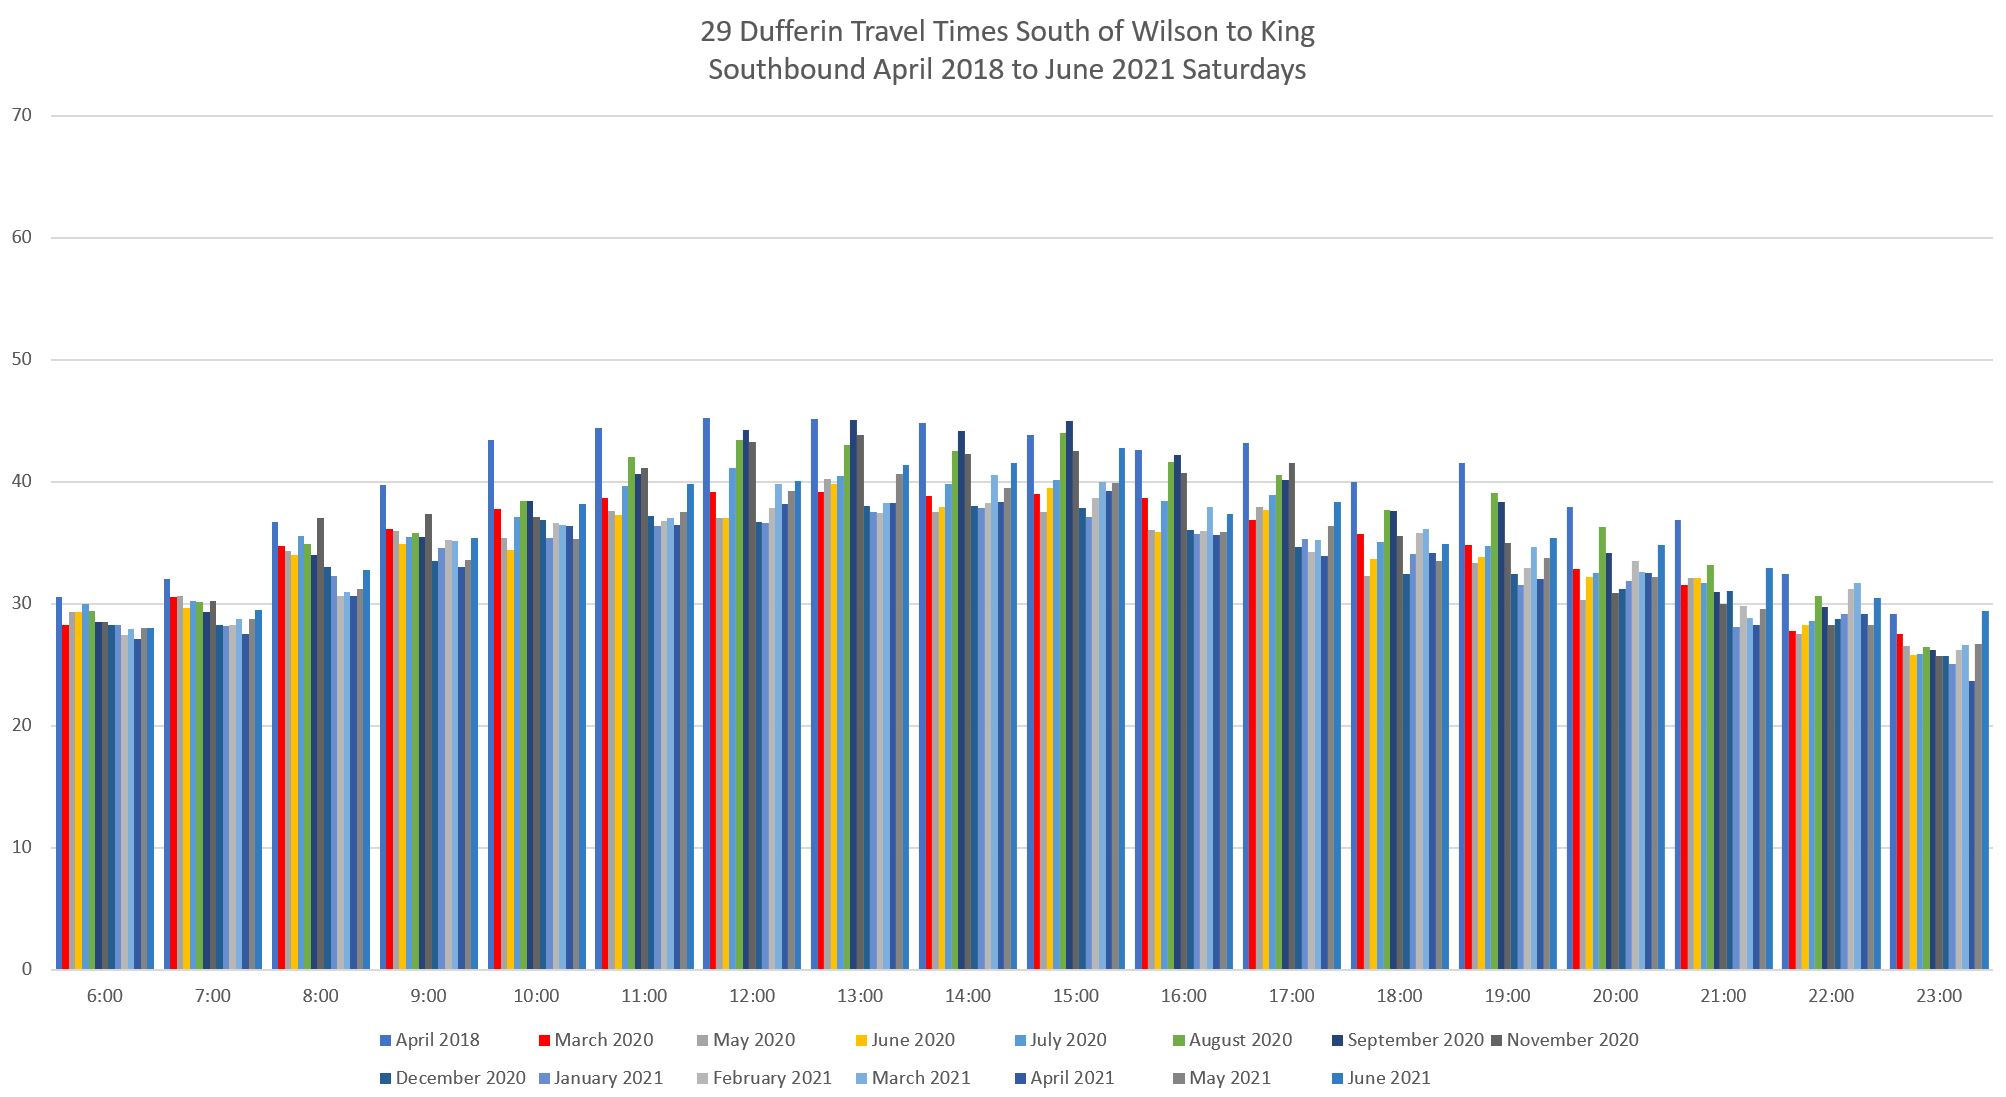
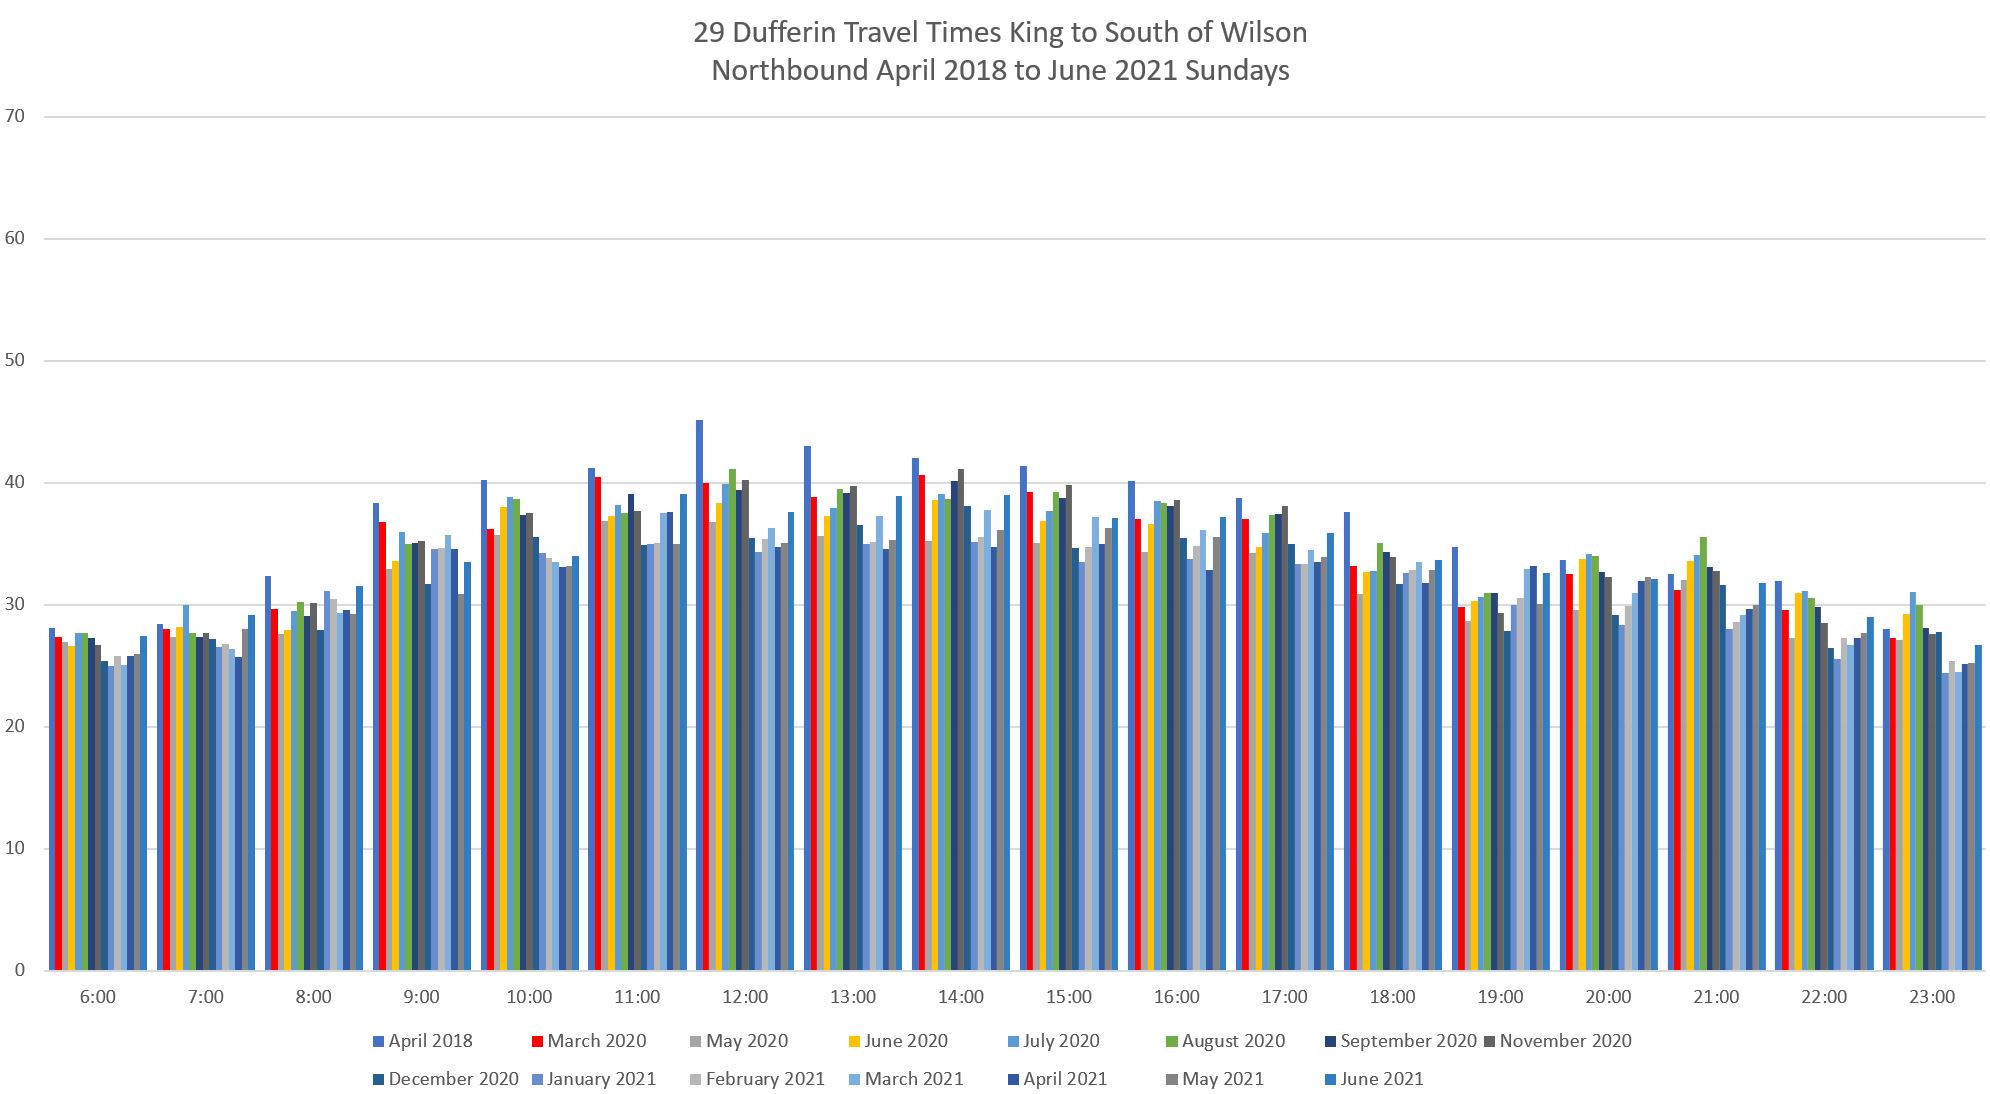
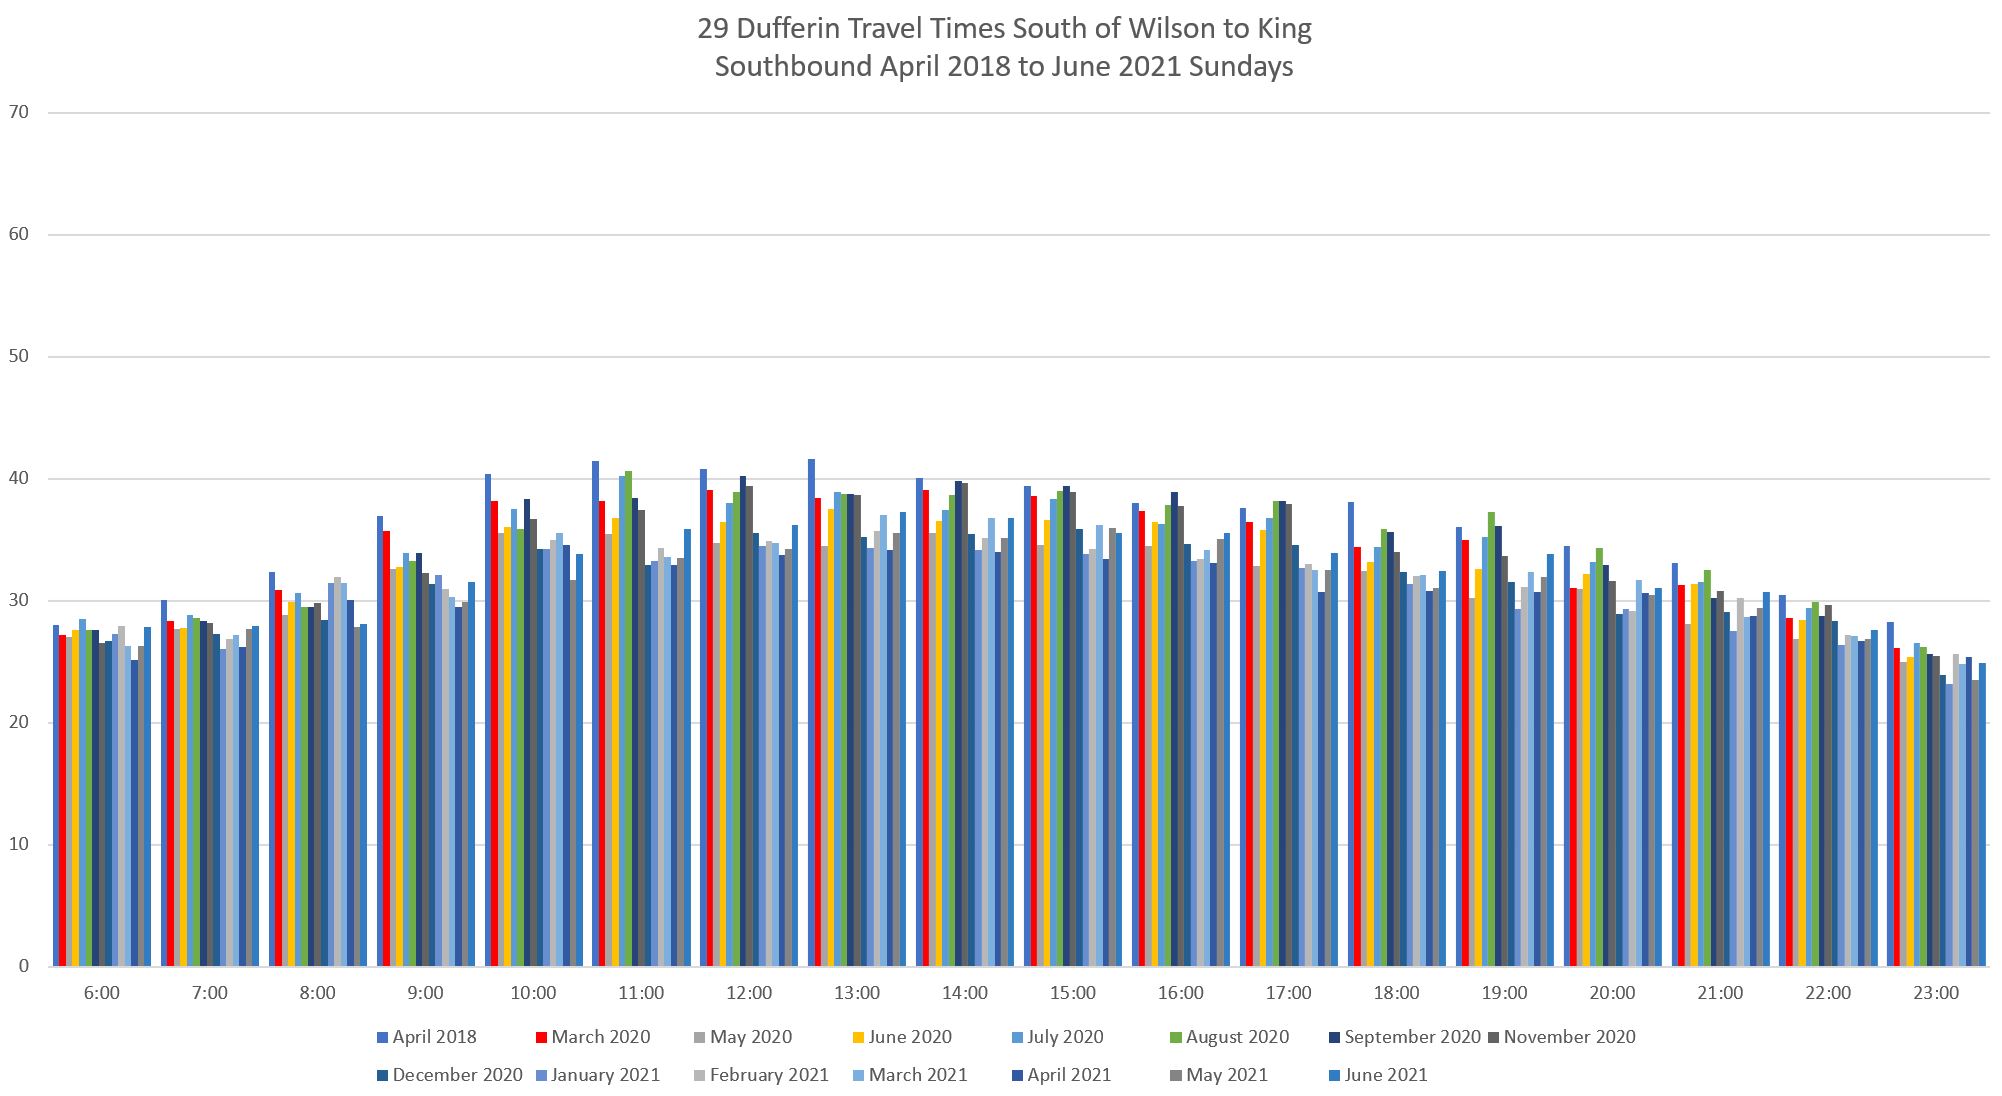
Weekends
Weekend travel times did not change as much over time as weekdays with the exception of Saturday afternoons, moreso northbound than southbound. This is an example of how congestion was and is not simply a peak period problem.
An important distinction in discussing transit priority lanes will be the degree to which they contribute to service reliability. The King Street transit mall was a very different location from the bus routes where red lanes are proposed. King Street has very frequent transit service and strong transit demand, not to mention pedestrian activity and crowd-generating events year-round. It also has parallel streets to which traffic could shift.
How much benefit can actually be achieved on Dufferin is quite another question. A political challenge lies in the fact that there are problem areas on Dufferin, but not all of the time. Red lanes are a 7×24 change in a street’s configuration and their overall benefit must be strong enough to survive challenges. A good analogy on King Street is the carve-out for taxis that was implemented and contributed to motorists generally ignoring the traffic rules even before 2020.
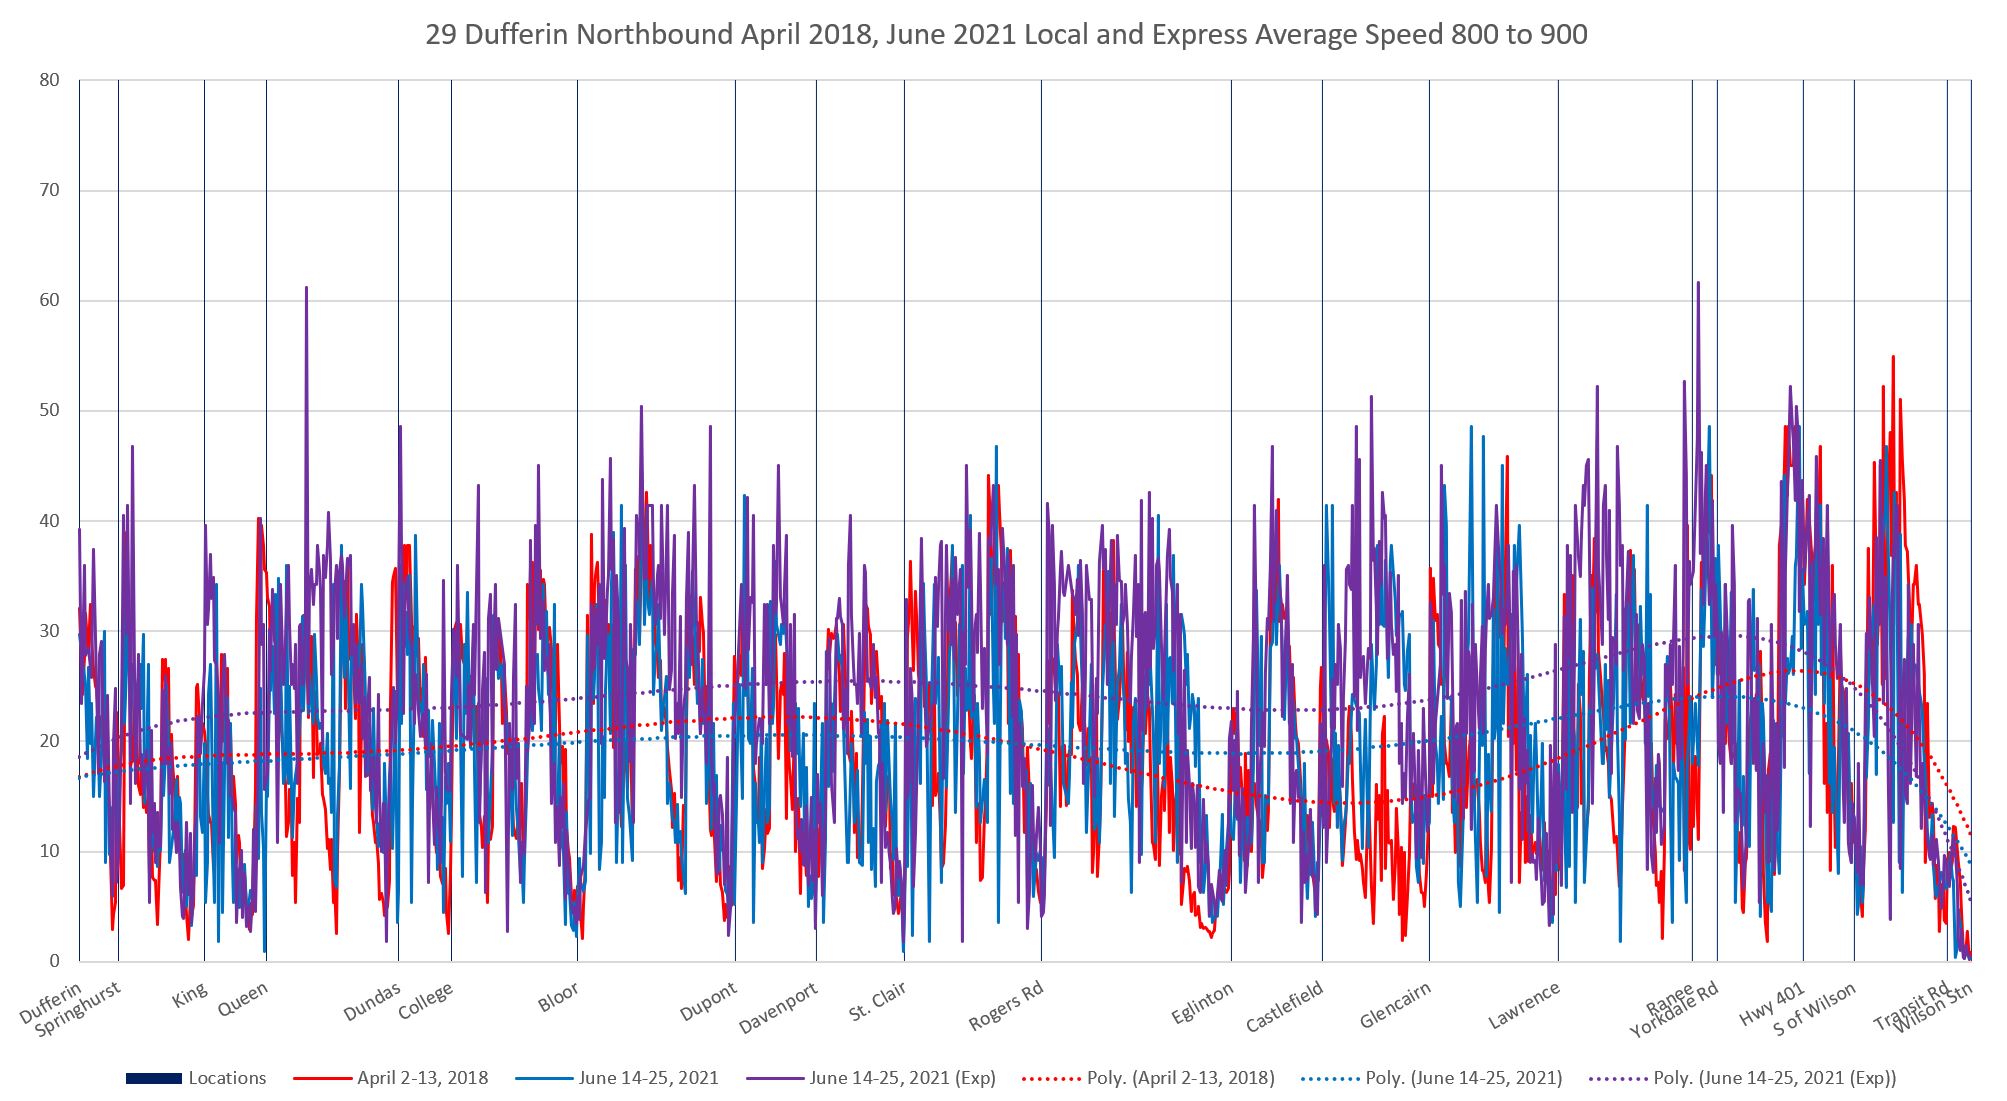
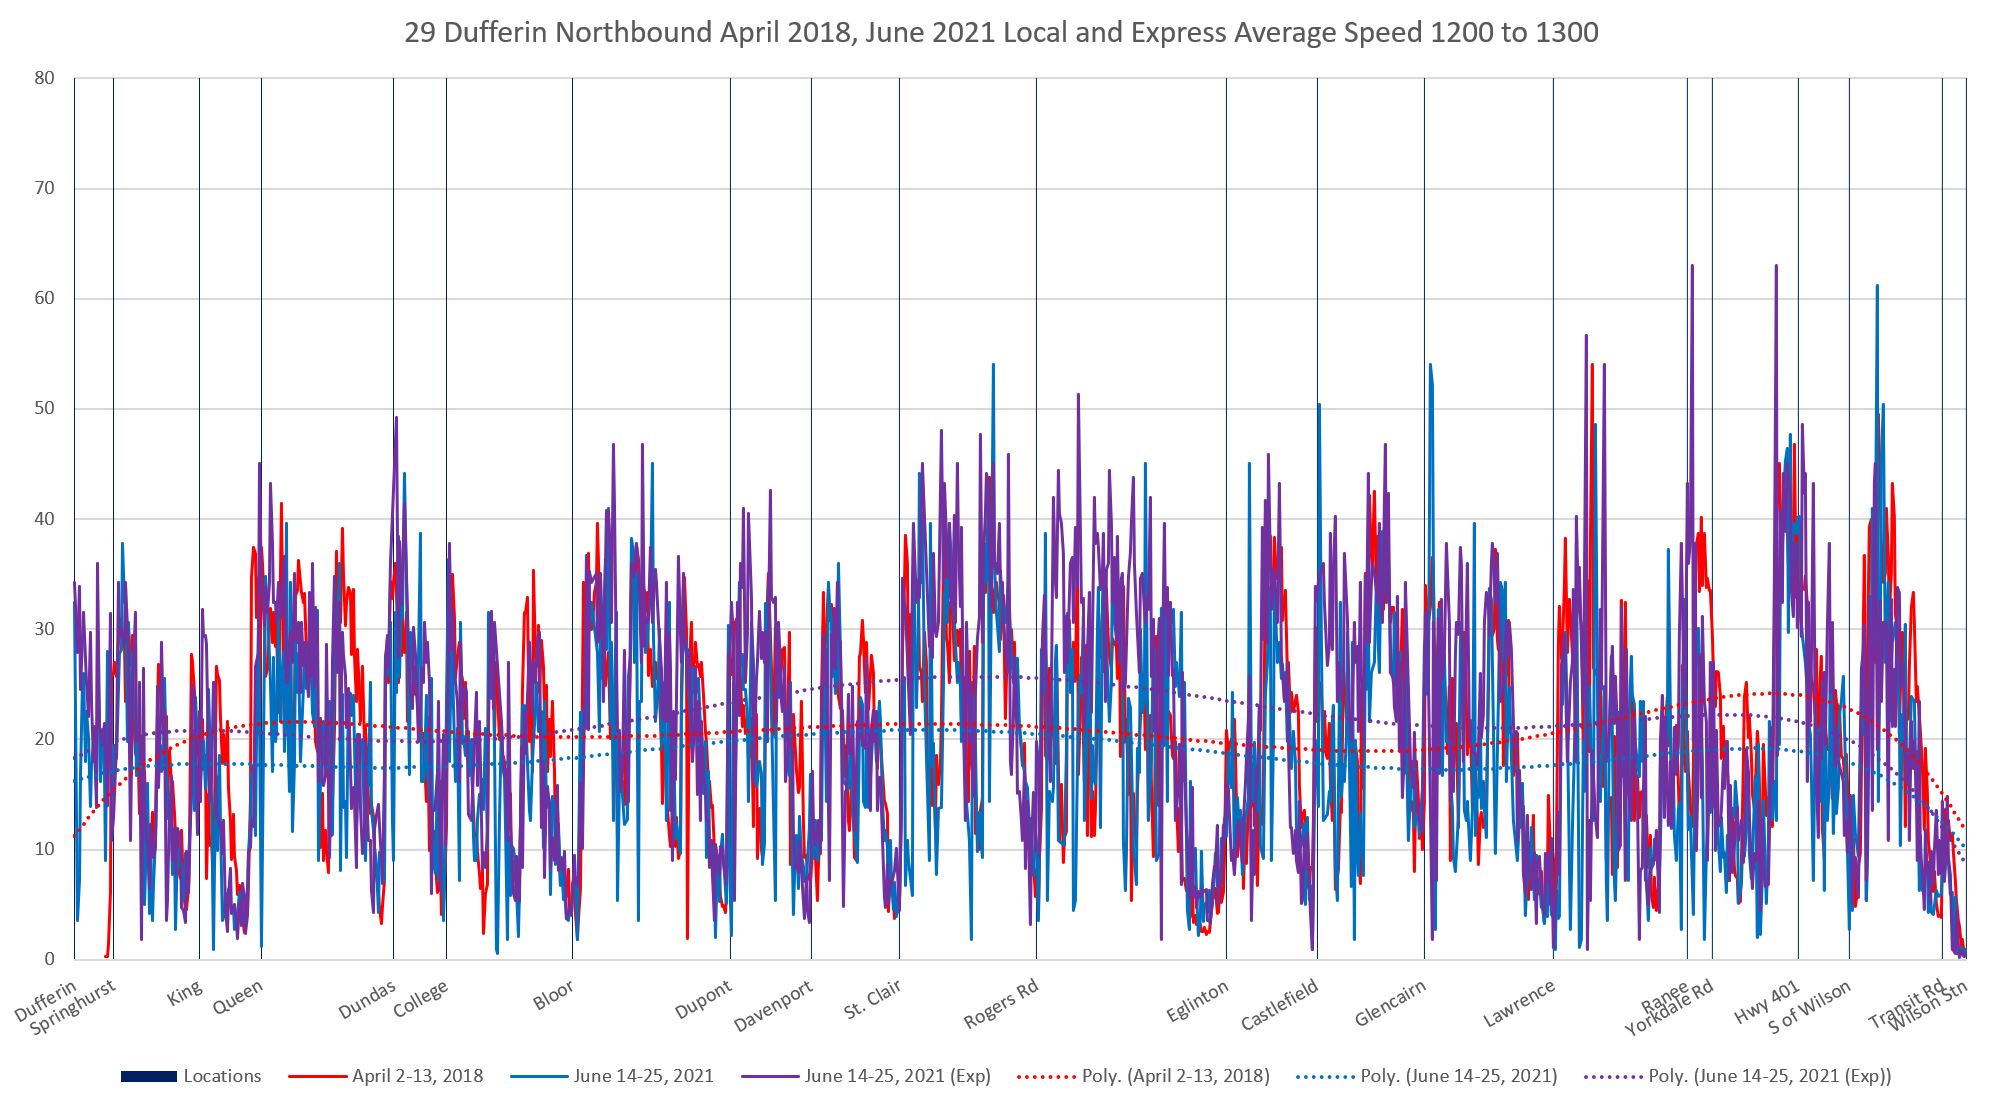
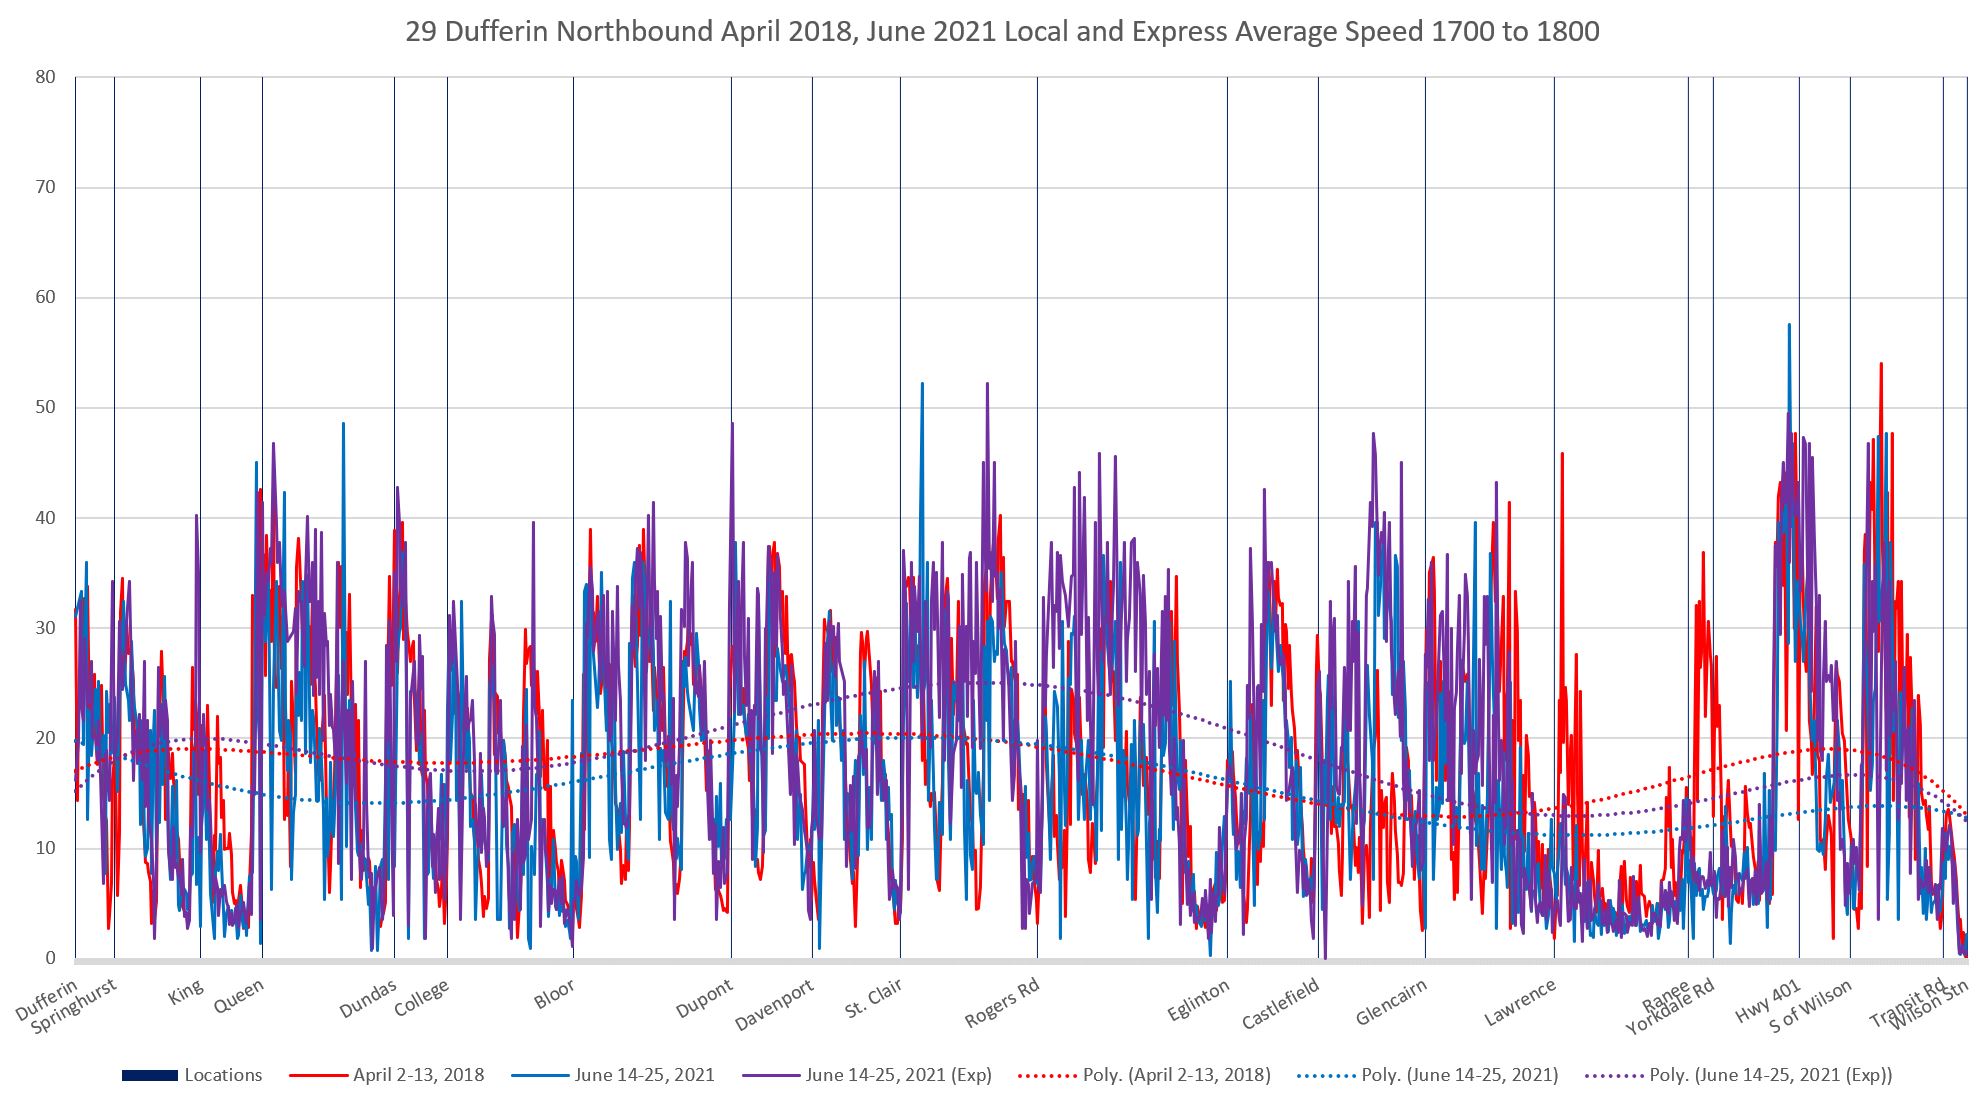
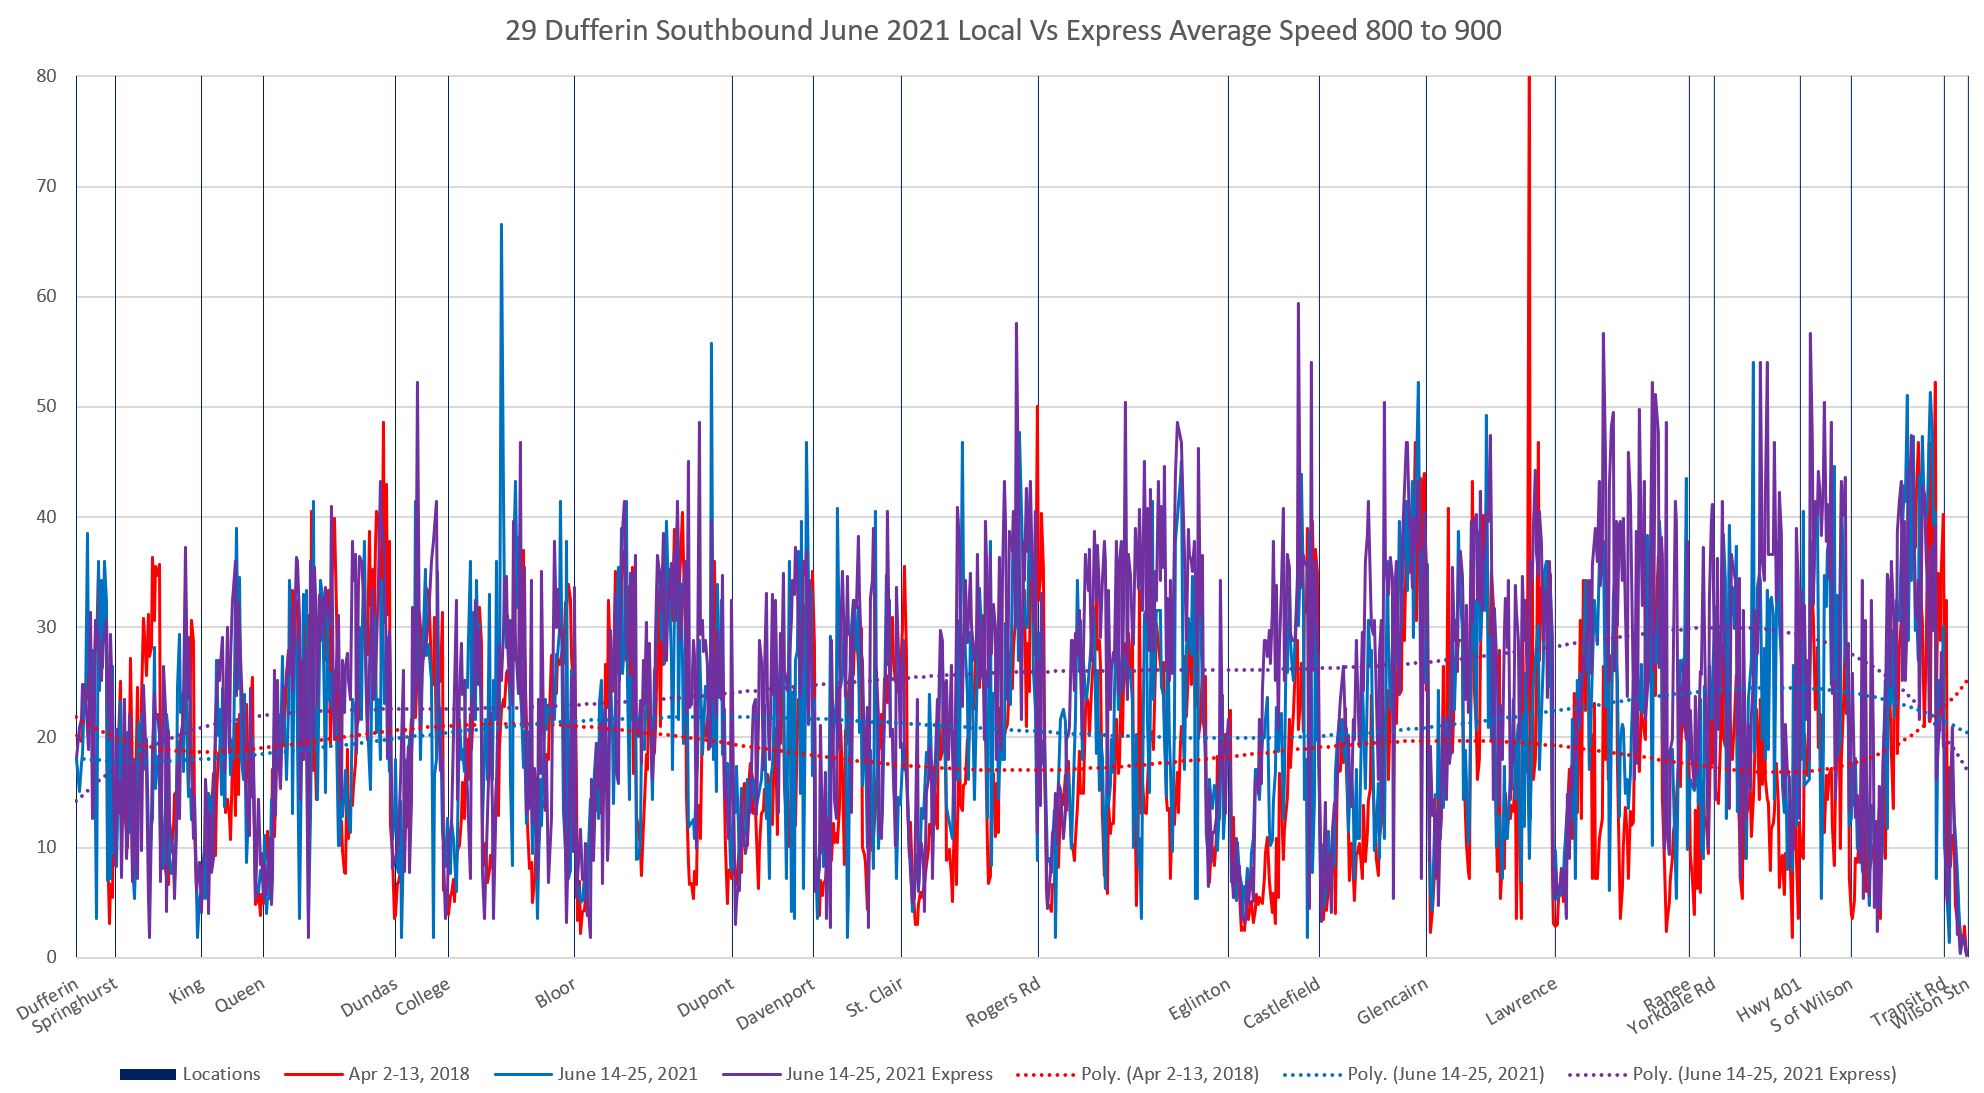
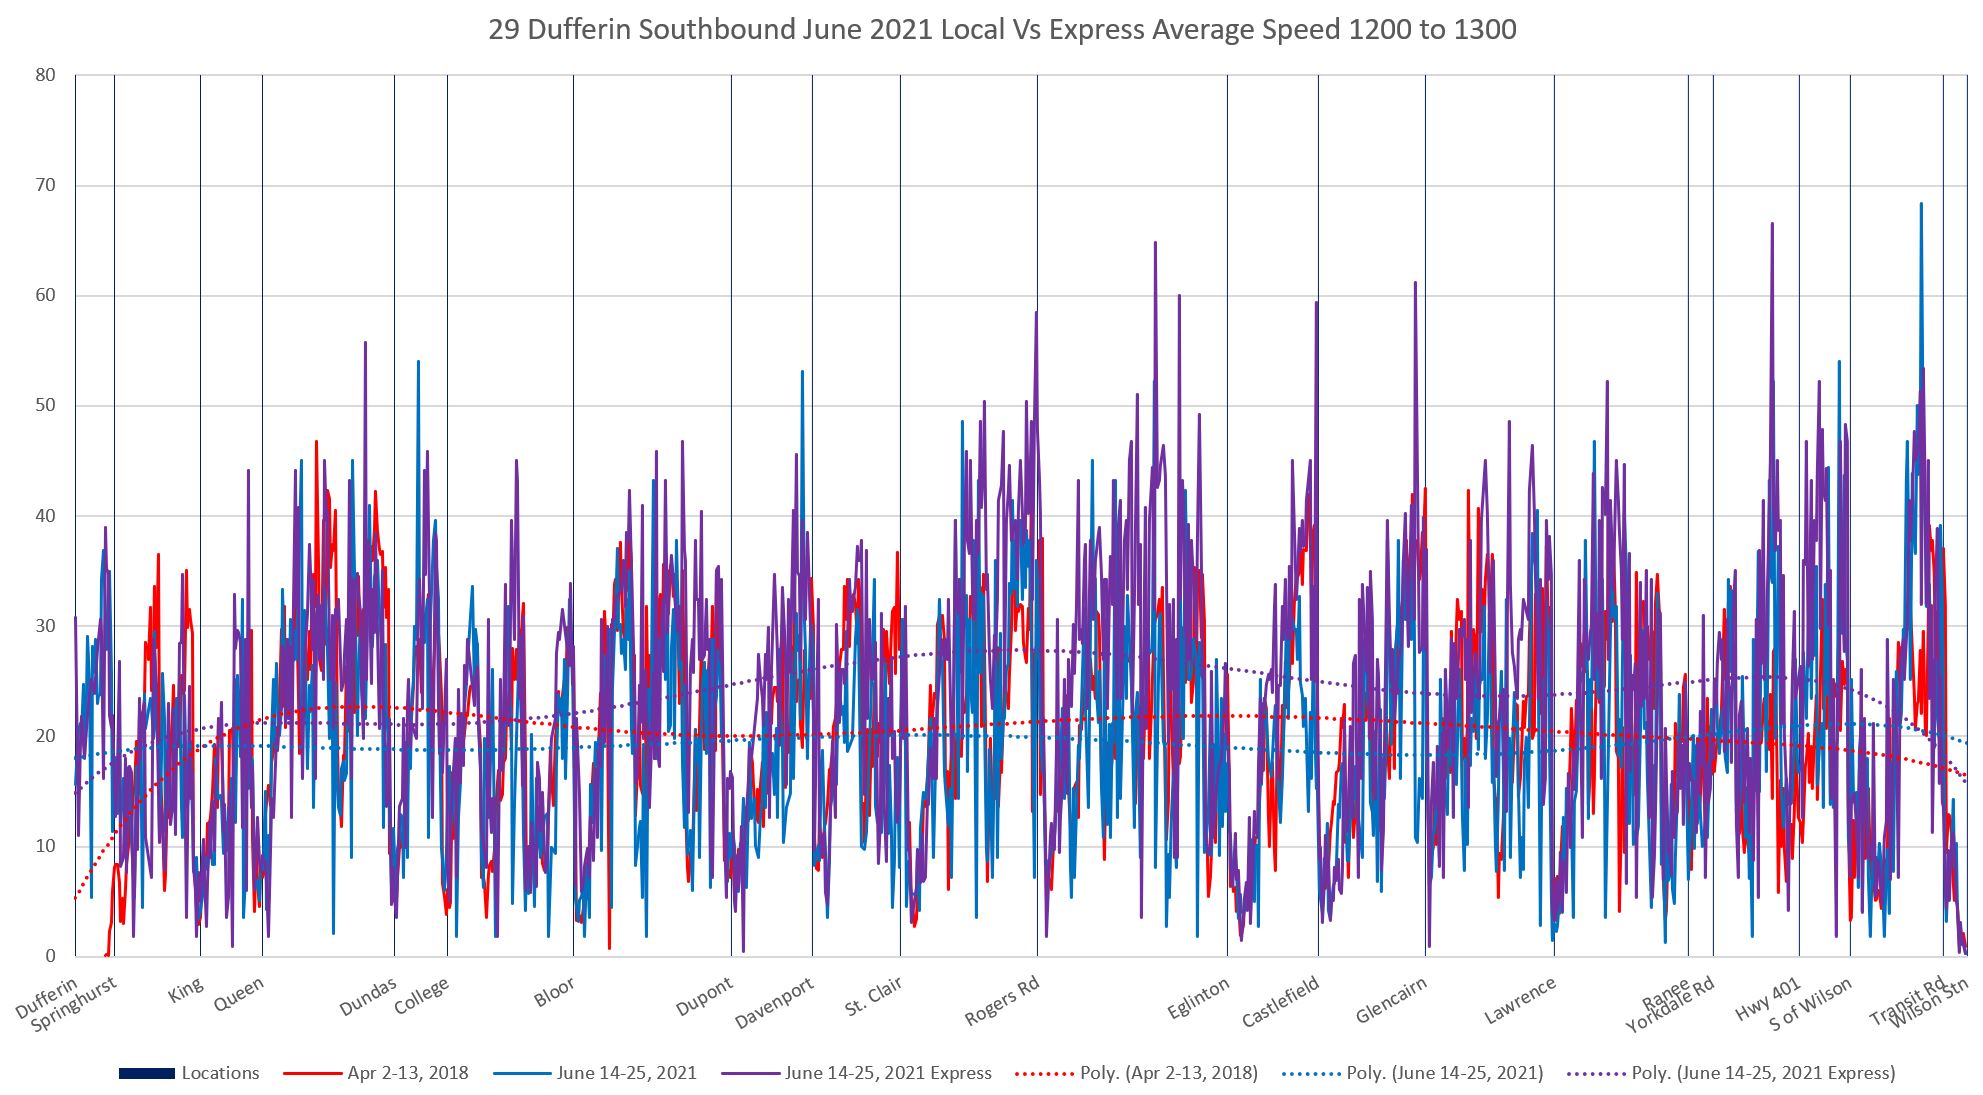
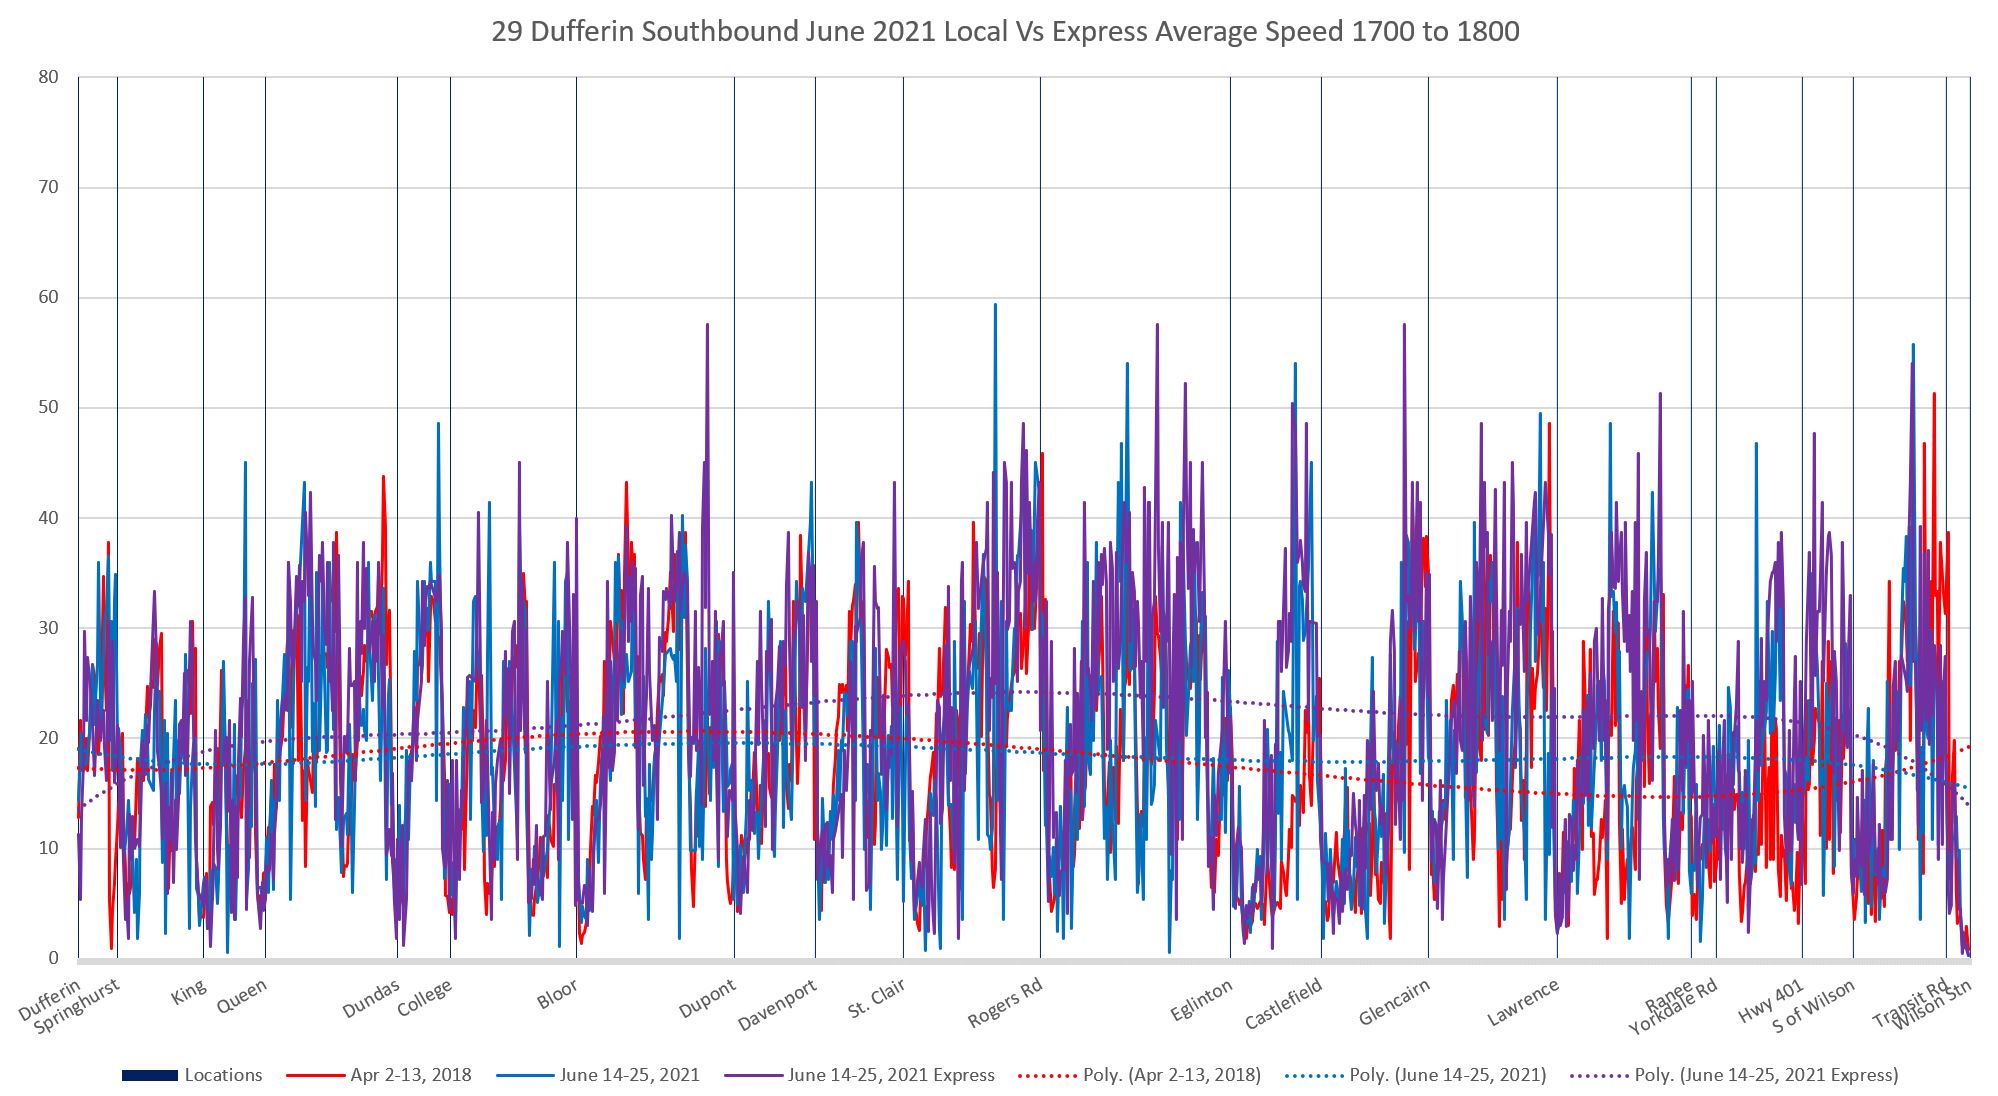
Comparing Prepandemic, Local and Express Speed Profiles
Three sets of speed profiles are included in the charts below:
- Pre-pandemic speeds averaged for the two weeks of April 2-13, 2018 (orange)
- Average speeds for June 14-25, 2021 for local buses (turquoise)
- Average speeds for June 14-25, 2021 for express buses (purple)
The trend lines (dotted) show the overall lie of the values for each period but they are not moving averages.
Three time periods are shown:
- AM Peak (to the extent that there is one) from 8:00 to 9:00 am
- Midday from 12:00 nn to 1:00 pm
- PM Peak from 5:00 pm to 6:00 pm
Complete chart sets showing all 18 hourly periods from 6 am to midnight are linked at the end of the article for those who are interested.
The trendlines for the express buses are generally at the highest values on all charts, but the spread between local and express is greater toward the northern end of the route. An issue for express buses is the degree to which they can physically overtake and pass the local buses depending on traffic conditions and parking.
April 2018 speeds are in some cases faster than the 2021 local speeds (note that there was no “29E” Dufferin service in 2018 and all data from that period represents local trips).
Areas of congestion on the approach to intersections are evident where the average speed are low not just at the intersection (a quick dip in values down to zero and back up again), but where average speeds are low for some distance in advance. This can be seen on the northbound approach to Eglinton particularly in the midday and PM peak charts, but there is an even more extended slowdown northbound from north of Lawrence to Yorkdale. A reserved lane here would have a big effect on transit, but likely would also have a severe effect on other road traffic that is responsible for the congestion today.
Northbound Charts (read left to right)
Southbound Charts (read right to left)
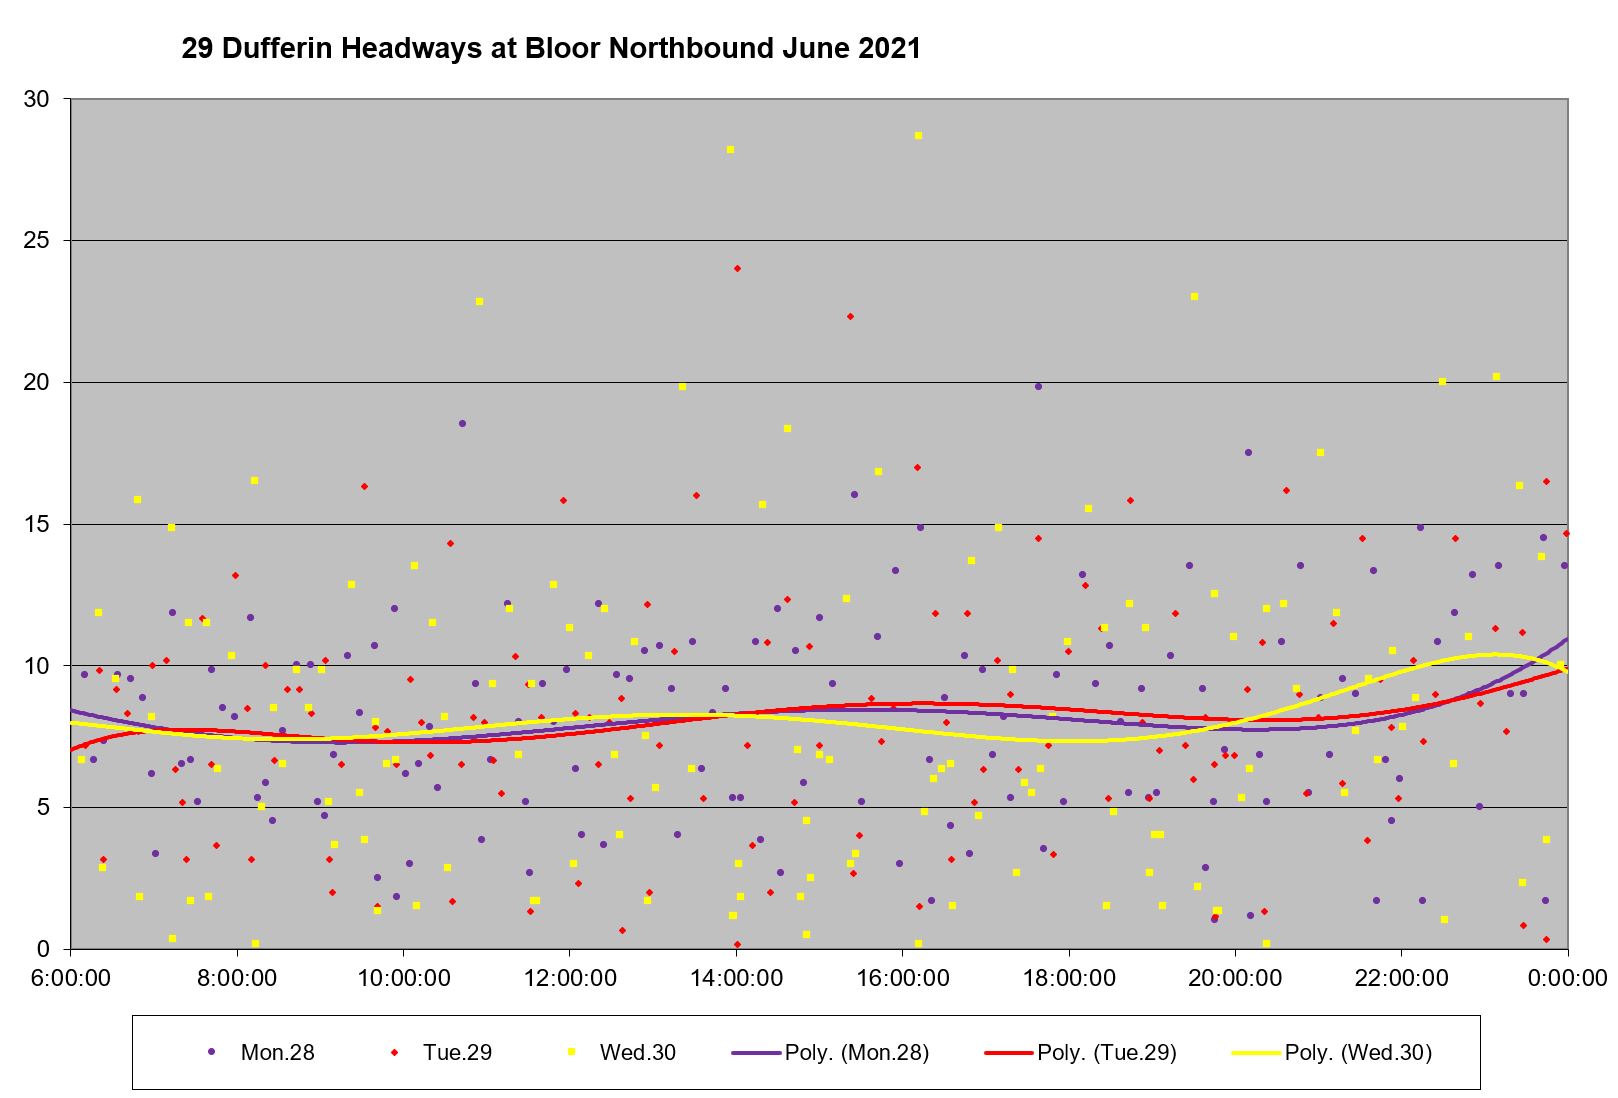
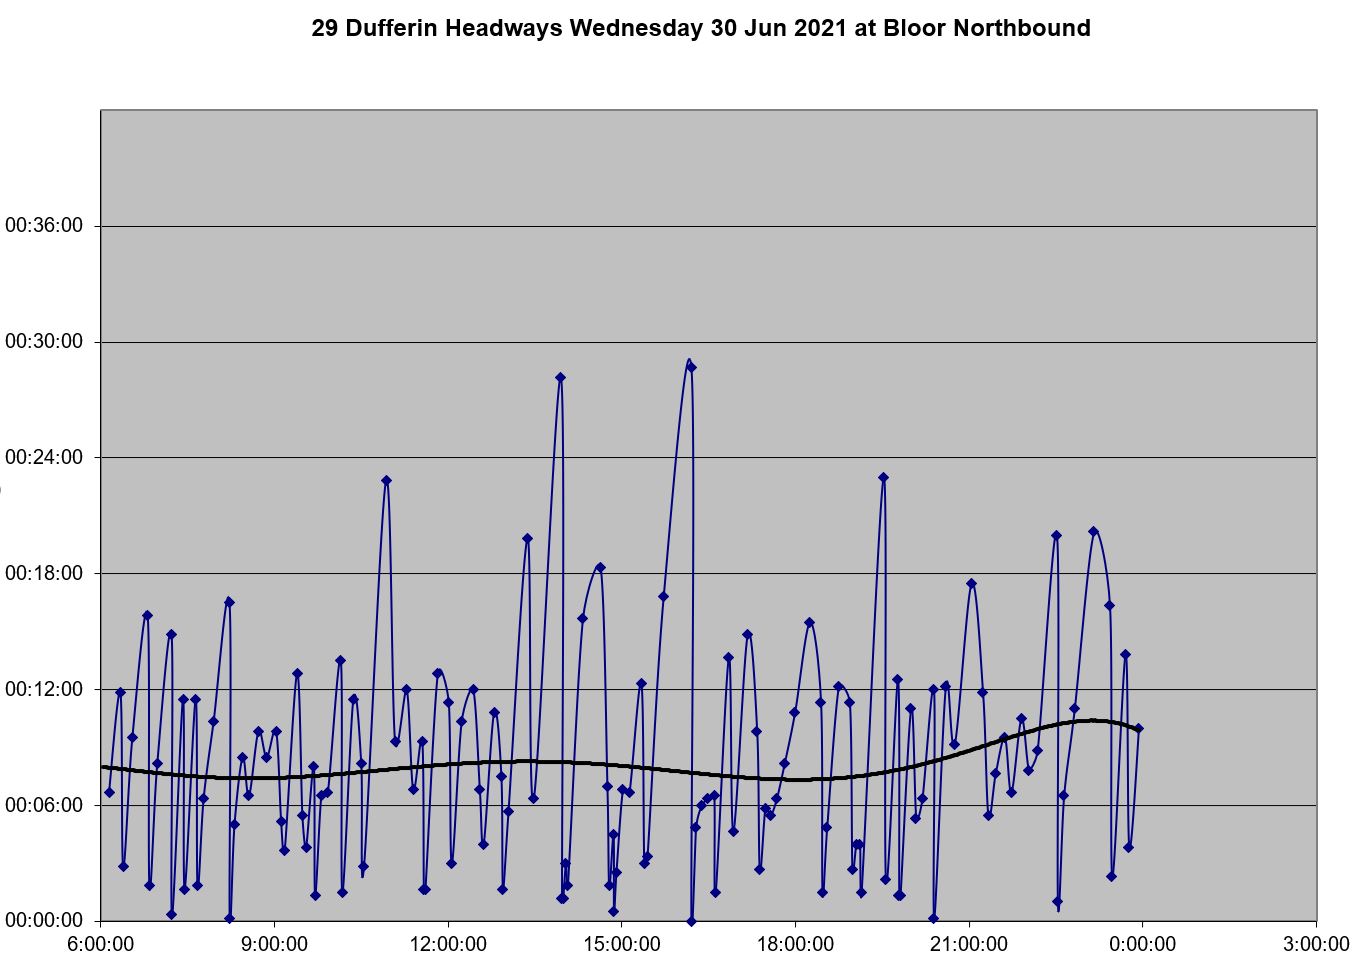
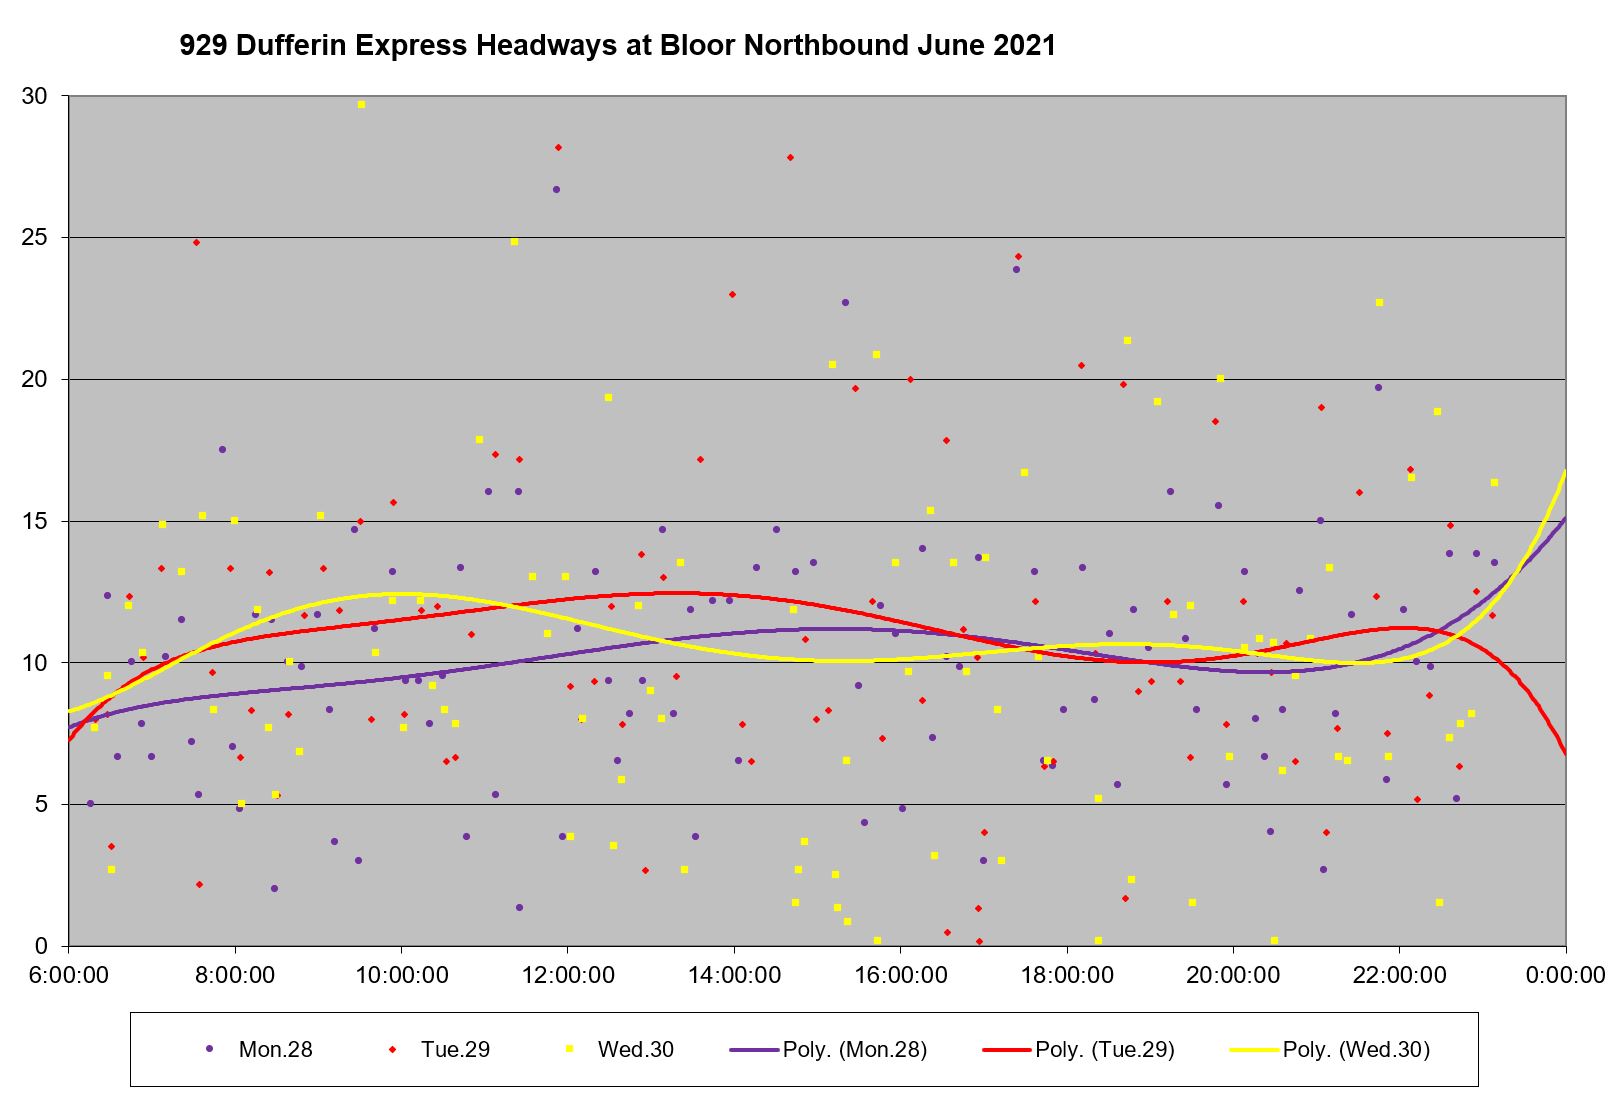
Headway Reliability
The scheduled service for 29/929 Dufferin effective Sunday, May 9, 2021 is shown below.


To get clear of some of the delays of late June, this section first reviews the service in Mid May, then in the 4th and 5th weeks of June when things really came unglued.
May 2021
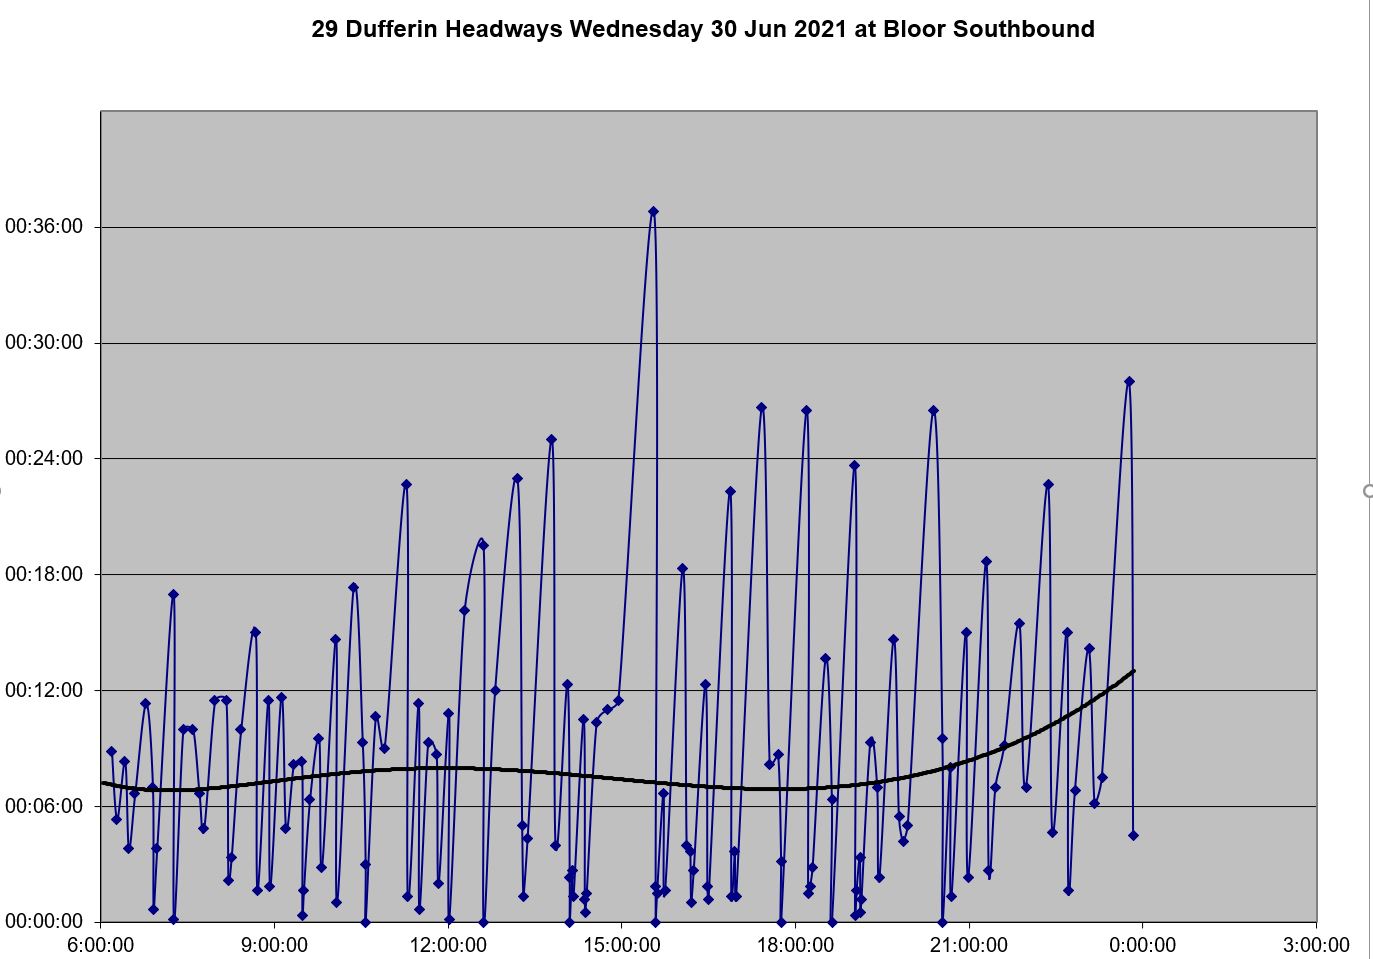
The behaviour of headways on the 29 Dufferin local service show consistent stats through May. The charts below show the averages and standard deviations of headways, week by week, northbound at Bloor and southbound from Transit Road. Except for a disruption in week 2 caused by missing data, the values are steady all day. (One hour of missing data on May 13 produced a “gap” in the service that I did not “cleanse” from the data.)
However, the standard deviation values at Bloor northbound sit consistently at about 4 minutes indicating that by the time service reaches this point some bunching on the 7’30” headway has already happened.
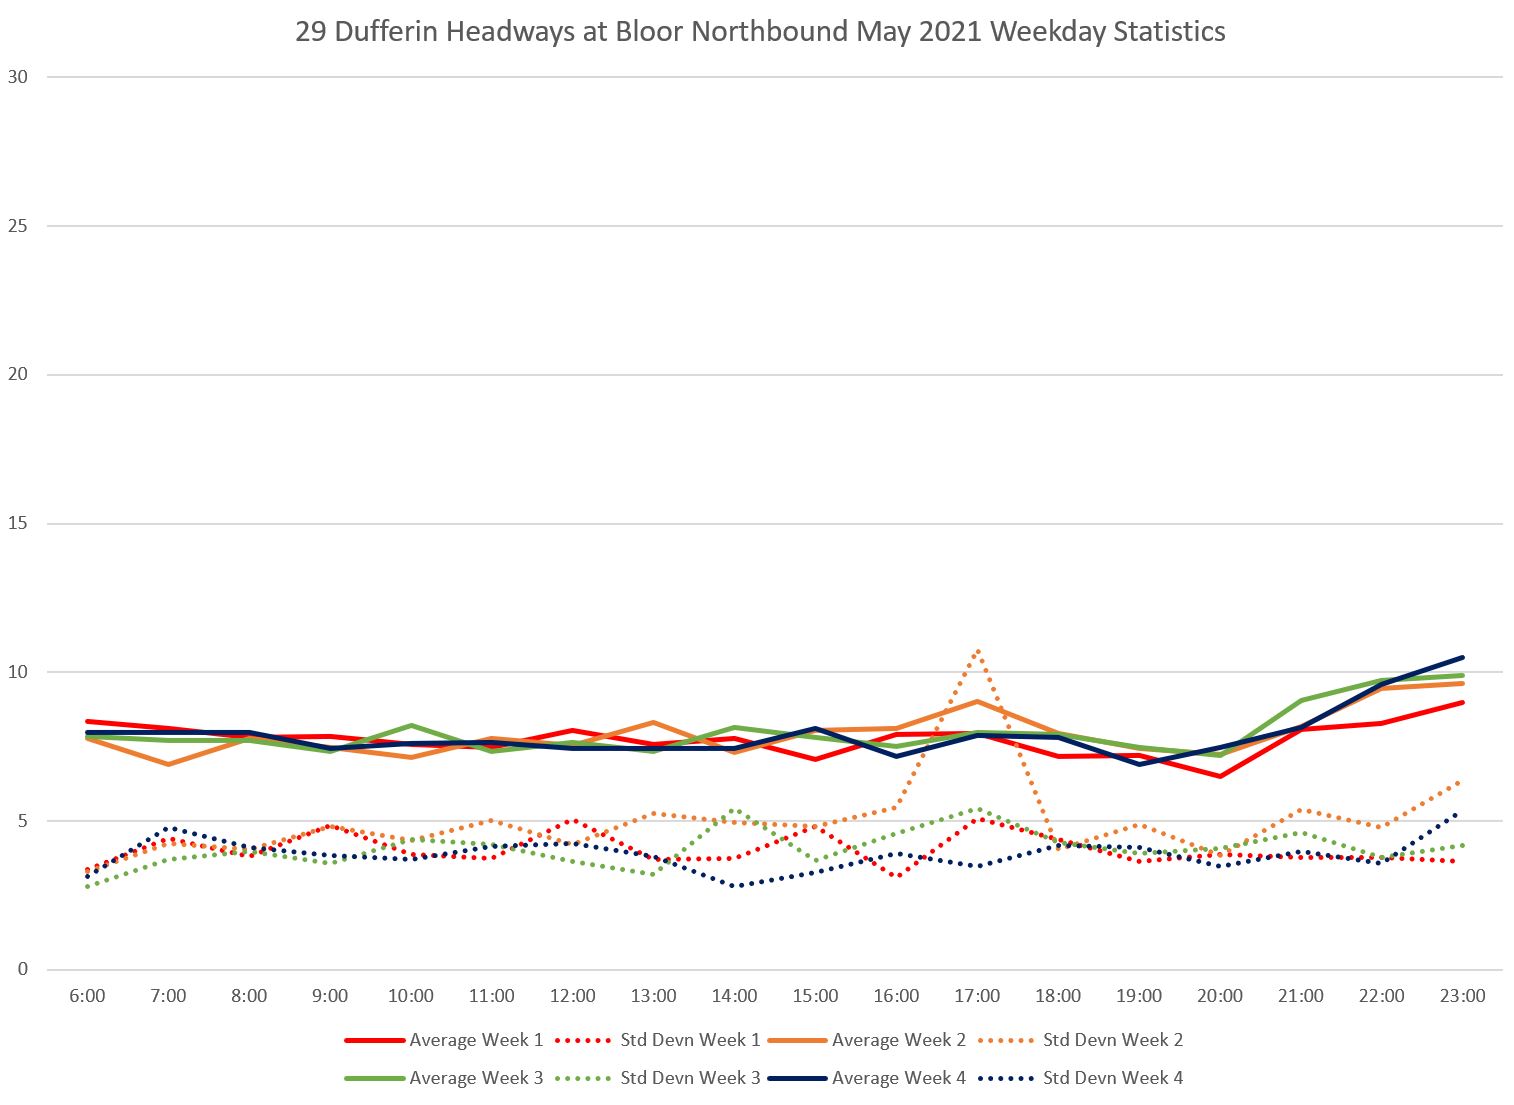
Southbound from Transit Road shows a similar pattern, but with an SD hovering around 3 minutes. Service is a bit better organized, but still at the limit of the TTC’s six-minute target for headway variations.
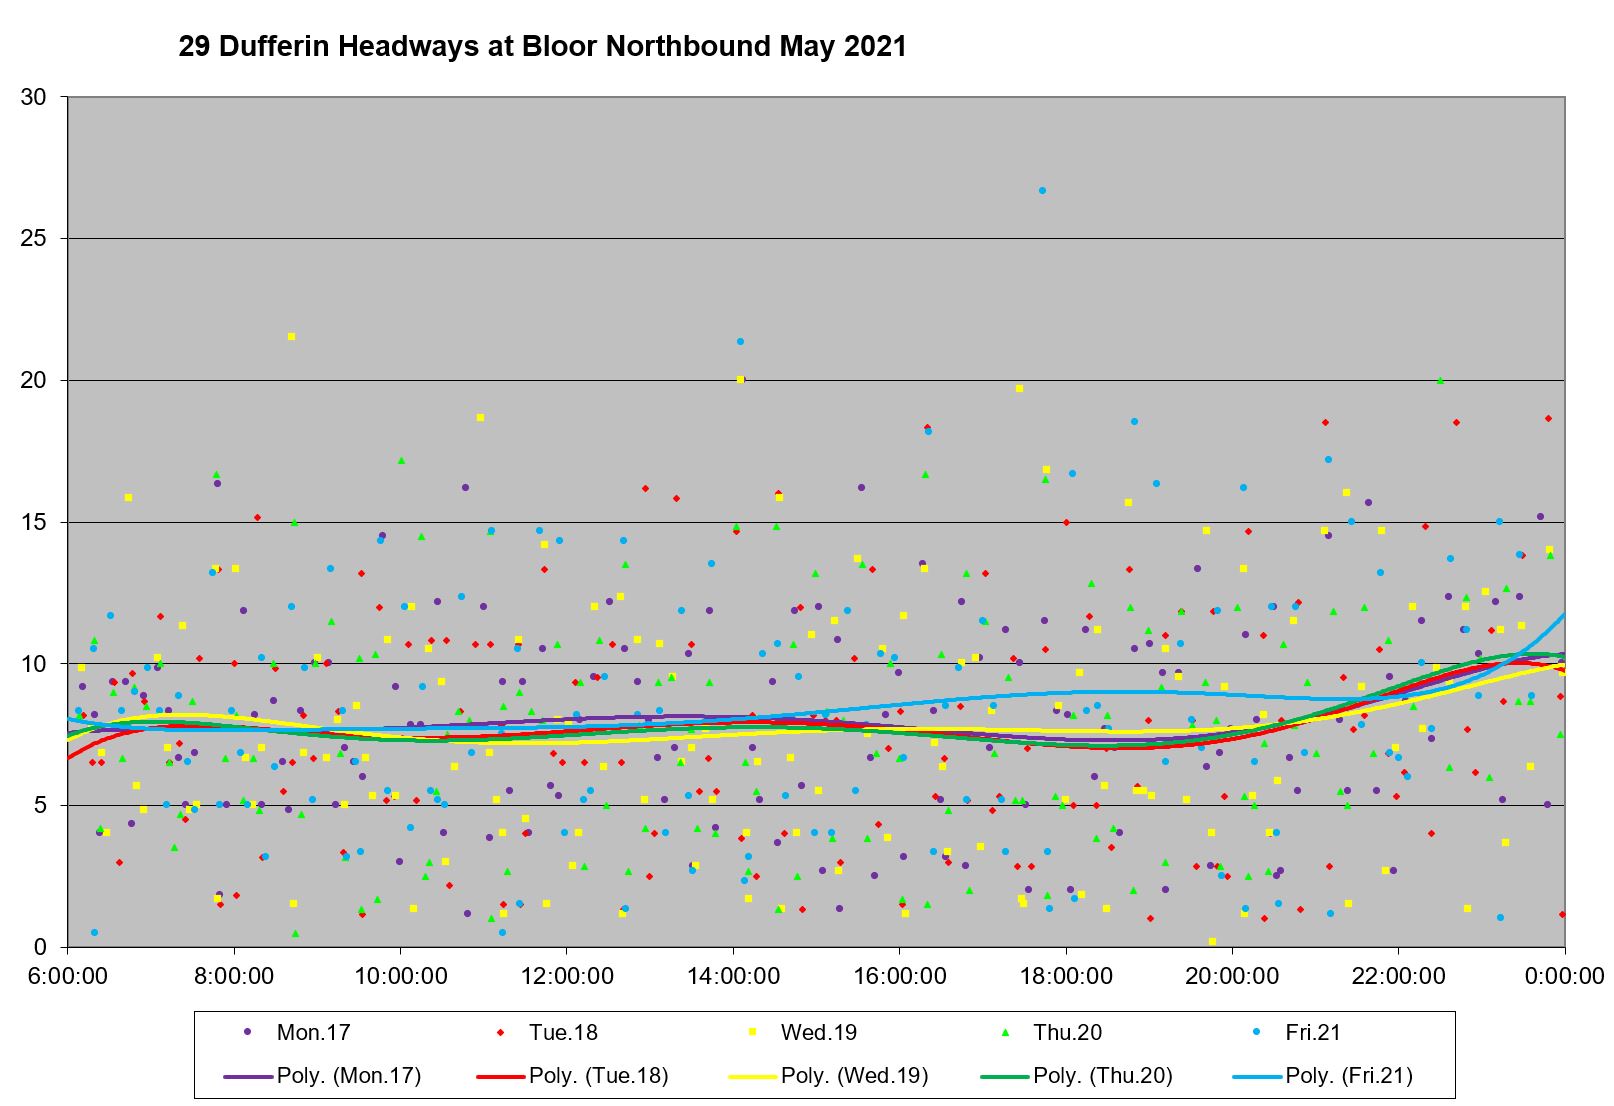
May 2021, Week 3
Drilling down to week 3 of the month, we can see that the headway values lie across a range from about 2 to almost 15 minutes. One pattern is evident here. Note that the values tend to lie in horizontal bands. This is due to “marshalling” of buses by the traffic signals so that headways will generally be a multiple of the signal cycle regardless of what the schedule says. This is less of a problem for a stop like Bloor northbound which is farside, and so buses can leave when they are ready, not when the traffic light allows. However, the regimentation before they cross the intersection suggests that there is little or no transit priority providing green time extension here.
Southbound at Transit Road, south of Wilson Station, the headway values are more closely grouped as one would expect from the lower SD values above, and from this being close to the terminal. All the same very short headways and gaps of over 10 minutes are fairly common.
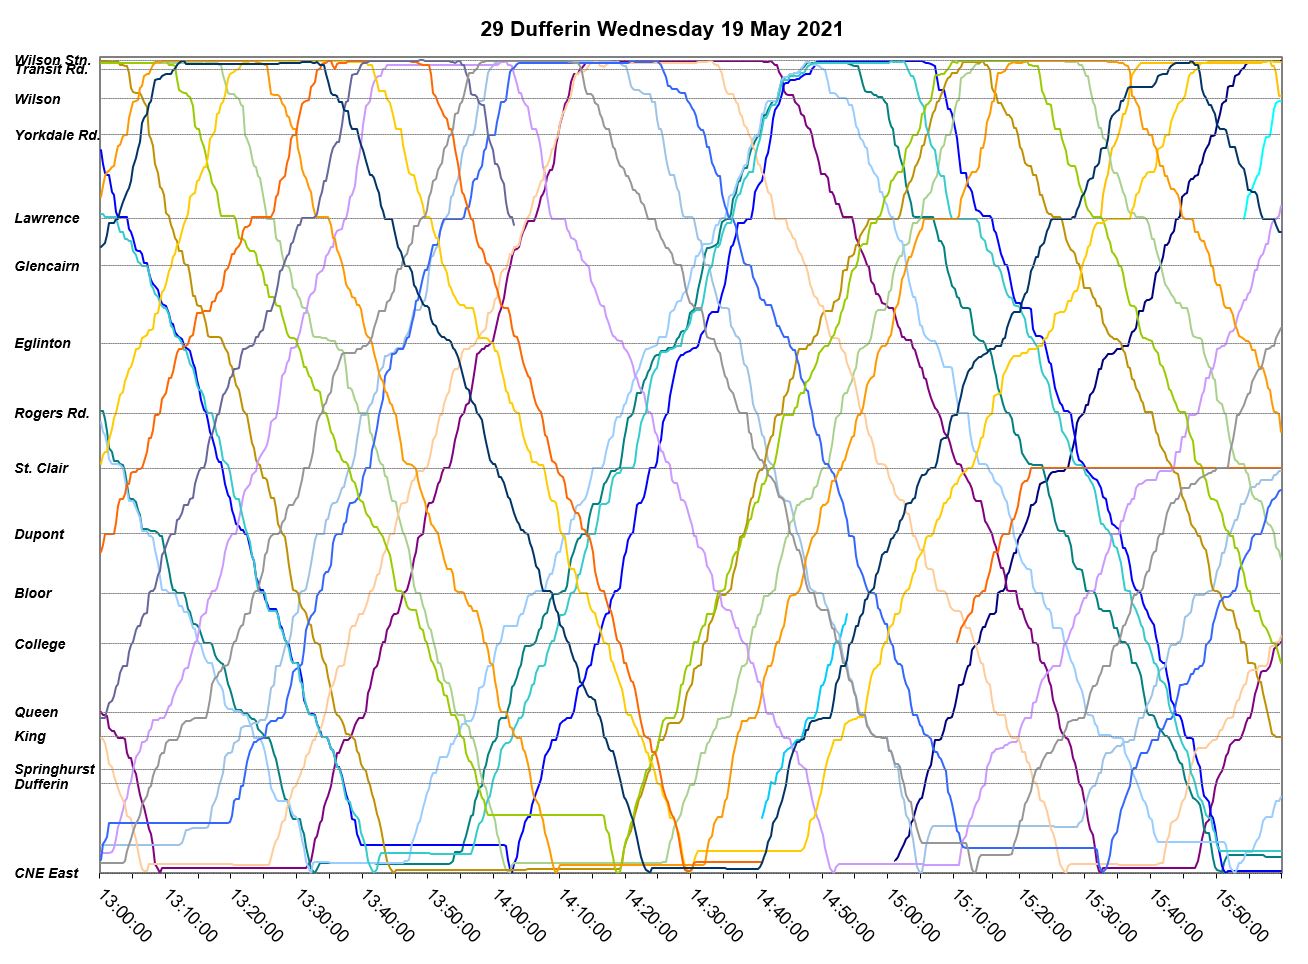
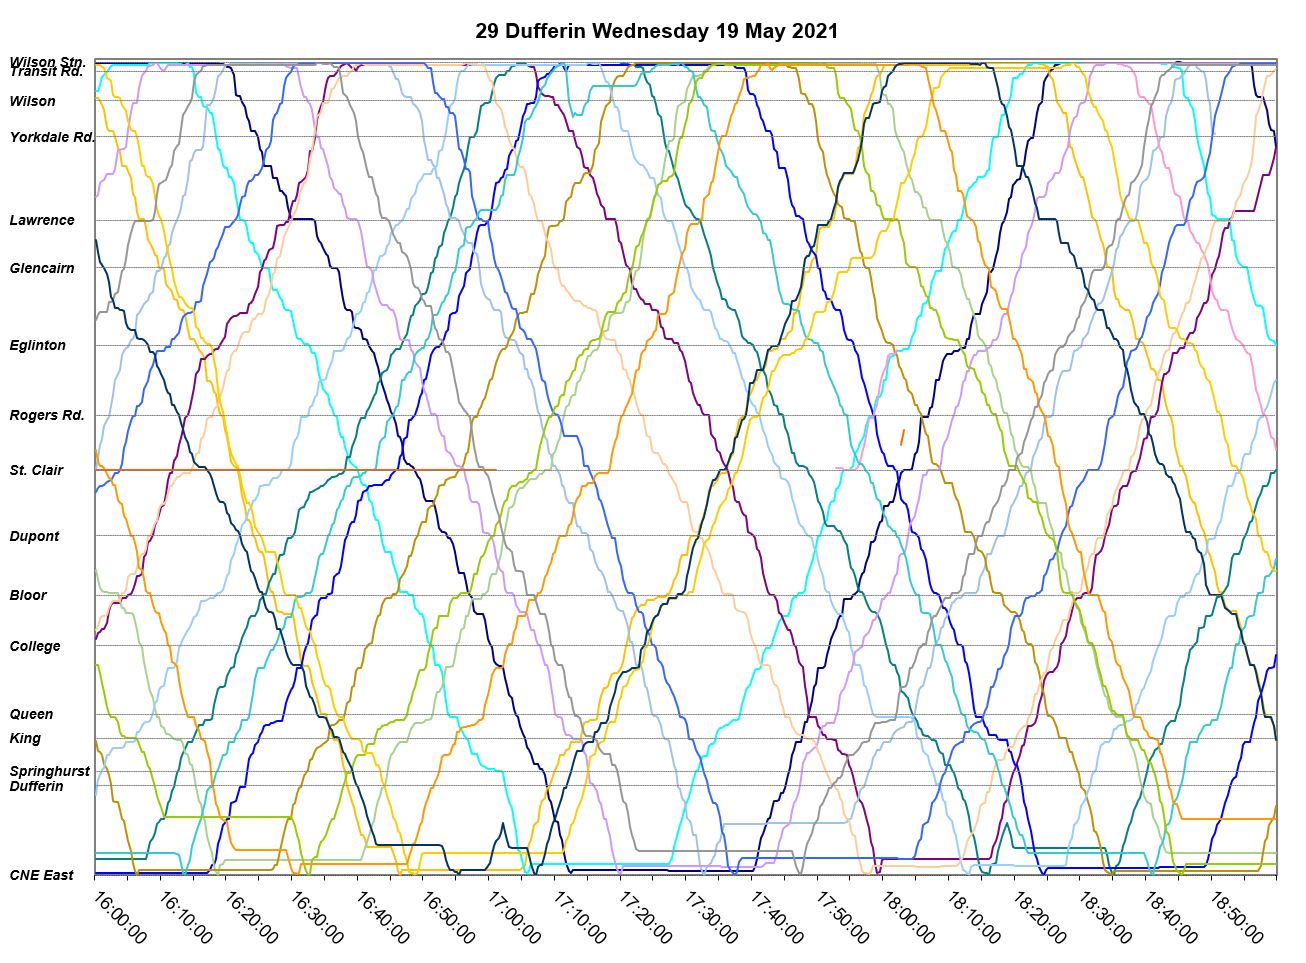
May 19, 2021
Here are charts showing the 29 Dufferin service as operated on the afternoon and early evening of May 19. This is a fairly common day. There are a few noteworthy points in these charts:
- Buses get long layovers at both terminals as shown by the horizontal lines between their arrival and departure. Irregular headways cannot be blamed on tight schedules.
- Between 1:40 and just after 2:00 pm, four buses leave the south end of the line after generous layovers and form a platoon headed north that gets tighter as it goes. By the time the parade reaches Wilson Station, the gap is half an hour wide. That gap is followed by another 20 minute gap and two buses running as a pair.
- Pairs and triplets of buses can be seen in the late afternoon chart also. None of these is the result of delay, but of operators taking excessive layovers and then leaving in packs, notably northbound just after 5 pm when three buses are responsible for a 20 minute gap at Bloor.
- There is very little delay at Eglinton headed either way. Line 5 construction is not affecting the service
These charts show only the local buses, not the 929 Express, but that is little comfort for riders waiting at or bound for local stops.
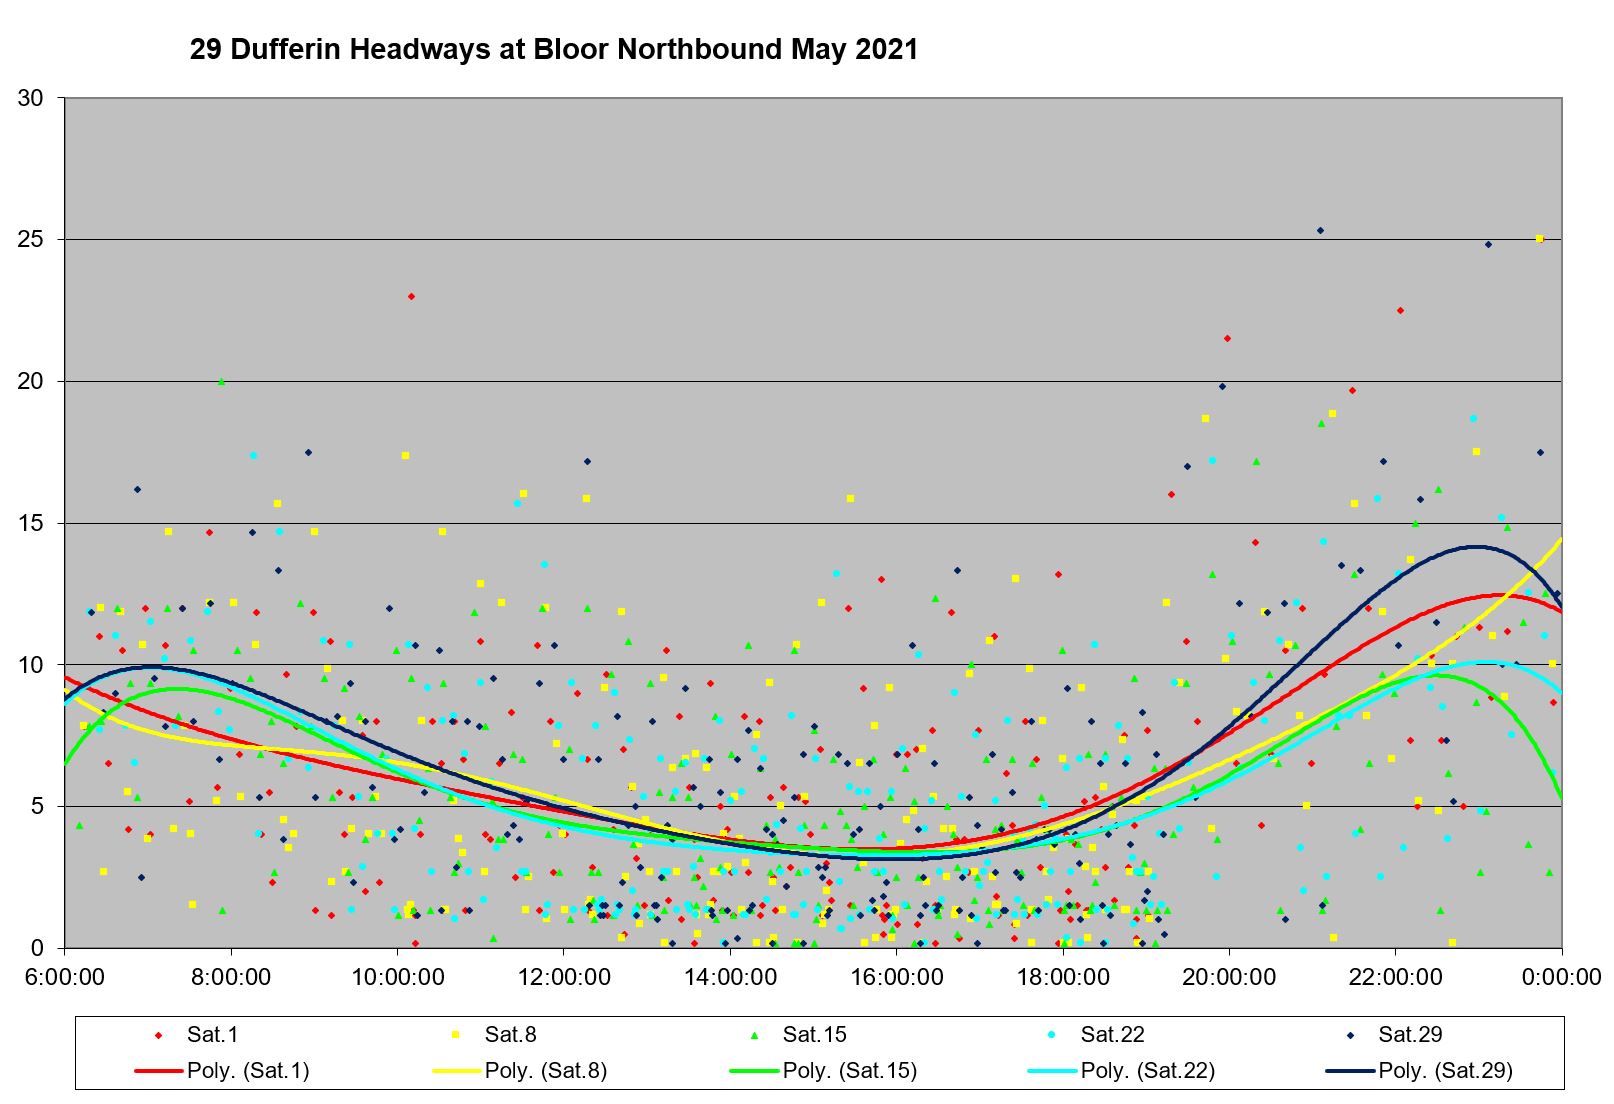
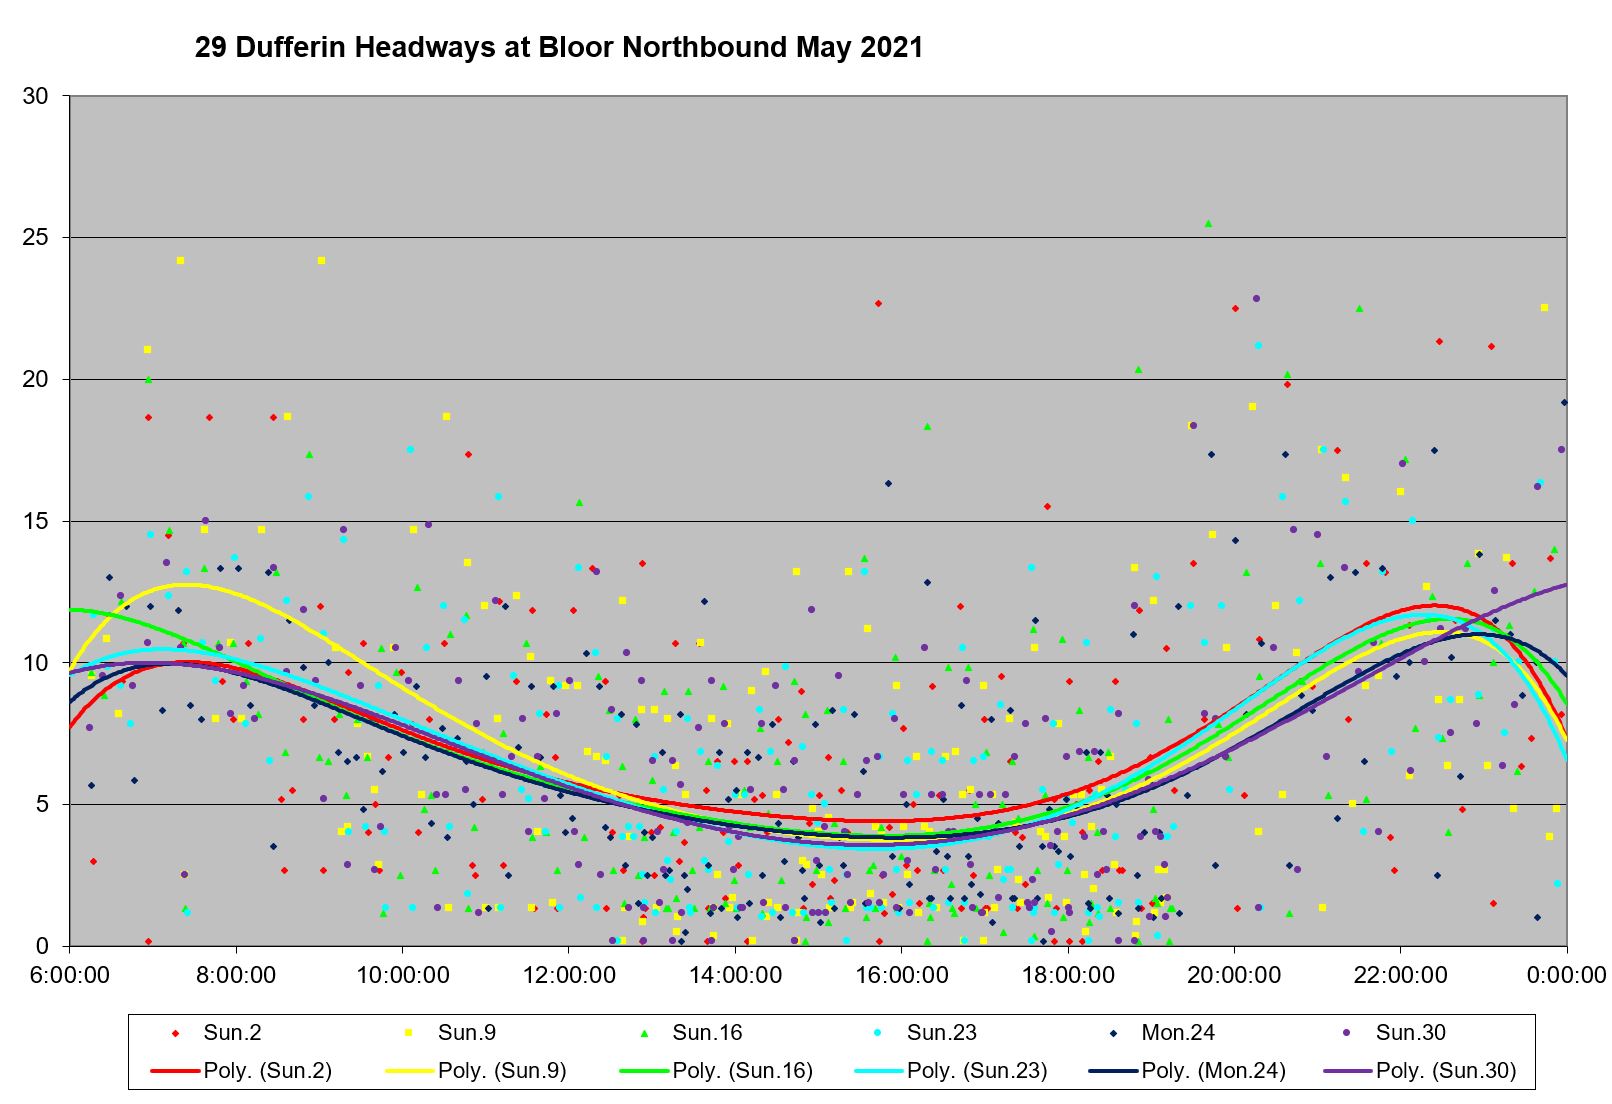
Weekends
Weekend service also sees irregularity on the line. Here are the charts for service northbound at Bloor on Saturdays and Sundays. The headways are shorter because all buses are running local, and values at or close to zero are quite common showing that much of the service is bunched, and wide gaps are common.
Southbound at Transit Road, things are slightly better, but only by comparison to the situation at Bloor. This is weekend service right at a terminal, and yet irregular headways are common. Some buses leave the terminal nose-to-tail. They might be “on time” according to TTC standards (within the six minute allowed deviation from schedule), but they are providing lousy service to riders.
June 2021
The weekly stats for June 2021 are similar to those in May except for late in the month, especially in week 5 which is a short week and where a disruption on one day can have a greater effect on overall averages. The standard deviation in headways is less consistent in week 5 and the averages are higher indicating that in some cases, notably at Transit Road, less service than usual is operated.
June 2021, Week 4
Week 4 of June is relatively well-behaved, as service on Dufferin goes. As in May, headways at Bloor northbound are spread over a wider range than at Transit Road southbound, close to Wilson Station.
June 23, 2021
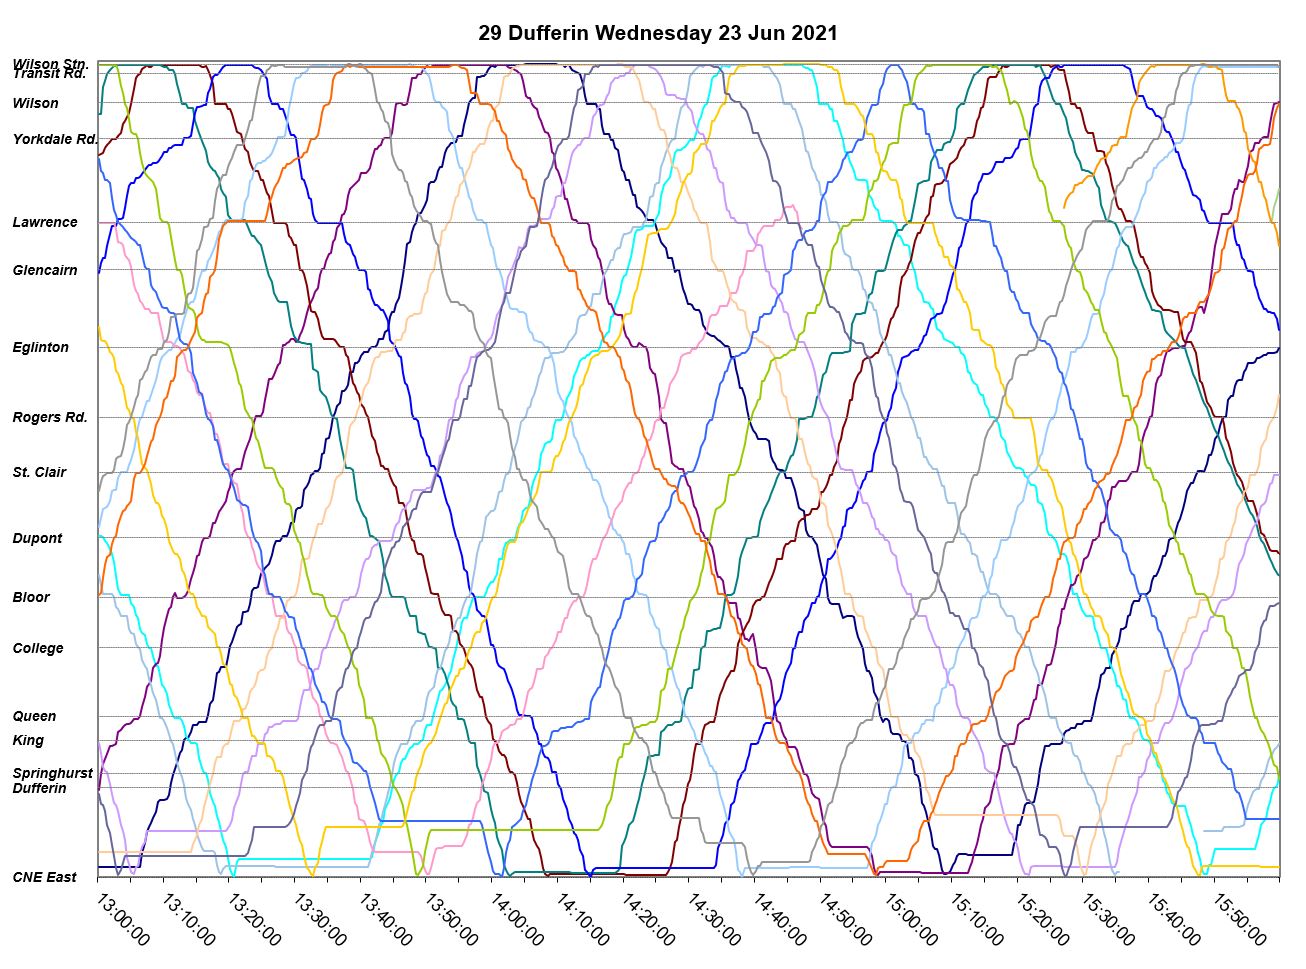
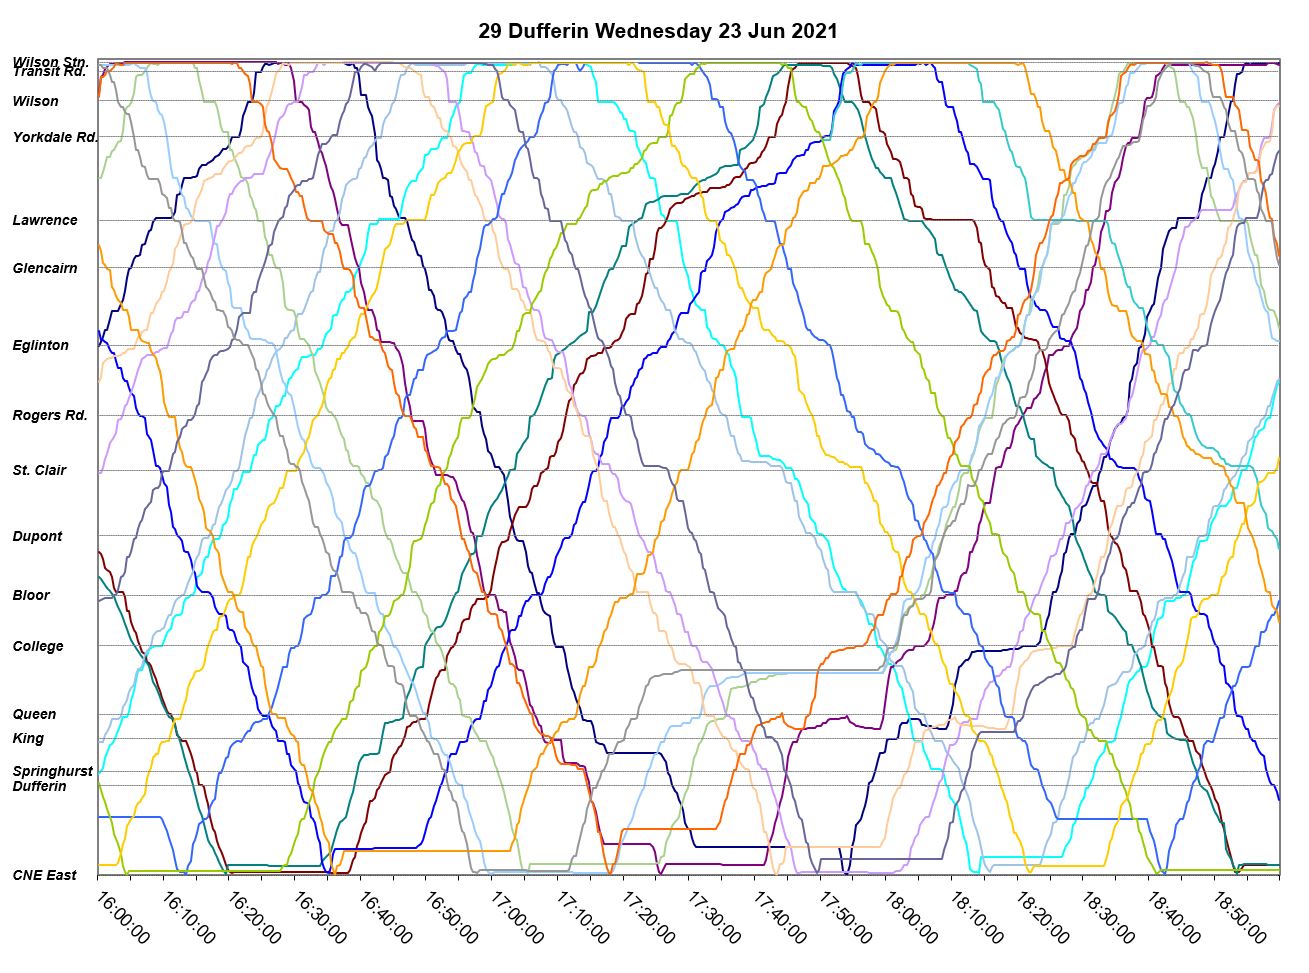
The following two charts show the service as operated on June 23, 2021 in the afternoon and early evening. Items of note include:
- As on May 19 above, buses get a considerable layover at both terminals most of the time.
- During the early afternoon, there are few pairs although one group of buses does run north as a trio at around 1:40 pm.
- In the late afternoon congestion is evident northbound between Lawrence and Yorkdale, and to a lesser extent southbound at St. Clair.
- Some congestion is visible around Eglinton but it is not a major source of delay.
- A collision south of College blocked service northbound for an extended period starting at about 5:20 pm. Although some buses detoured via Lansdowne, there was a 40 minute gap northbound at Bloor. In spite of this, no buses were short turned to fill the gap, and there was sufficient recovery time for the service to be back to normal after the parade of buses returned south from Wilson (see full chart set for the evening service). This is not the hallmark of a route with inadequate running time.
June 2021, Week 5
Headways in Week 5 were much worse, especially on June 30, than in a “normal” week, with some gaps at 15 minutes or more, or double the scheduled headway. There was also a lot of bunching.
Southbound from Transit Road the trend line for the headways rises above 10 minutes reflecting short-turning of vehicles before they reach the terminus.
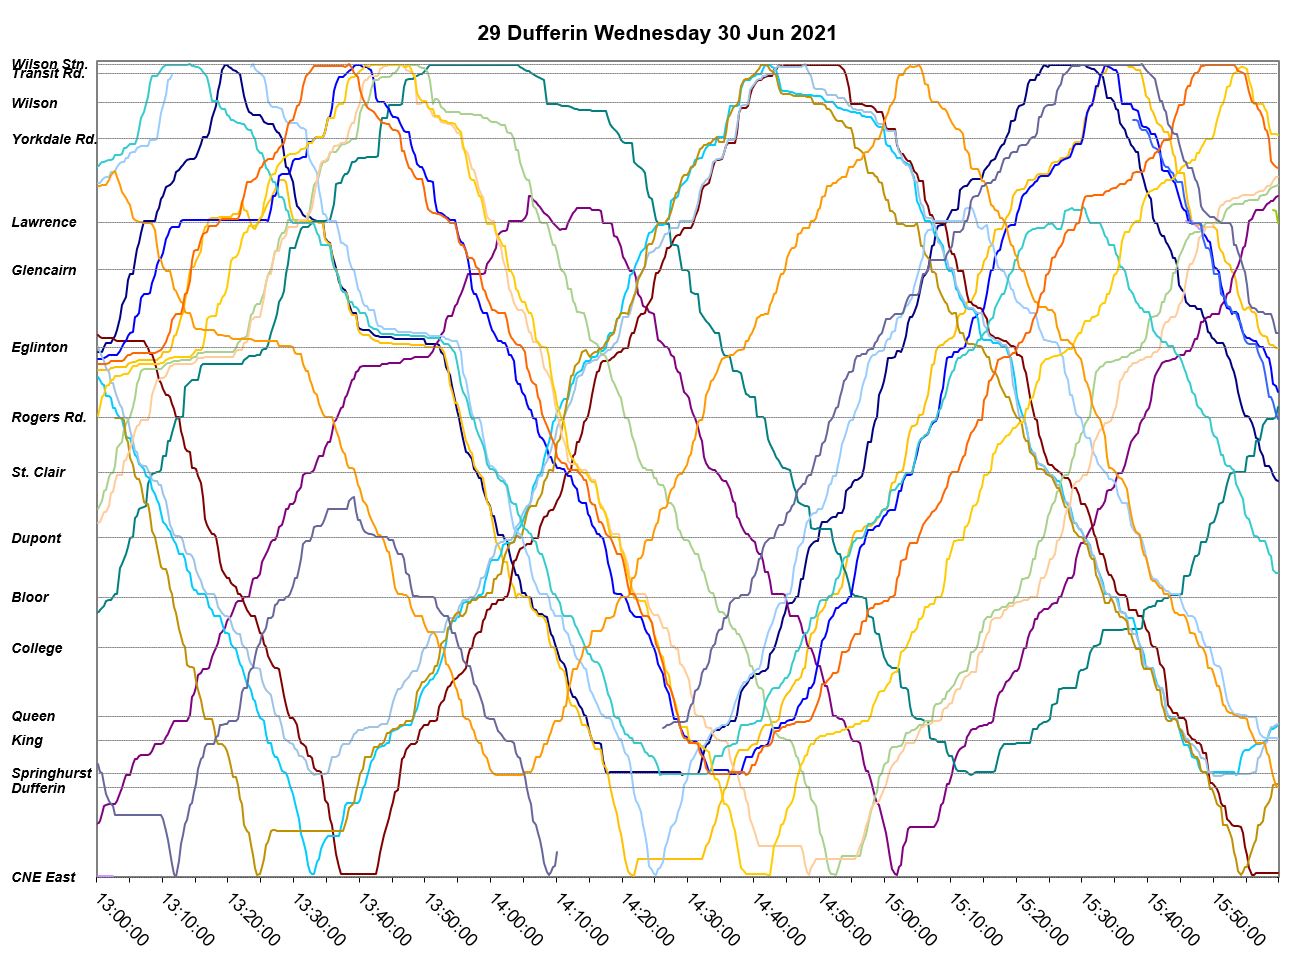
June 30, 2021
June 30 was not a good day. By late morning, some buses were already running in pairs, congestion was building up in a few locations, notably at Eglinton, and there were wide gaps in service. At about noon, service was blocked by construction activity at Eglinton for an extended period of about 90 minutes.
After this cleared, the service had wide gaps and bunching, and there were several short turns to get buses back on time.
Even with that out of the way, congestion appeared in the late afternoon northbound at Yorkdale and, to a lesser extent, northbound at Bloor.
Service reliability took a big hit with buses running in groups of 3 or 4 separated by wide gaps. In some cases, these bunches were spaced out from terminals and in others they just ricocheted back along the line.
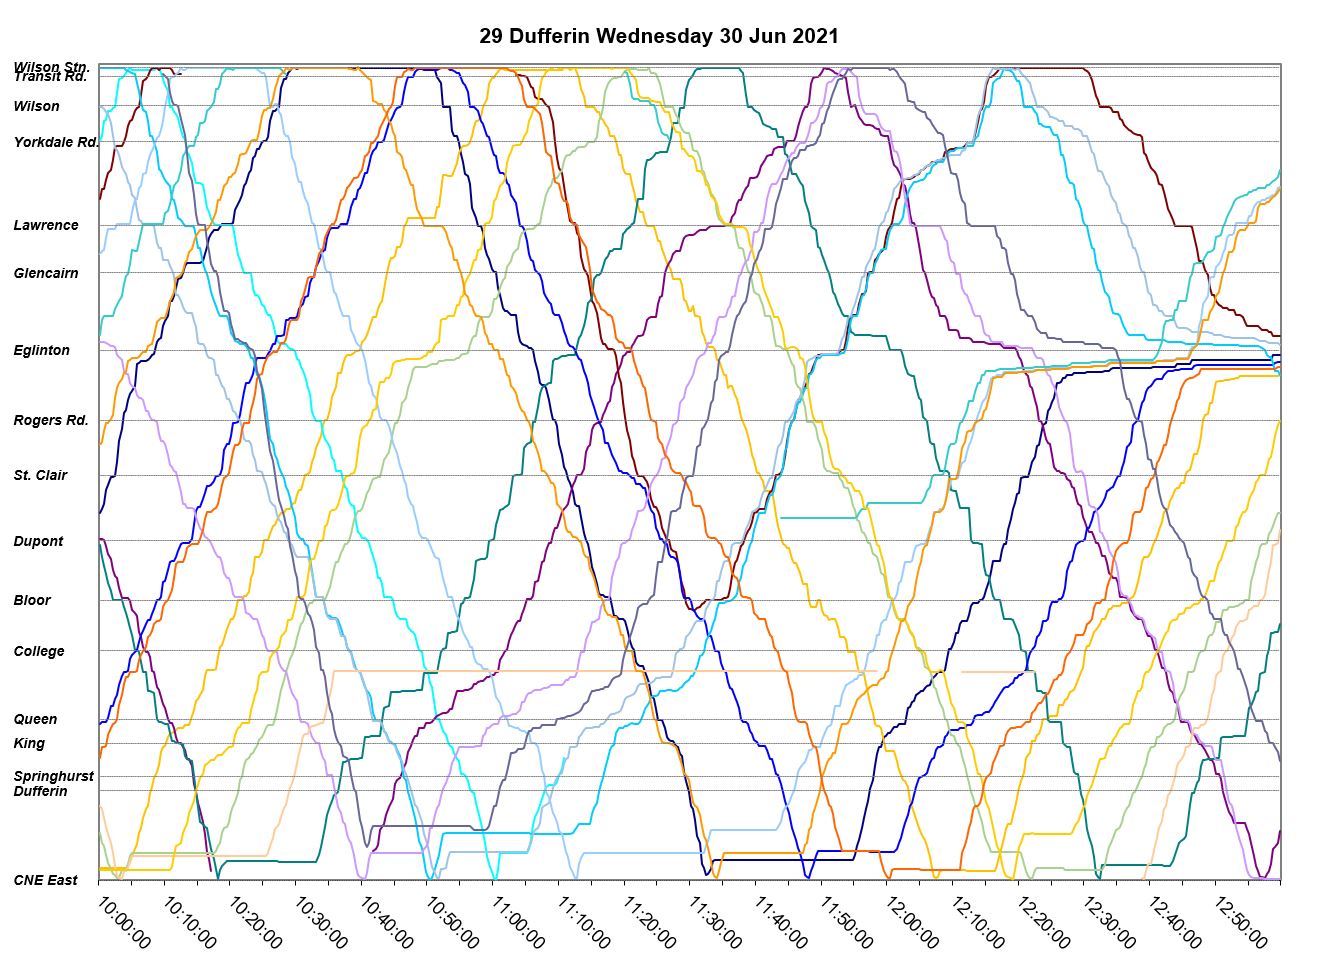
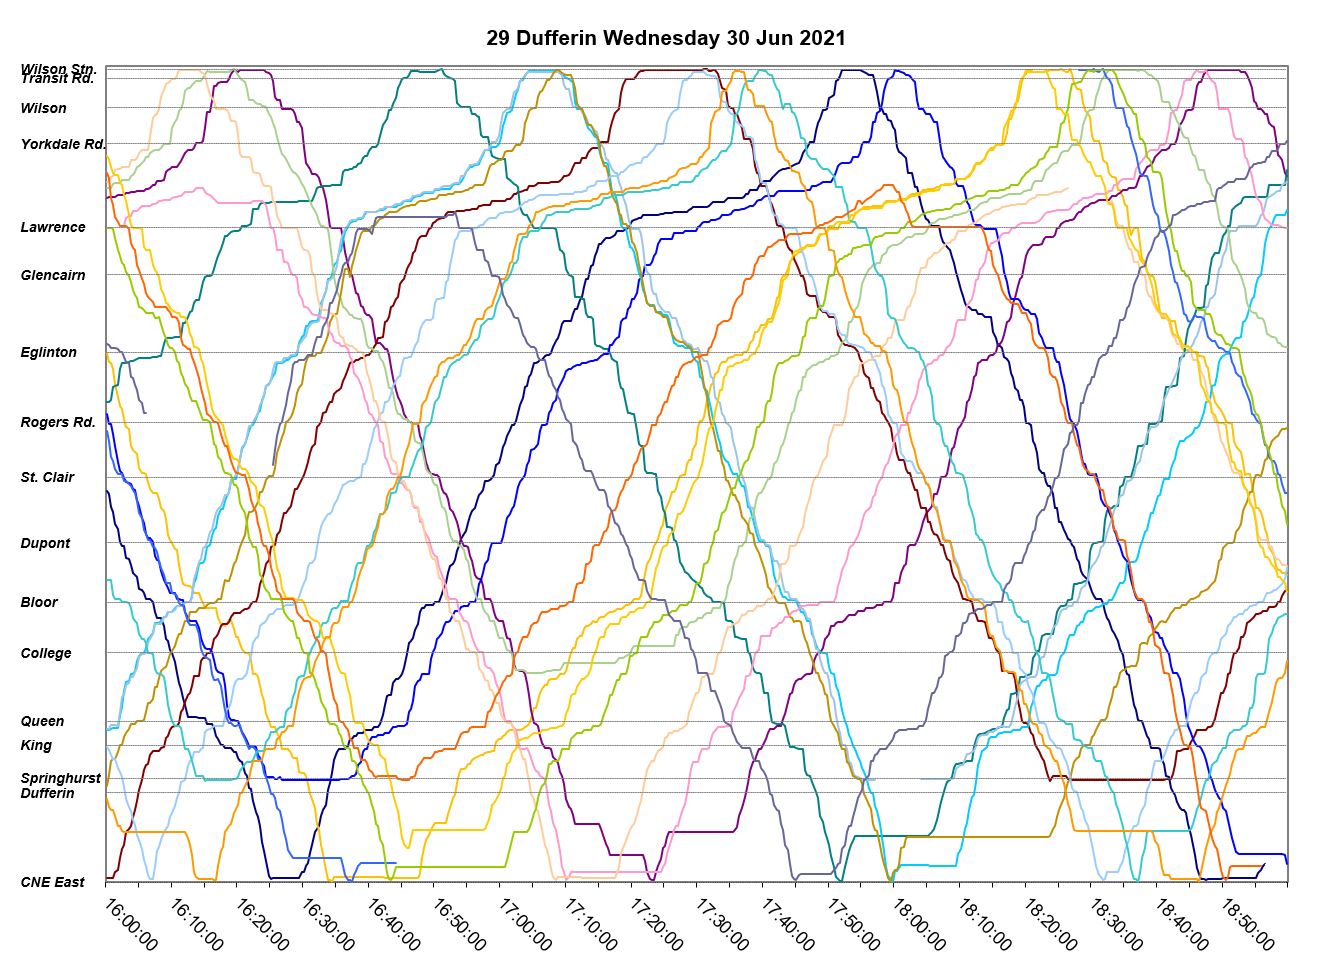
To show just how bad the service was at Bloor Street, here are detailed plots of headways through the day.
Express Service Quality
Lest anyone think that the problems shown here are all with the local service and the express buses will somehow even things out, that is definitely not the case.
Here are the charts for average and standard deviations of headways for the 929 Express in June. The SD value northbound at Bloor is in the 4-5 minute range indicating a considerable variation in headways all day. Week 5 is even worse.
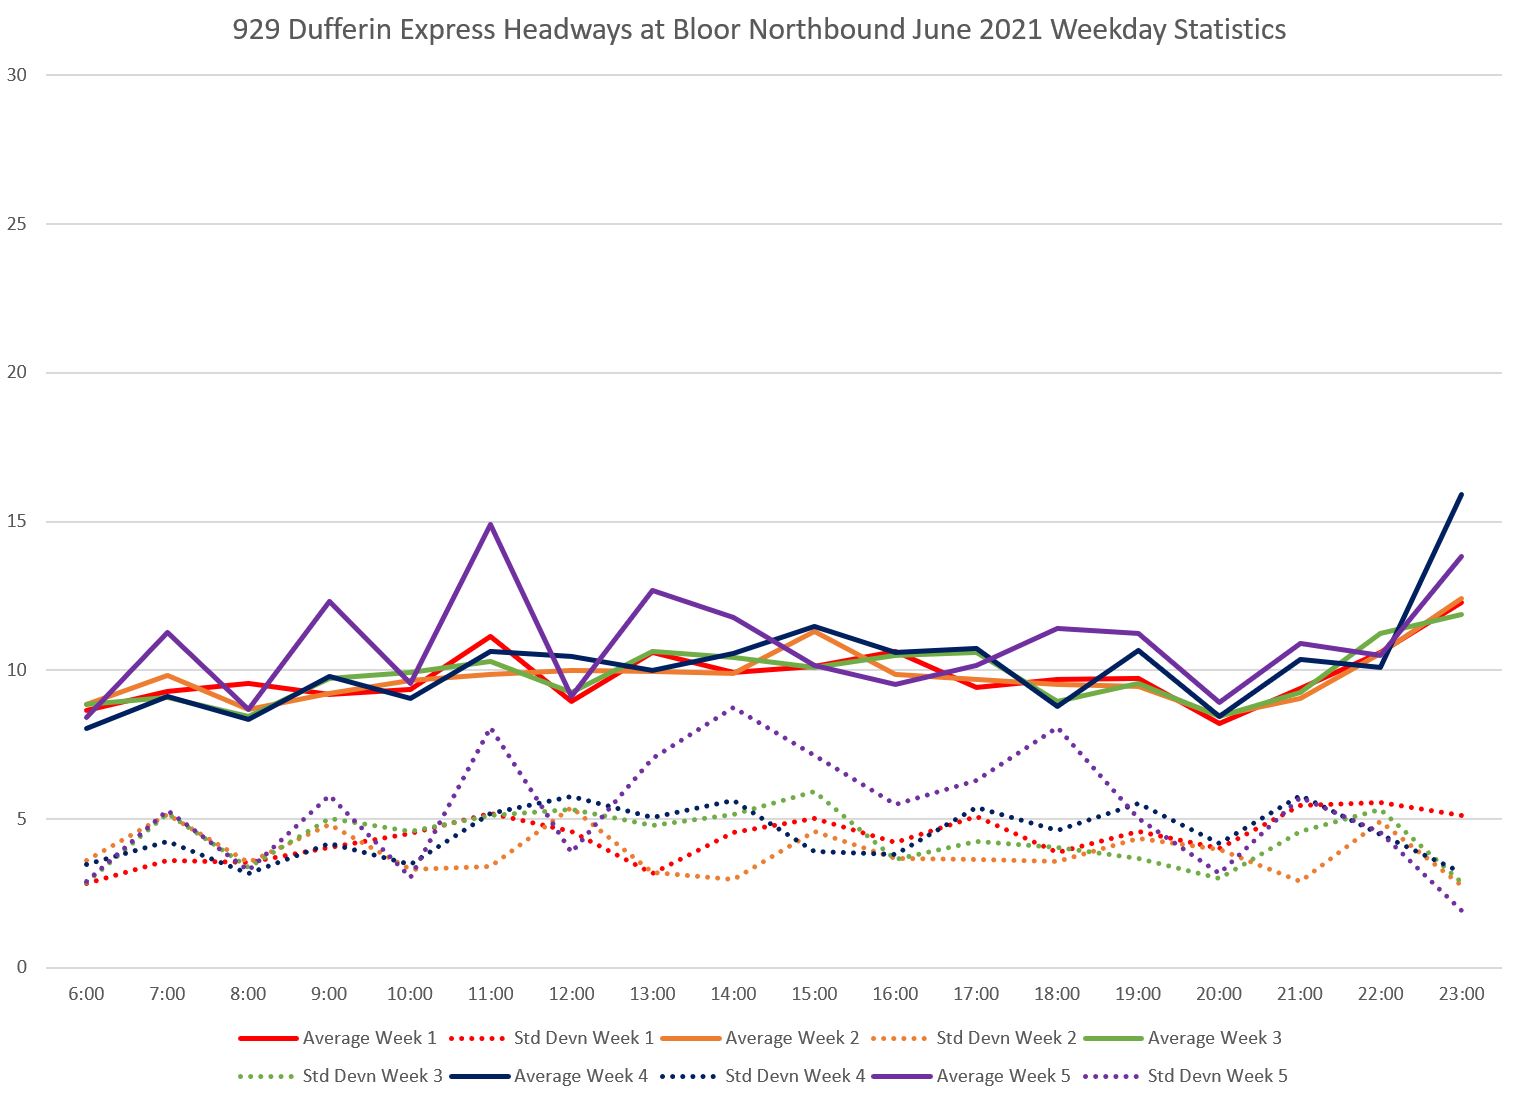
The headway charts for week 4 show that even in comparatively normal times, there is a wide range of headways actually operated.
Week 5 is even worse. As with the local service, the headway trend line rises above the typical average value showing that some trips are not just very late, they are missing either because they did not operate or were short turned.
I will not bother with the service charts for the 929 Express because they show the same characteristics as the local service with bunching, gaps and delays.
Full Chart Sets
For those who want to see all of the details.
Travel time charts for 29 and 929 services, April 2018 to June 2021:
Comparative speeds for April 2018 and June 2021 (local and express):
Headway charts with weekly breakdowns:
- 29 Dufferin
- 929 Dufferin Express
Service charts for 29 Dufferin:

I support Steve’s efforts to address reliability of surface transit. One focus is the effectiveness of the reports that measure reliability. With the Dashboard for Scarborough Red Lanes reliability can be measured using TTC’s own report (Transit Wait-Time Reliability) and Steve’s charts give the detailed breakdown. The Dashboard for Dufferin is eagerly awaited.
My favourite charts are the messy ones with tons of wavy lines. At a glance I can see tons of bunched buses, erratic spacing of departures from terminals and huge gaps in waits between buses on the Dufferin route. These are controllable activities that route supervisors are accountable for. The TTC’s own Transit Wait-Time Reliability report will reflect this poor service.
Steve: Alas, you will wait a while for a Dufferin Dashboard because that route is unlikely to see red lanes before 2023, and there is already a lot of opposition to the idea. I hope that the TTC and City can break free of an “all or nothing” approach and deal with problem areas. The challenge will be that taking road space in the worst of them probably will cause the loudest howls from those who are affected.
LikeLike
Are the Transit Wait-Time Reliability reports only available for Dashboard projects?
I think they should be produced for all routes.
The red lane project is an effort to improve service. Steve’s charts measure service, in a way I understand. We are patiently waiting to see if the cost of red lane implementations, show improvement in service, using Steve’s measures. However, we are well aware that each operator’s and route supervisor’s performance directly impacts the quality of service. Steve’s charts and the Transit Wait-Time Reliability report document their performance. There is no cost to improve the quality of work, like stopping operators from playing bus tag and rational spacing of departures from terminals. The TTC Board should be highlighting these measures of performance of behalf of users, who suffer from poor service.
Steve: Only for the RapidTO routes. Moreover, the TTC needs to work on their “reliability” index. As it now stands, for headways between 5 and 10 minutes (the case for all four Scarborough RapidTO routes in the peak period), the ±50% rule is the target. For under 5 minutes (not applicable here) the span is ±75% of the scheduled headway which excuses just about anything under 5 minutes. Over 10 minutes, they revert to the six minute window (+1, -5) relative to scheduled times. It is self evident from the data I have published that they do not hit this target.
See TTC Service Standards at pp 11-12.
LikeLike
Do the red lanes have to be 24/7? Most of Dufferin St is in a heavily parking impacted area and while the residents are used to the no stopping signs during rush hours I don’t know where they would park their cars at night.
Steve: There are a few points here. First, the whole idea of the red lanes is that they are special and are in effect all of the time. If we start having different rules for different streets (pink lanes? purple lanes?) this defeats the idea that it is always a transit lane.
Second, there is a big problem with assuming that congestion is something that only happens during certain parts of the daytime. The situation varies from route to route as my articles have shown, but Dufferin is notable for congestion outside of the peak, especially on weekends.
The problem of resident parking is not easy to fix, and may preclude full time transit priority lanes, at least on some parts of Dufferin.
LikeLike
I must be misunderstanding something, because I was taking the 929 pretty regularly pre-Covid – certainly throughout 2019.
Either way, street parking on Dufferin is going to be a major issue for dedicated bus lanes. The addiction this city has to street parking on arterials is going to choke us to death with congestion.
Steve: My apologies. Yes, the 929 did exist pre-covid, but I was not collecting data for the Dufferin corridor between October 2018 when the 929 was created, and the onset of the pandemic. I do have data from March 2020, but did not include it in the article. It shows a steep drop in travel times week-by-week through March and then the “929” and other express services were cancelled.
I will clarify this in a future update and with modified/additional charts.
LikeLike
In response to Jordan’s comment above, I have added March 2020 data for the 929 Express operation as well as charts showing the week-by-week changes in local and express travel speeds over that month.
LikeLiked by 1 person
Time to convert Dufferin to streetcar, long overdue. Start from Eglinton south to new Ontario Place.
LikeLike
Many thanks for the charts in which it is easy to see bunching. I’m an occasional 29/929 user and it is maddening to see 3 or four buses pull up to the stop after a 15 minute wait. Has there been a change in how inspectors, drivers, and the union interact?
Steve: I doubt that there is anything “official”, but a problem for some time has been that the metric that seems to matter the most is “no short turns” with the result that bunches that could be broken up and used to fill gaps in the opposite direction are left to run pretty much as is. There is also a long standing problem that officially there is no recovery time guaranteed in the schedule. Any time that is present has more to do with making the schedule work out properly than with a contract specified break at the end of a trip.
CEO Rick Leary’s idea of good scheduling is to give buses lots of running time and assume that if they can leave terminals on time, the rest will look after itself. This fails on two counts. First, operators get used to extended breaks because they generally arrive at terminals early, and they can leave late but still within the “service standards”. Second, there is no measurement or reporting of bunching and gaps, nor for the crowding they cause, and so there is no management incentive to space out the service. Riders complain, but management point to their stats which show everything is just fine.
Added to this is the fact that for 18 months, the focus has been just on “keeping the lights on” and service quality has not been a management focus (assuming that it ever was). There are also route-specific problems where if there is some sort of construction activity and/or diversion, the assumption is that the line will be a mess. This can permanently alter the way a line is managed. Finally, there is a question of whether there are enough people actually doing route supervision and whether they have the tools needed for fine-grained line management.
A good example of misguided principles and metrics can be seen on 501 Queen where the burning issue in years past was short turns at Woodbine Loop that caused wide gaps in service to Neville. Now there are few short turns (and even fewer that are actually reported), most service goes through, but it may do so in pairs of vehicles 20 minutes apart producing the same effect for riders as if a regular 10 minute service had a short turn.
The TTC has conflicting goals in service management including rules about being “on time” to fit with the model that service can look after itself. Deliberately running off-schedule, even if it would produce better service, conflicts with the “on time” goal. All of this, of course, has evolved in an atmosphere of contentious union-management relations.
LikeLike