
This article continues a series reviewing operations on existing and proposed RapidTO red lanes reserved for transit vehicles.
Previous articles in the series:
- Red Lanes, Express Buses and Service Reliability in Scarborough
- A Dashboard for Scarborough Red Lanes
- Service Reliability on 35/935 Jane
- Service Reliability of 29/929 Dufferin
Service on Steeles operates from Finch Station north on Yonge and West on Steeles with three branches:
- 60A local service to Pioneer Village Station
- Local service (via Pioneer Village Station both ways)
- 60D to Highway 27 (daytime, Monday-Saturday)
- 60B to Martin Grove (evenings and Sundays)
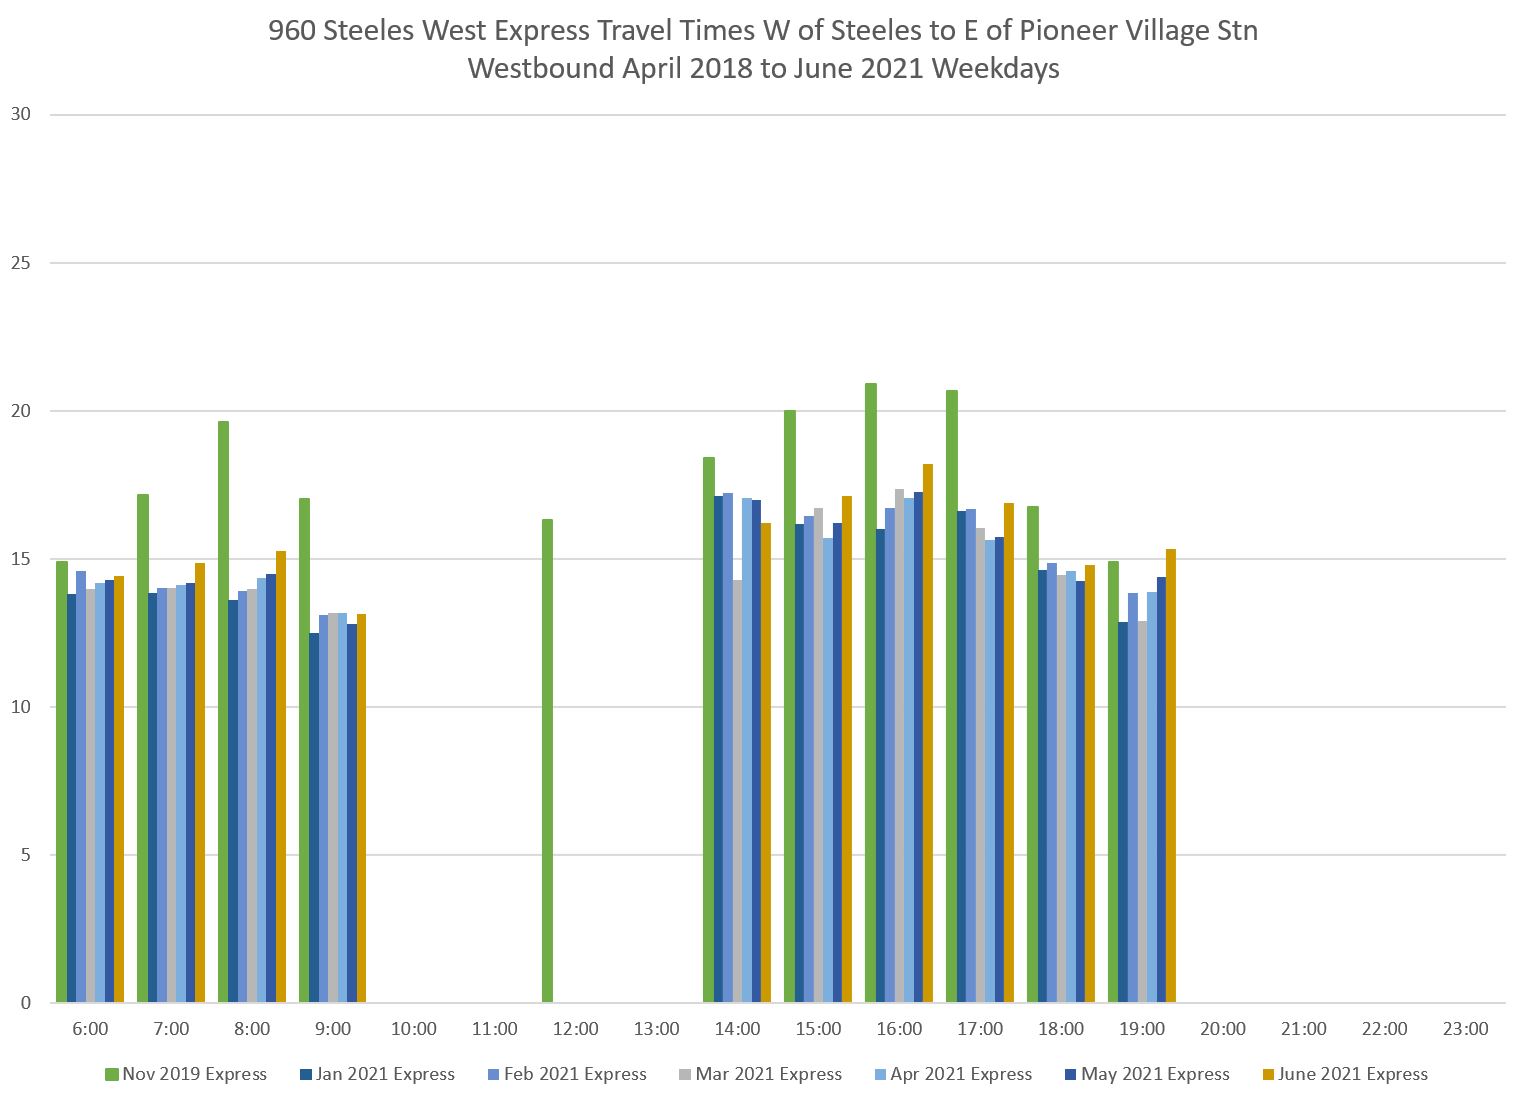
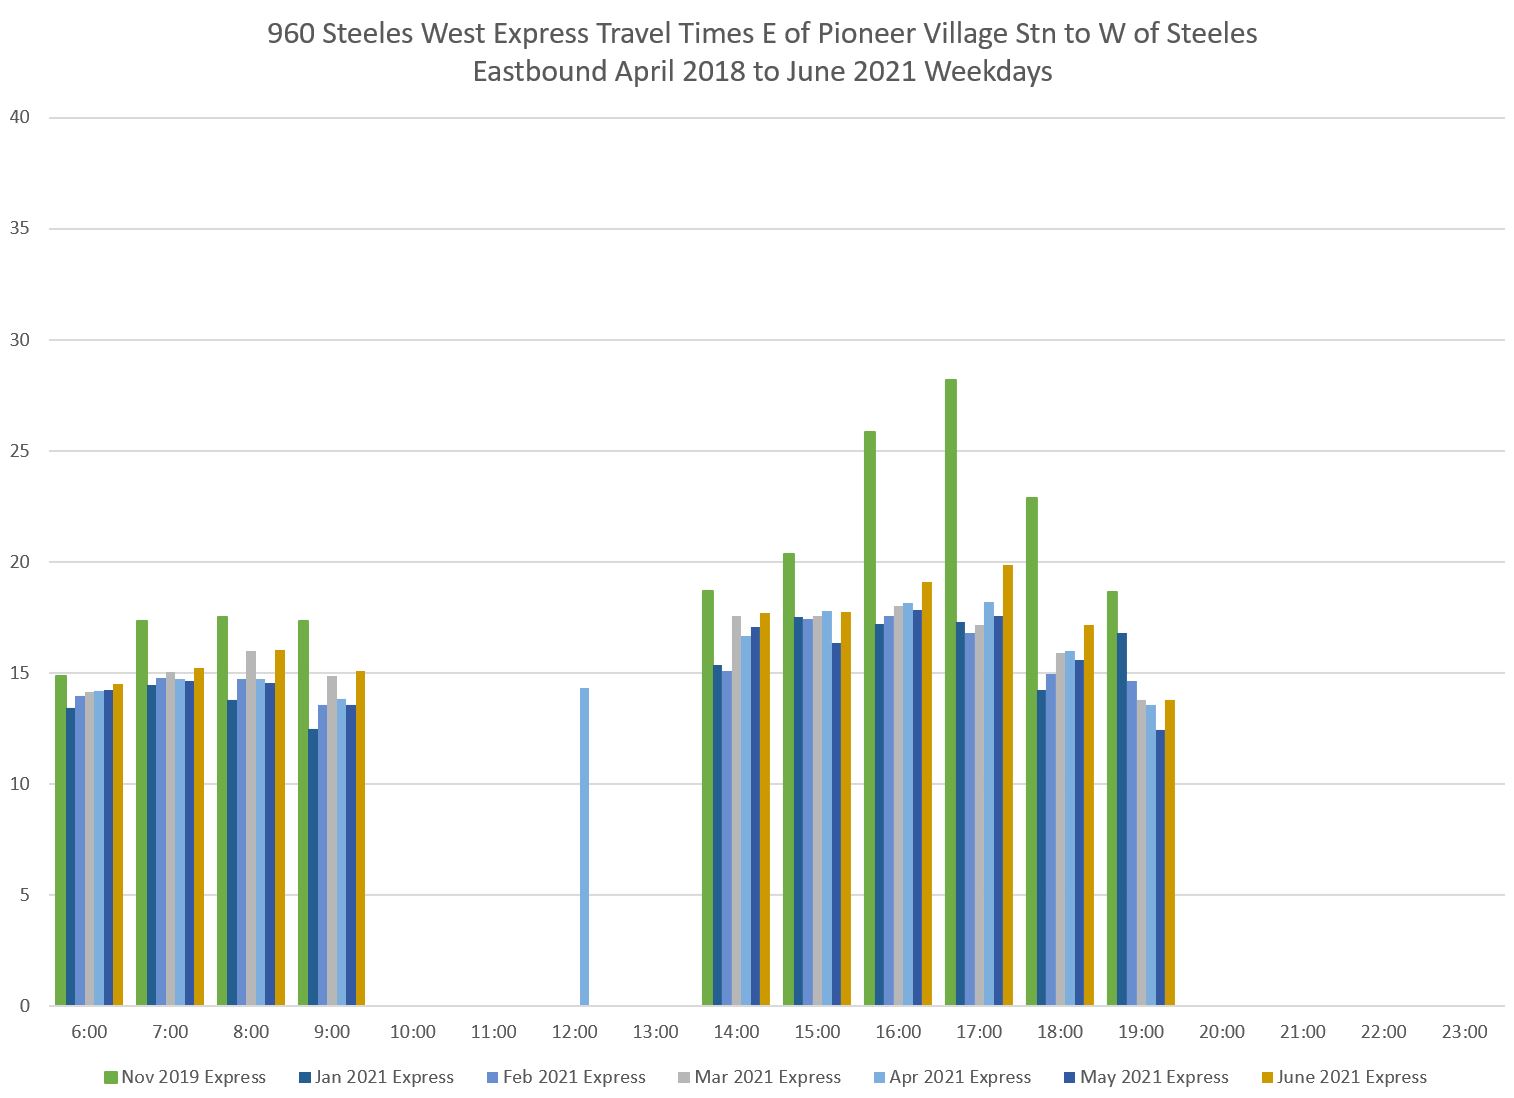
- 960 express service to Pioneer Village Station (peak periods only)
The 960 Steeles West Express bus was originally known as the 60E, later the 960. It was discontinued in Spring 2020, and resumed operation in January 2021.
Weekend 60 Steeles West service was reduced on June 20, 2021.
This article deals with:
- The change in travel times for the service between Steeles & Yonge and Pioneer Village Station (the portion of the route proposed for Rapid TO) from pre-pandemic traffic conditions and their evolution through the low point of demand and congestion in 2020 through to June 2021.
- Travel times for service west of Pioneer Village Station.
- The speed difference between local and express services.
- The reliability of service.
The High Points
As on other routes in Toronto, there was a drop in travel times across much of the route concurrent with the pandemic and lockdowns in mid-2020. However, unlike other routes, this effect was short-lived on Steeles and particularly on the section west of Pioneer Village Station.
Extremely severe congestion affects this route as of June 2021, although the degree varies from day to day with wide differences in travel times on some segments. I plan to follow-up this situation with data through July and August in a future article.
For the most part, scheduled travel times on Steeles provide generous layovers at terminals, and most congestion effects can be absorbed by them (whether the excess is officially called “recovery time” or not).
Headway reliability on the 60/960 Steeles West service is spotty. For the local buses, bunching and gaps are common, and this occurred even during mid-2020 when traffic conditions were much less of an issue. Express buses are infrequent enough that they do not run as pairs, but there is still a wide range of headways compared to the scheduled service.
The situation west of Pioneer Village Station where schedules service is less frequent is particularly bad.
It is quite clear that if there is any active attempt to manage headways on Steeles West, it is largely ineffectual and riders suffer as a result. Uneven headways lead to uneven loads and the perception that most buses are crowded even when average demand might not bear this out.
There is a RapidTO proposal for the segment of Steeles West between Yonge and Pioneer Village Station. Although Yonge Street itself between Finch and Steeles is also a source of congestion, there is unlikely to be much improvement for transit priority here because of the planned subway extension and construction disruption. This will make a bad situation even worse, and the subway project should be designed to minimize loss of road capacity and/or to prioritize transit within whatever remains.
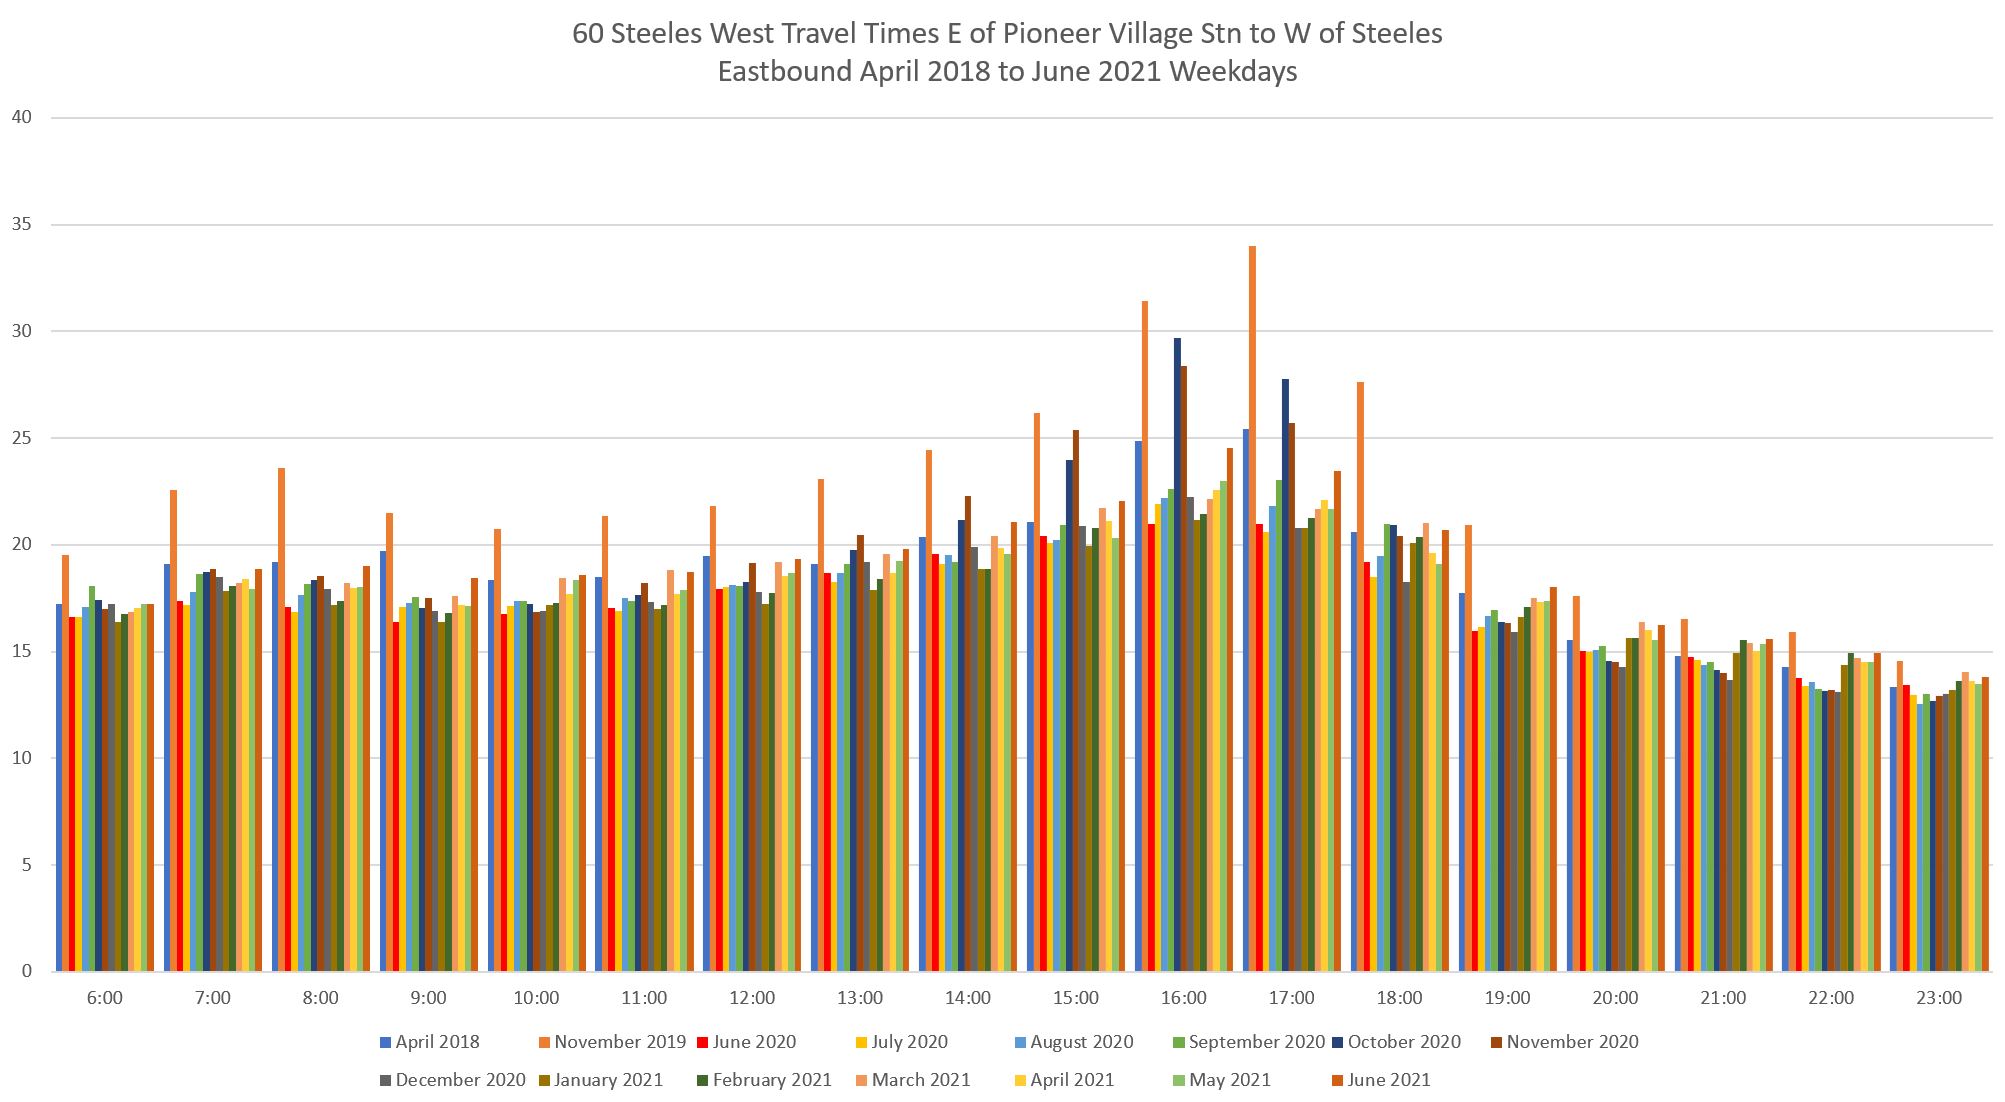
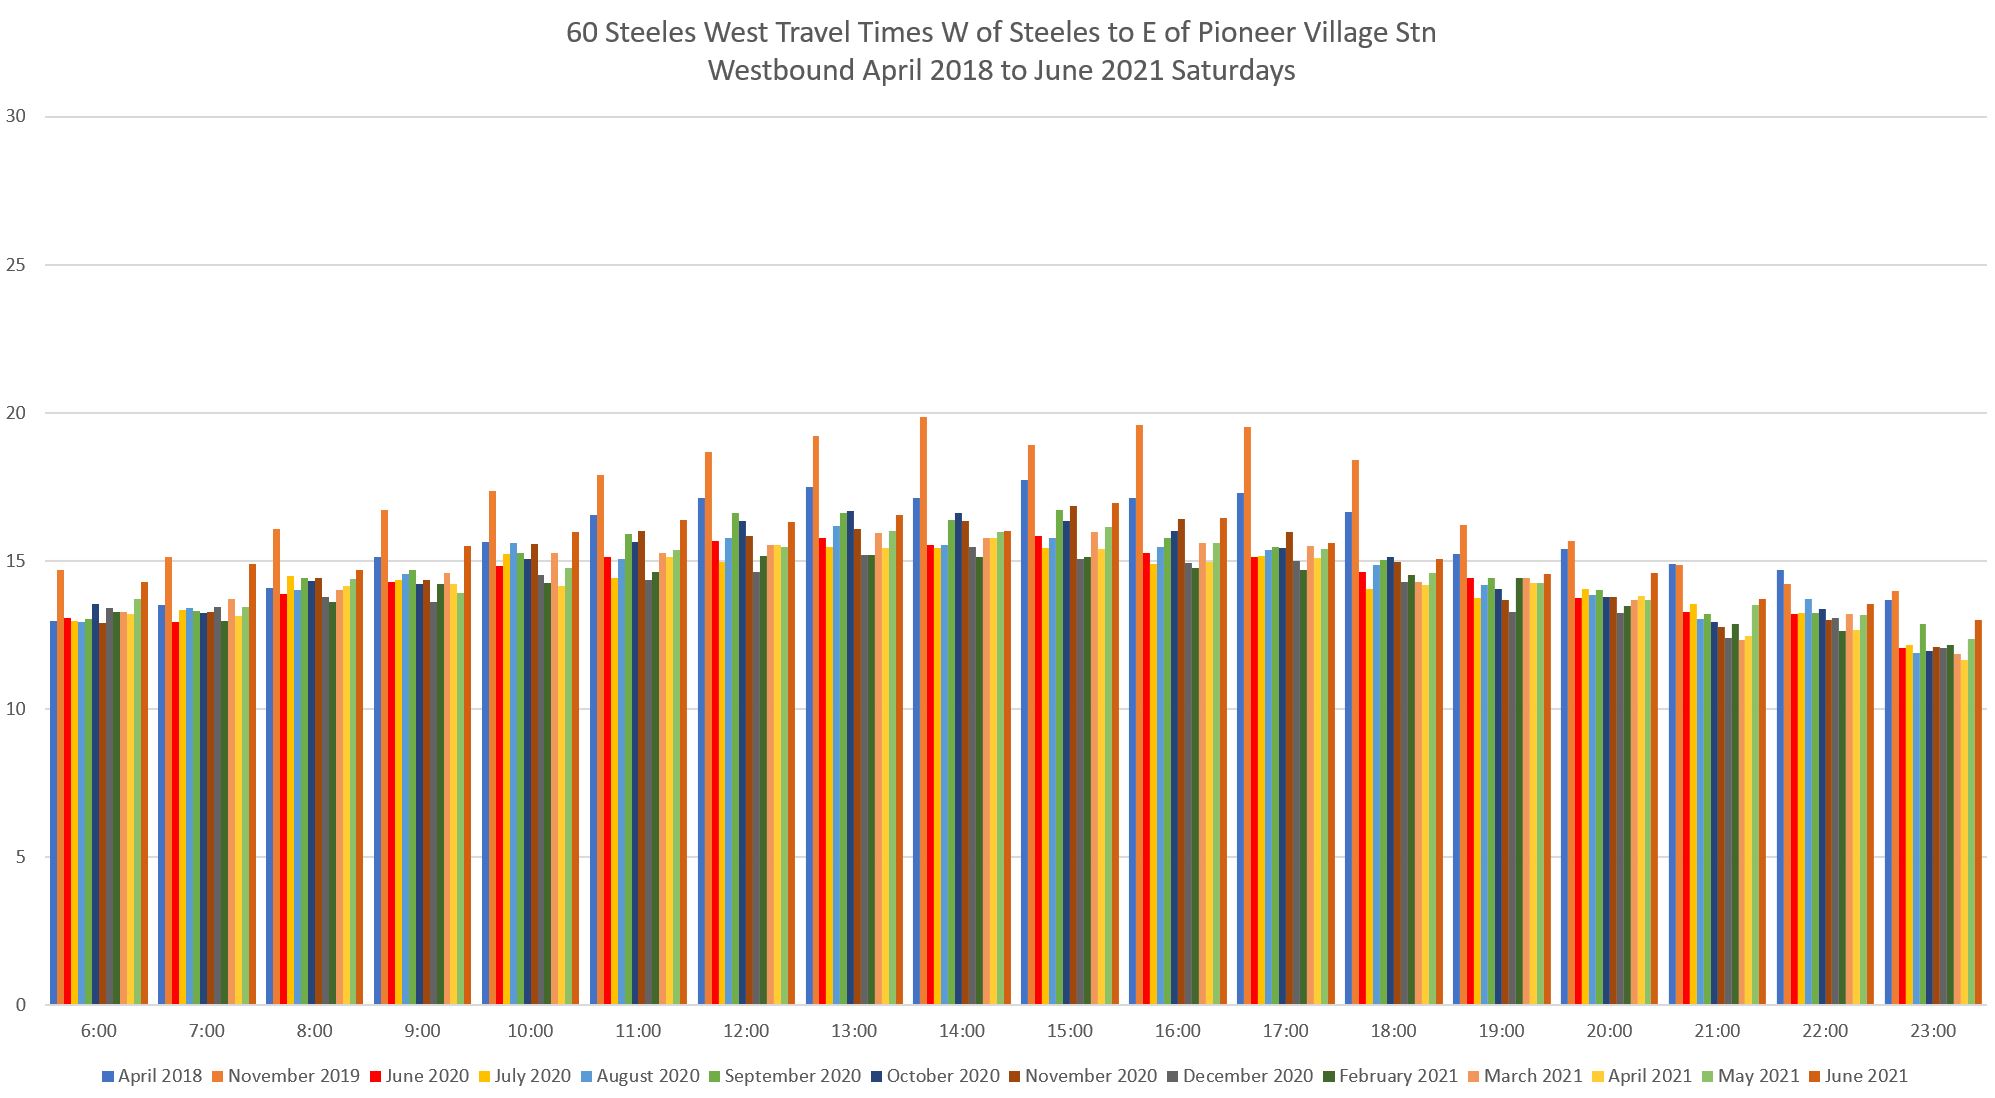
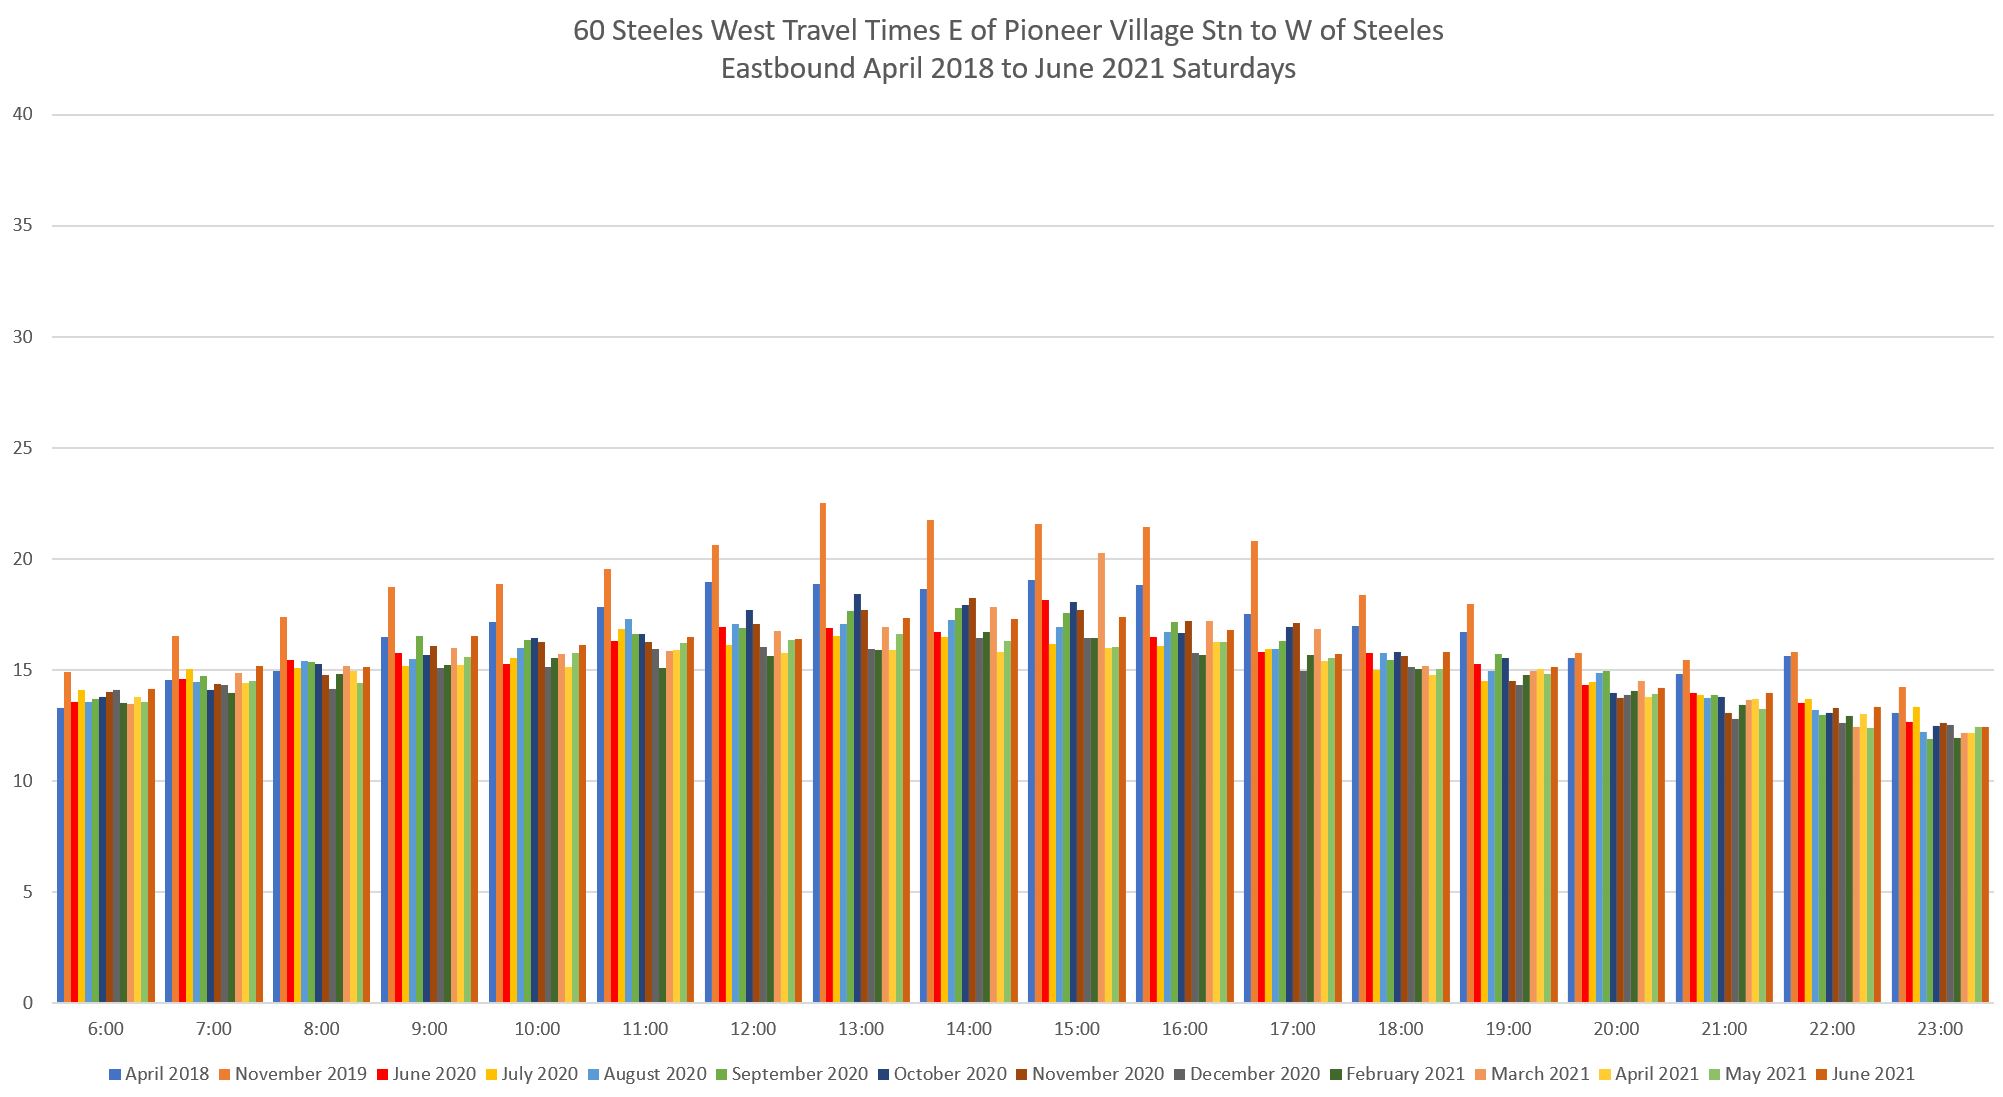
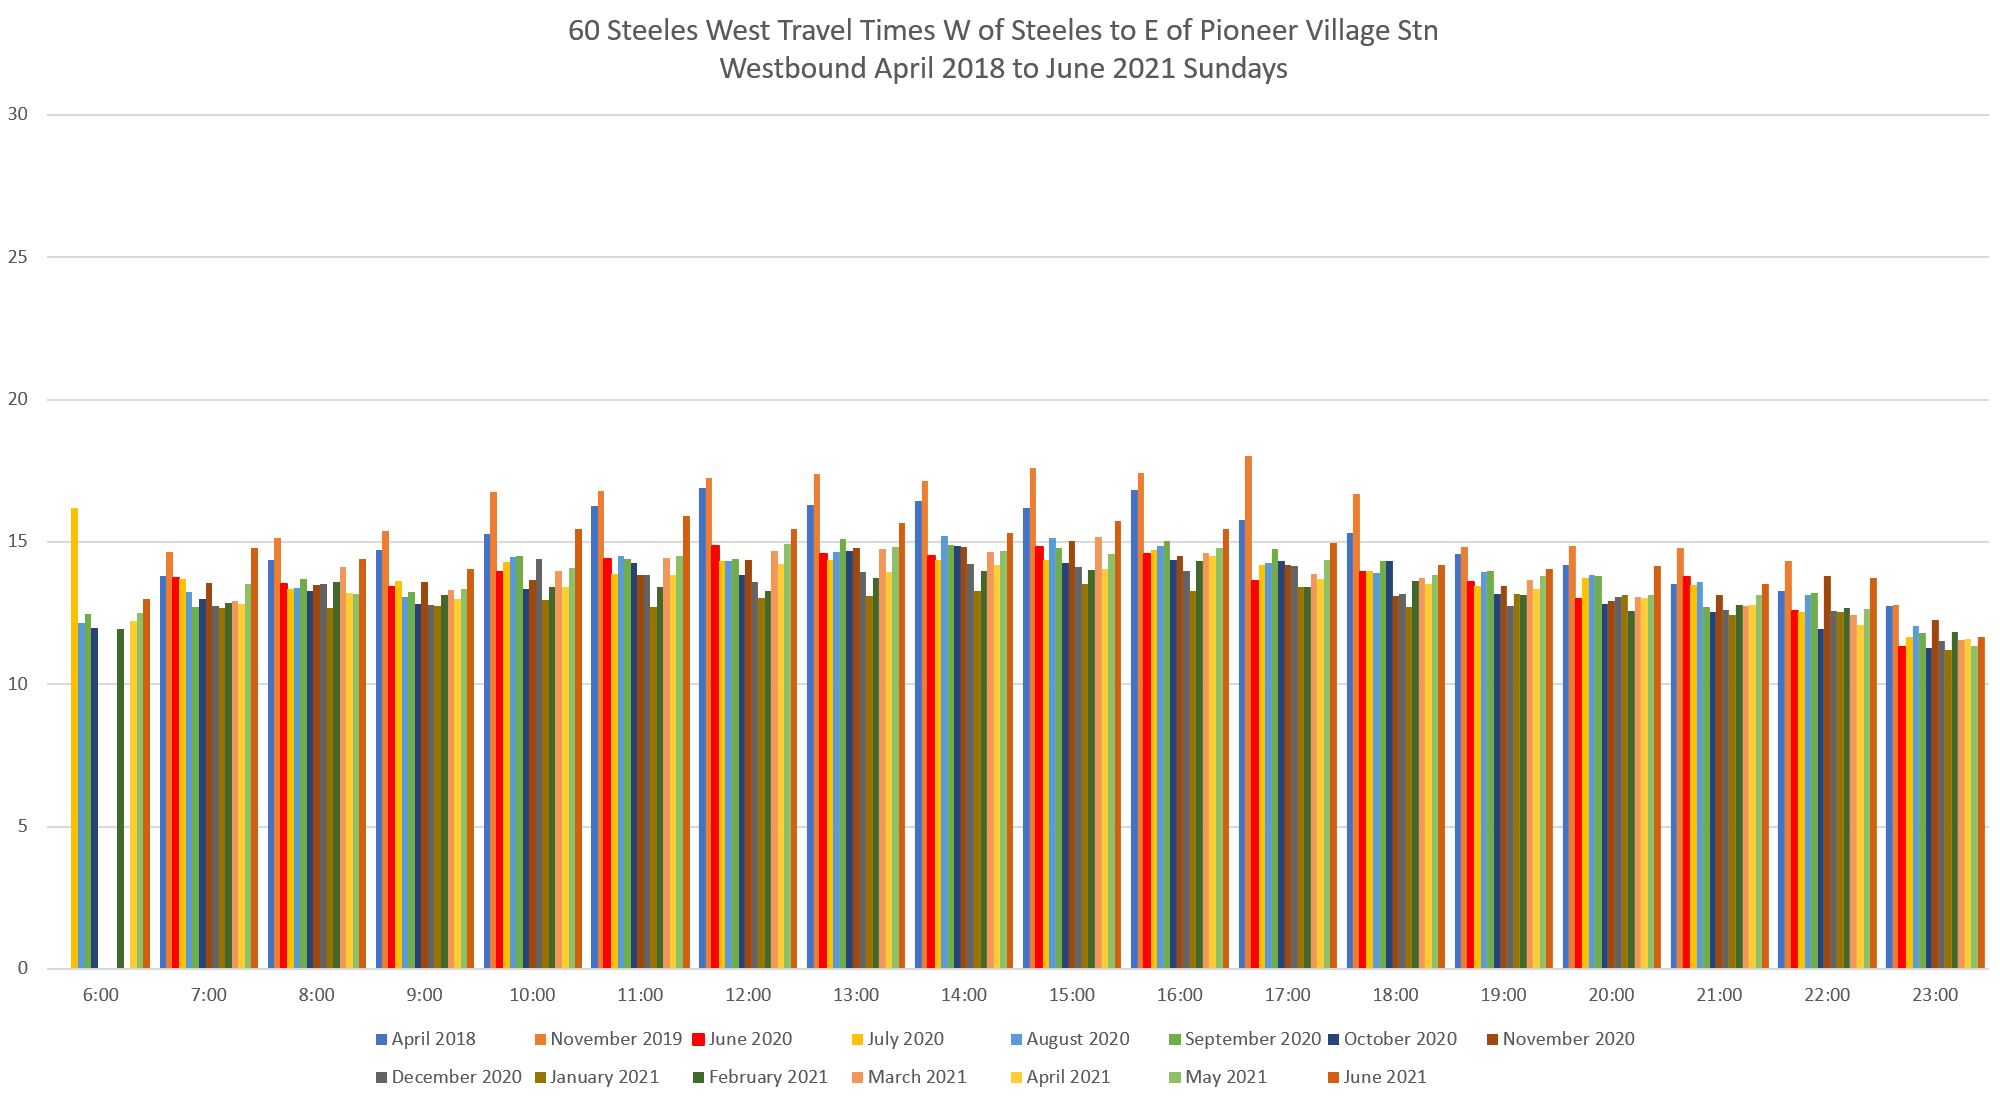
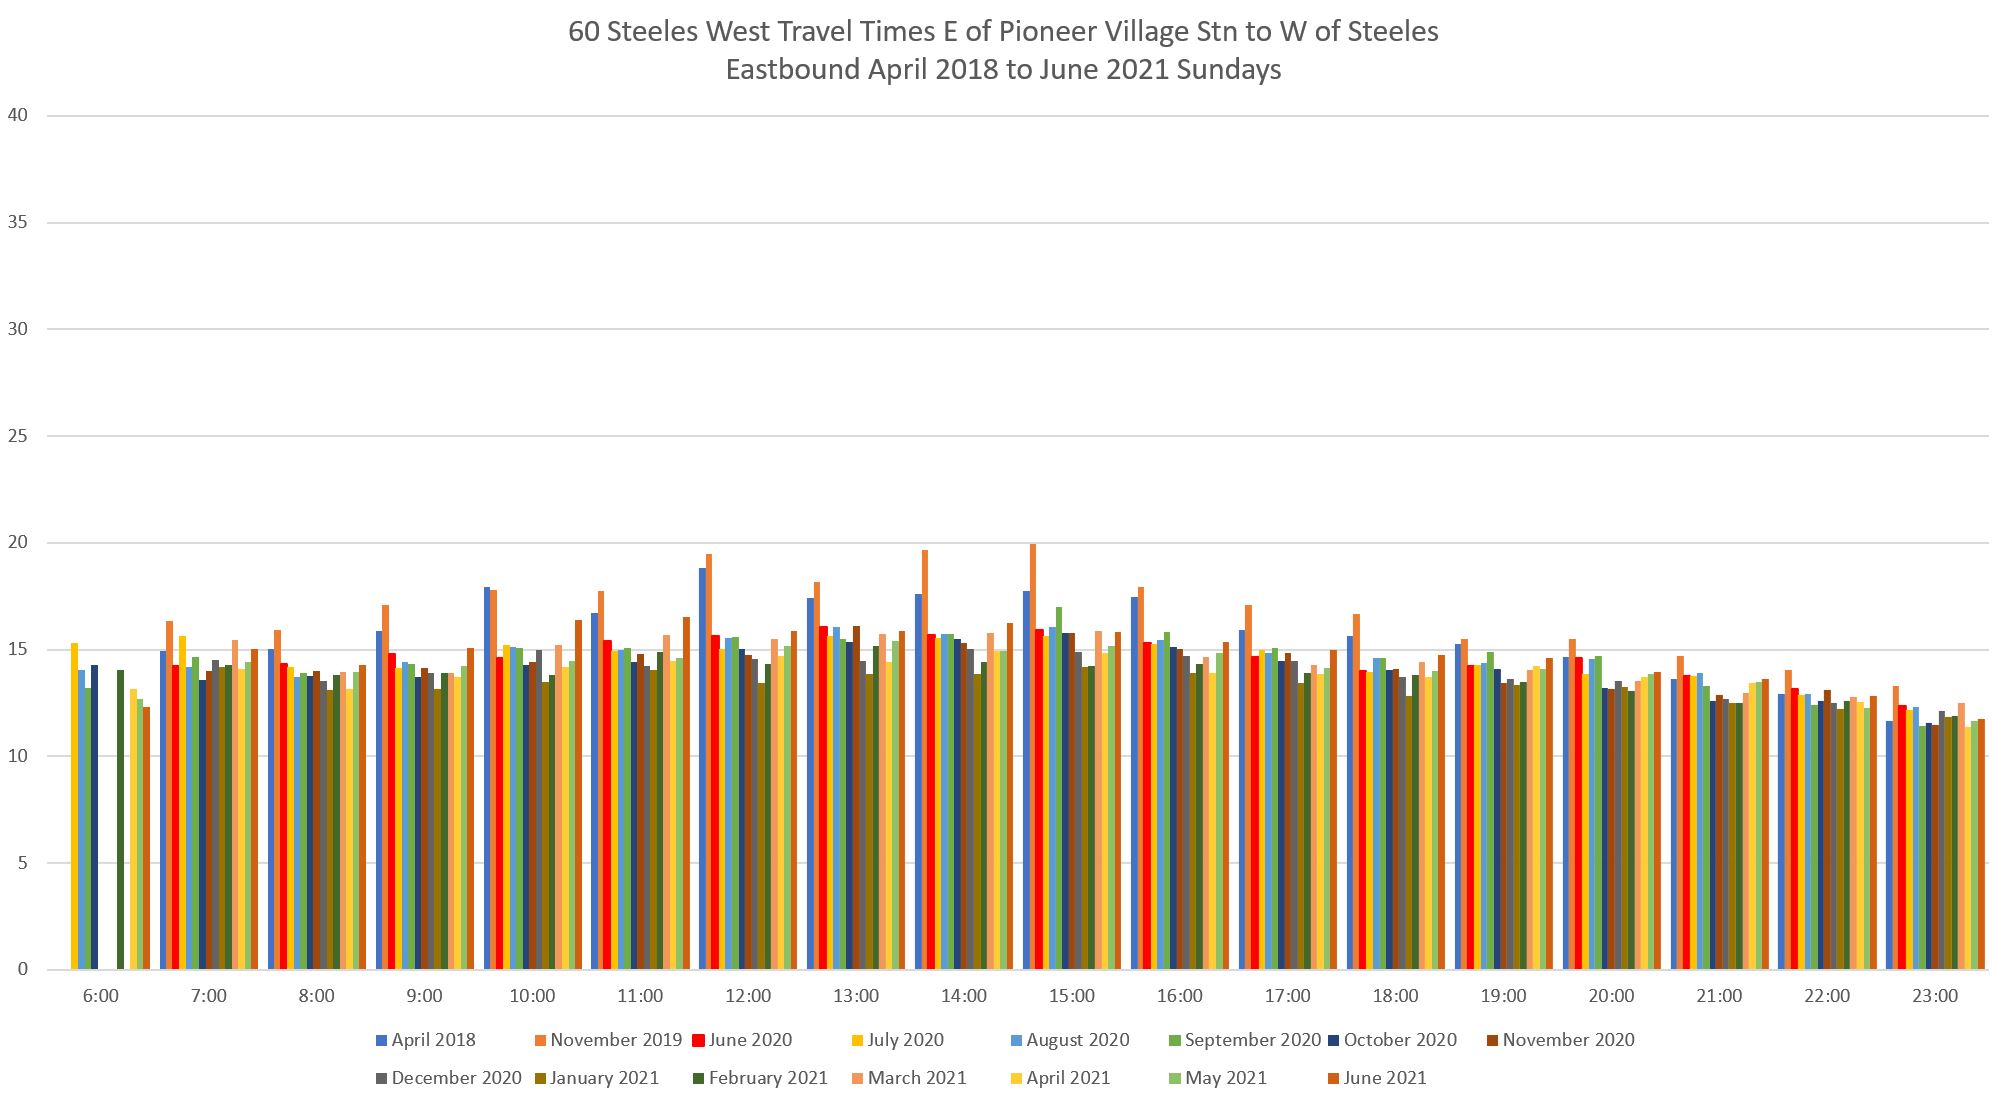
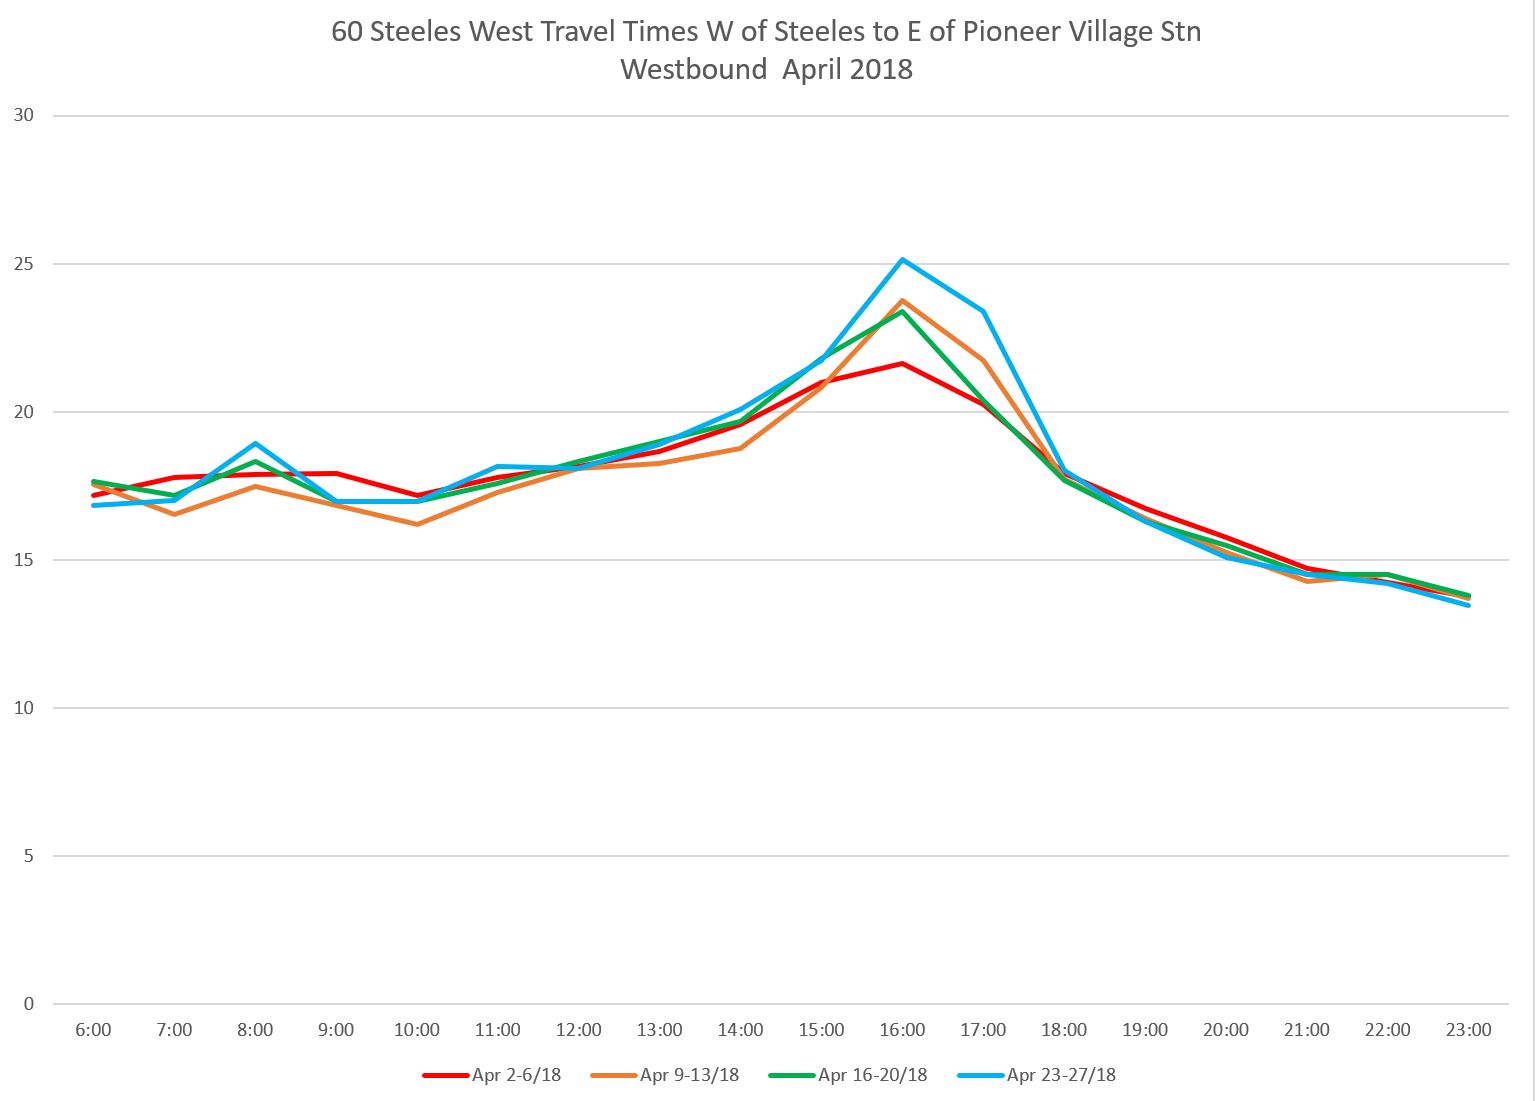
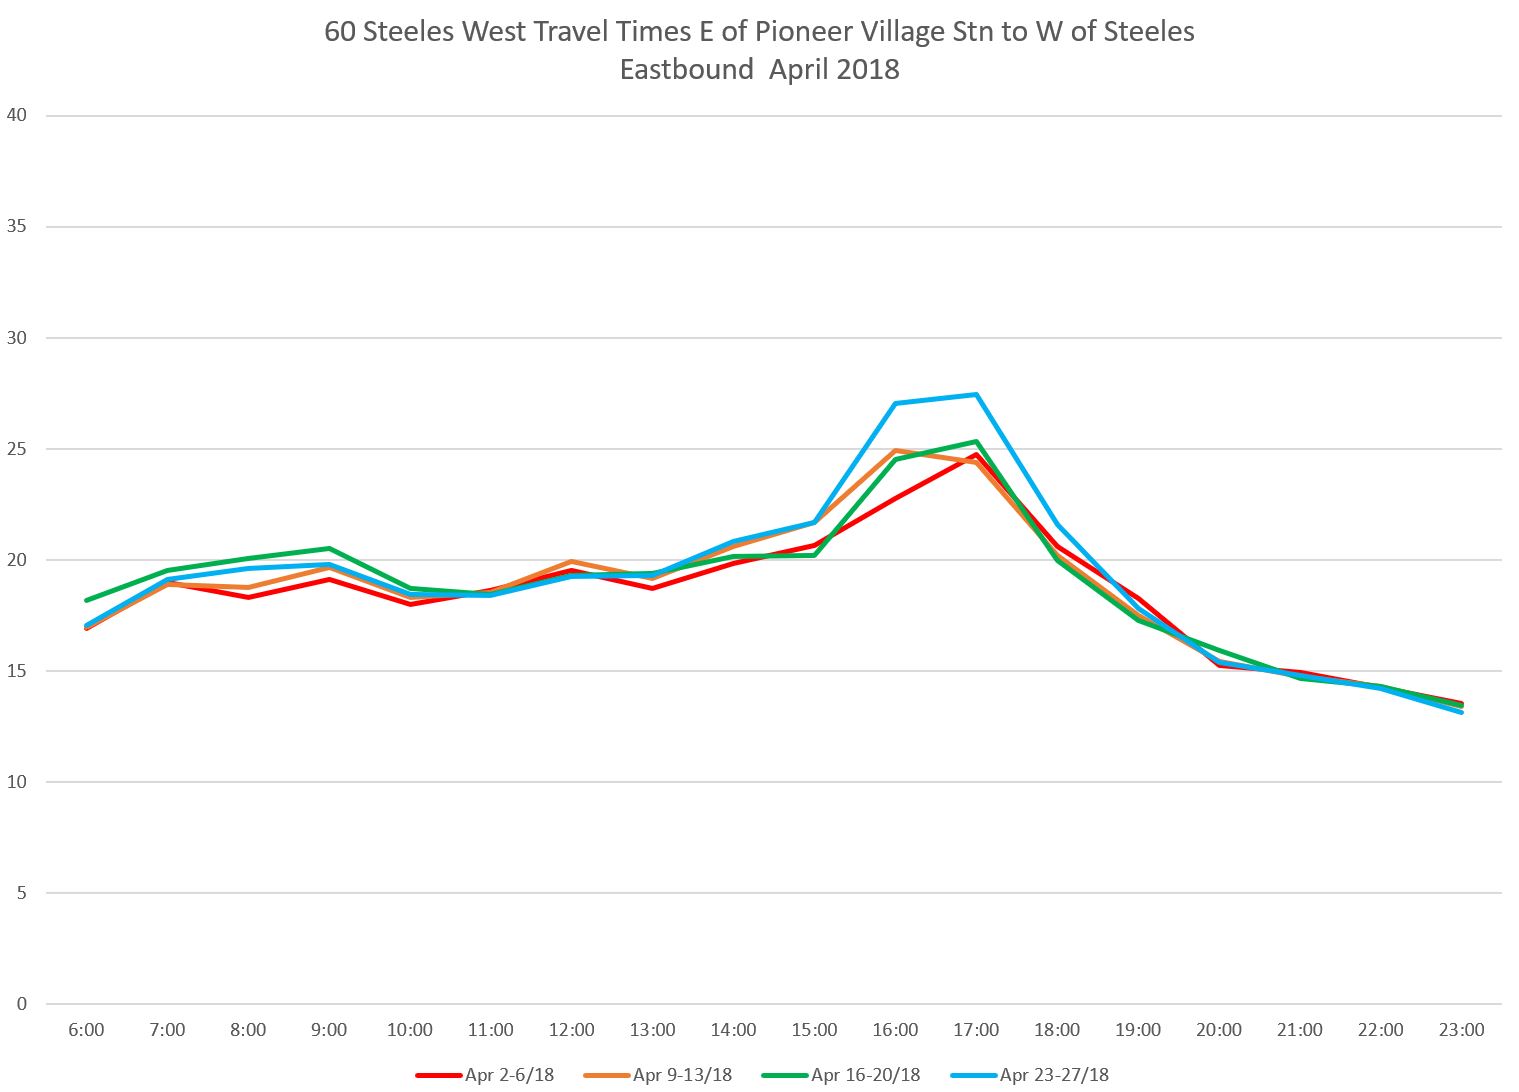
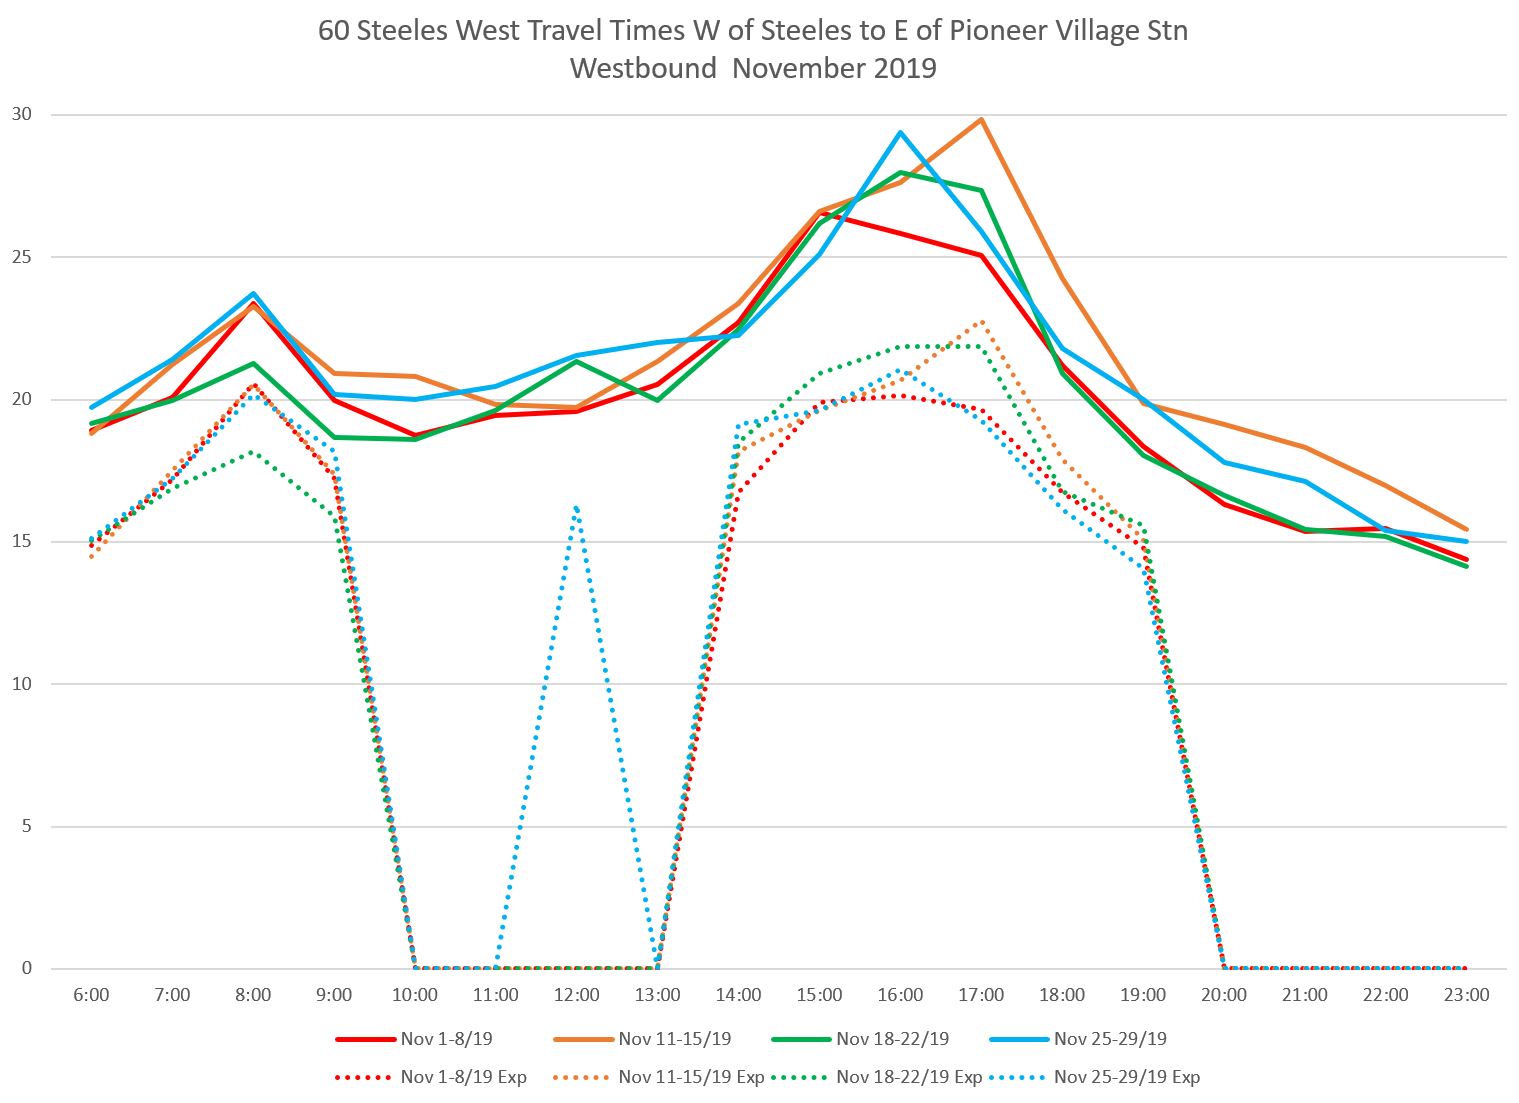
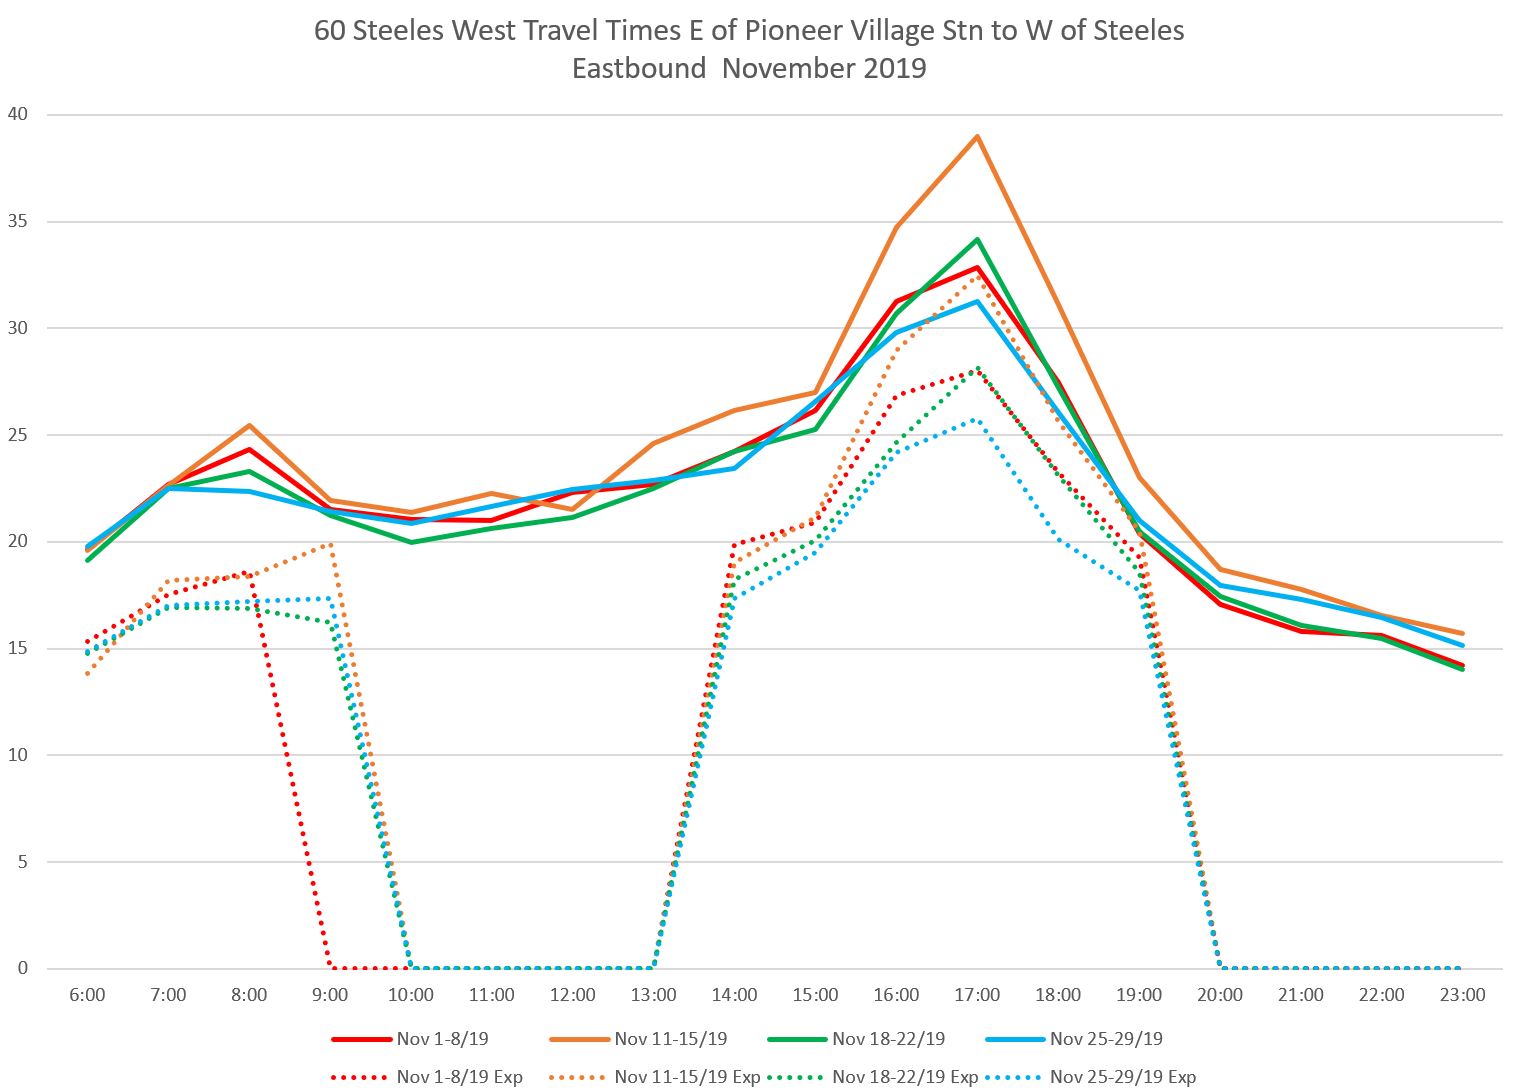
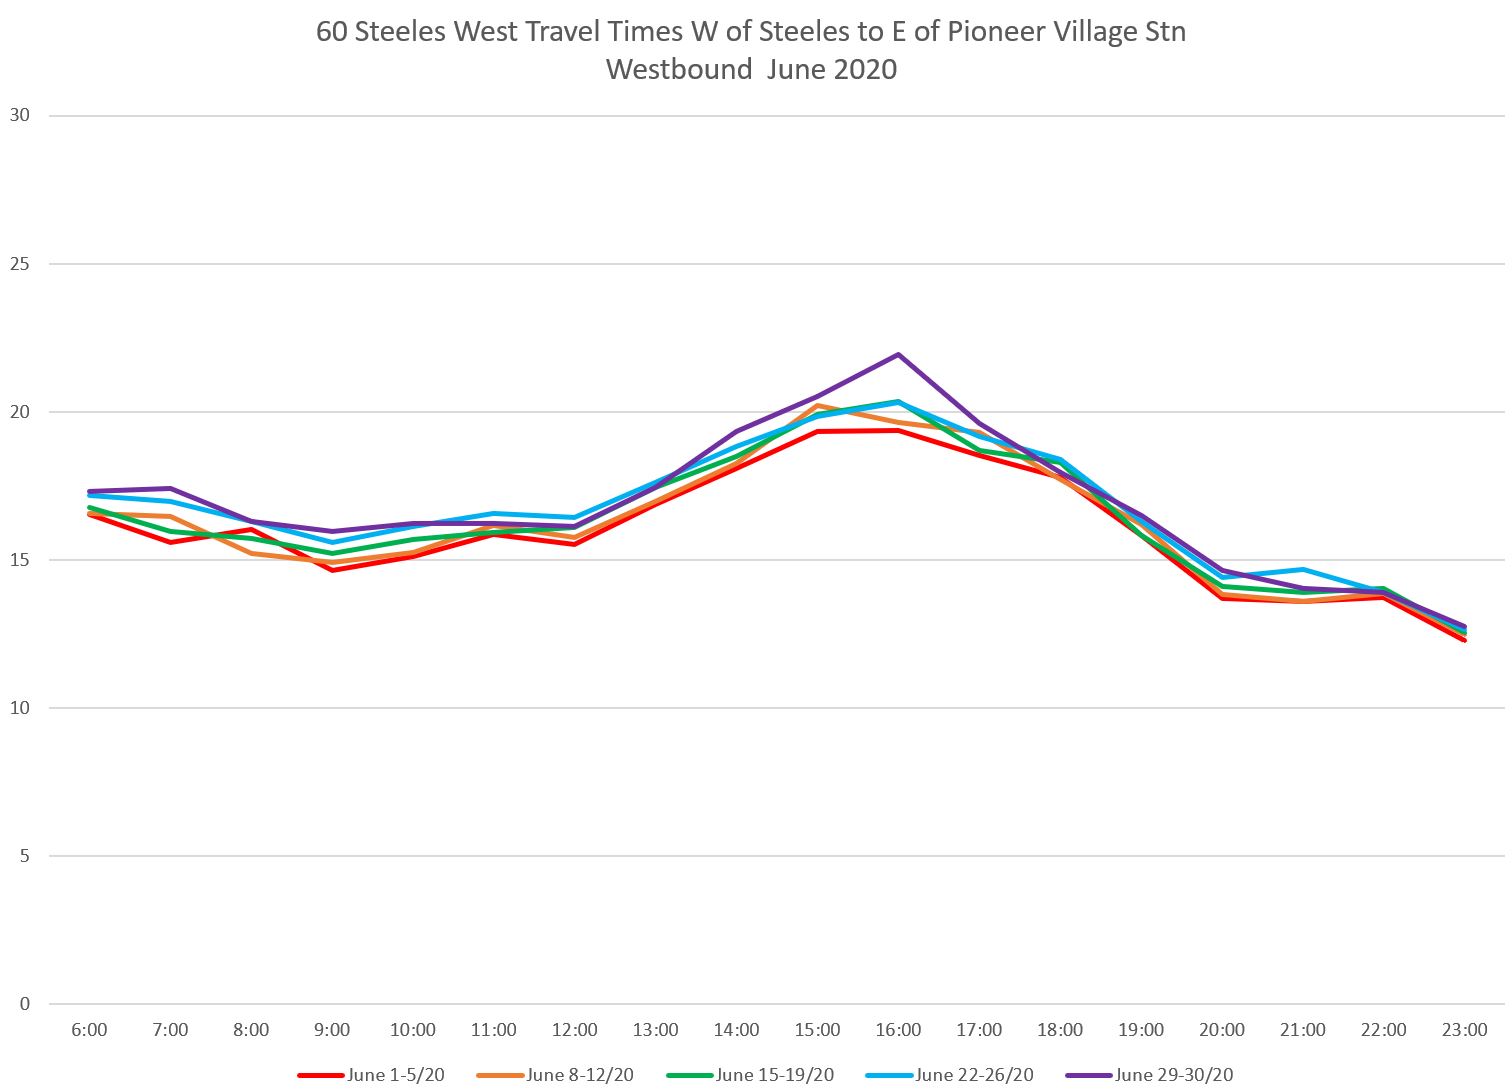
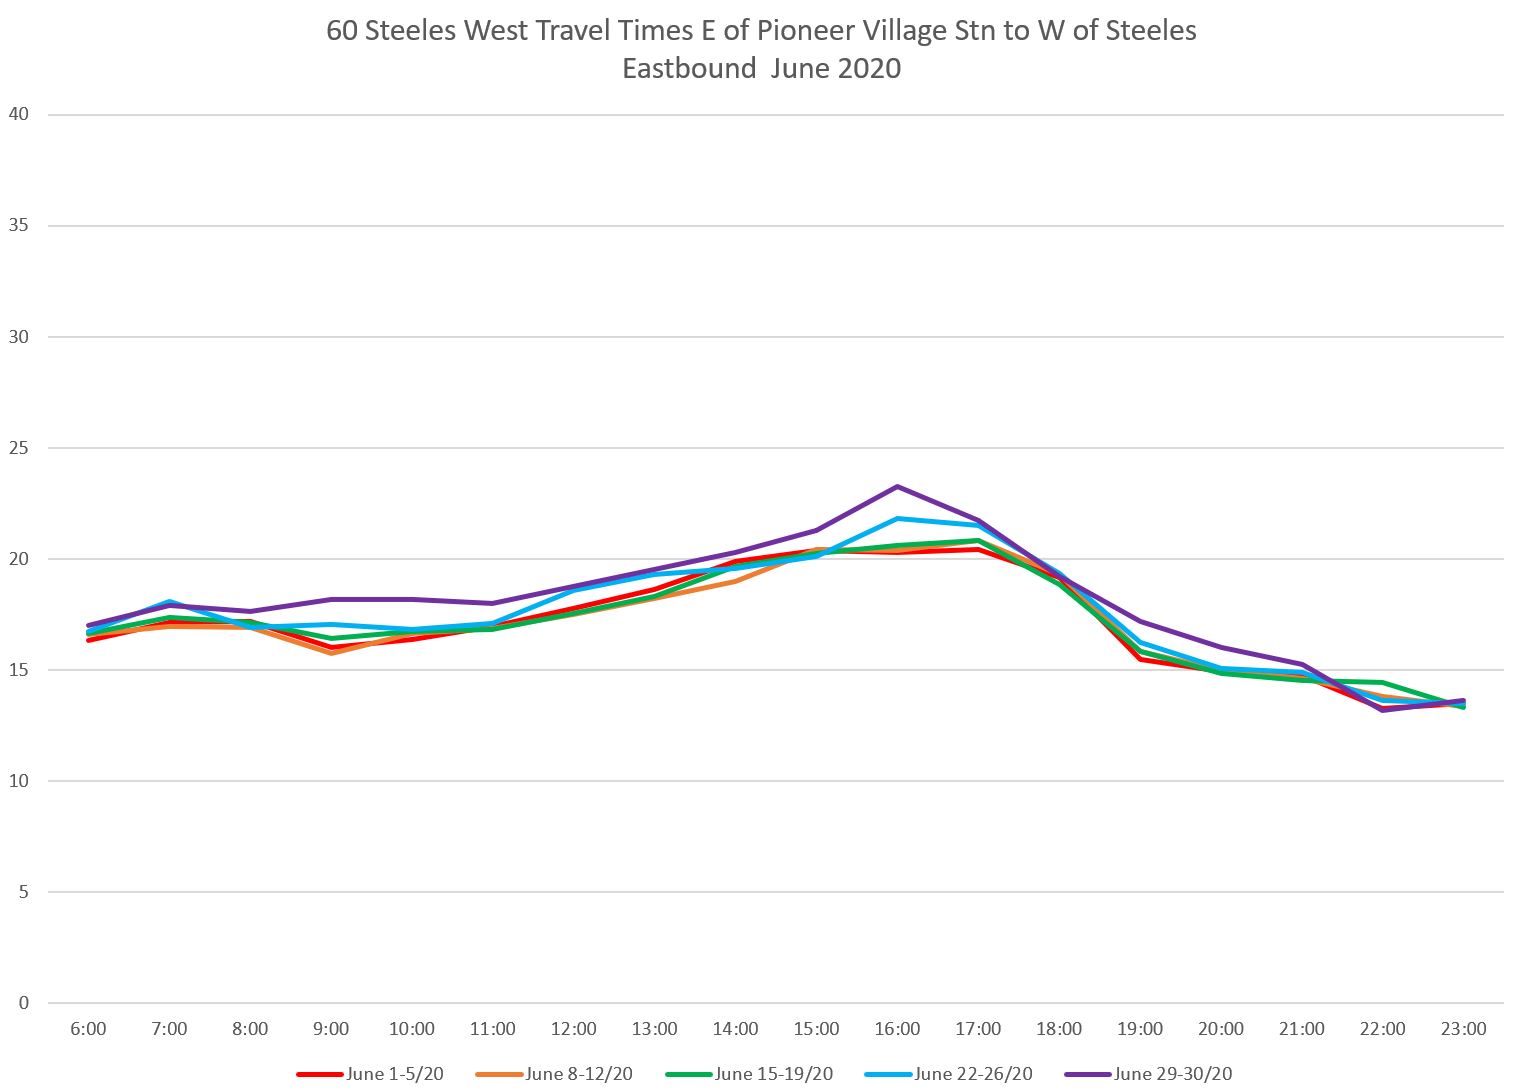
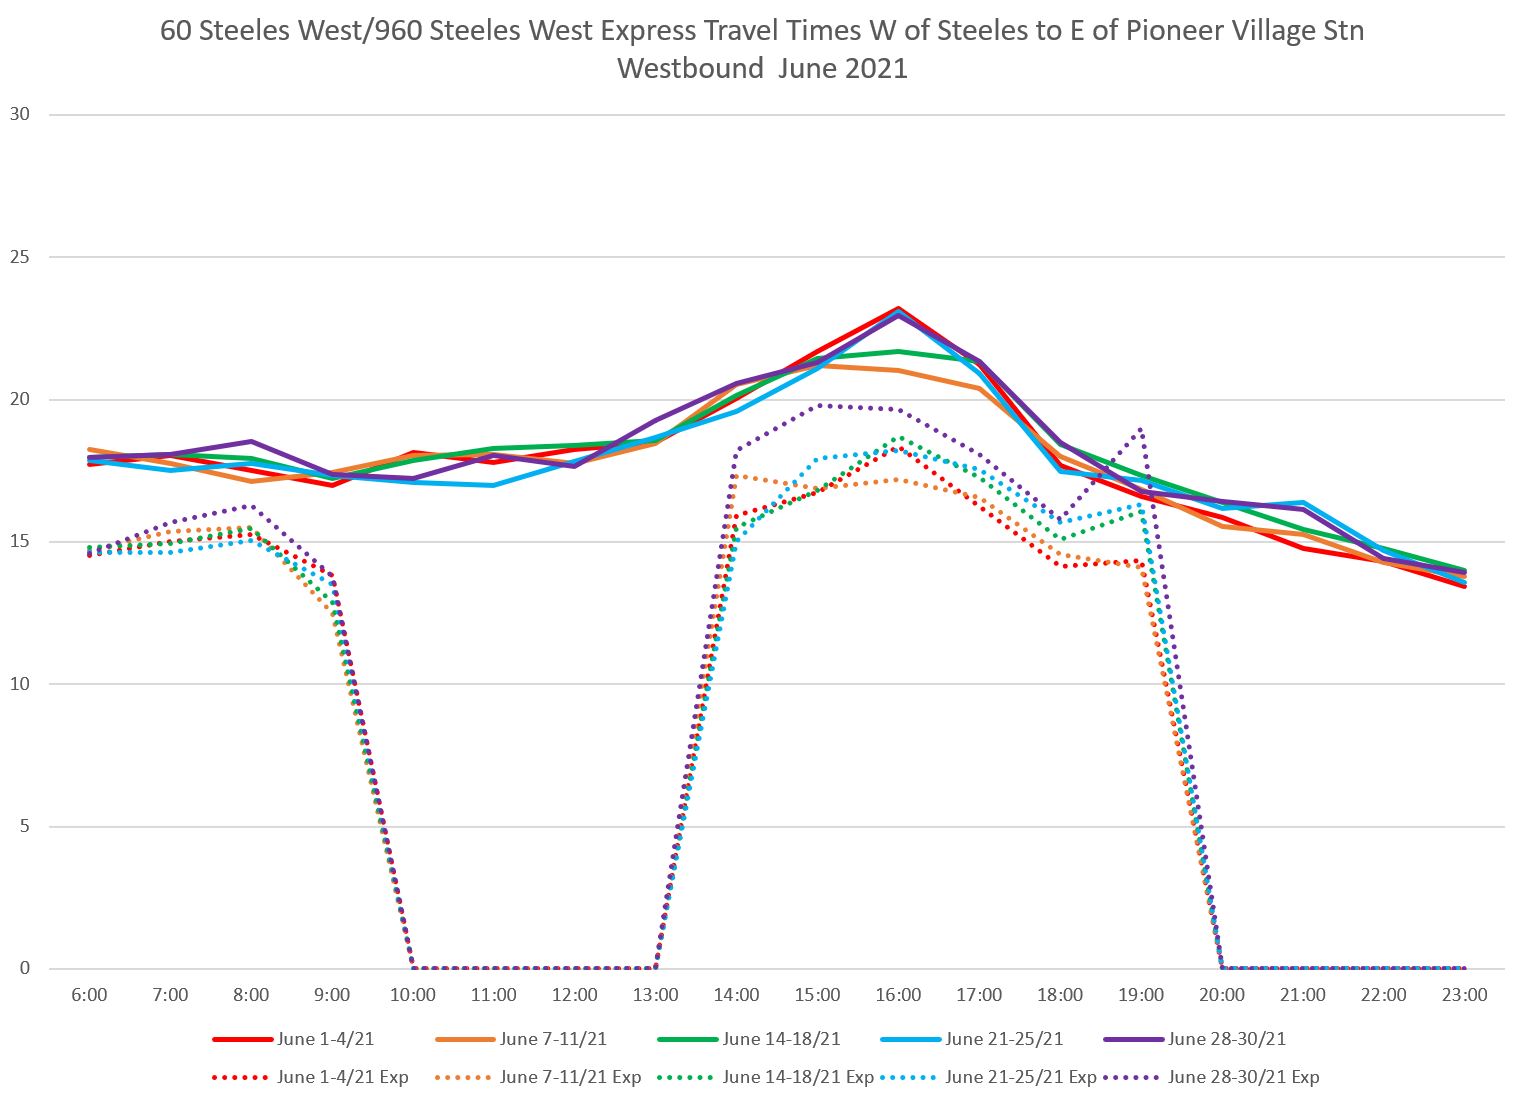
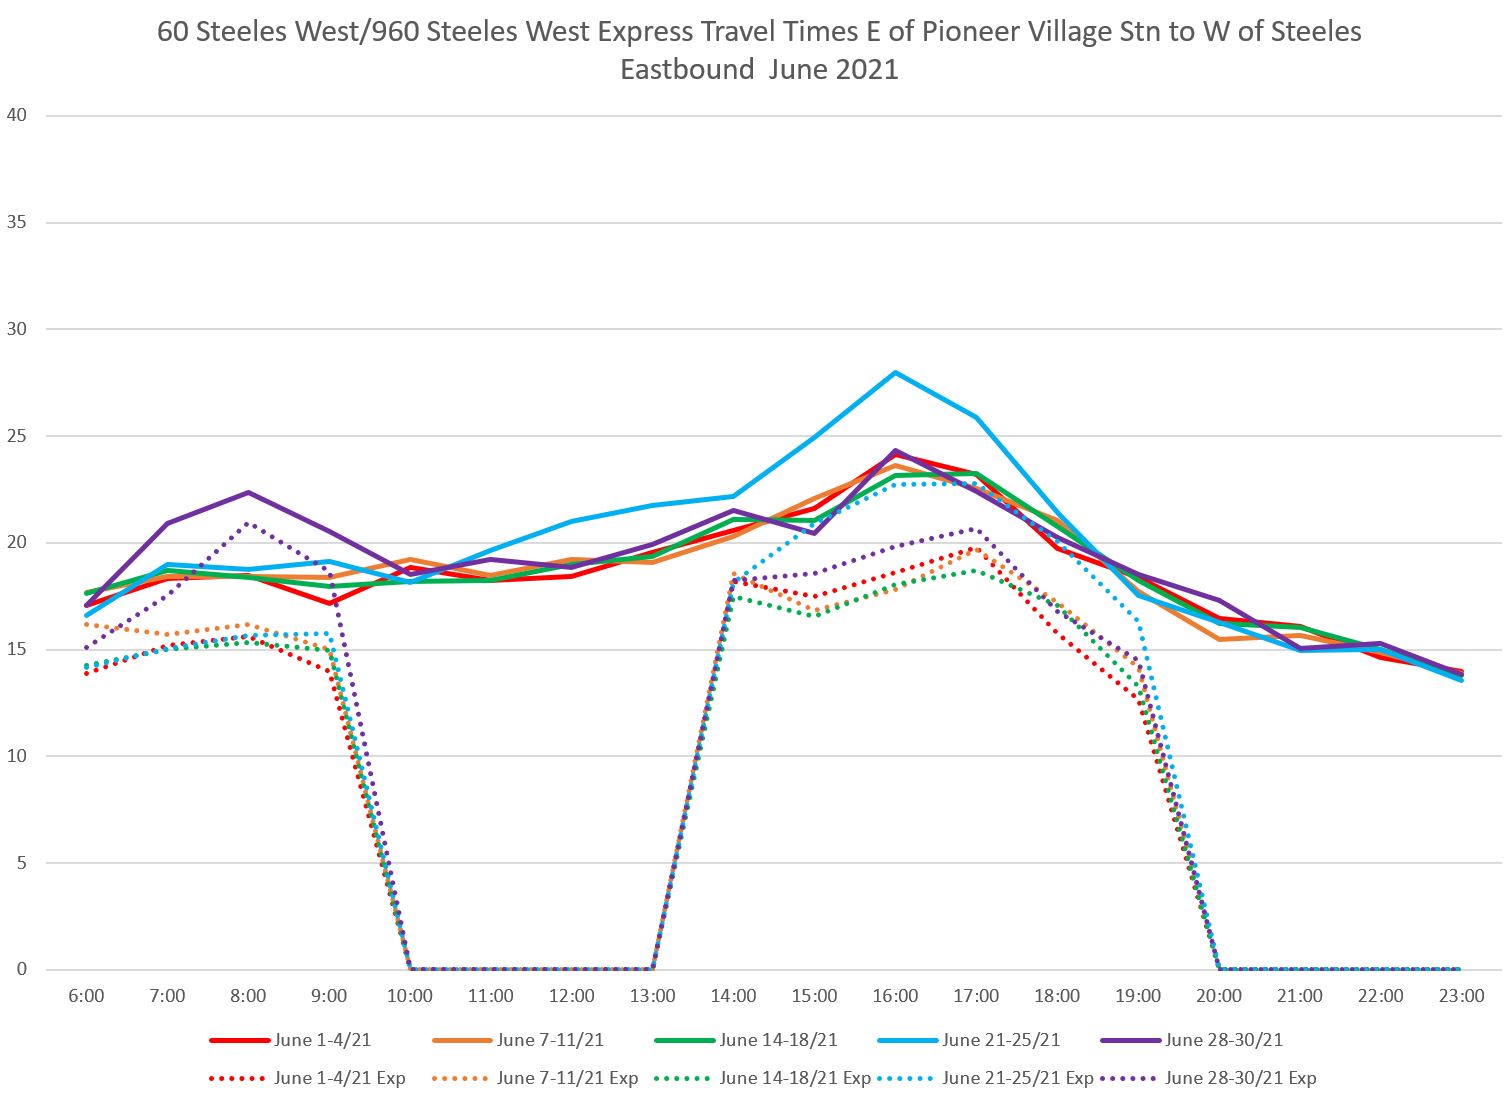
Evolution of Travel Times Between Yonge and Pioneer Village Station
Steeles West has two major differences with routes previously reviewed here:
- Travel time between Yonge and Pioneer Village Station has not just rebounded to pre-pandemic values, but as of June 2021 has overshot those values.
- Travel time between Pioneer Village Station and Martin Grove has also gone back up strongly, although this segment is not part of the RapidTO proposal because service here is considerably less than to the east.
Yonge to Pioneer Village Station
Weekdays
A note about the data: Values shown for April 2018 (blue, left side of each hourly group) predate the separation of express service as its own route, 960. These are a blend of local and express trips during weekday peak periods. However, the express trips were only one third or one fifth, respectively, of all service in the AM and PM peaks and the travel times shown are dominated by local service.
Values for November 2019 (orange) and beyond show express values separately.
Although part of the change in 2019 comes from counting only local trips, the higher 2019 values persist through the day and on weekends when there is no express service.
Pre-pandemic travel times westbound were generally higher in 2019 than they are today, although they fell substantially in 2020 (June, shown below in red) thanks to the overall drop in traffic levels. Travel times have built up gradually since then with a small dip at midwinter.
This segment has a stronger PM than AM peak, especially eastbound.
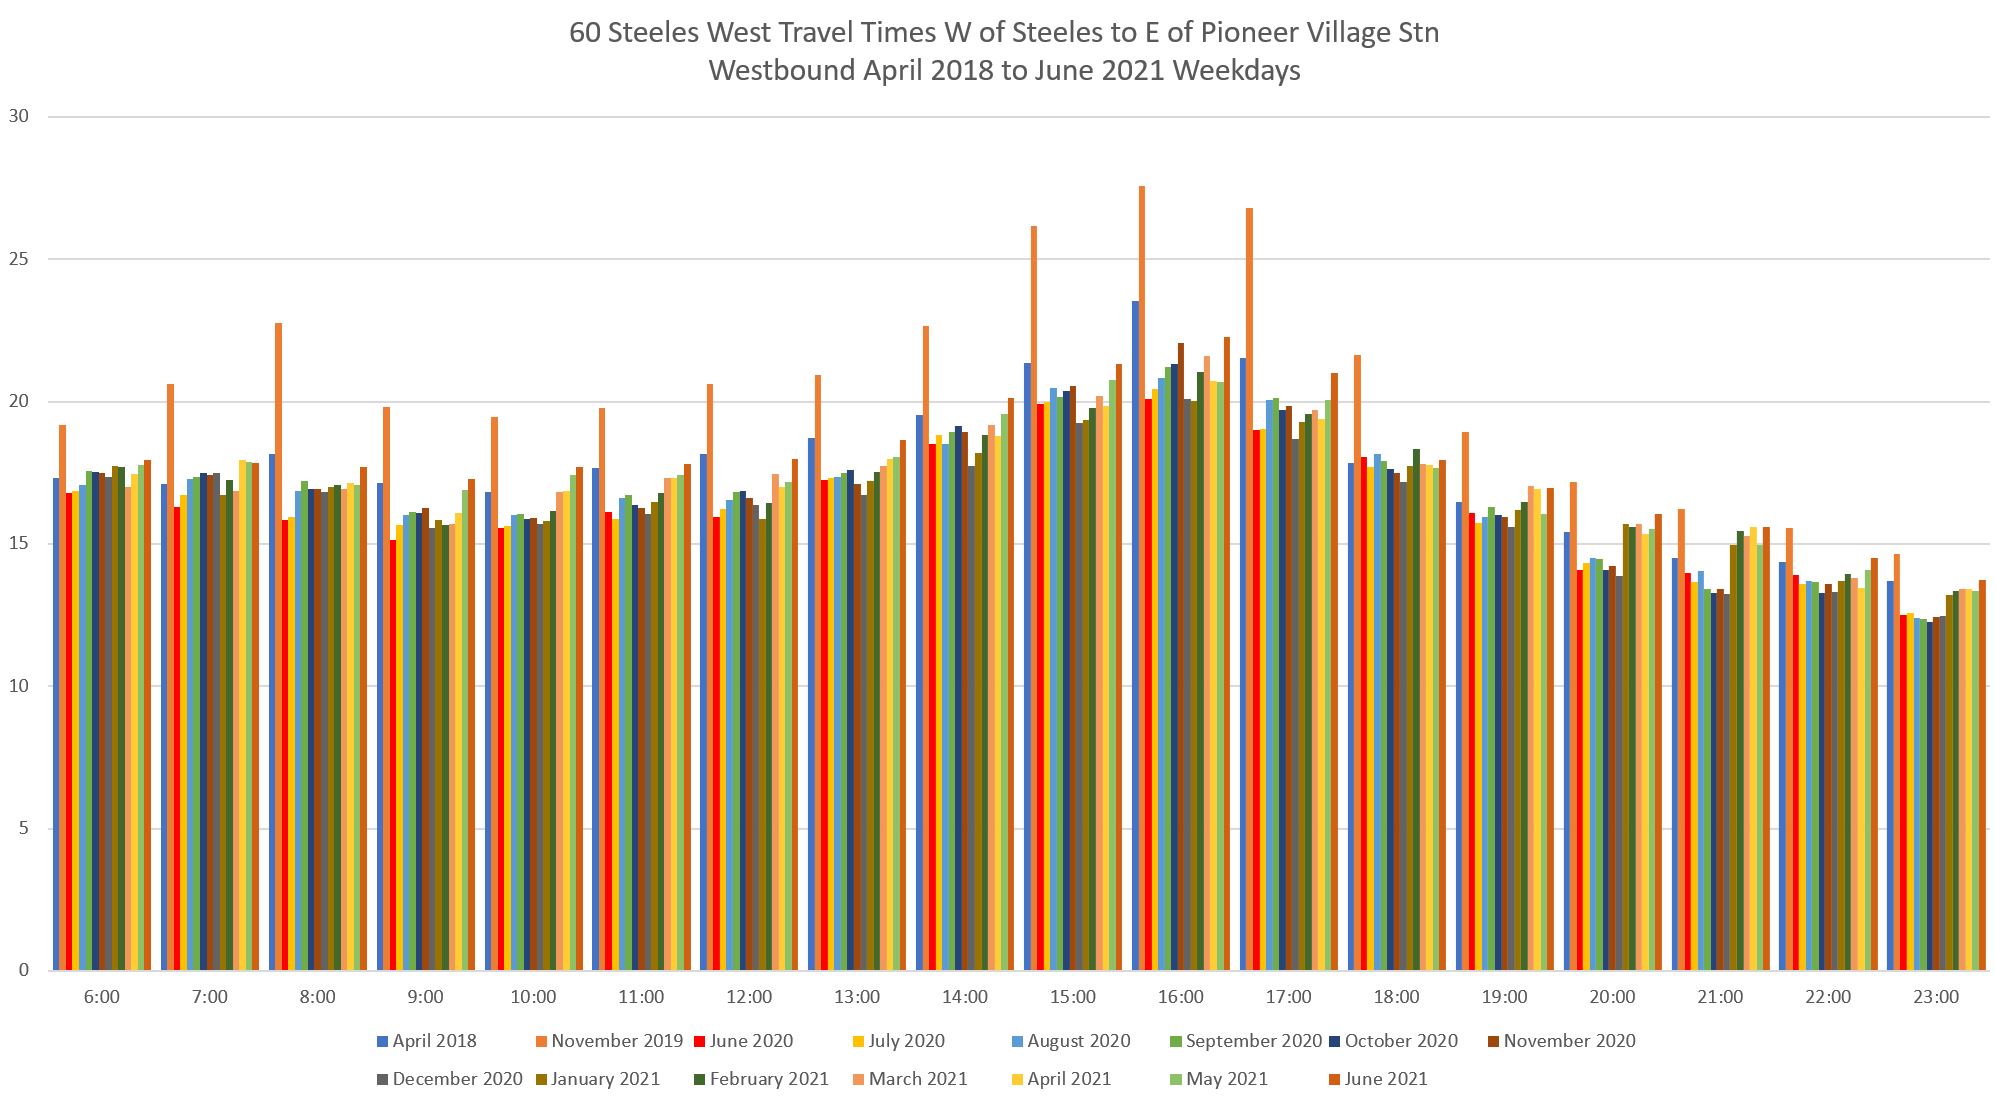
The 960 express buses operated in November 2019 (green) and their travel times toady are still below pre-pandemic values. They are faster than the local buses over the same segment, but like the locals have seen small, gradual increases in travel times in recent months.
Weekends
The month-to-month pattern on weekends is similar, but at a lower scale than on weekdays. There is a long, low arc from morning to evening on both Saturdays and Sundays with no strong peak.
Week-by-week Data
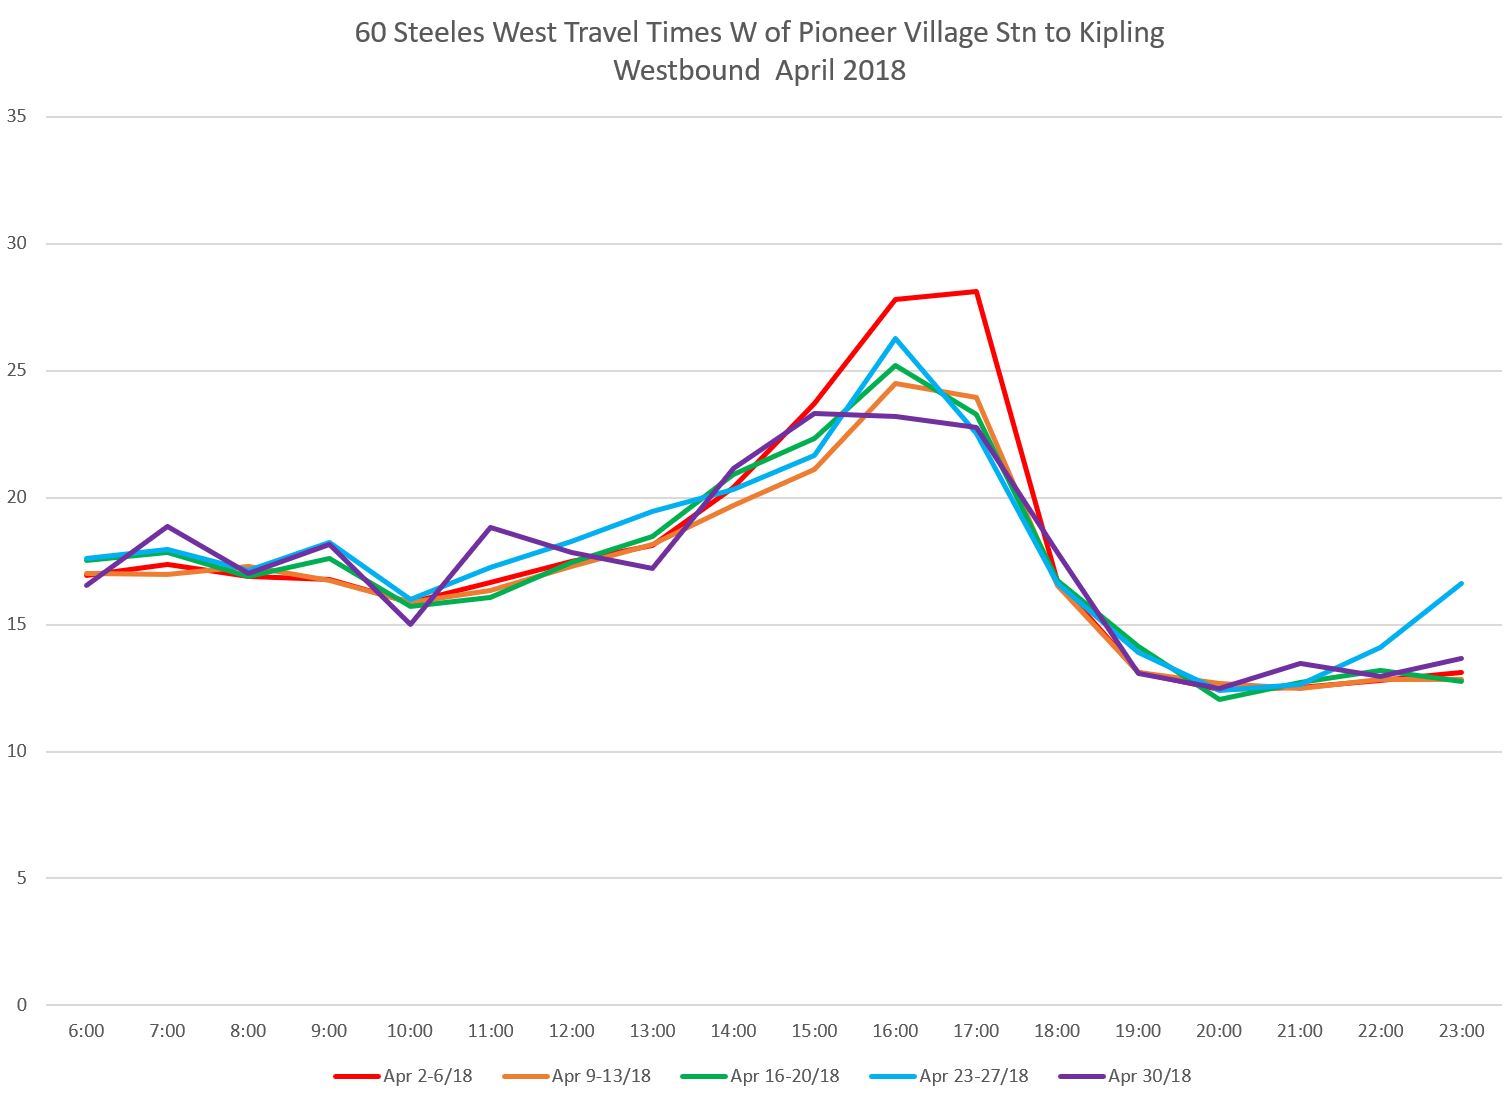
Breaking the data down to a weekly level shows more detail. In April 2018, travel times built up notably in the PM peak as the month went on. (I do not have May 2018 data to confirm whether this was a permanent or transient change.) Again note that the peak travel times here are a blend of local and express trips as discussed above.
By November 2019, the peaks were much more strongly defined.
In June 2020, the effect of reduced traffic is obvious in the disappearance of an AM peak and some flattening of the PM peak.
By June 2021, the peaks were more established, although not yet at 2019 levels. A question for any red lane proposal will be the degree to which these peaks can be flattened again to something more like the 2020 values or better.
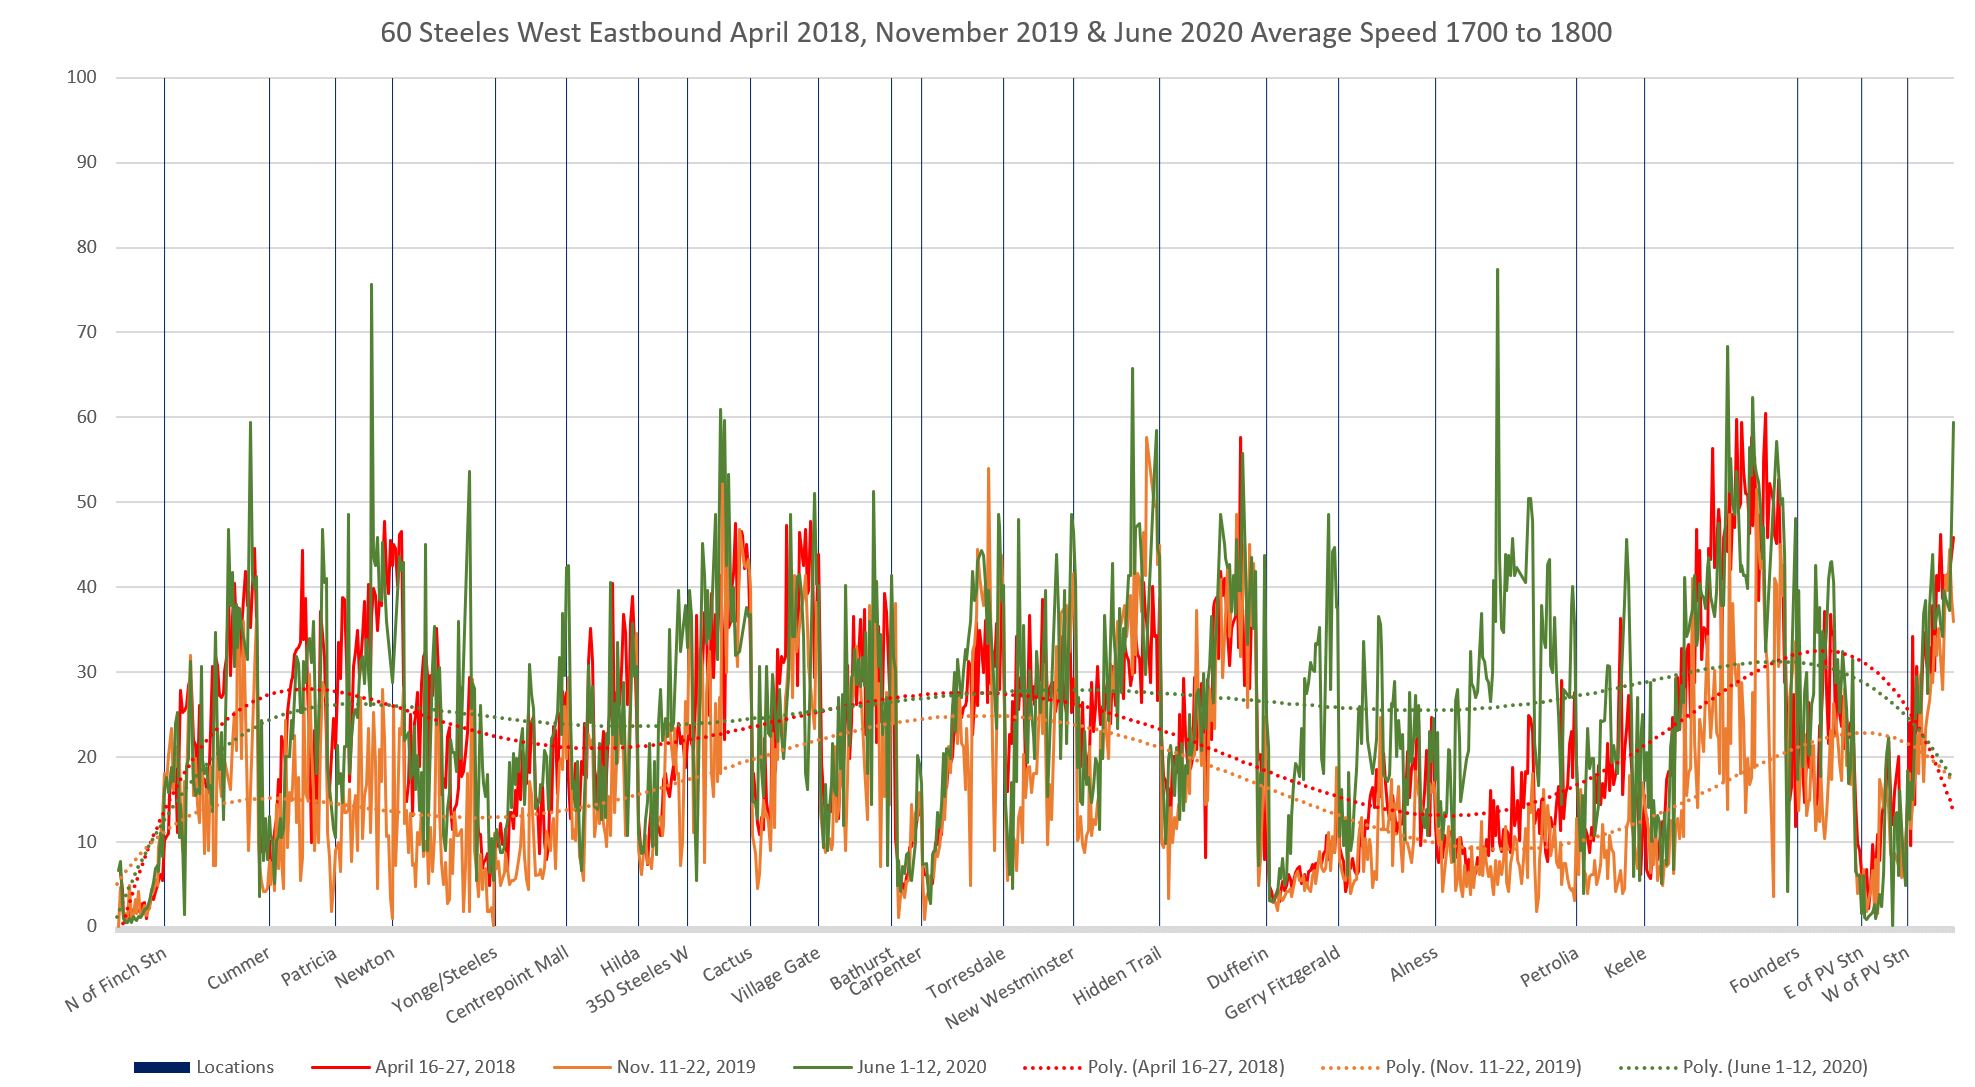
Comparing Prepandemic, Local and Express Speed Profiles (East of Pioneer Village Station)
In this section, there are two sets of charts to break apart the comparative data.
April 2018 to June 2020 comparisons:
- April 2018 (red)
- November 2019 (orange)
- June 2020 (green)
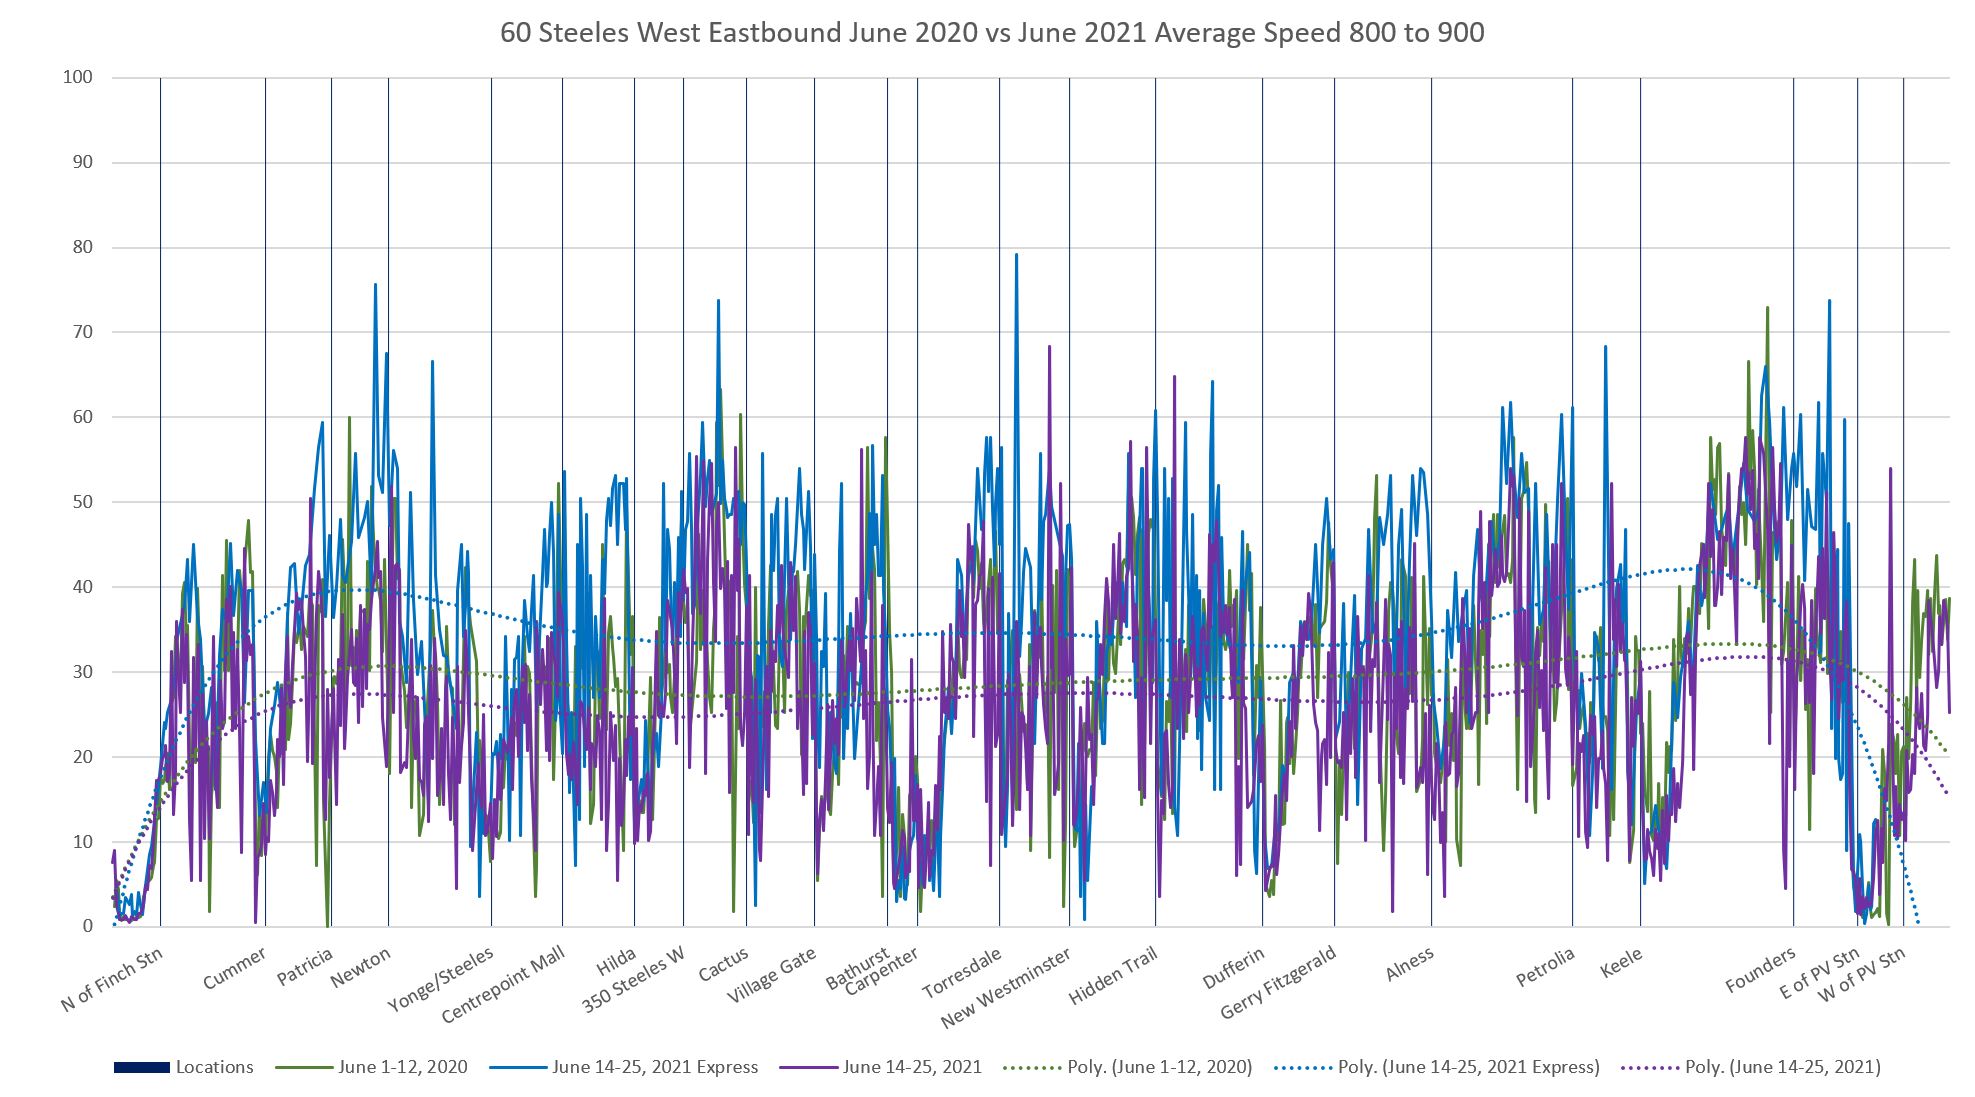
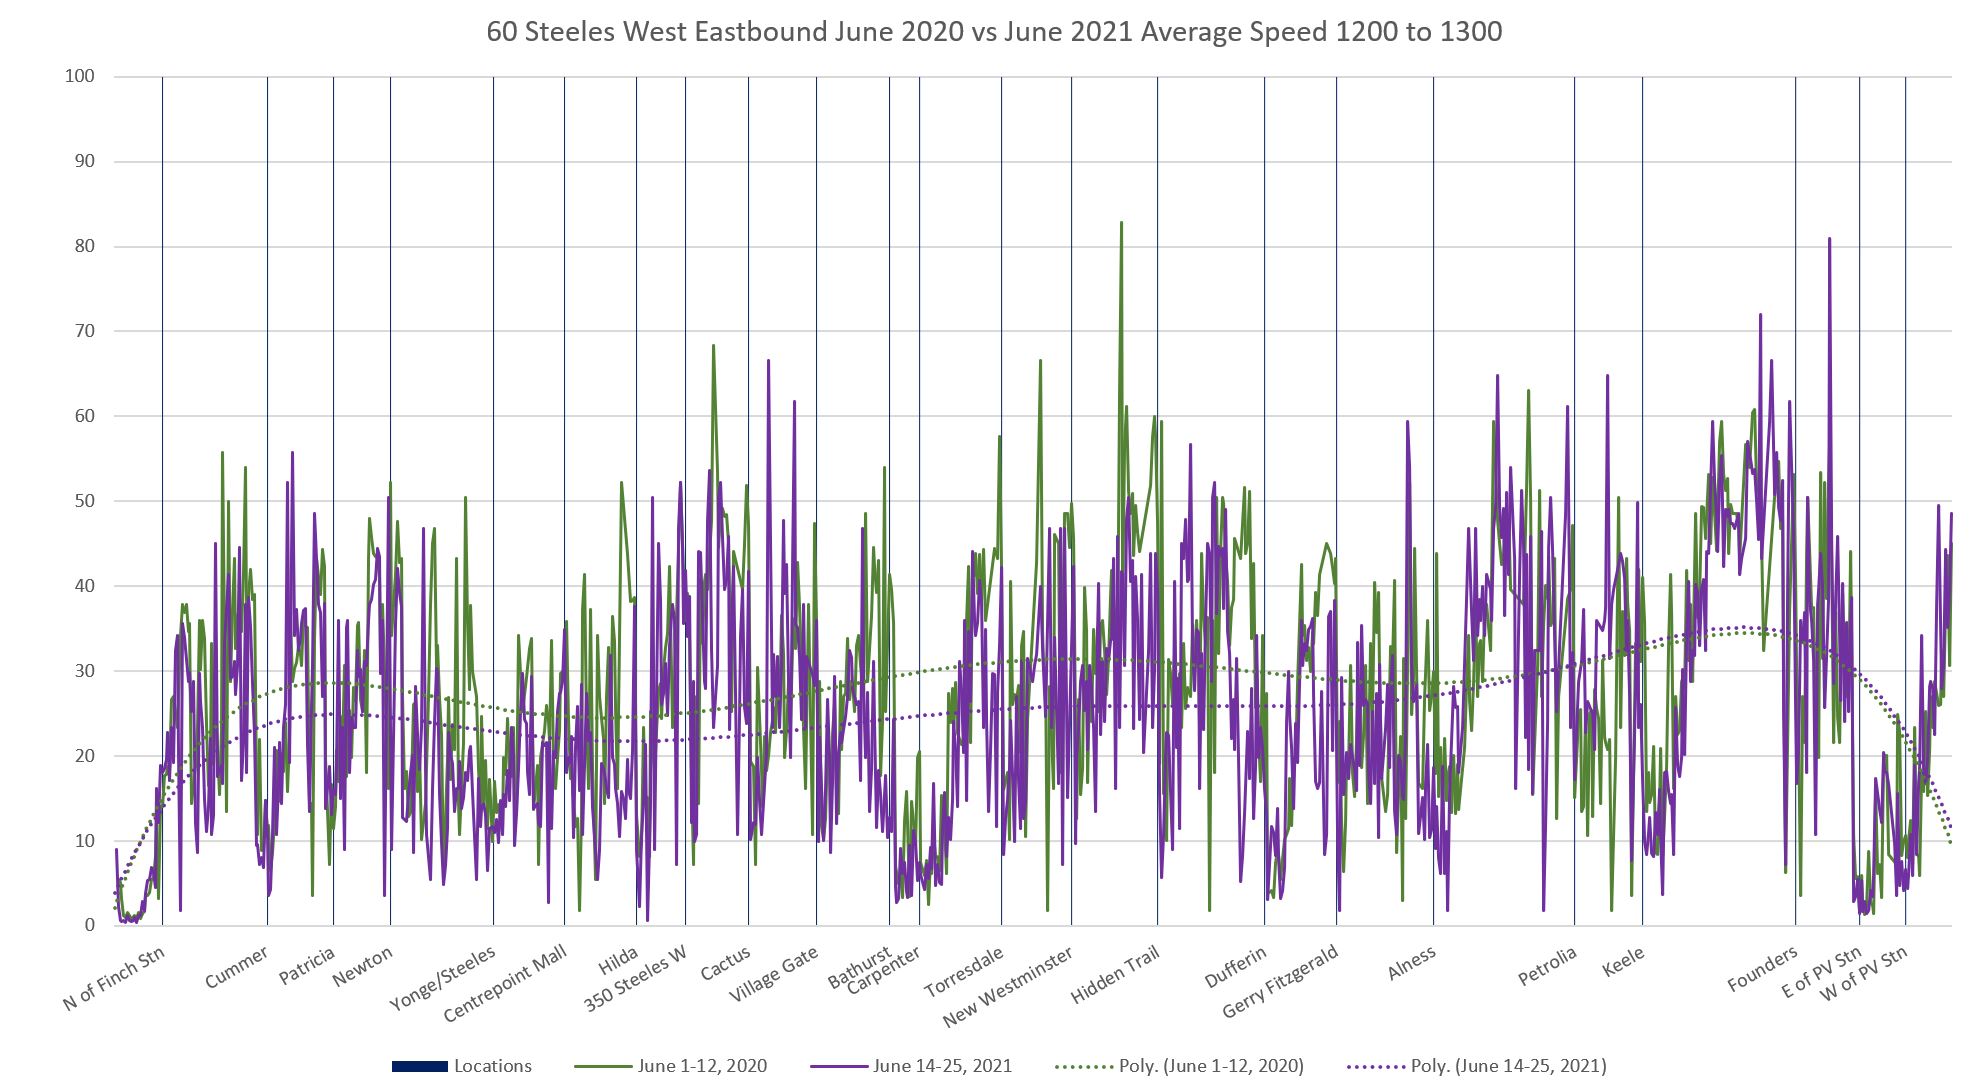
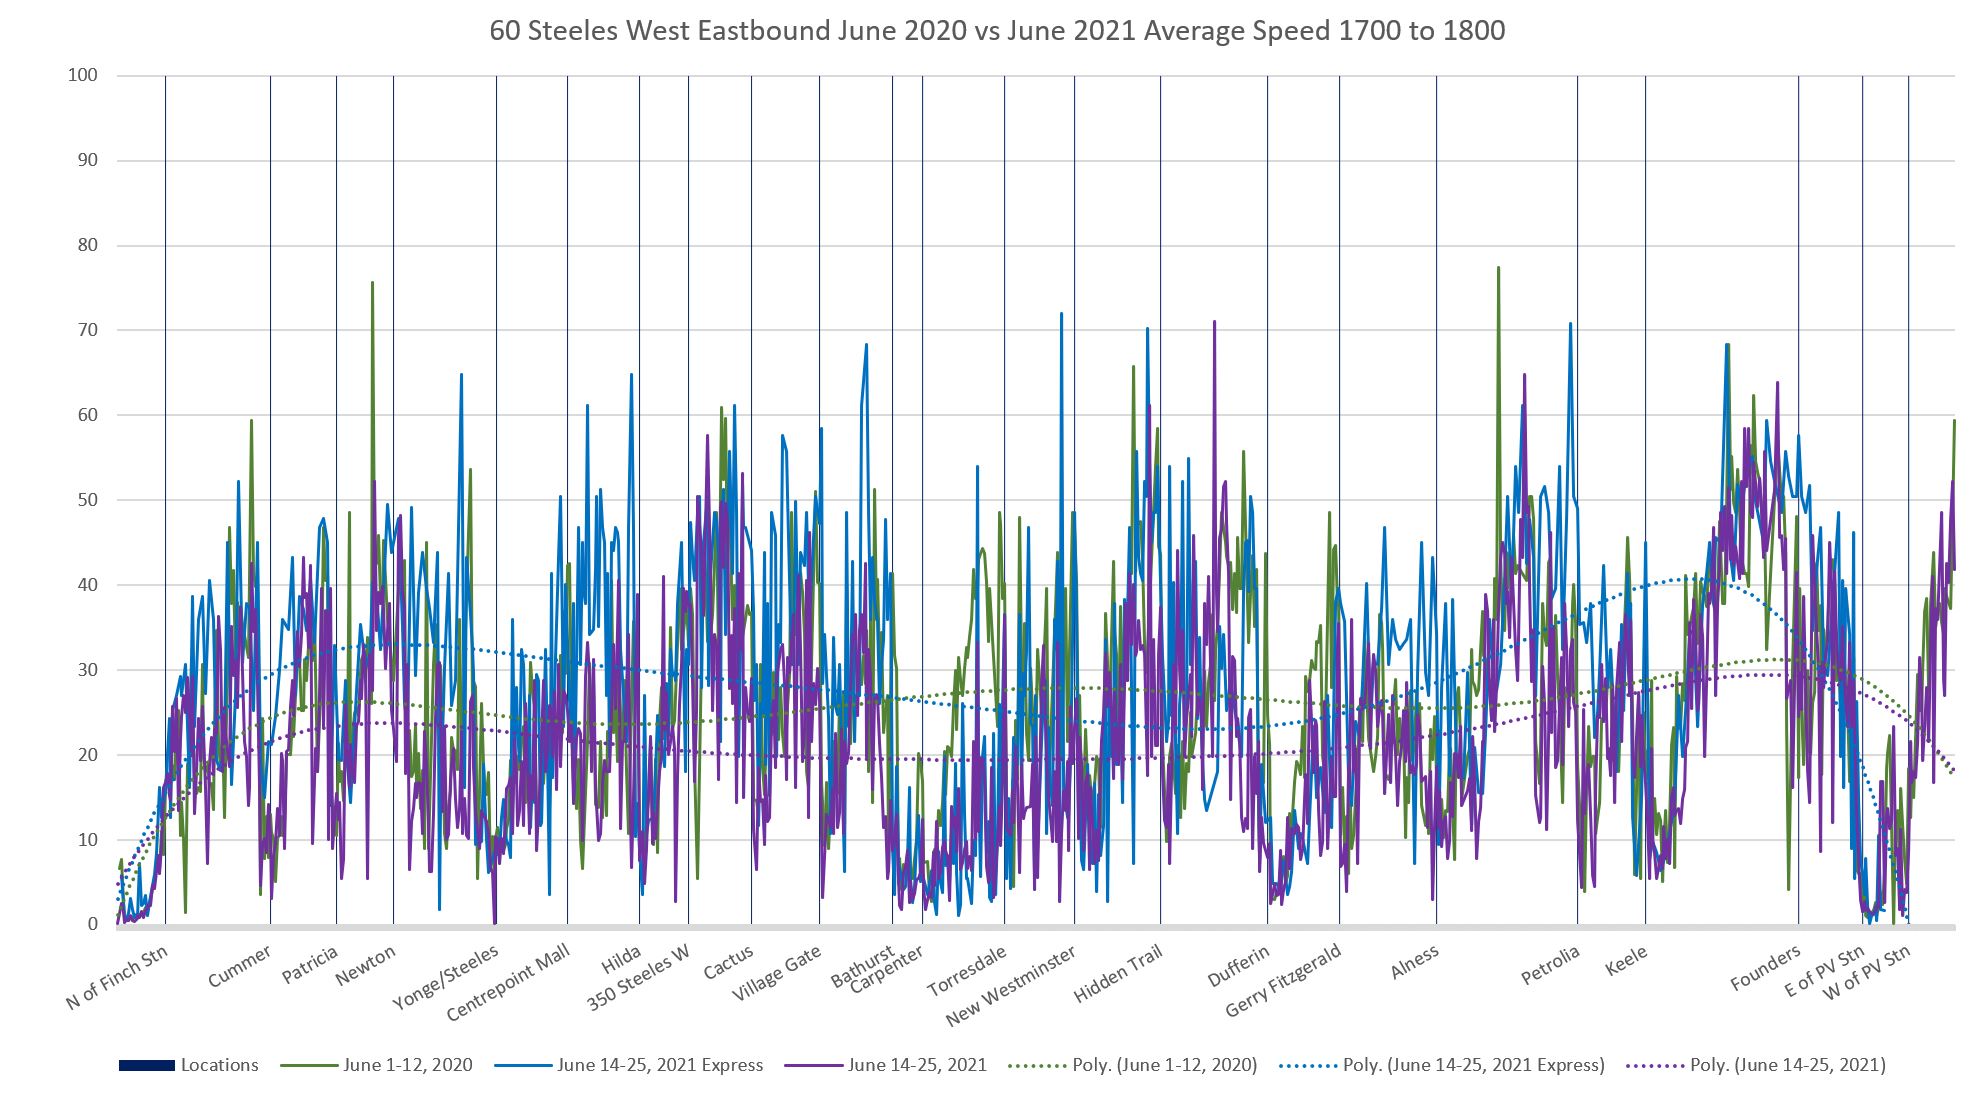
June 2020 and June 2021 comparisons:
- June 2020 (green)
- June 2021 Local (purple)
- June 2021 Express (turquoise)
The dotted lines through the charts follow the overall shape of the data, but they are not moving averages.
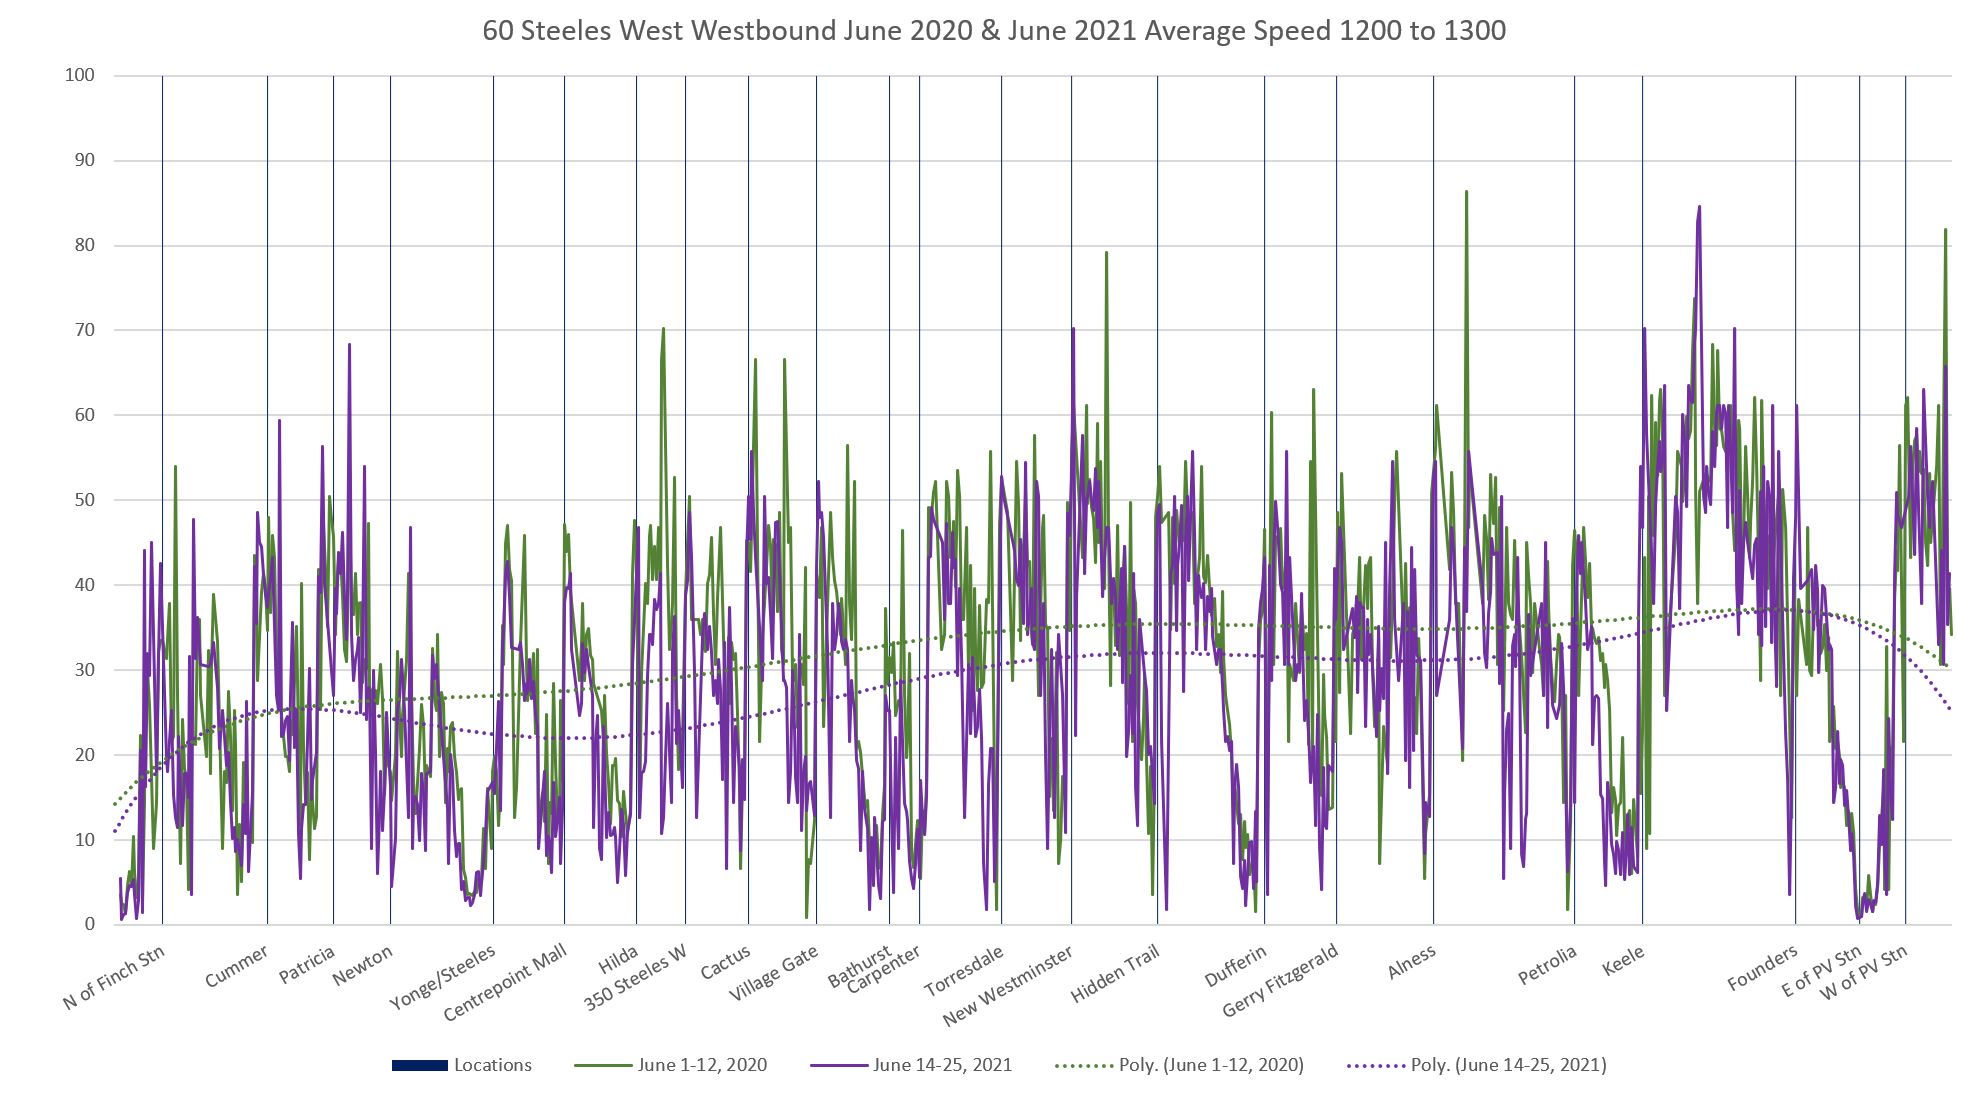
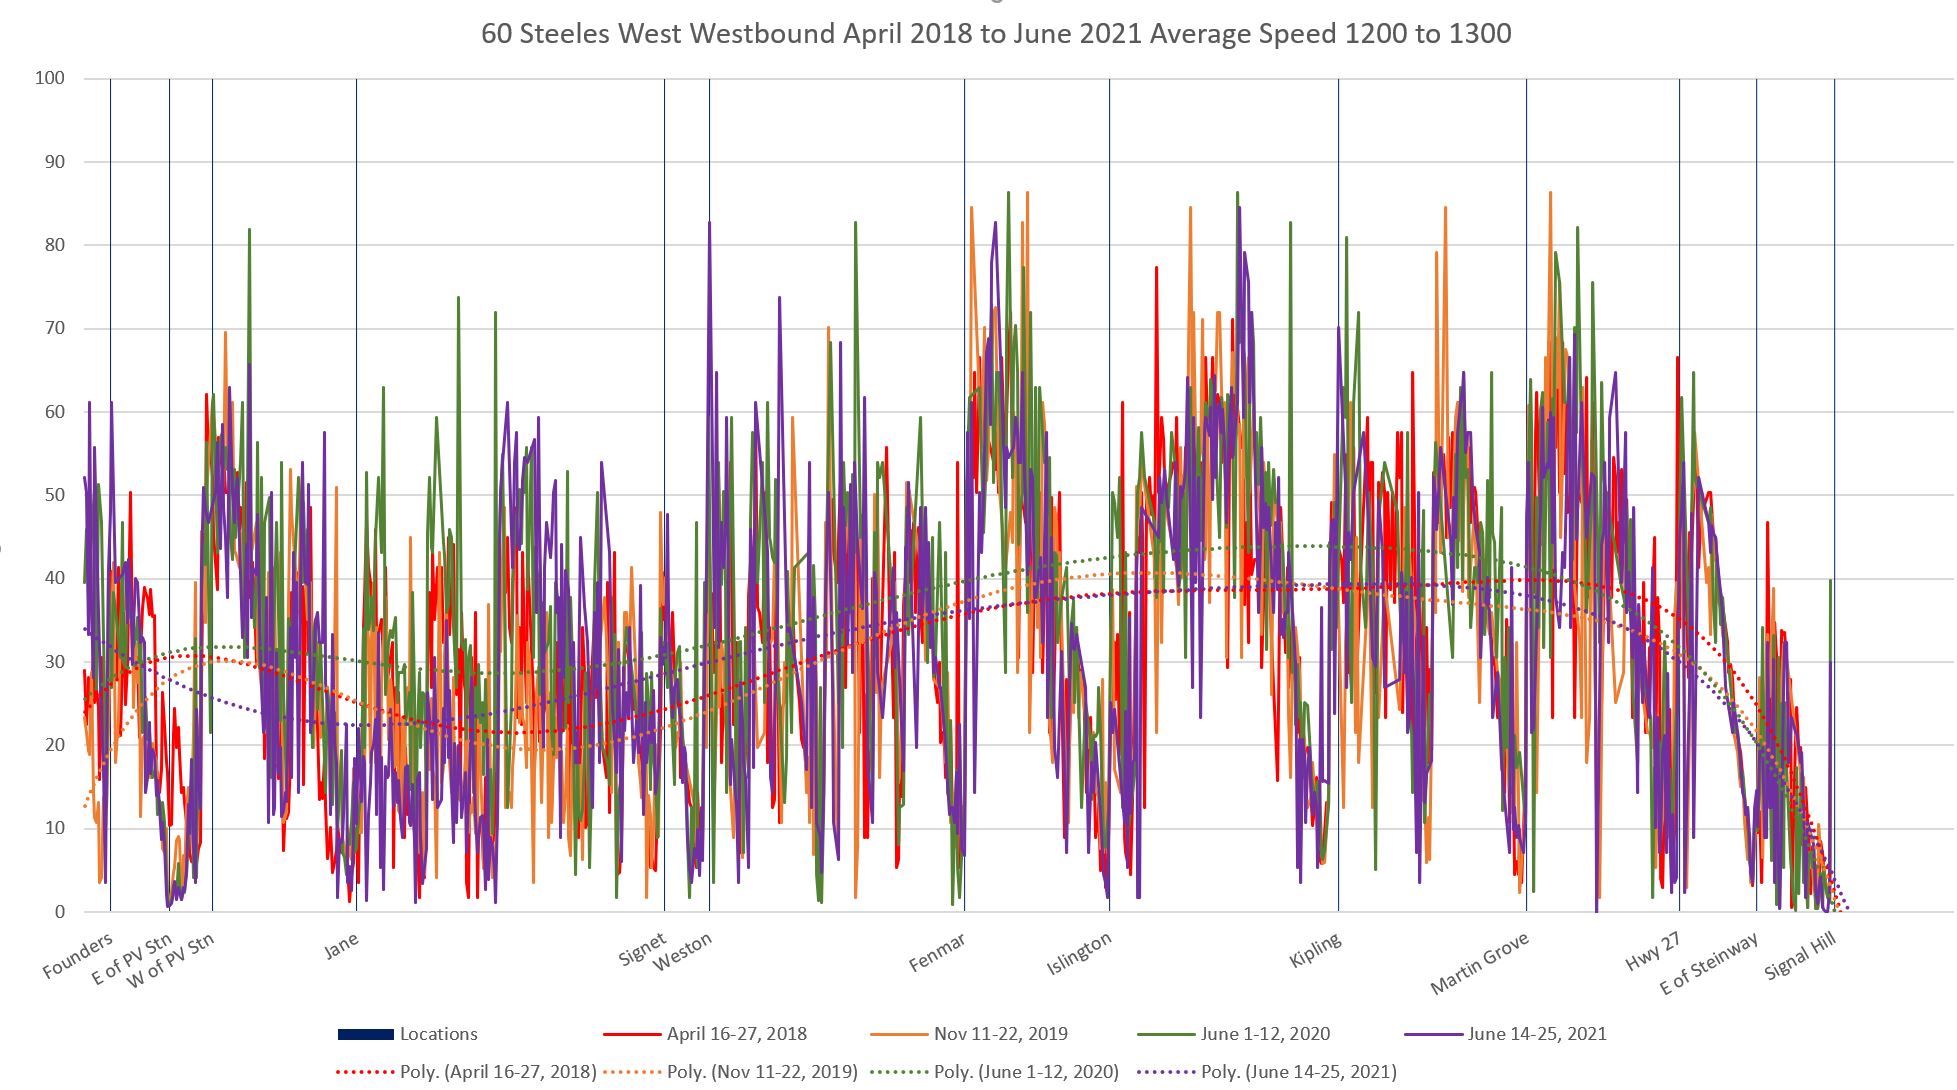
Westbound from Finch to Pioneer Village Station
Three areas of congestion stand out in November 2019 (orange) between Bathurst and Dufferin in the AM peak, between Dufferin and Keele at midday, and both on Yonge Street and in the Dufferin-Keele stretch in the PM peak. As with eastbound travel, the westbound speeds for June 2020 (green) are generally the fastest corresponding to the period of least traffic.
Yonge Street is unlikely to see any improvement in transit speed until surface operations are replaced by the planned subway extension and bus traffic is redirected to Steeles Station from Finch. Although this area has not returned completely to pre-pandemic traffic conditions, travel speeds are falling and this will be a problem location for the next decade.
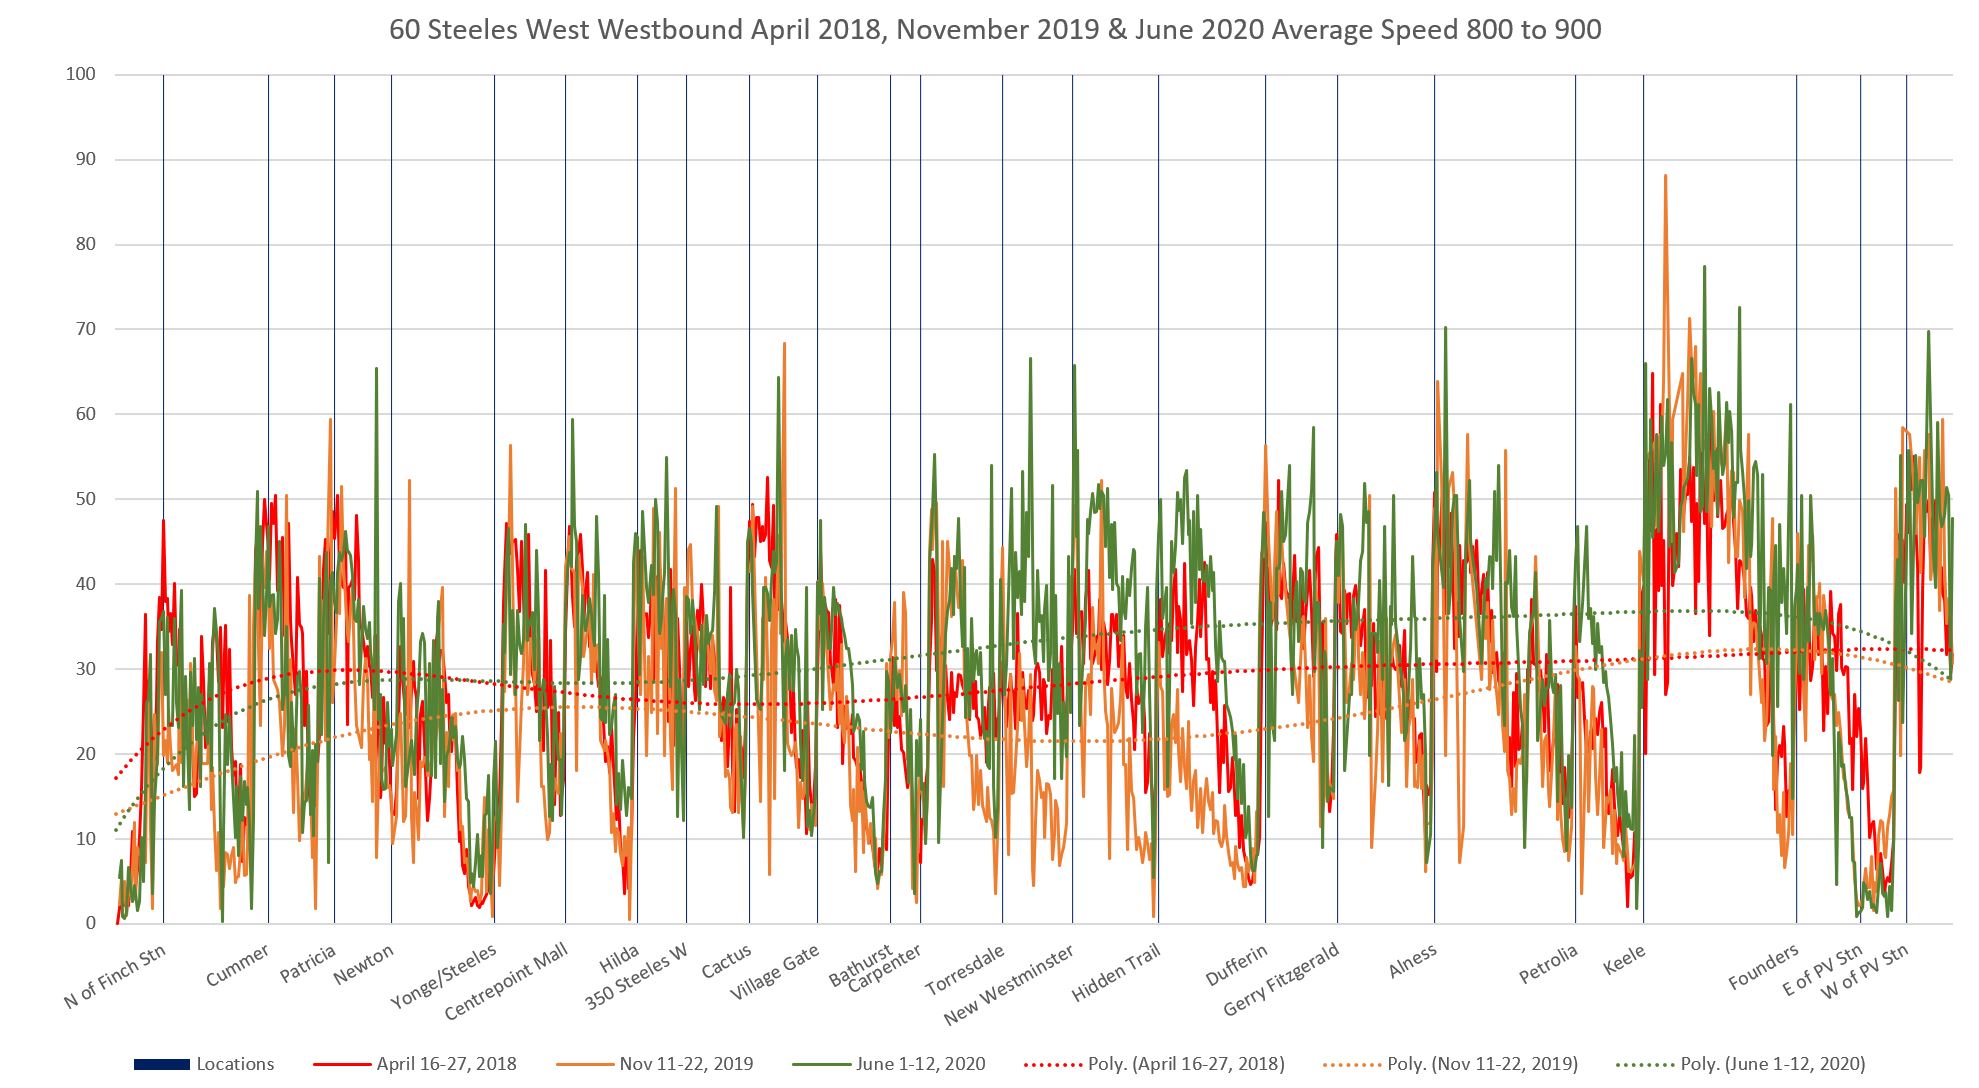
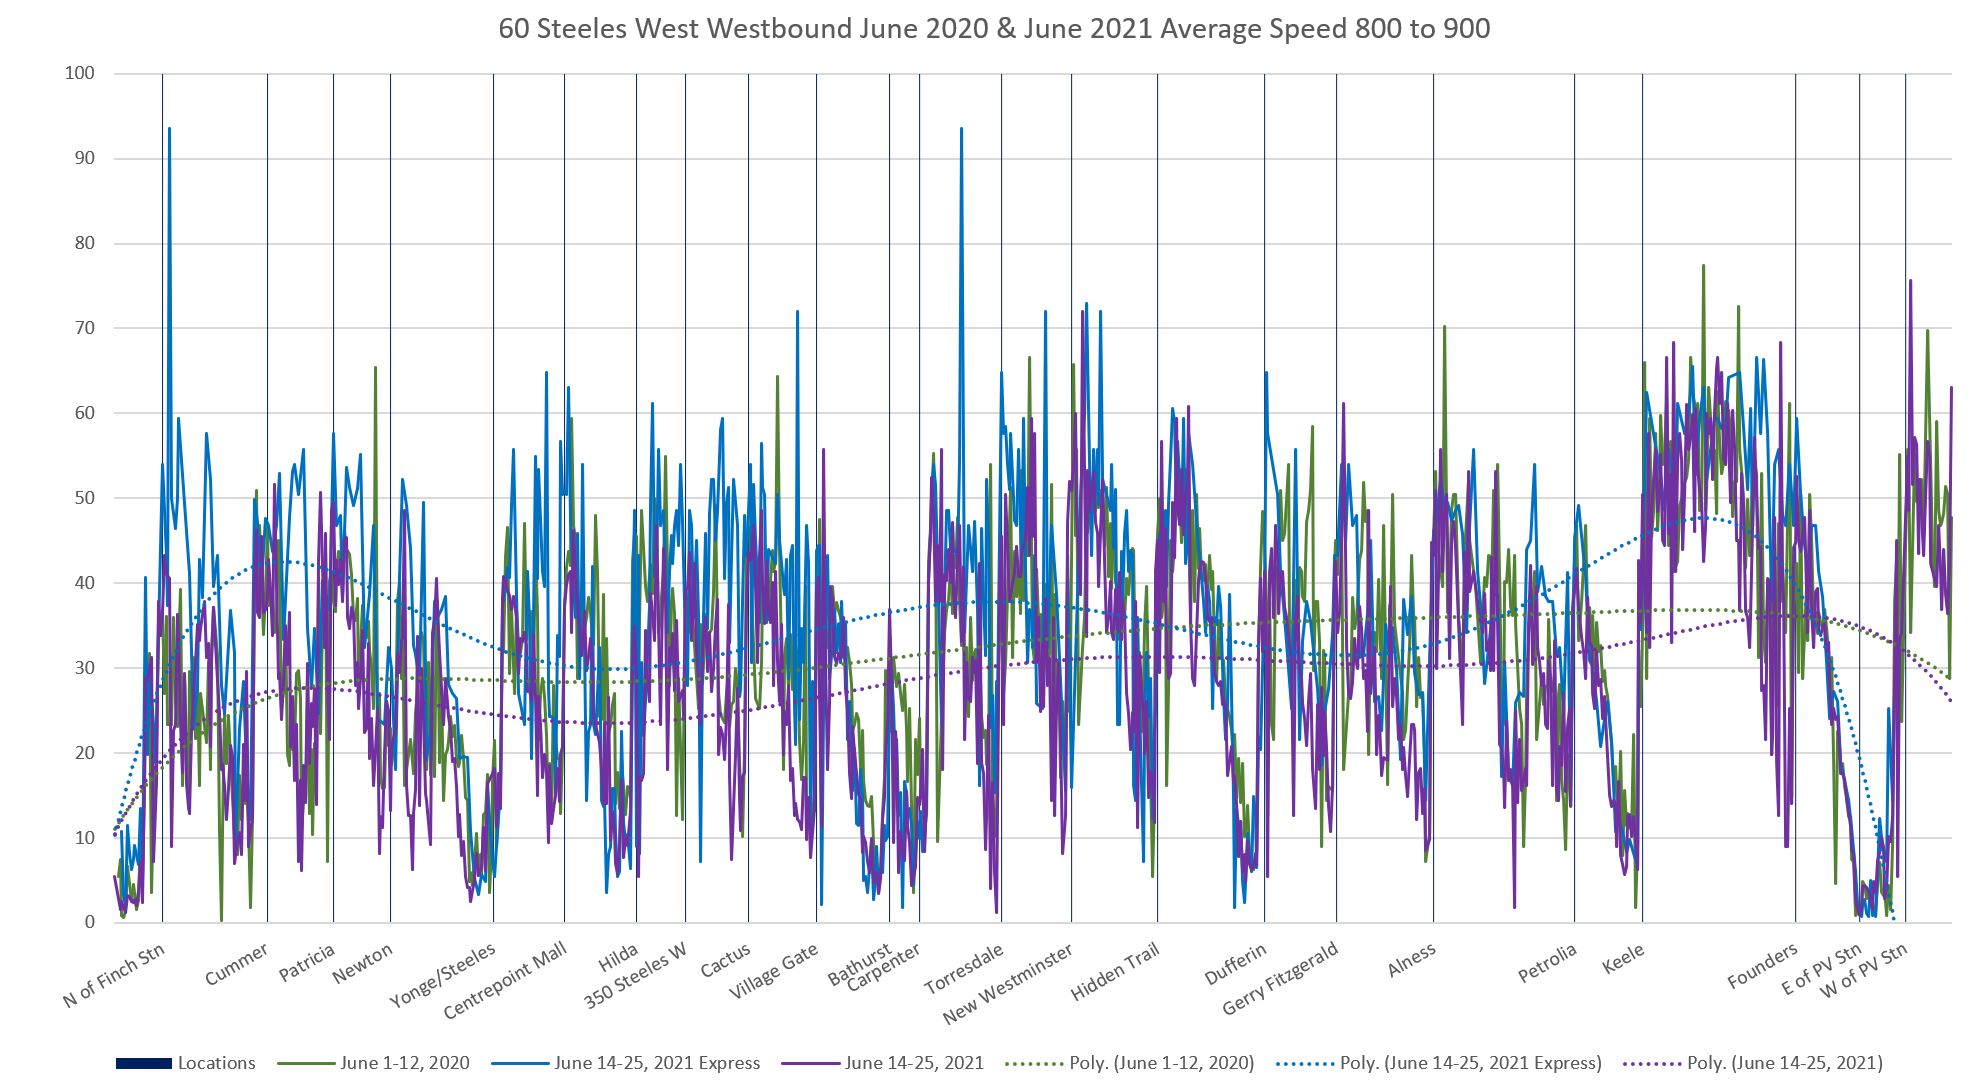
Comparing June 2020 with June 2021, the local speeds for June 2021 (purple) are generally below the level in June 2020 (green), but by varying amounts. The difference is not concentrated on any particular part of the route.
The express service (blue) shows faster speeds, but the benefit is concentrated on Yonge Street and on the area west of Keele.
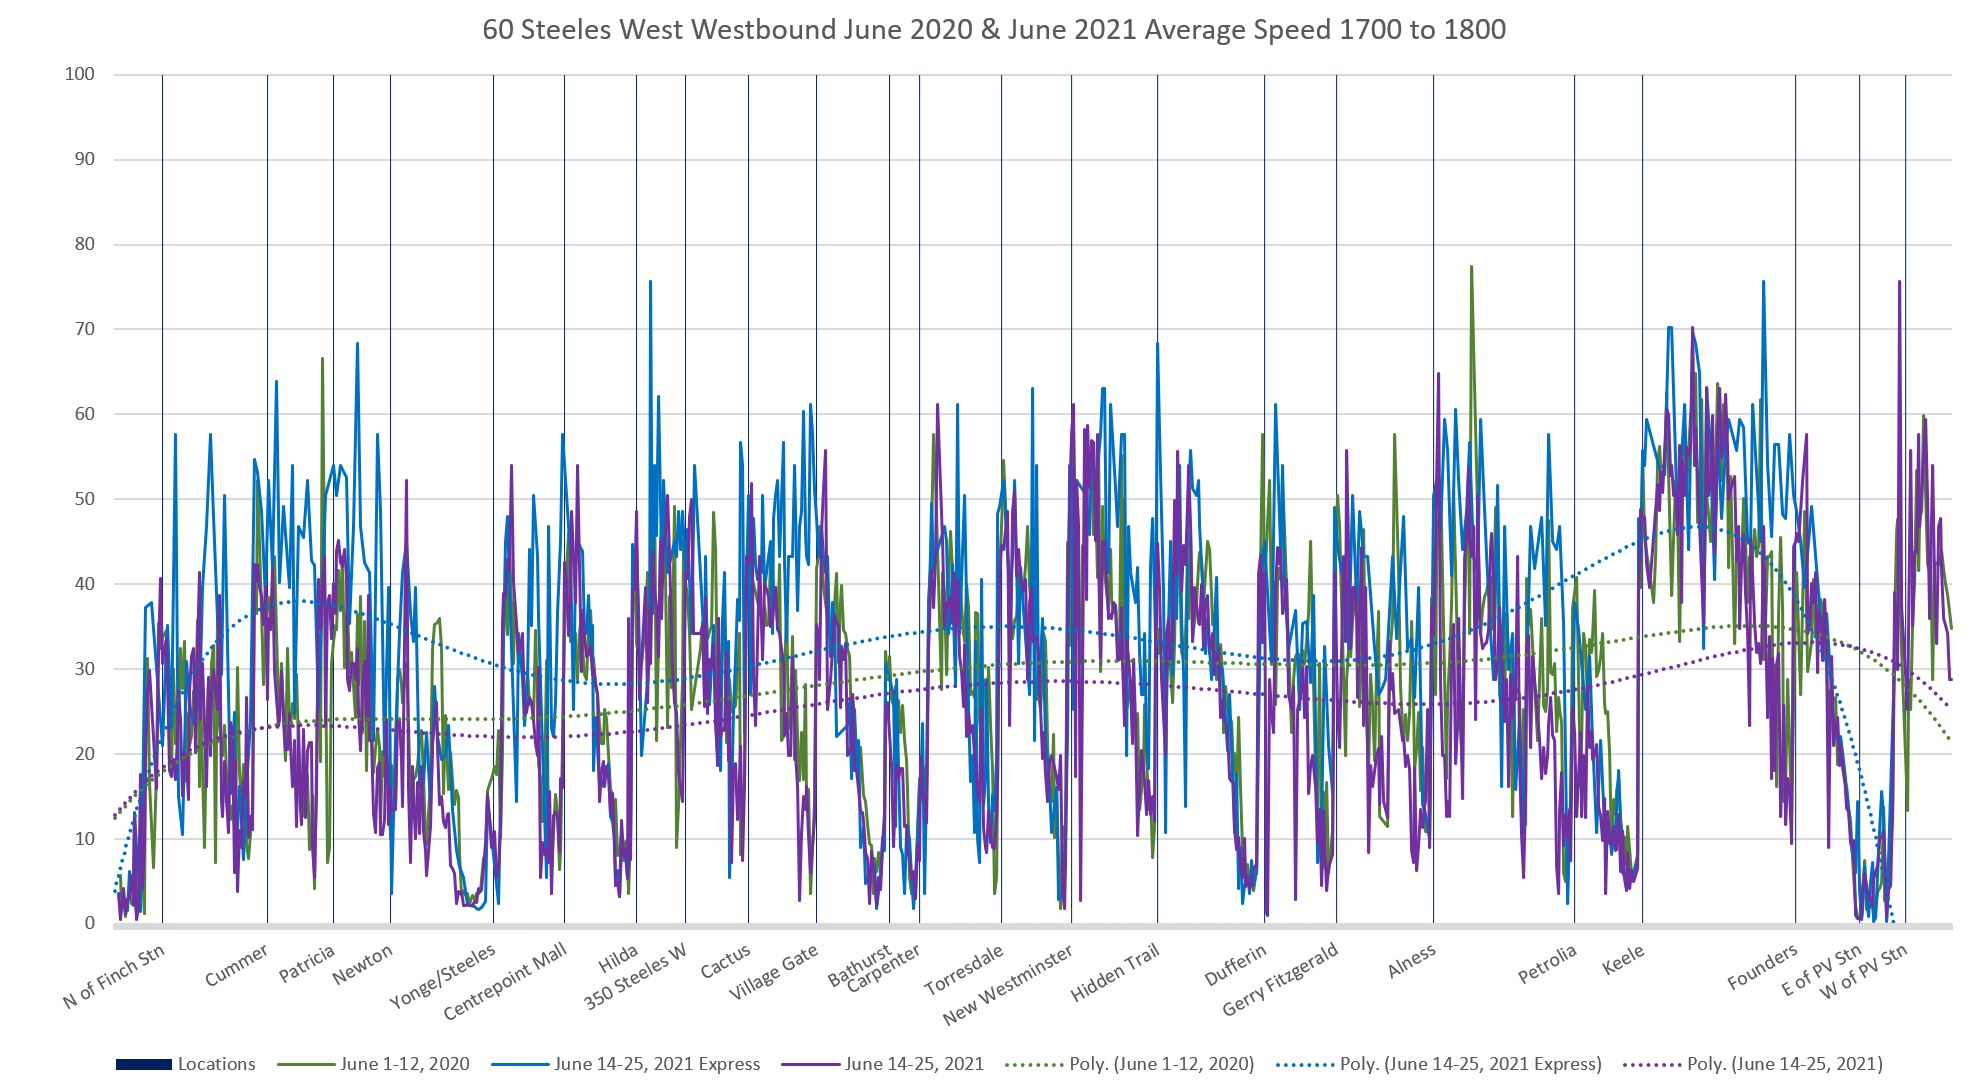
Eastbound from Pioneer Village Station to Finch Station
Note that eastbound charts should be read from right to left, the direction of travel.
In the hour between 8 and 9 am, the November 2019 data have the lowest overall value, especially for the section on Yonge south of Steeles where travel times are much more congested than in 2018.
Note that the 2018 data here includes express buses and therefore understates the average speed of only the local trips.
The June 2020 line (green) corresponds to “best case” conditions with light traffic.
At midday, the November 2019 speeds are below the other periods on Yonge and on the western part of the line but travel times are similar in the middle portion of the route from Dufferin to Bathurst.
In the peak from 5 to 6 pm, the November 2019 speeds are particularly low except in the middle of the route. On the west end between Keele and Dufferin, even the April 2018 speeds show the effect of congestion with only the June 2020 speeds running well above the other months.
Comparing June 2021 with a year earlier, the local service is slightly slower in the AM peak while the express service is understandably faster because it has fewer stops. The express is faster than the local over the entire route.
At midday, there is only the local service, and it is slightly slower in June 2021 than a year earlier.
In the PM peak, the express is faster than the local, although the difference is smaller approaching major arterials where both services stop and the ability to skip ahead is reduced. The June 2020 speeds have the strongest advantage only in the central part of the route.
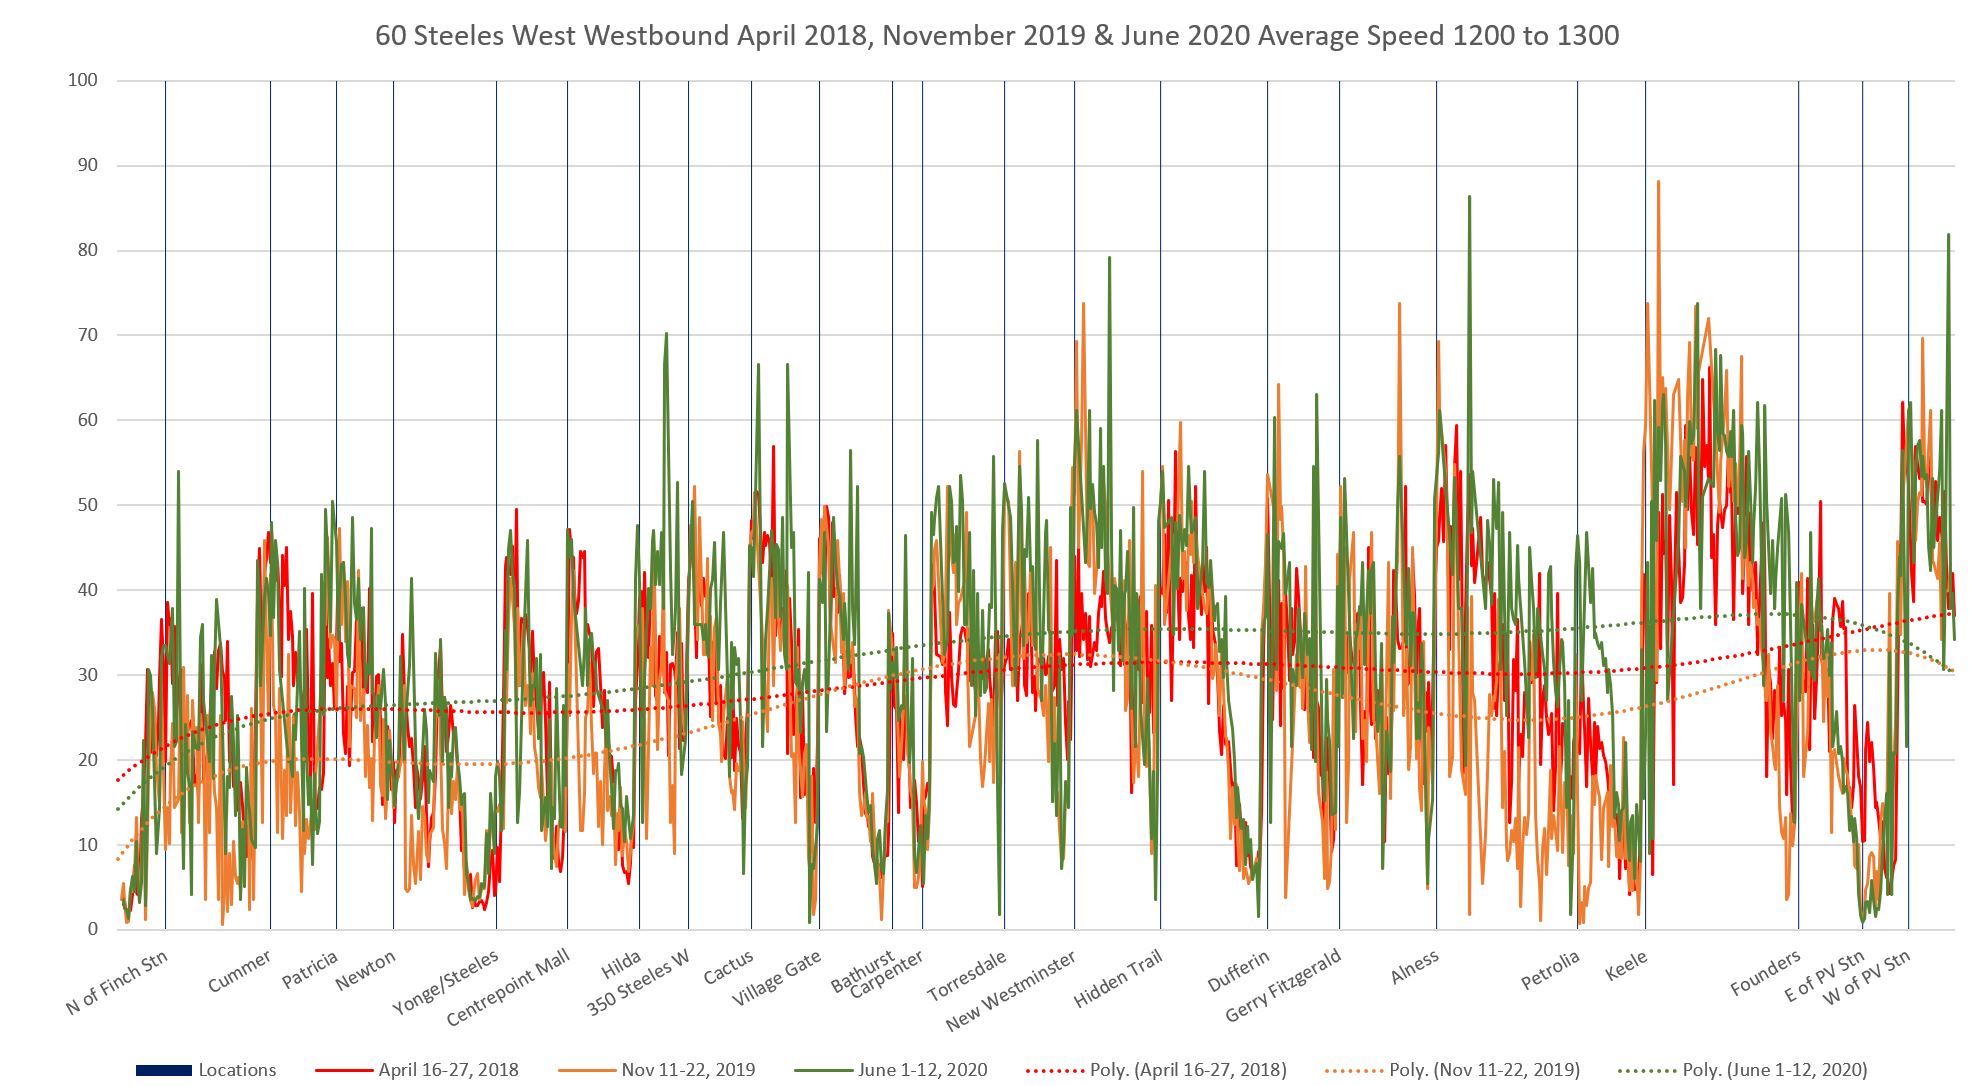
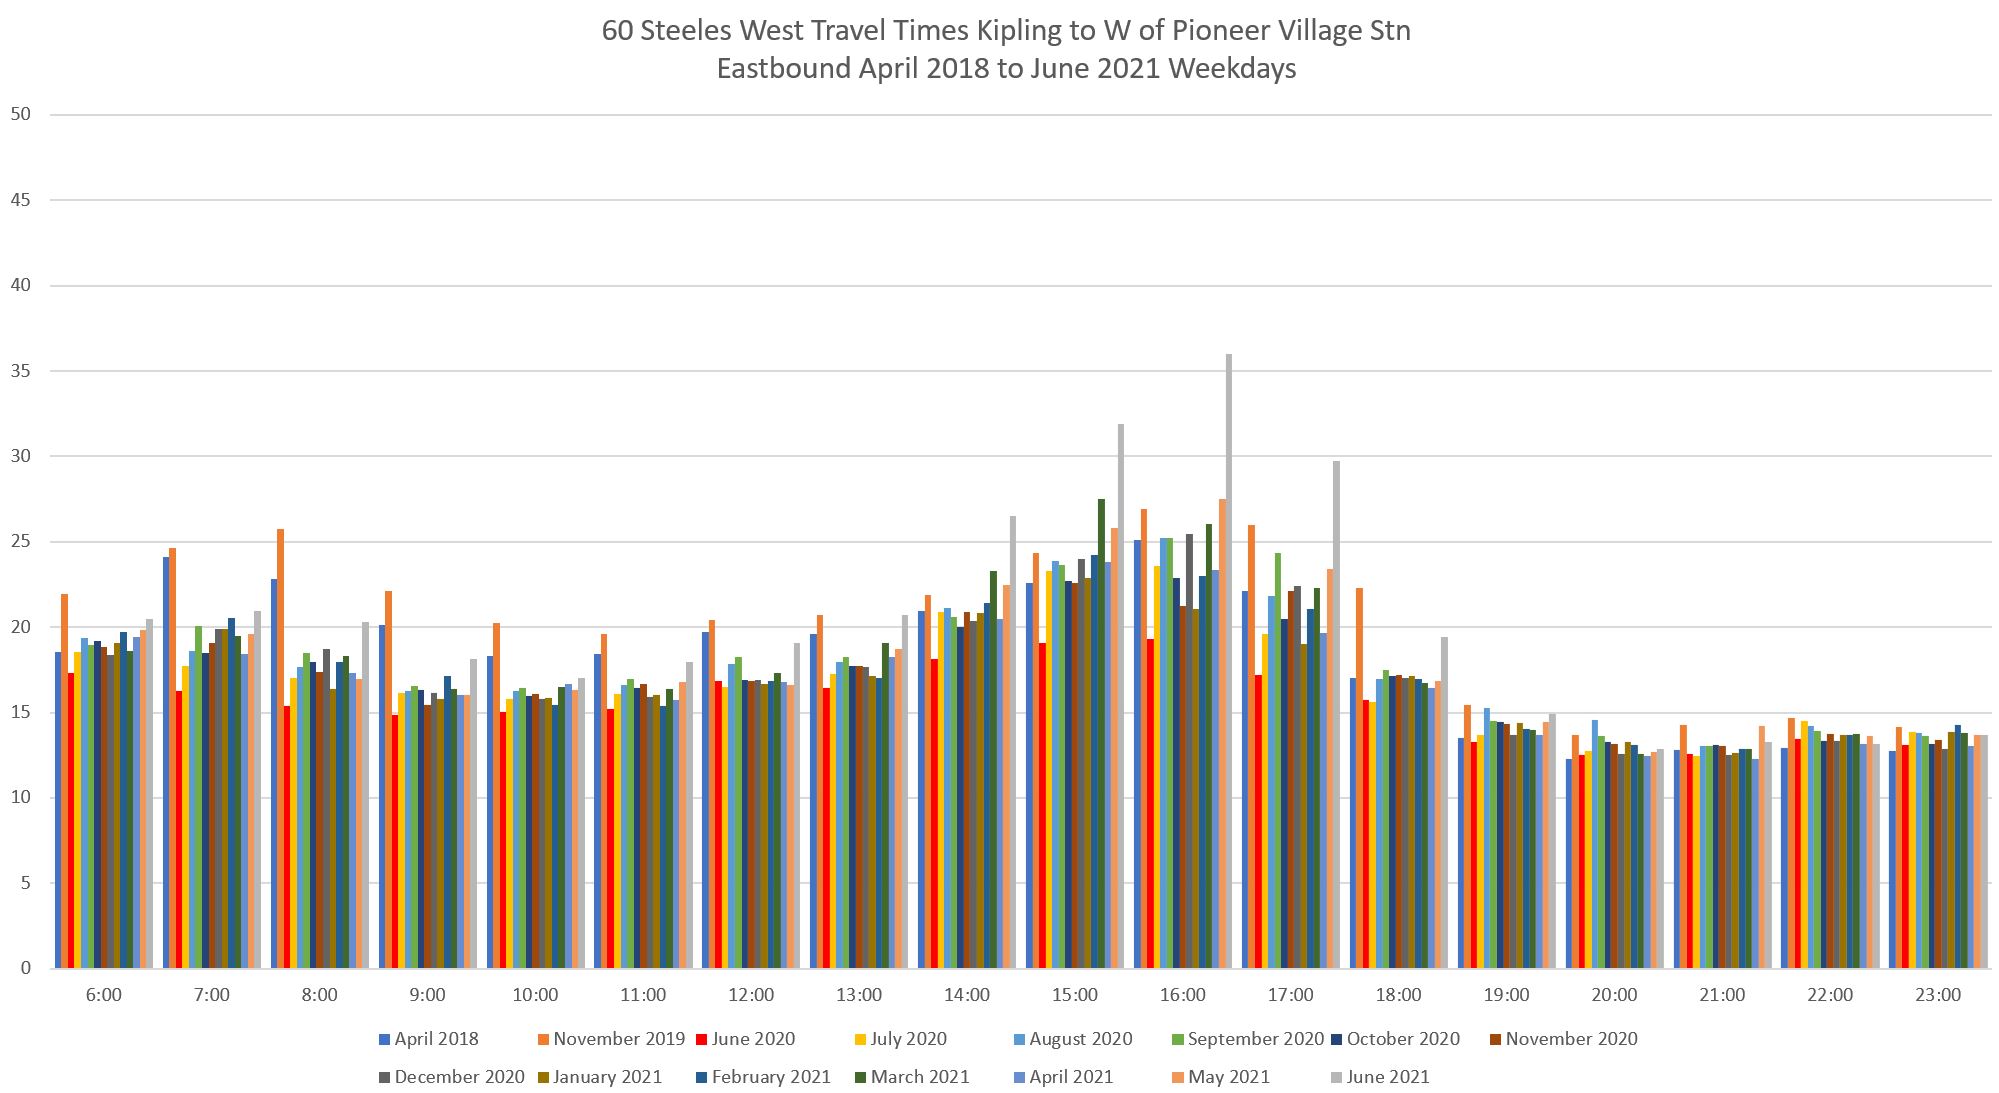
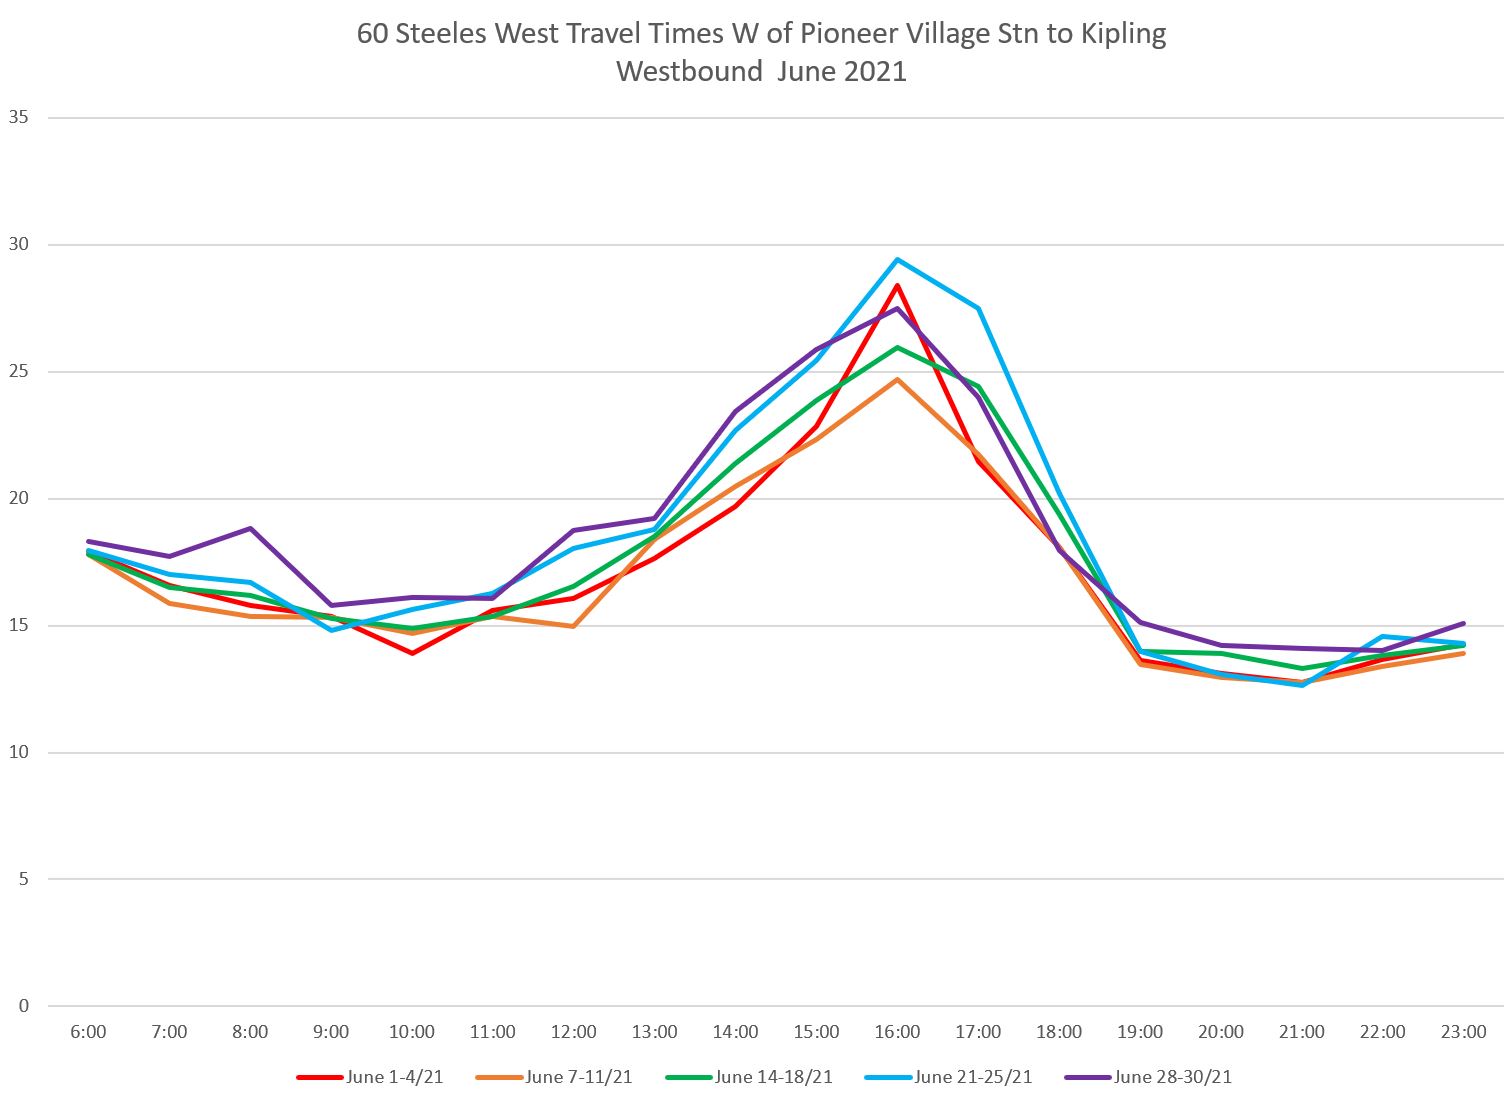
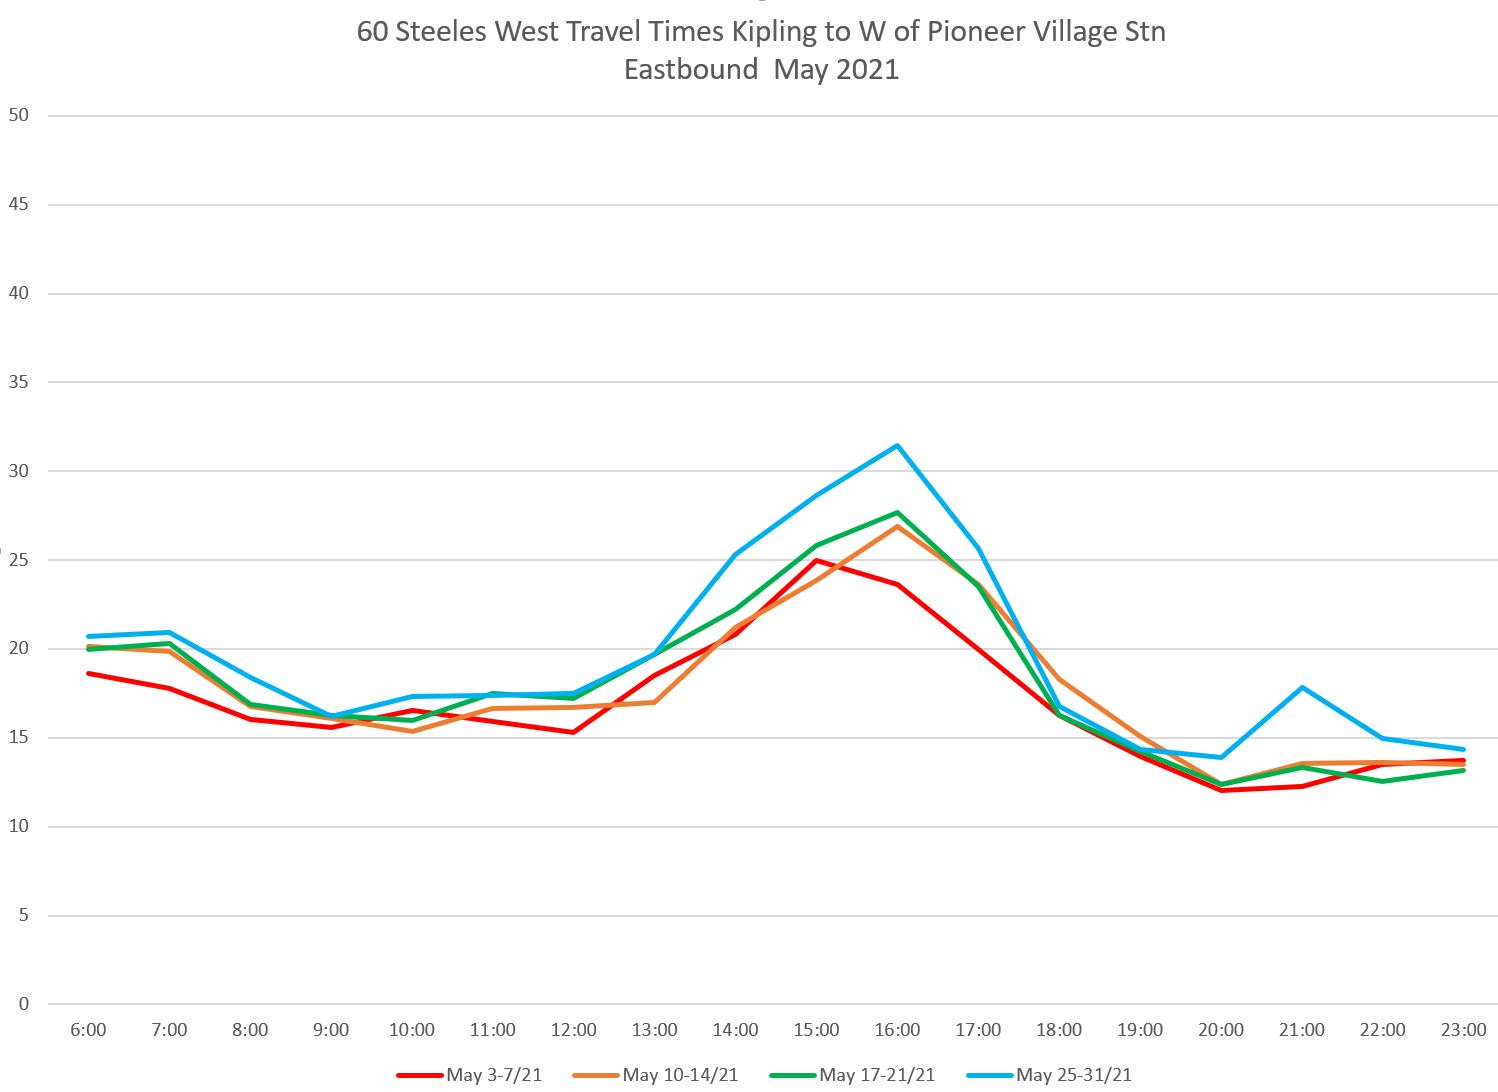
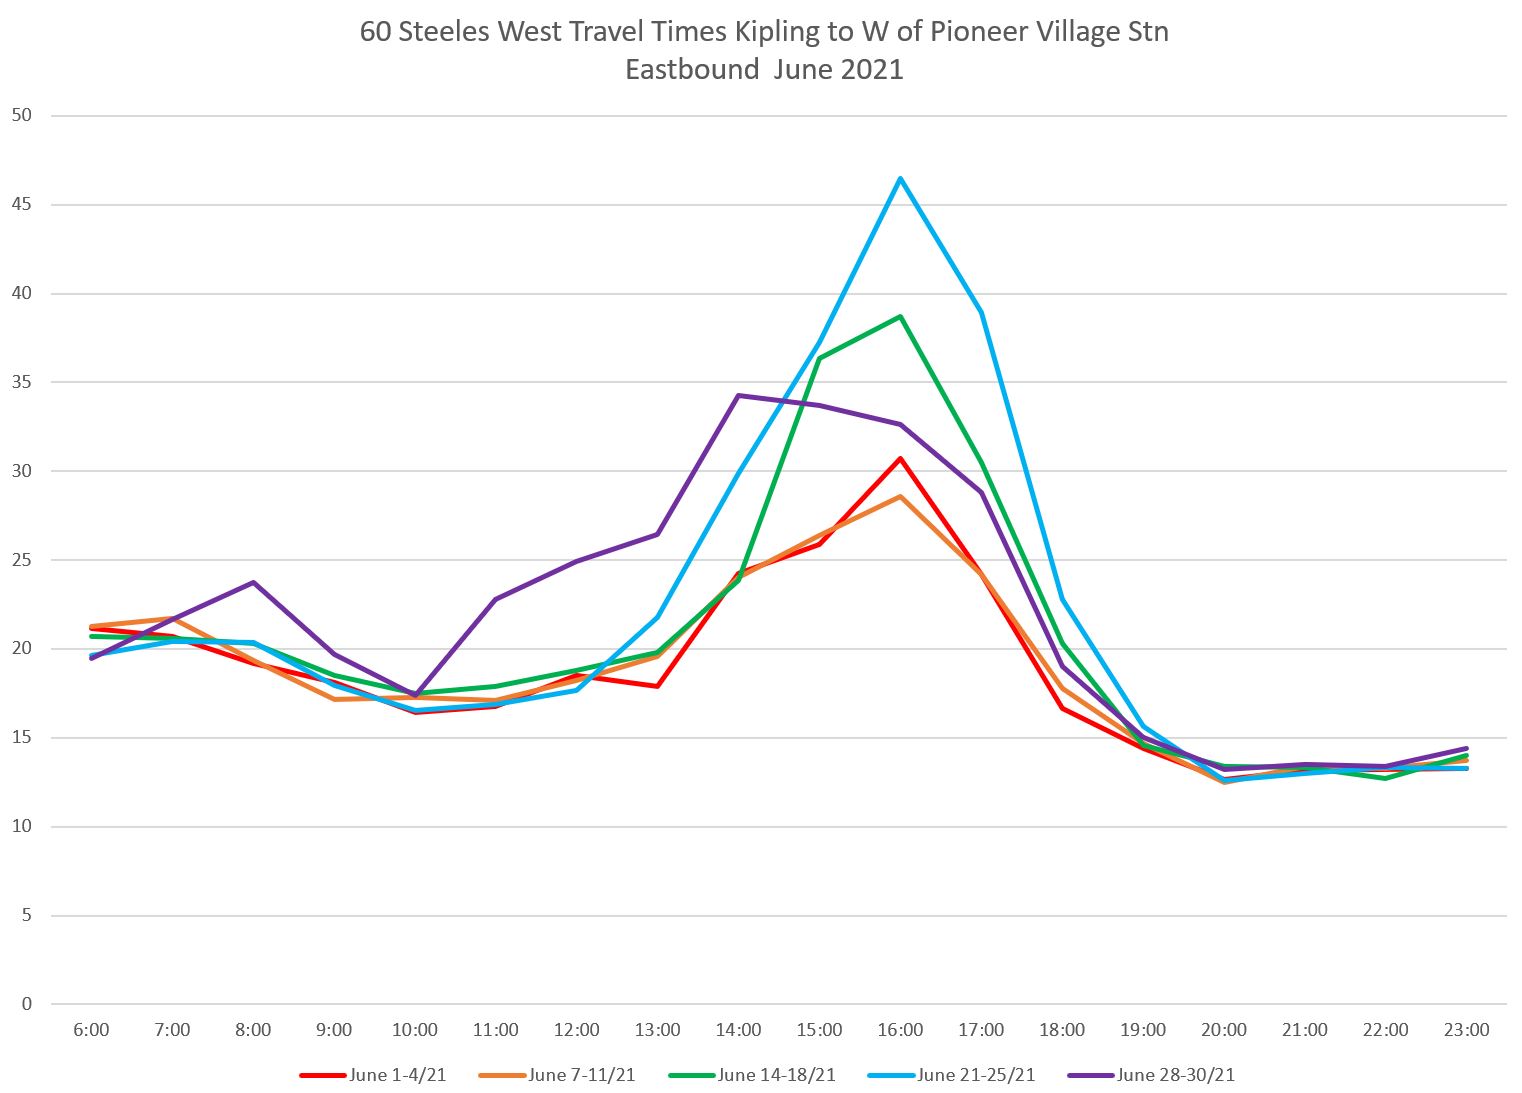
Evolution of Travel Times Between Pioneer Village Station and Kipling
Although the segment of 60 Steeles west of Pioneer Village Station is not part of the RapidTO proposals, it is an area that sees considerable variation in traffic conditions. Moreover, the drop in travel times seen in other parts of the network that are a holdover from mid-2020 appear to have been undone very quickly thereafter.
For these comparisons, I have used the section to Kipling where buses operate during all service periods.
Of particular interest for this section is the degree to which travel times can vary a lot from day to day. The monthly averages indicate a general rise in travel times in mid 2021. The weekly averages show more variation, but it is the individual daily tracking data that reveals just how much times can vary. This moral here is that averages do not tell the entire story.
As with the section east from Pioneer Village, the first bar in each hourly grouping shows data from April 2018 (blue). However, unlike the eastern section, there are no express buses here mixed in with the 60 local trips, and the travel times are directly comparable to other months where the express data were split off into a separate route 960.
In most periods, westbound travel times rise in November 2019 (orange) and fall by June 2020 (red). However, they quickly rise again and in the PM peak are now higher than in 2018. There are other problems with variability that I will turn to later in the article.
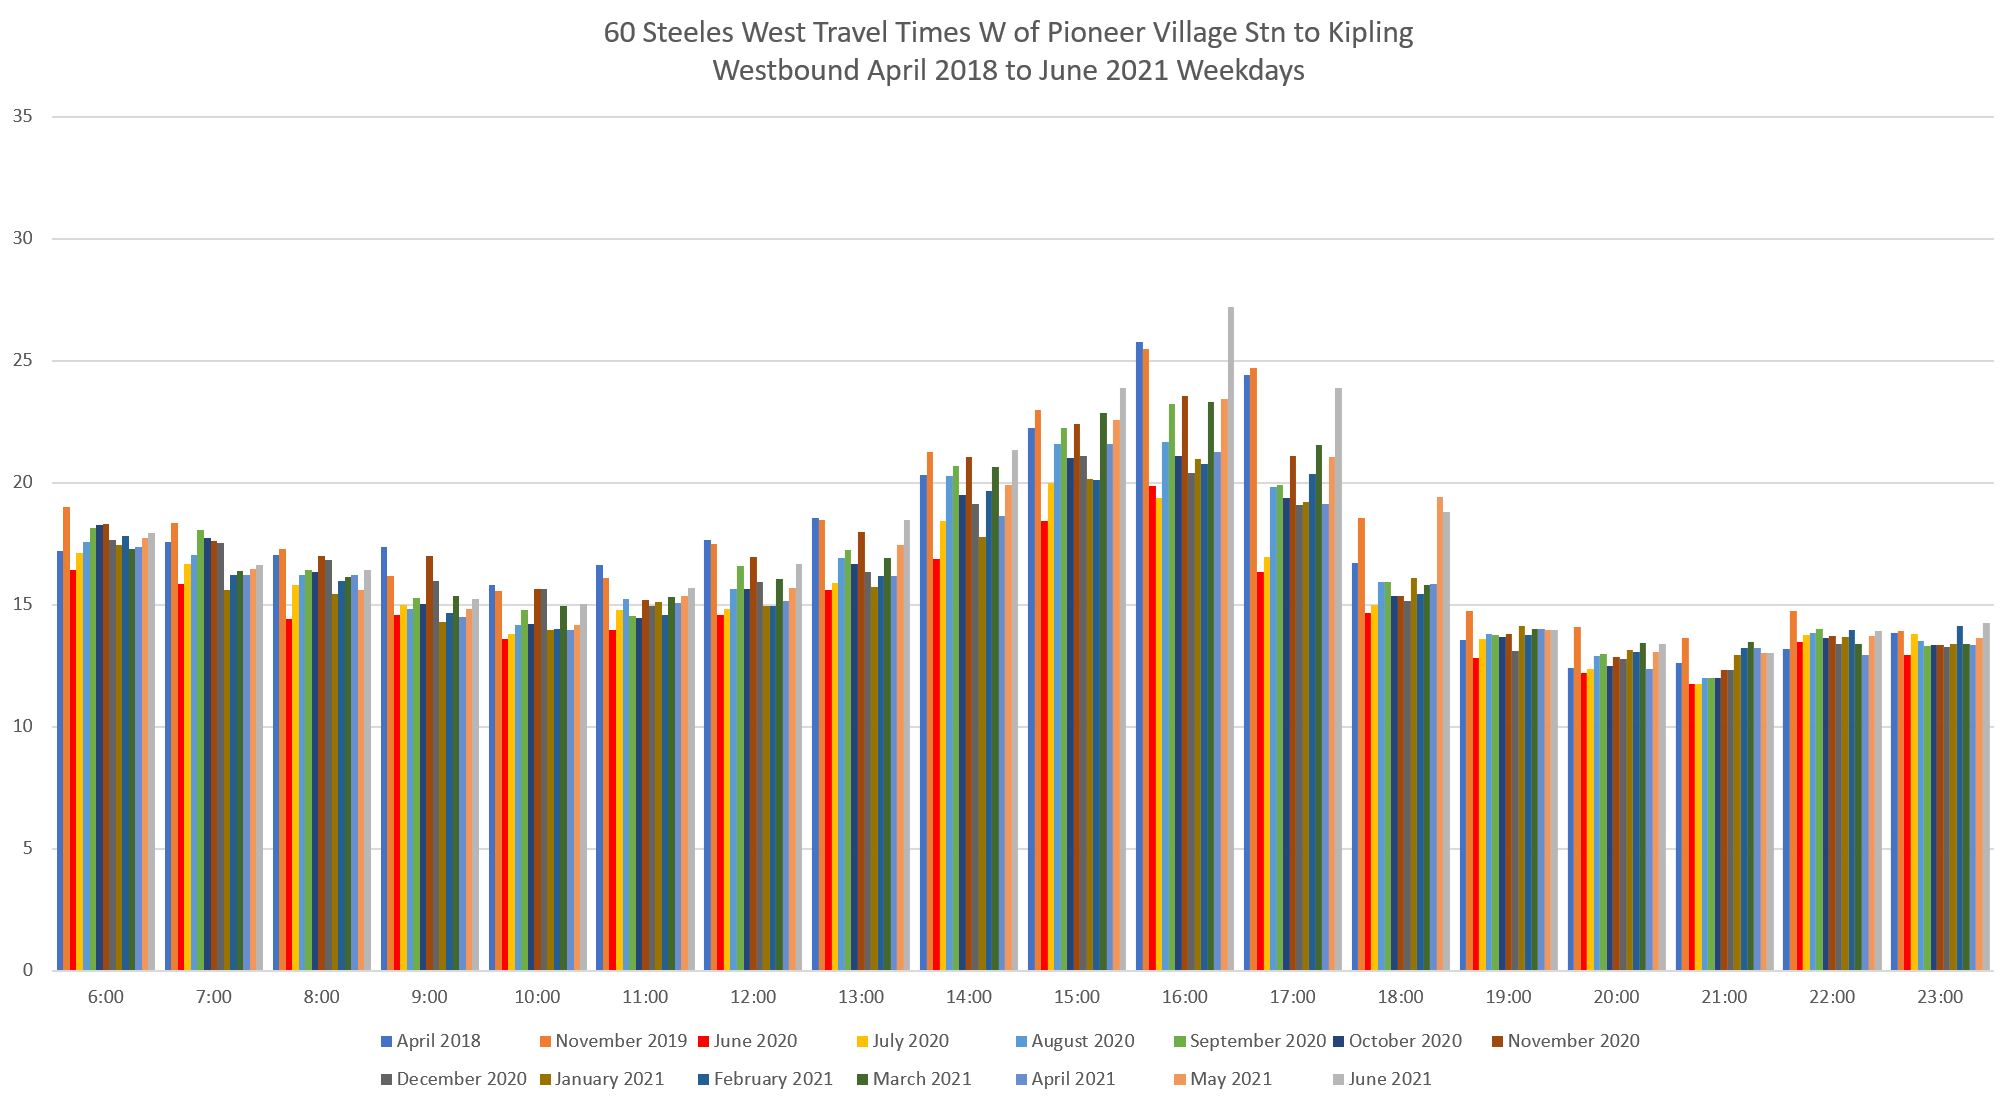
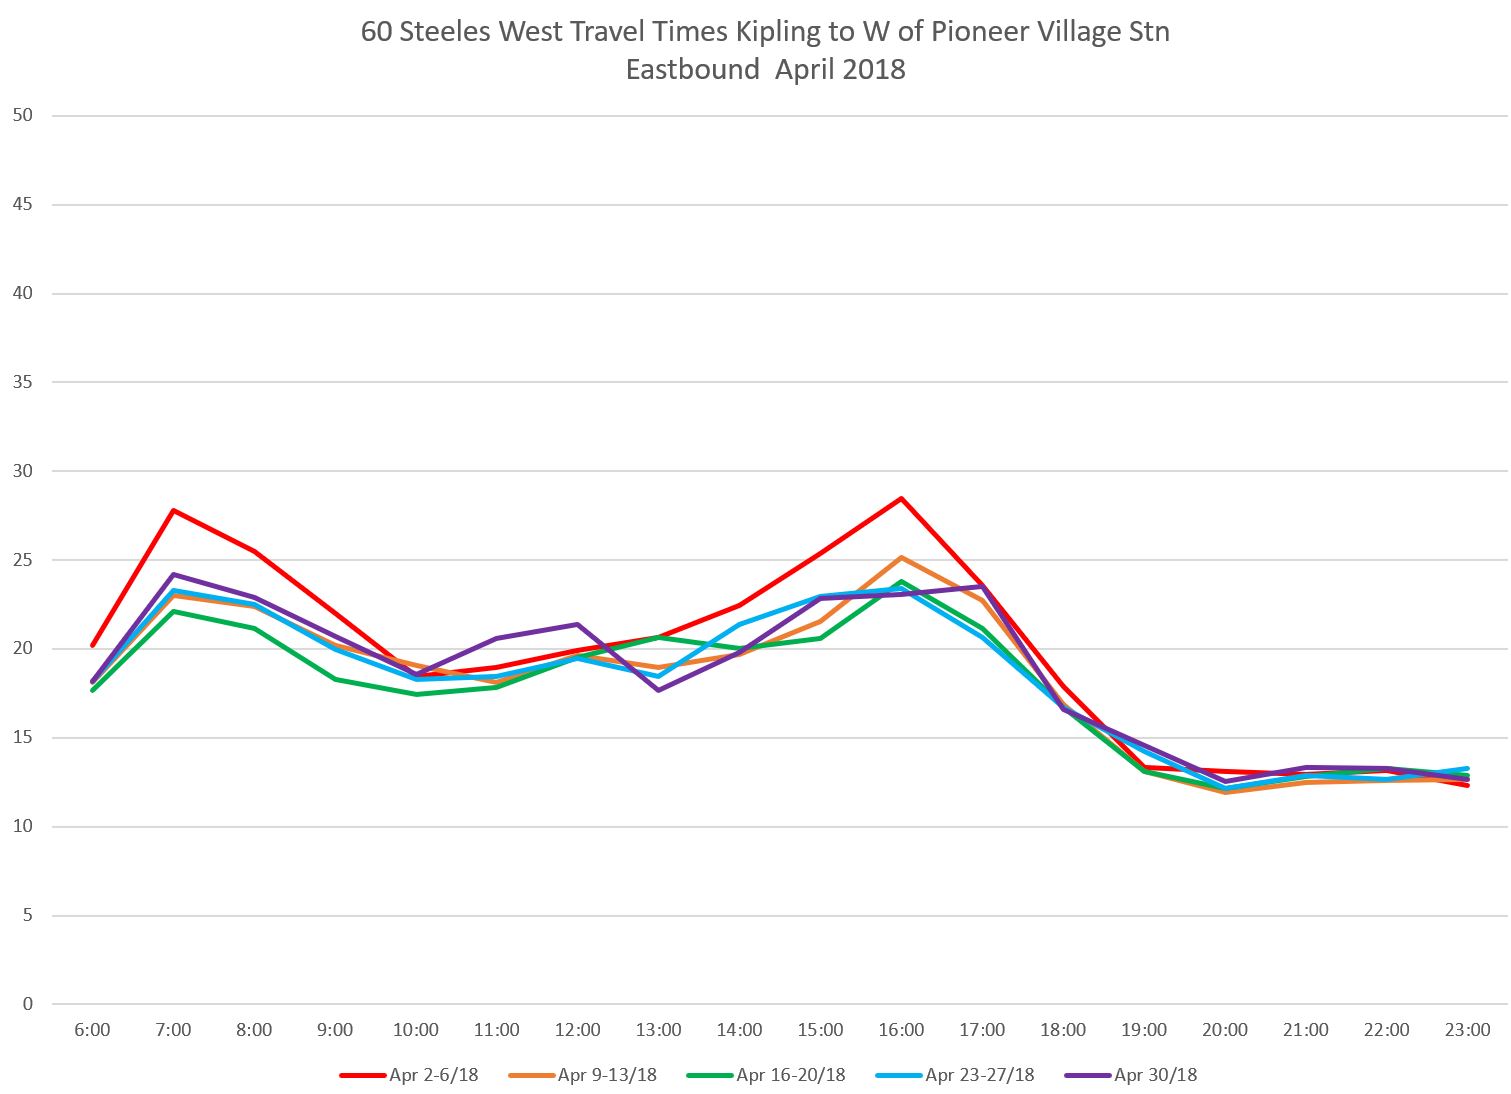
The pattern for eastbound times is different from westbound in that there were already high travel times in 2018 and 2019 and a corresponding larger drop in 2020. However, the drop was short-lived and travel times are now higher than in 2018 from early afternoon onward.
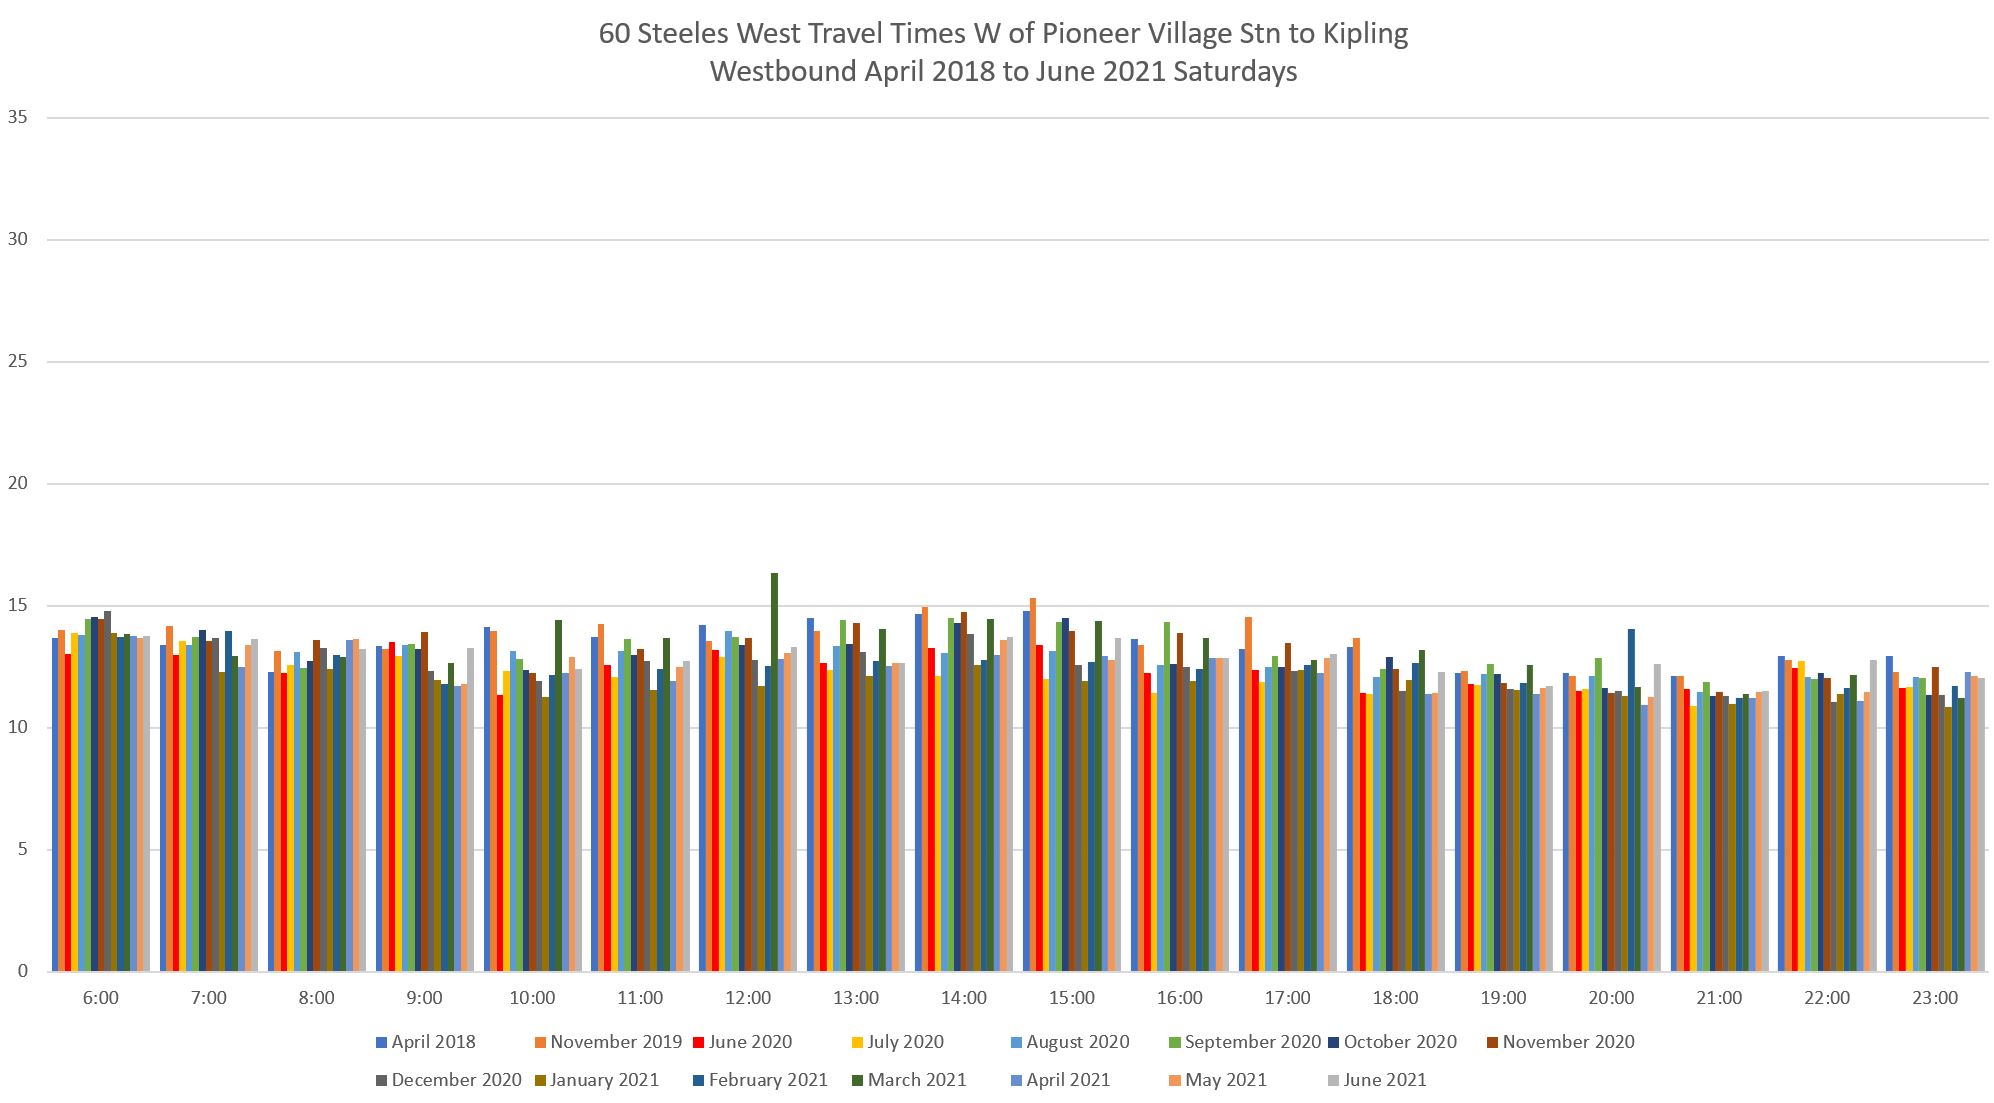
Weekend travel times have not been affected much either by a pandemic-era reduction or recovery-era increase. The chart below shows westbound Saturday data, and Sunday’s is quite similar.
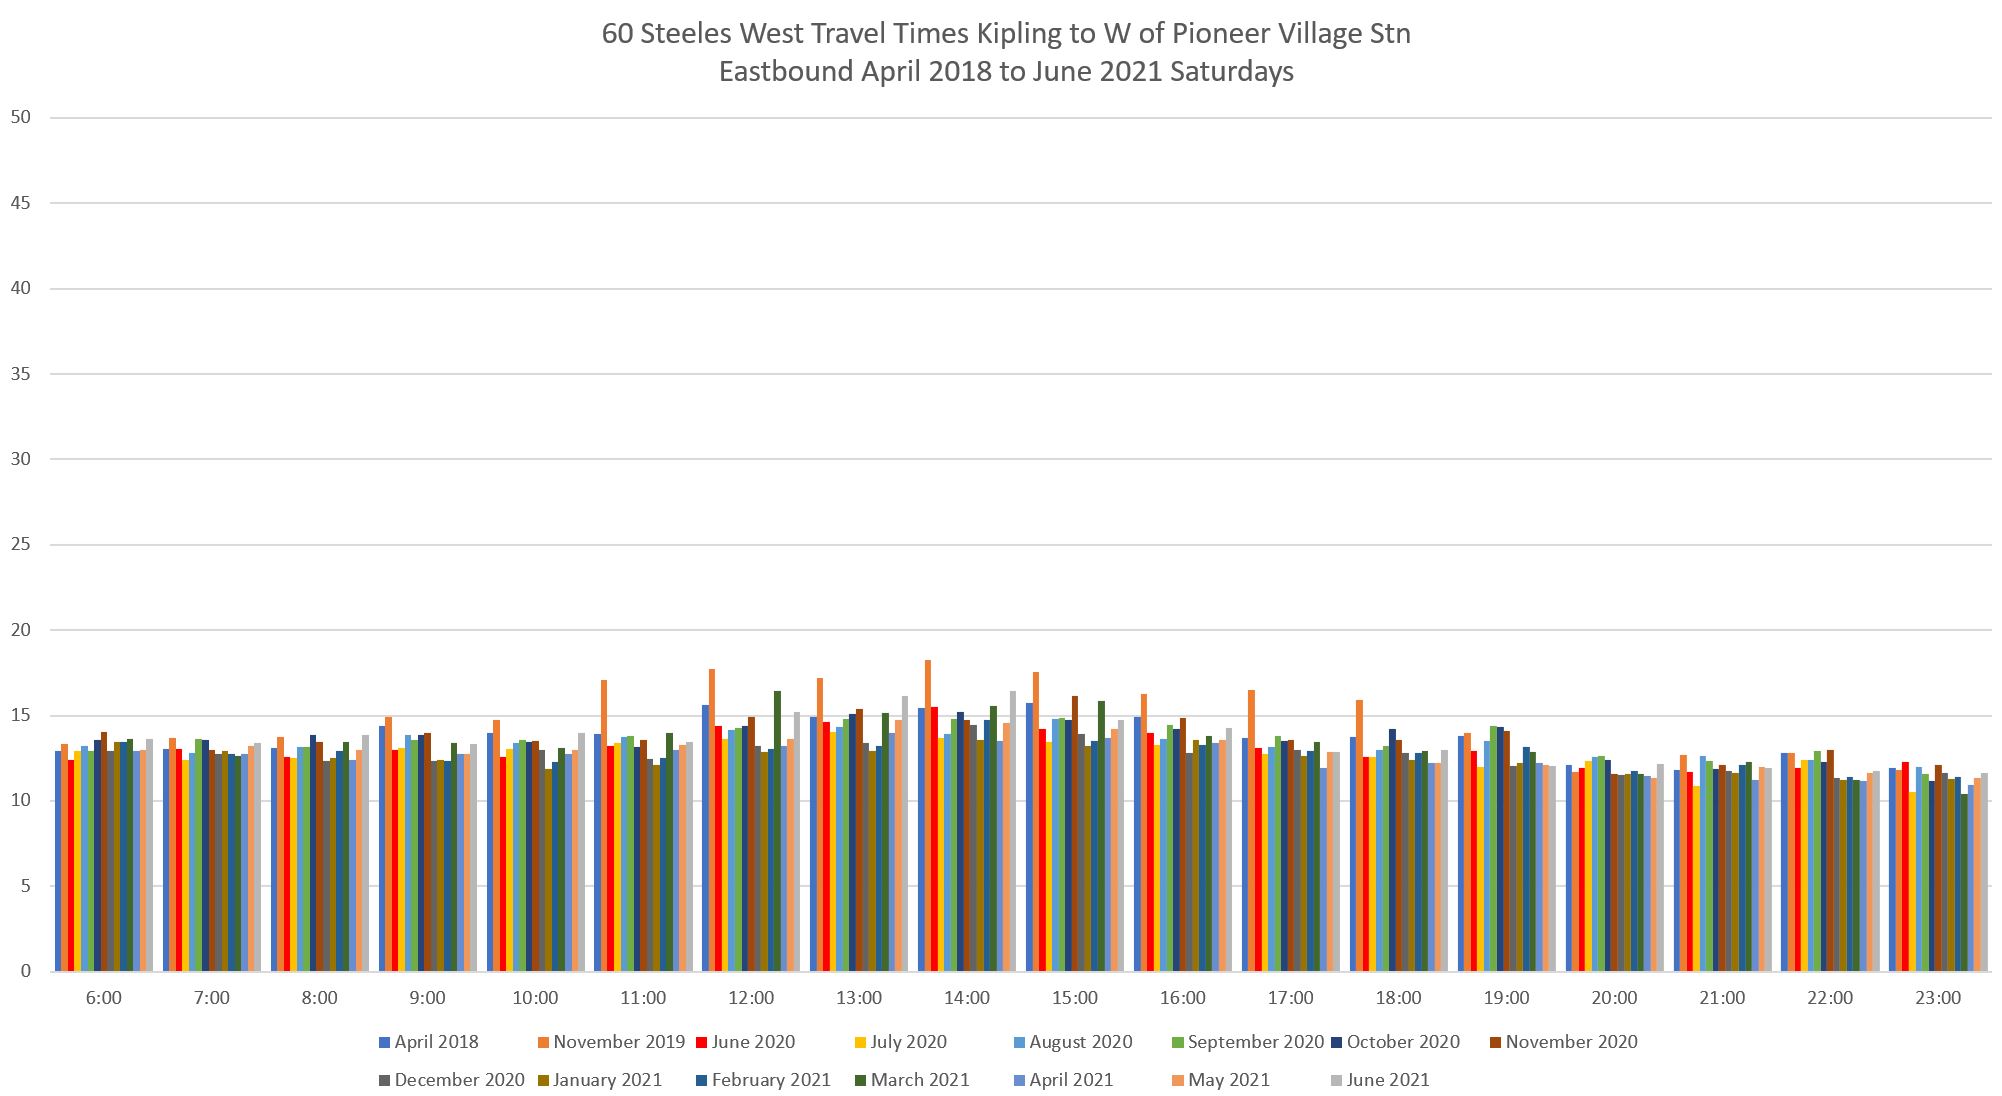
On weekends, a small midday eastbound rise in travel times is returning and 2021 times have overtaken 2018 values.
Week-by-week Data
Looking at individual months, there is considerable variation on a week to week basis even within months, particularly for recent data. In April 2018, there was a strong PM peak westbound, and smaller peaks in both the AM and PM eastbound.
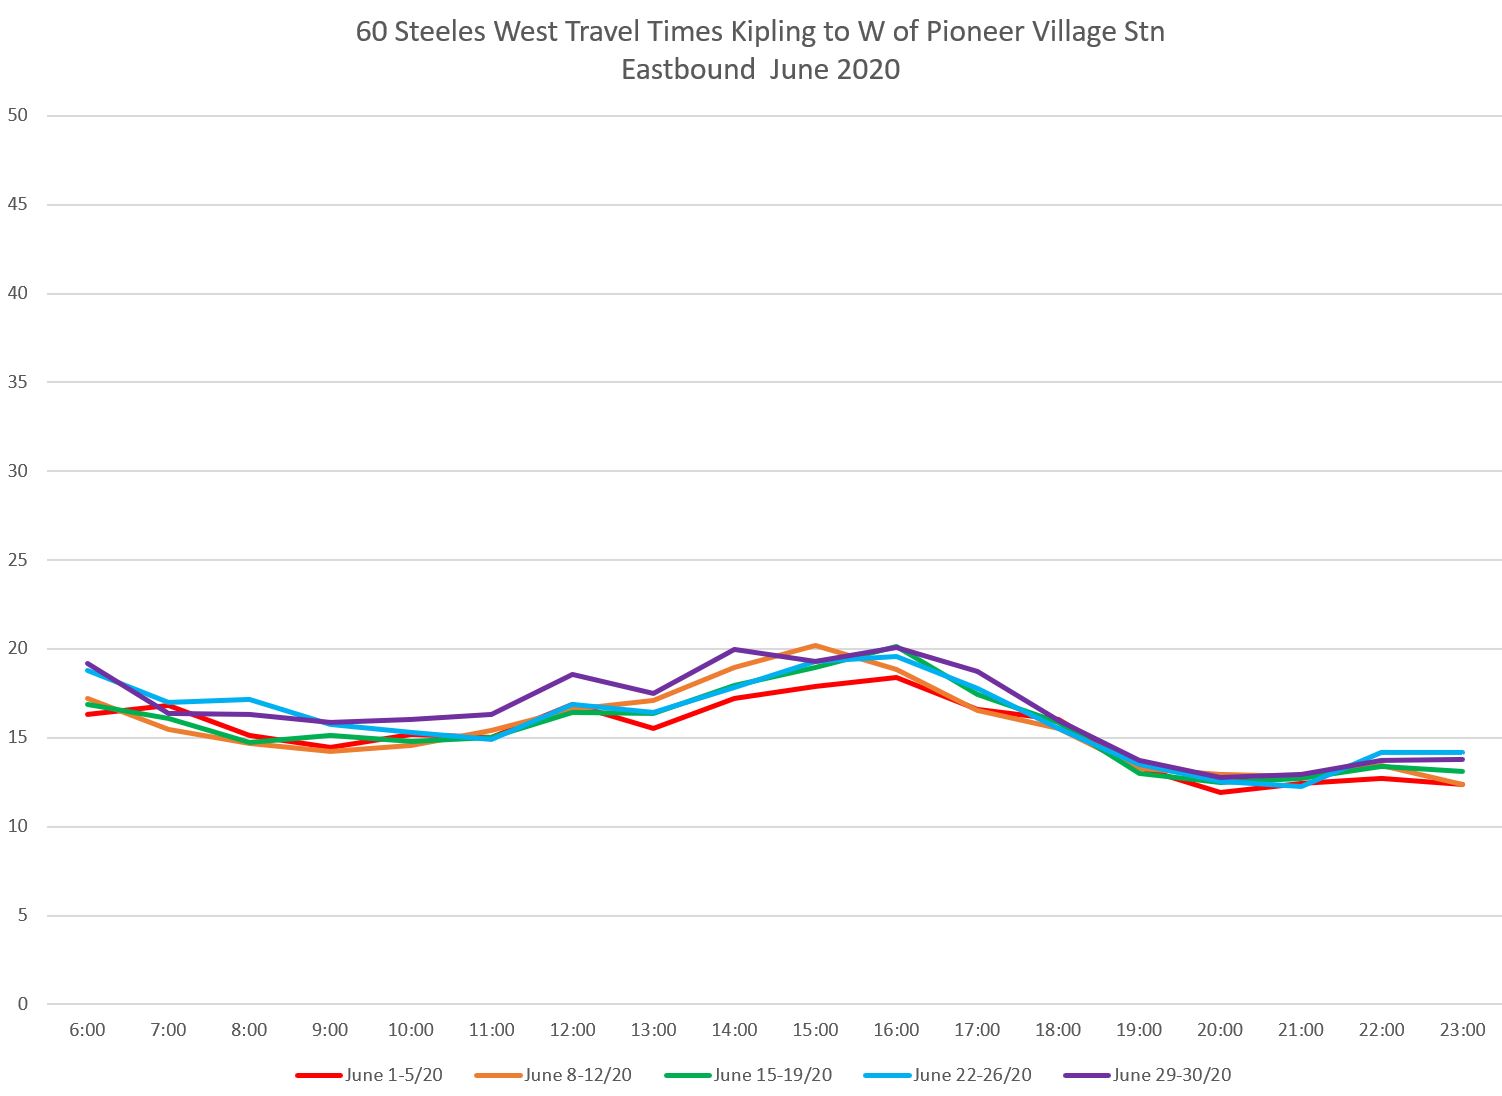
By June 2020, the peaks are smaller than in 2018, but unlike on many other routes, they have not completely vanished.
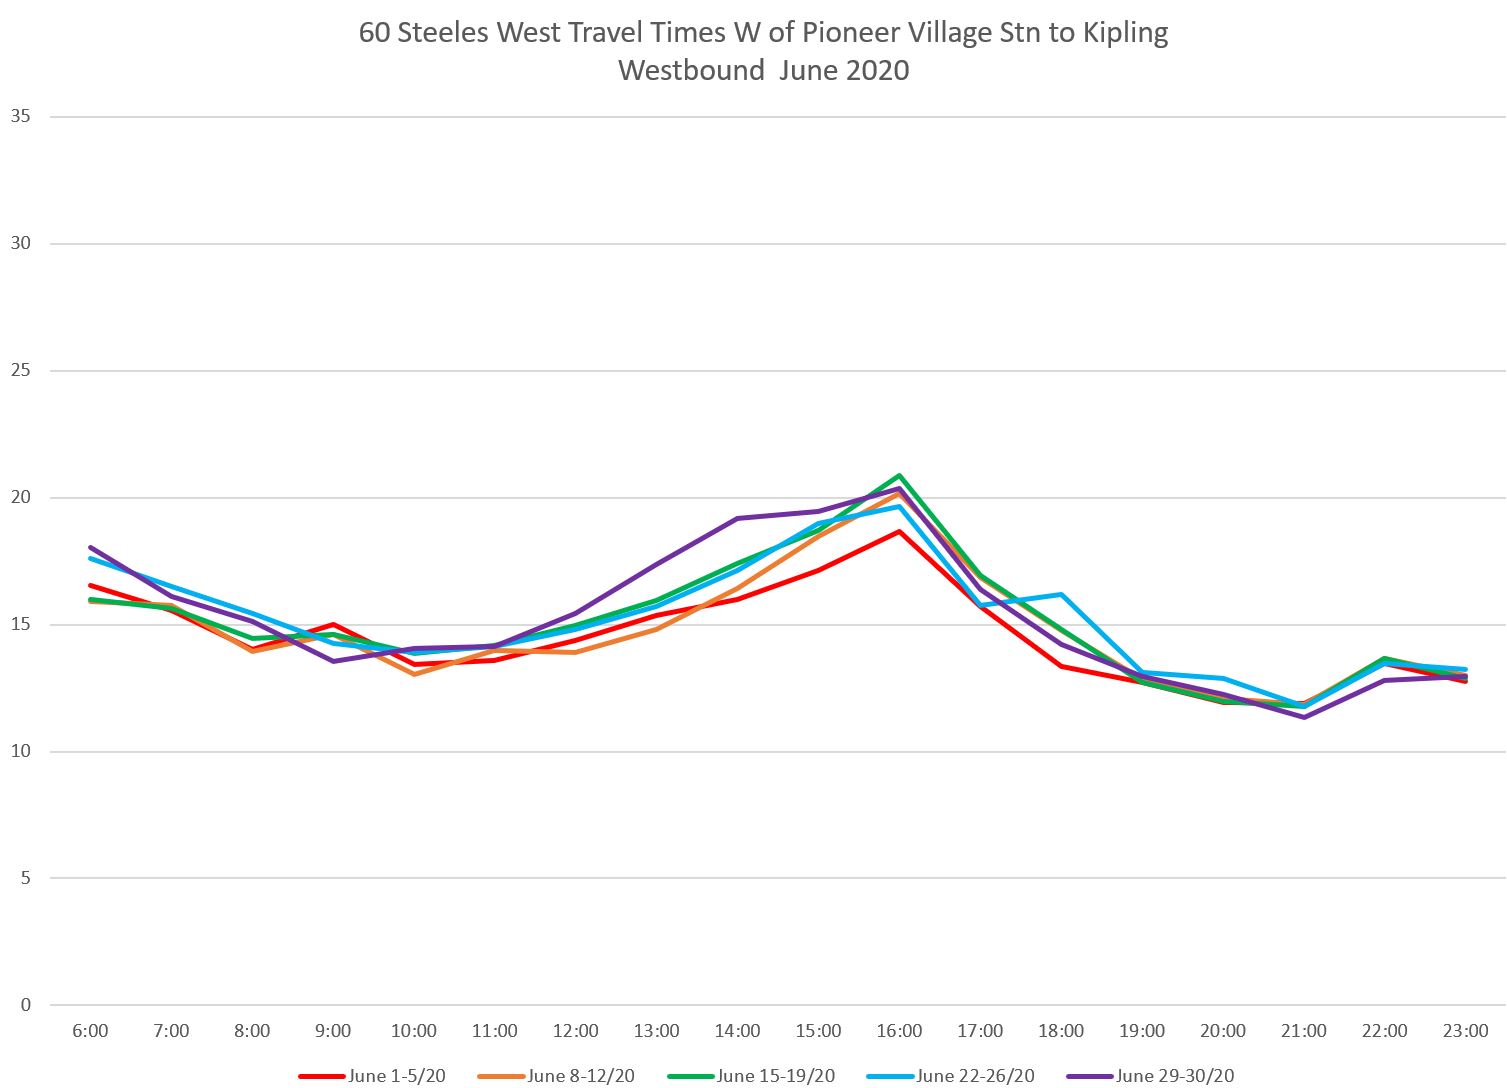
In June 2021, the westbound peak has returned stronger than in April 2018. Also of note is the week-to-week difference in values, about which more later.
That difference shows up even more strongly in eastbound data, and I have included the May and June 2021 charts here to illustrate this.
Weekday Service Details
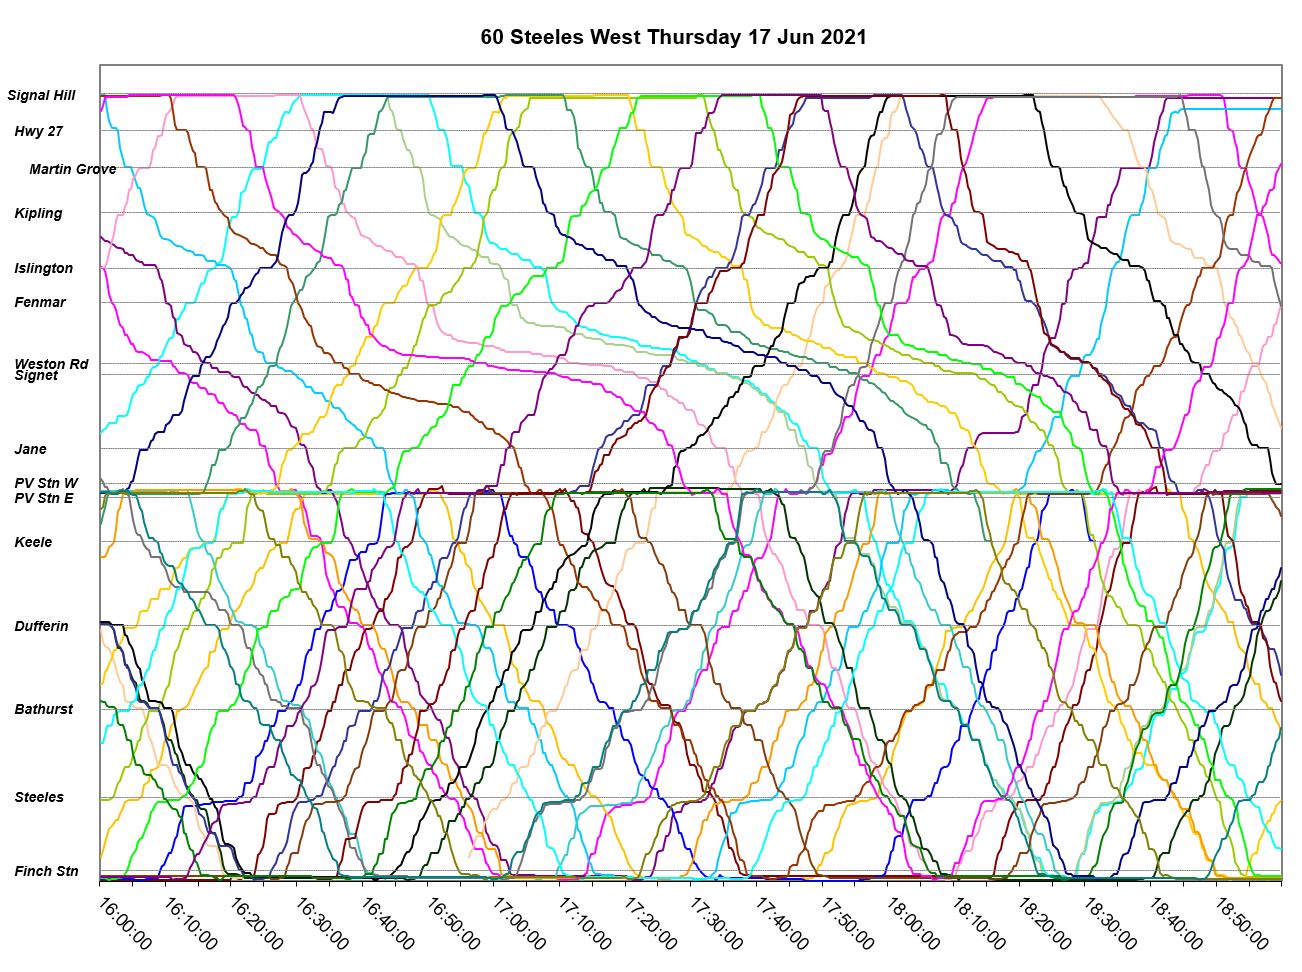
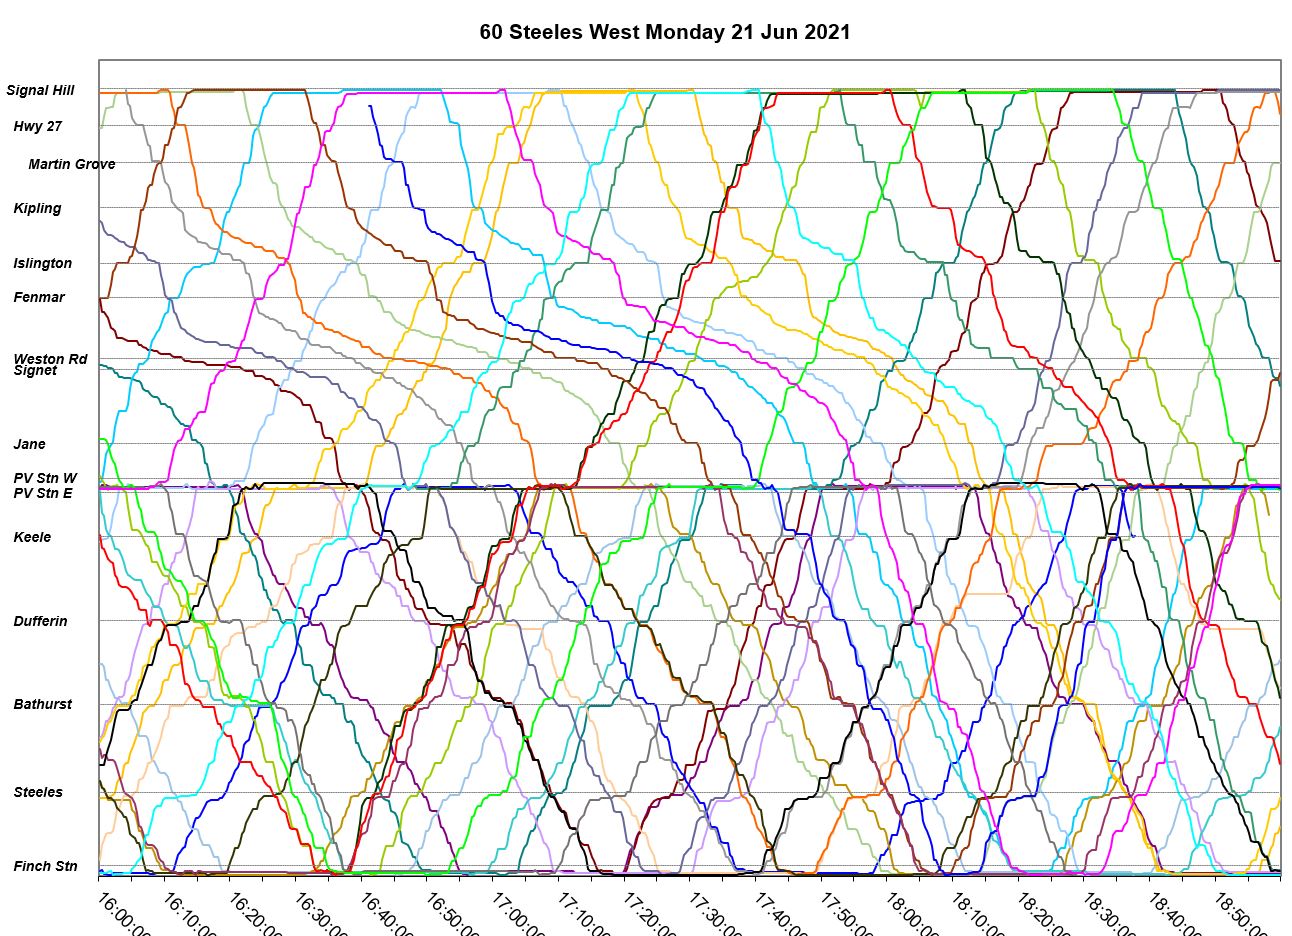
Daily service charts show where and how severely congestion affects this route. In the examples below, I have included only the period from 4 to 7 pm, except on June 30, the last day before the July 1 long weekend which shows the typical early rush hour.
June 17 shows congestion in two segments. On a small scale, Kipling to Islington eastbound runs slower than further west, but the real problem lies easy of Fenmar to west of Jane where travel speeds drop very substantially (shown by the much more horizontal angle of the lines on the chart for buses taking longer to get from one point to another).
Also visible on this chart is the backlog for left turns northbound at Yonge and Steeles where buses queue because there is not enough green time for them.
In spite of the extended travel times, the buses have a considerable layover at both ends of their route showing that even under these circumstances the schedules are adequate.
June 21 continues the same pattern with eastbound PM peak delays.
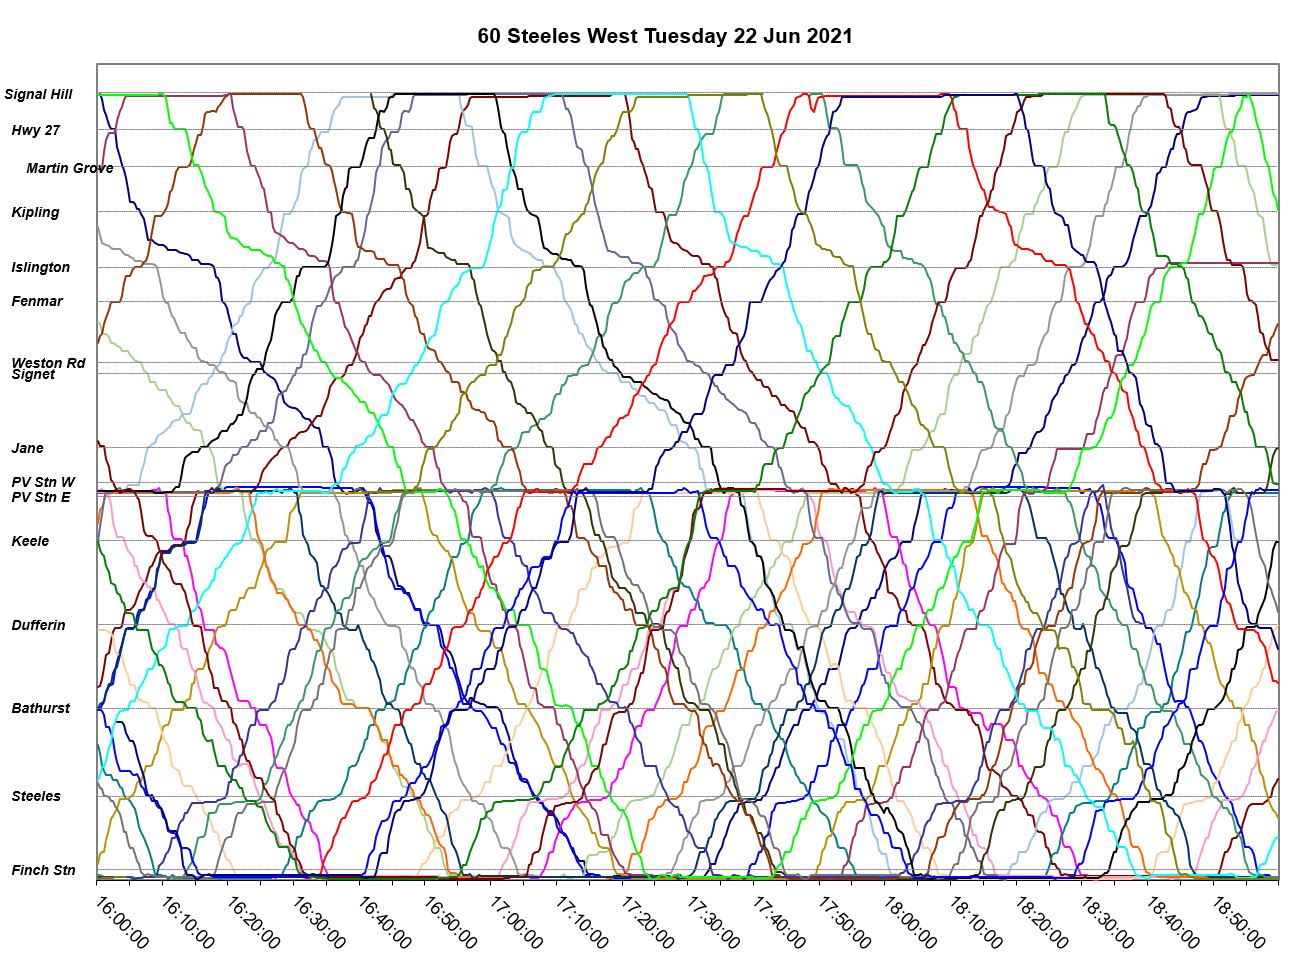
Magically, on June 22, one day later, the congestion has vanished.
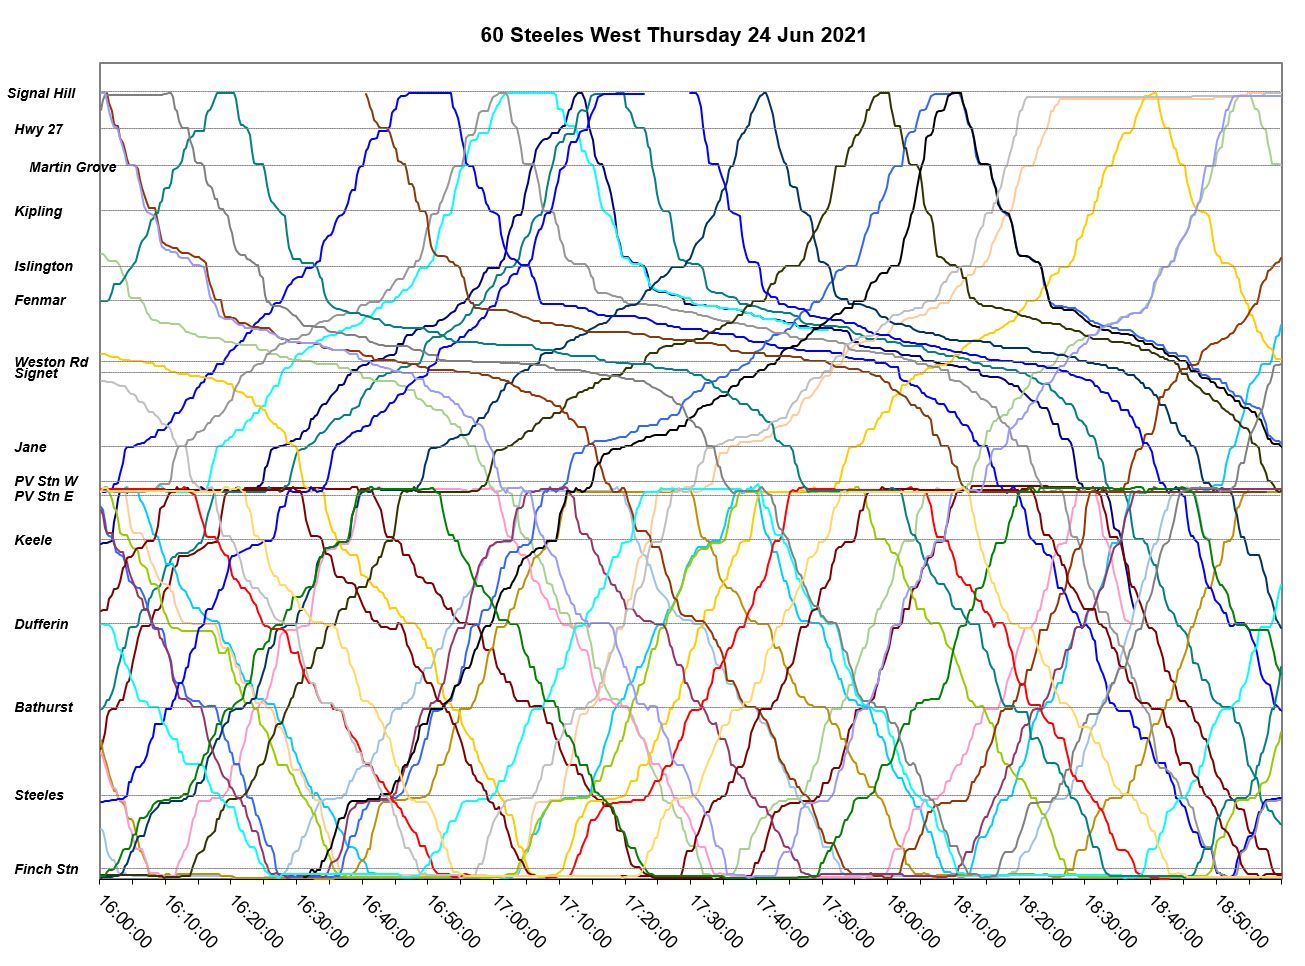
By June 24, it is back and even worse than before affecting both eastbound and westbound travel, and lasting into the early evening. Note that the layovers at Signal Hill are now quite short until after 6 pm.
On June 30, the problems begin earlier in the day and are evident from 1 pm onward. Moreover, by 3 pm, service west of Pioneer Village Station starts to bunch and this is very bad until after 6 pm.
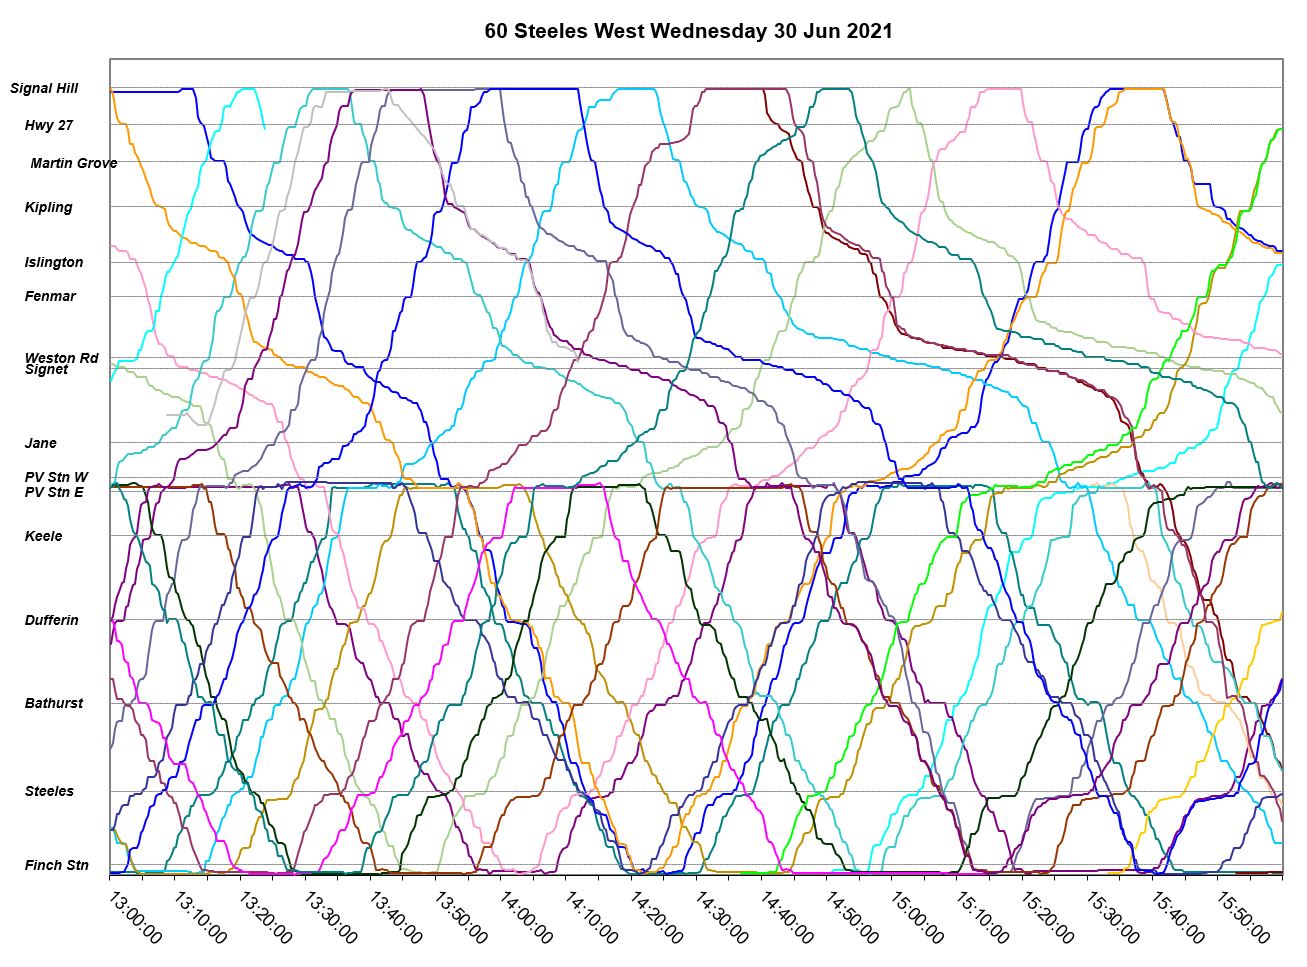
The headway chart at Kipling eastbound is not very pretty on June 30. After 2 pm, there are many wide gaps and vehicles travelling in pairs.
This also affects the service east of Pioneer Village Station where the comparatively better-behaved and frequent service operates.
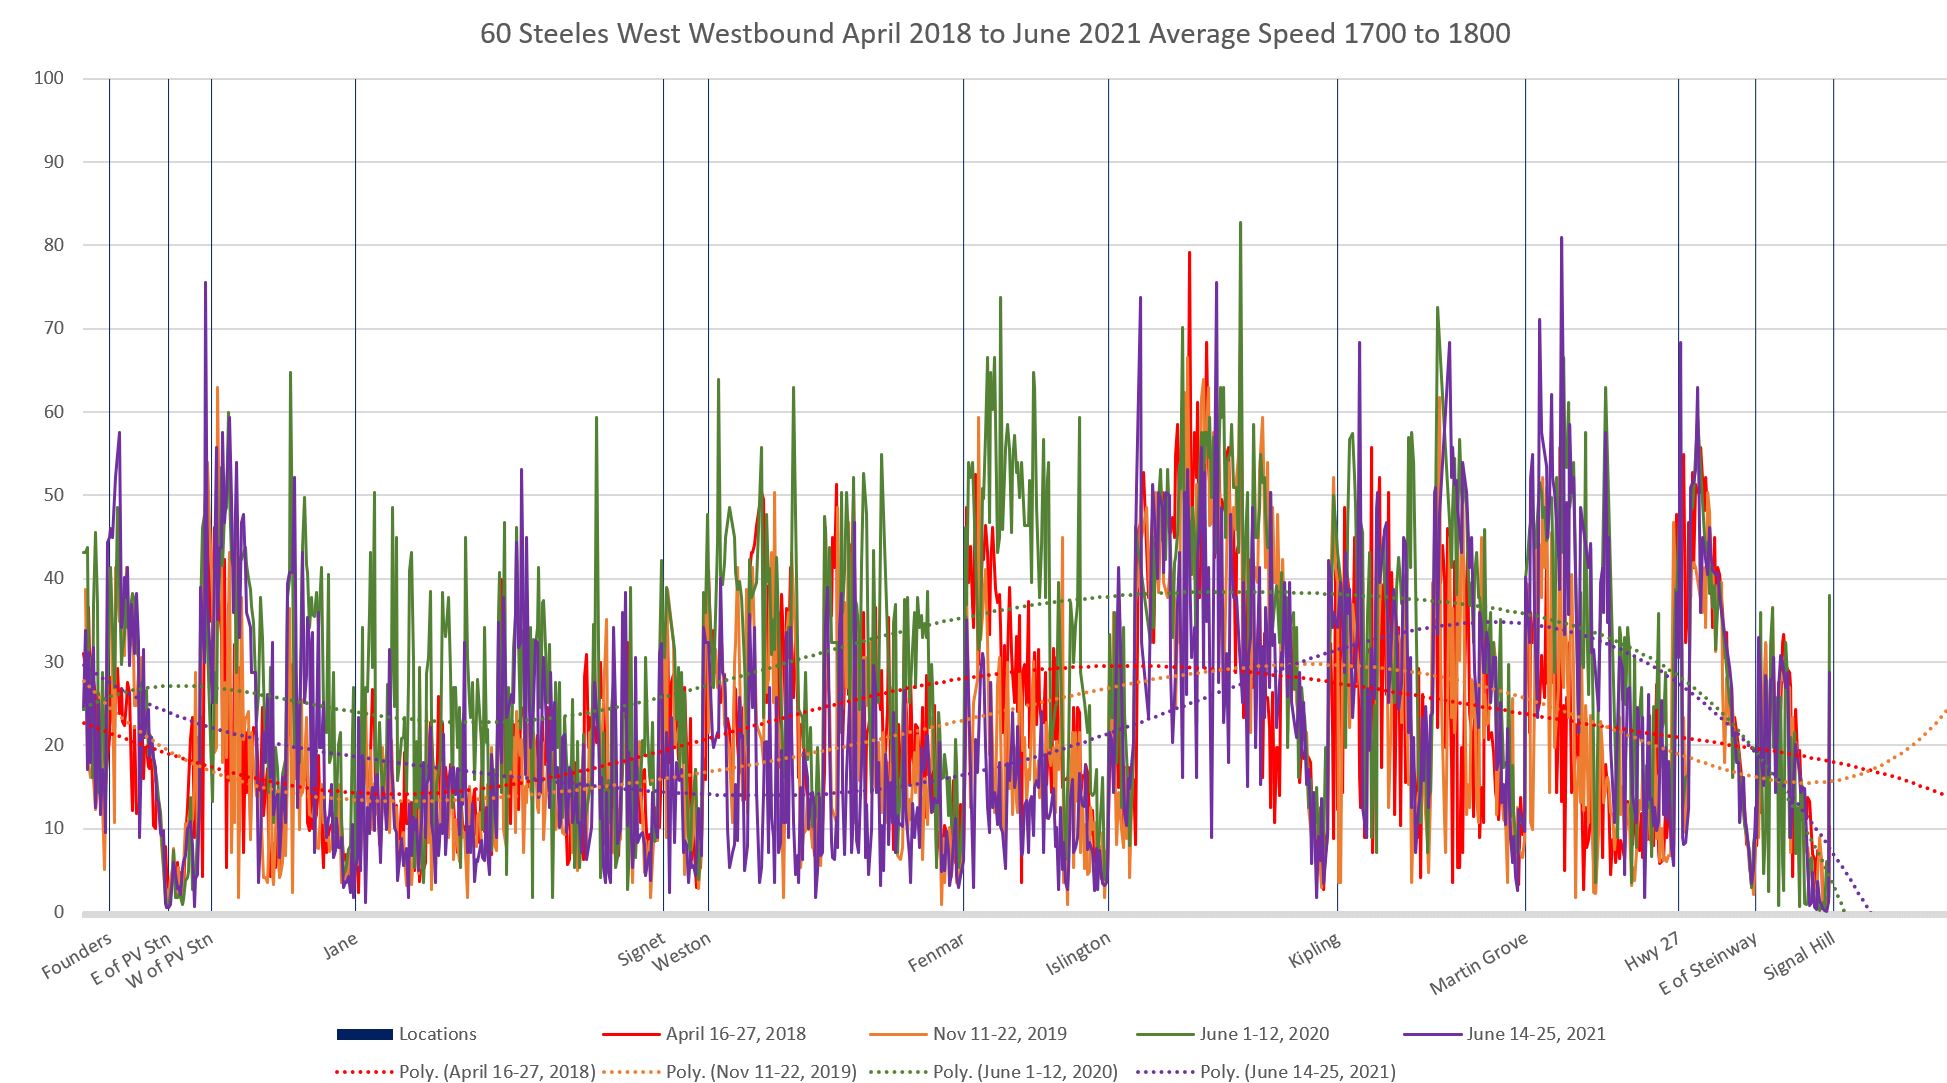
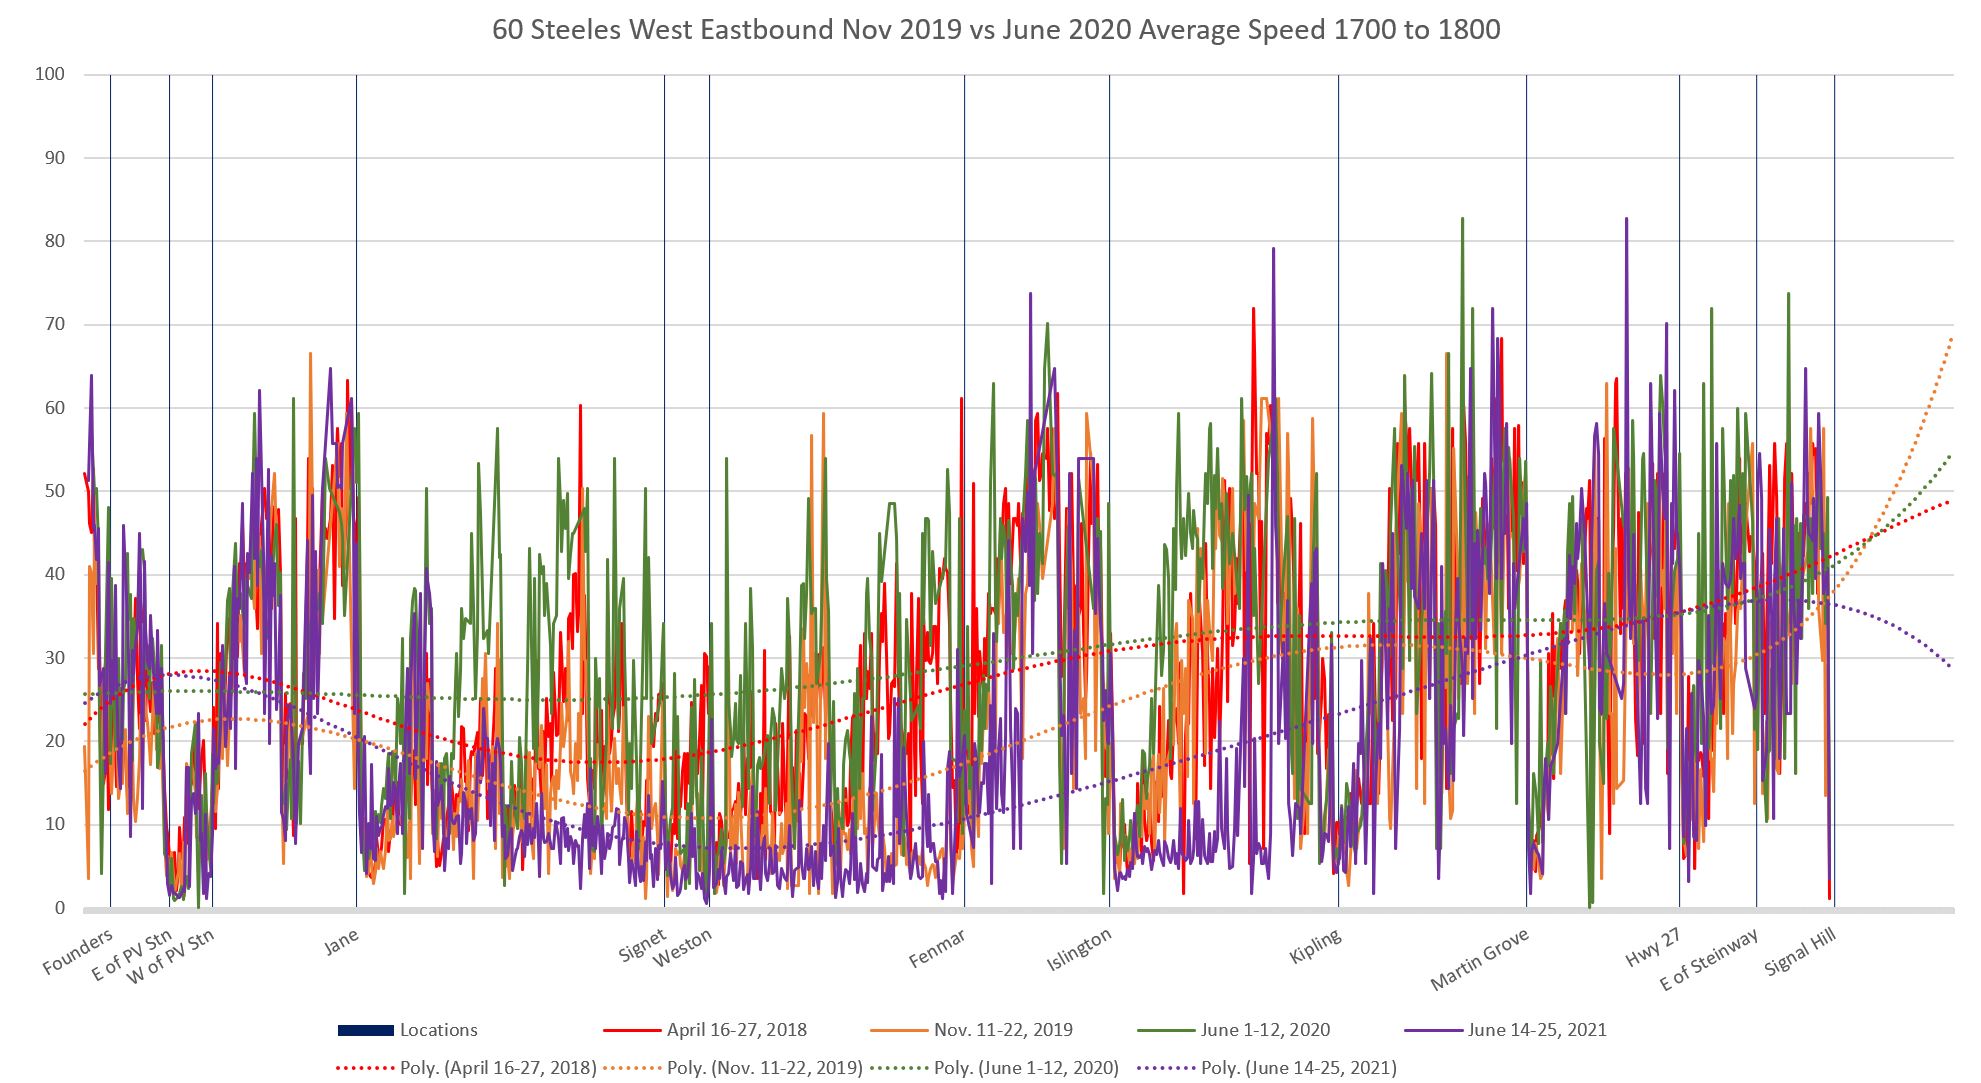
Comparing Prepandemic, Local and Express Speed Profiles (West of Pioneer Village Stn)
The charts in this section combine two weeks’ worth of data from each of the months shown. Therefore, some of the worst of the effects of congestion that comes and goes on a daily basis in June 2021 is averaged out. Even so, there are severe problems on parts of Steeles Avenue where no transit priority is contemplated.
These charts are different from those shown for the section east of Pioneer Village Station because there is no 960 Steeles Express service west of that point. Four separate months are combined making the charts a bit “busy”, but there are specific things to look for:
- The trend lines showing the overall shape of the data reveal which periods and areas had slower or faster speeds.
- Cases where one month’s data are substantially different show up in both the trend lines and in the overall colour band for than month moving away from the others.
The charts include Pioneer Village Station and a short section east of it for context.
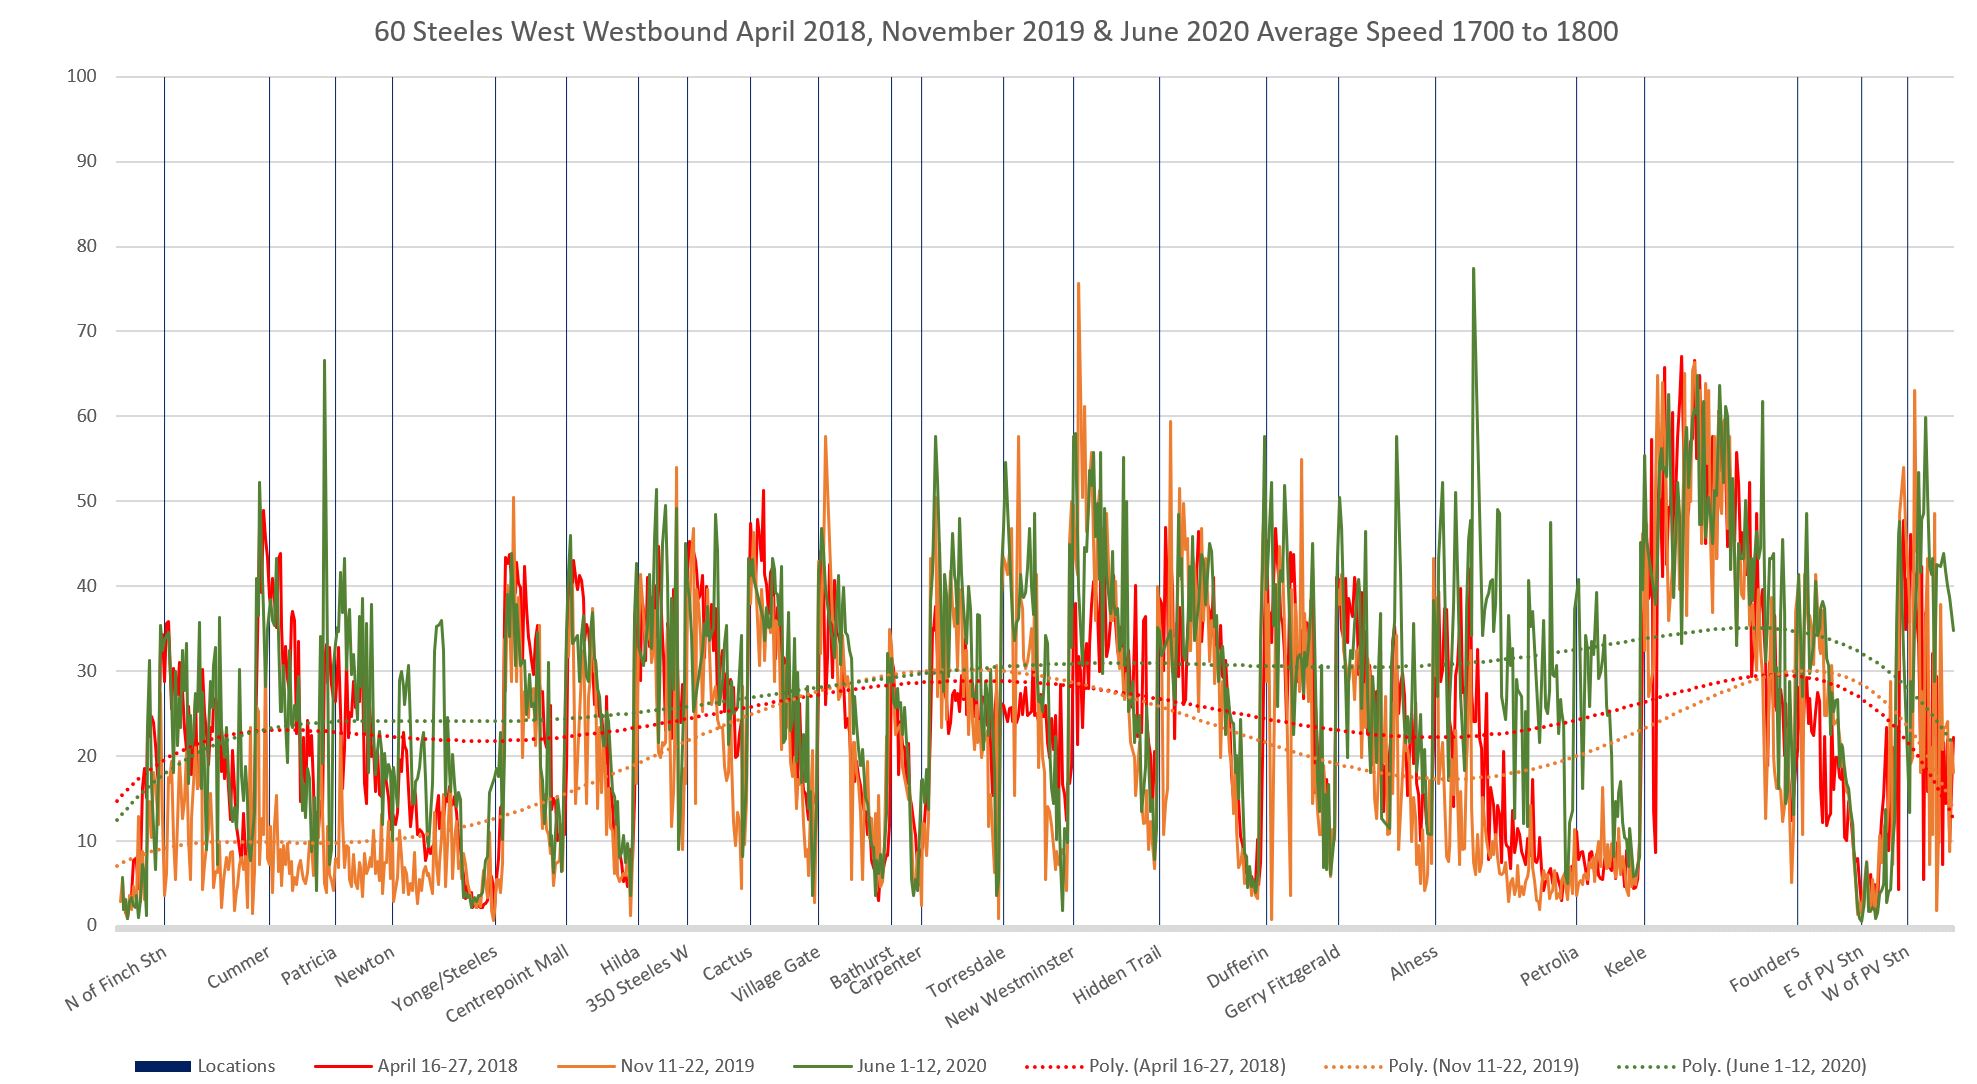
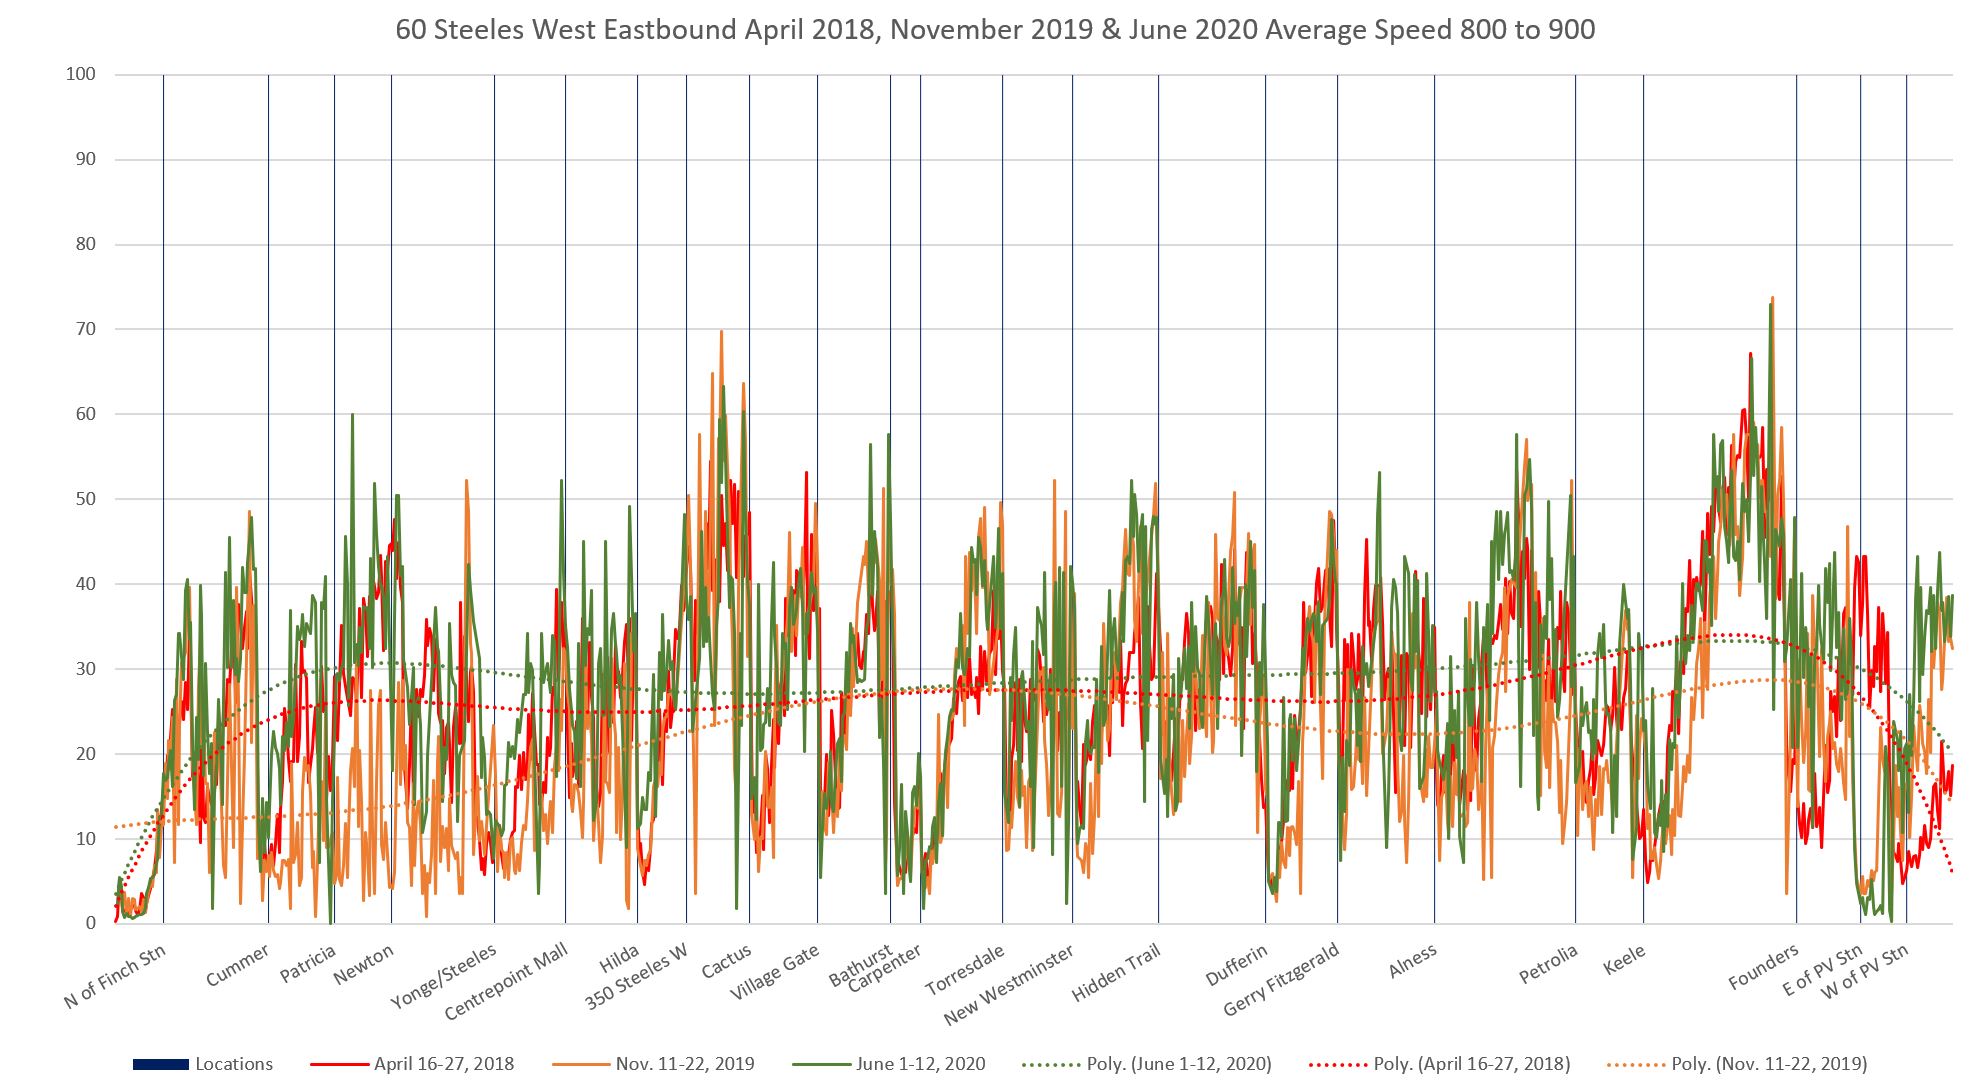
Westbound from Pioneer Village Station
In the 8 to 9 AM period, the trend lines for the four months lie fairly close together except west of Jane where the pre-pandemic speeds are slower.
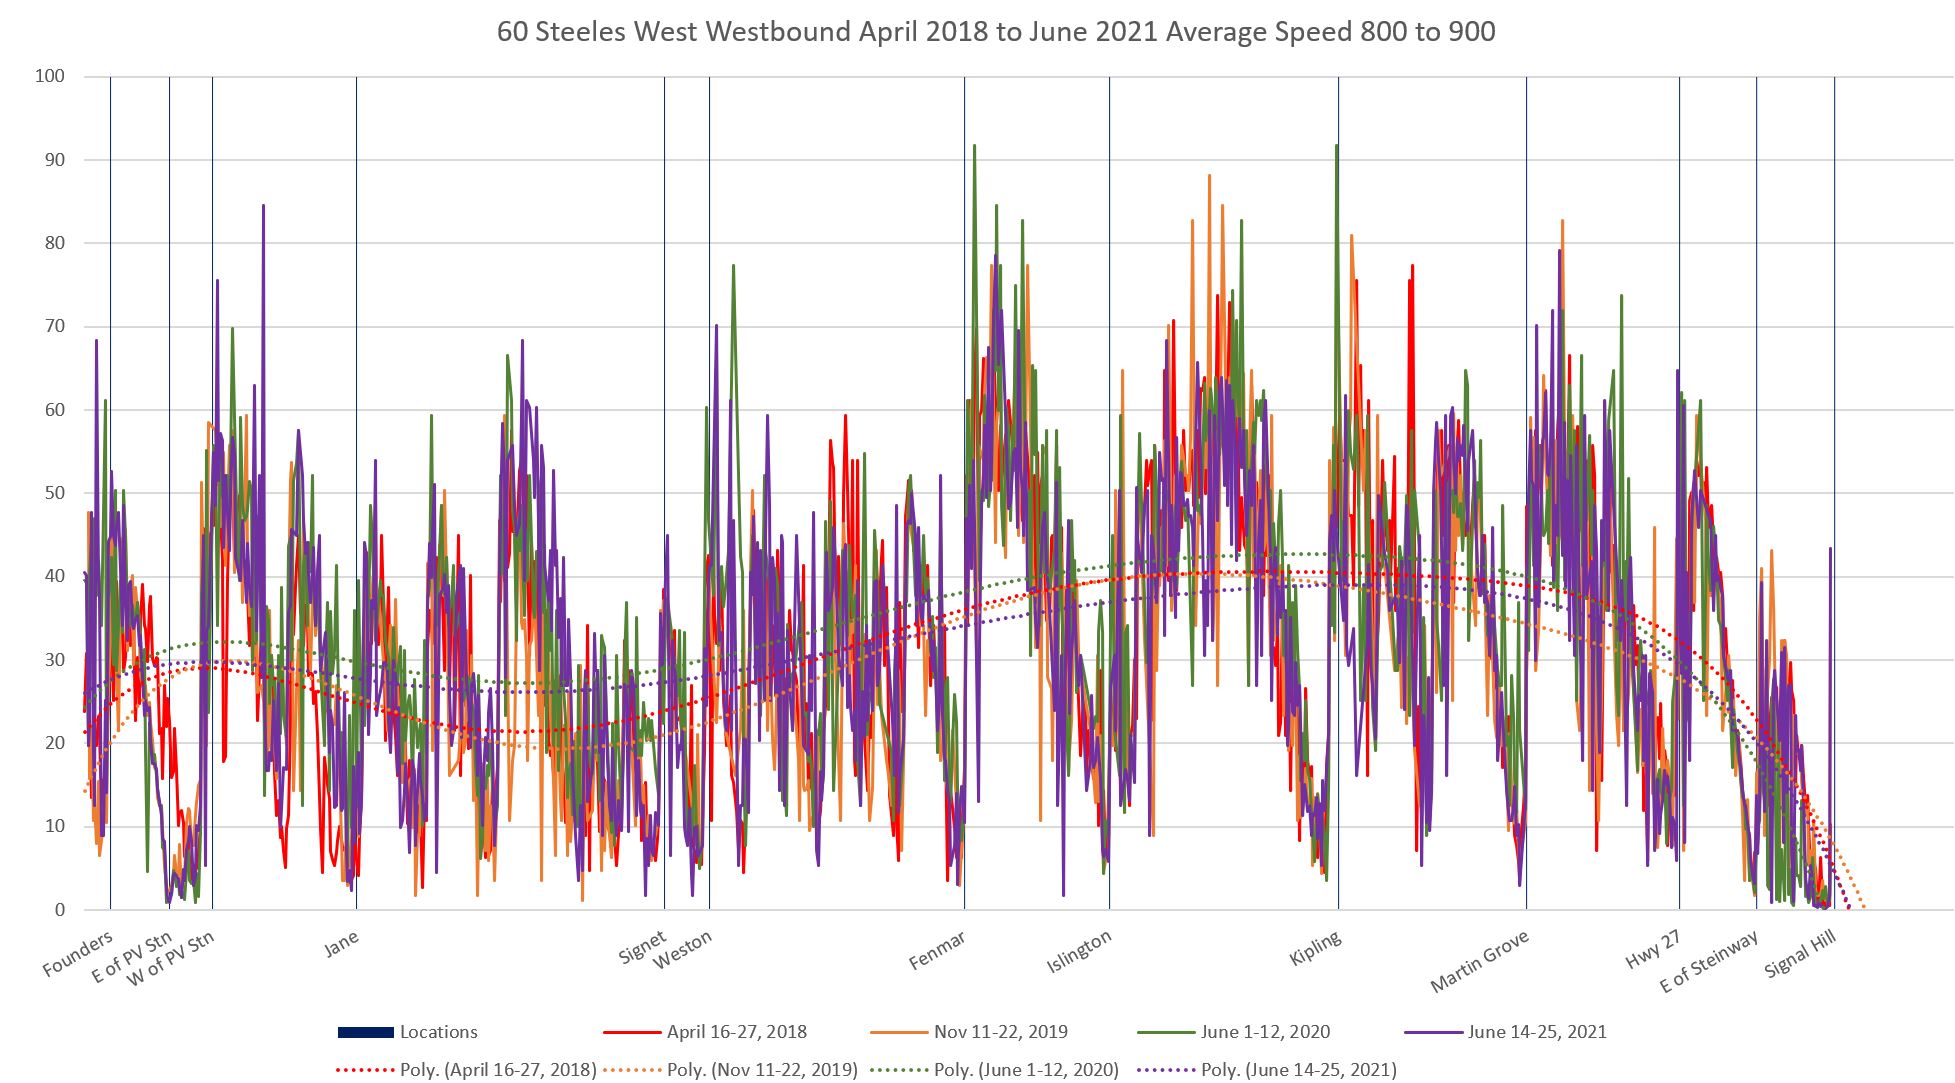
By the noon to 1 PM period the charts are similar except that June 2021 has dropped in the area around Jane Street. This echoes the effect seen in the daily charts above.
In the 5 to 6 pm PM peak, speeds on Steeles westbound are much lower in both the prepandemic era (red and orange lines) and especially in June 2021 where the average speed is quite low all most of the way from Jane to Islington. By contrast, the mid-pandemic values (June 2020, green) show little effect of a “peak” and are down only modestly from their midday equivalent in the chart above.
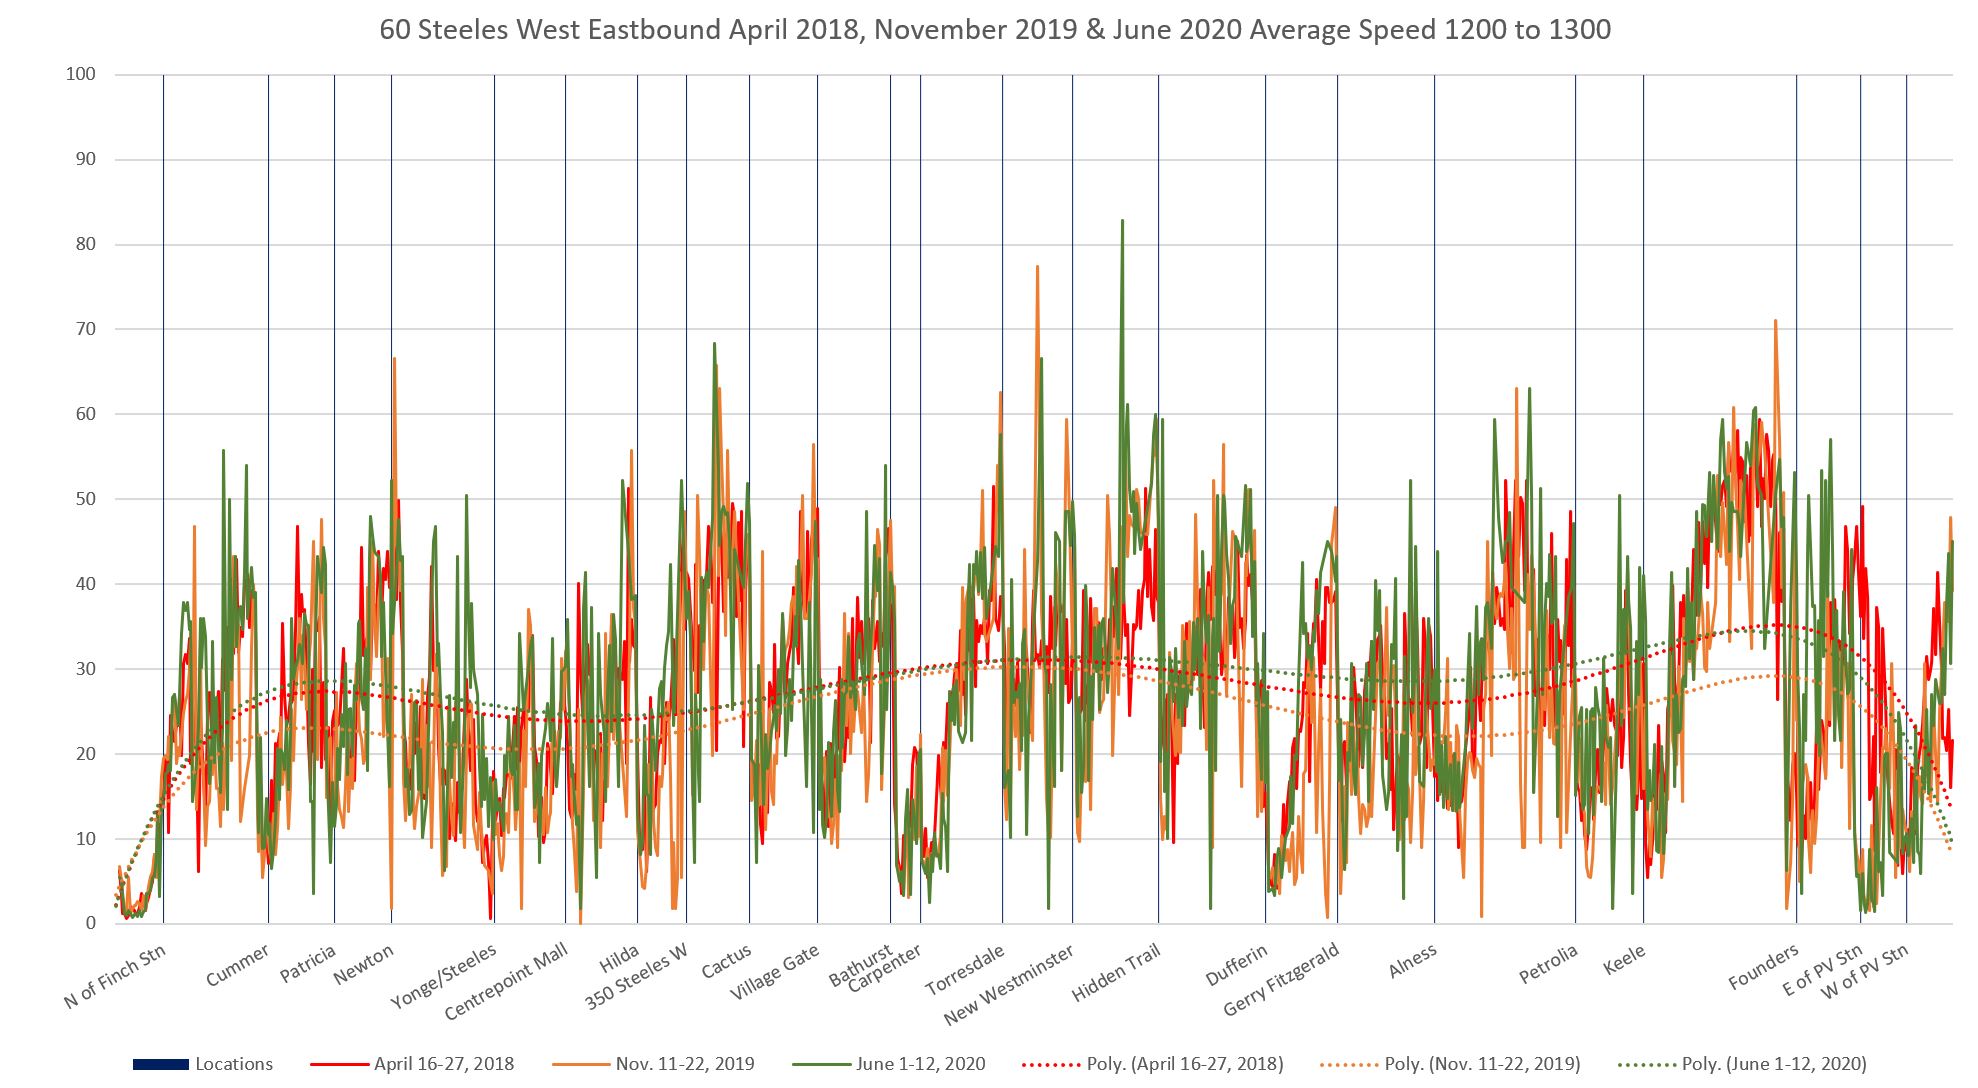
Eastbound toward Pioneer Village Station
The direction of travel is right to left in these charts, and so the speeds drop approaching major stops from the right rather than from the left.
In the 8 to 9 AM peak, slow sections are evident in the November 2019 data (orange) some of which are worse than all other months in this chart. However, congestion approaching Islington is worse in June 2021 (purple) and lies at April 2018 (red) levels. The absence of congestion in mid-2020 is seen in the green line for the same area.
Midday travel speeds for the four months shown are more similar than for the peak periods, except for November 2019 east of Fenmar. Also, the June 2021 speed east of Islington is slower than the other months, but the area of severe congestion (as shown by an extended period where the values are quite low) is not as severe as in the AM peak (above).
In the PM peak, the June 2021 data are particularly bad with an extended area of congestion over much of the central part of the route. Values here are lower than for any other month shown. As above, the green June 2020 line sits above the other reflecting the temporary absence of congestion.
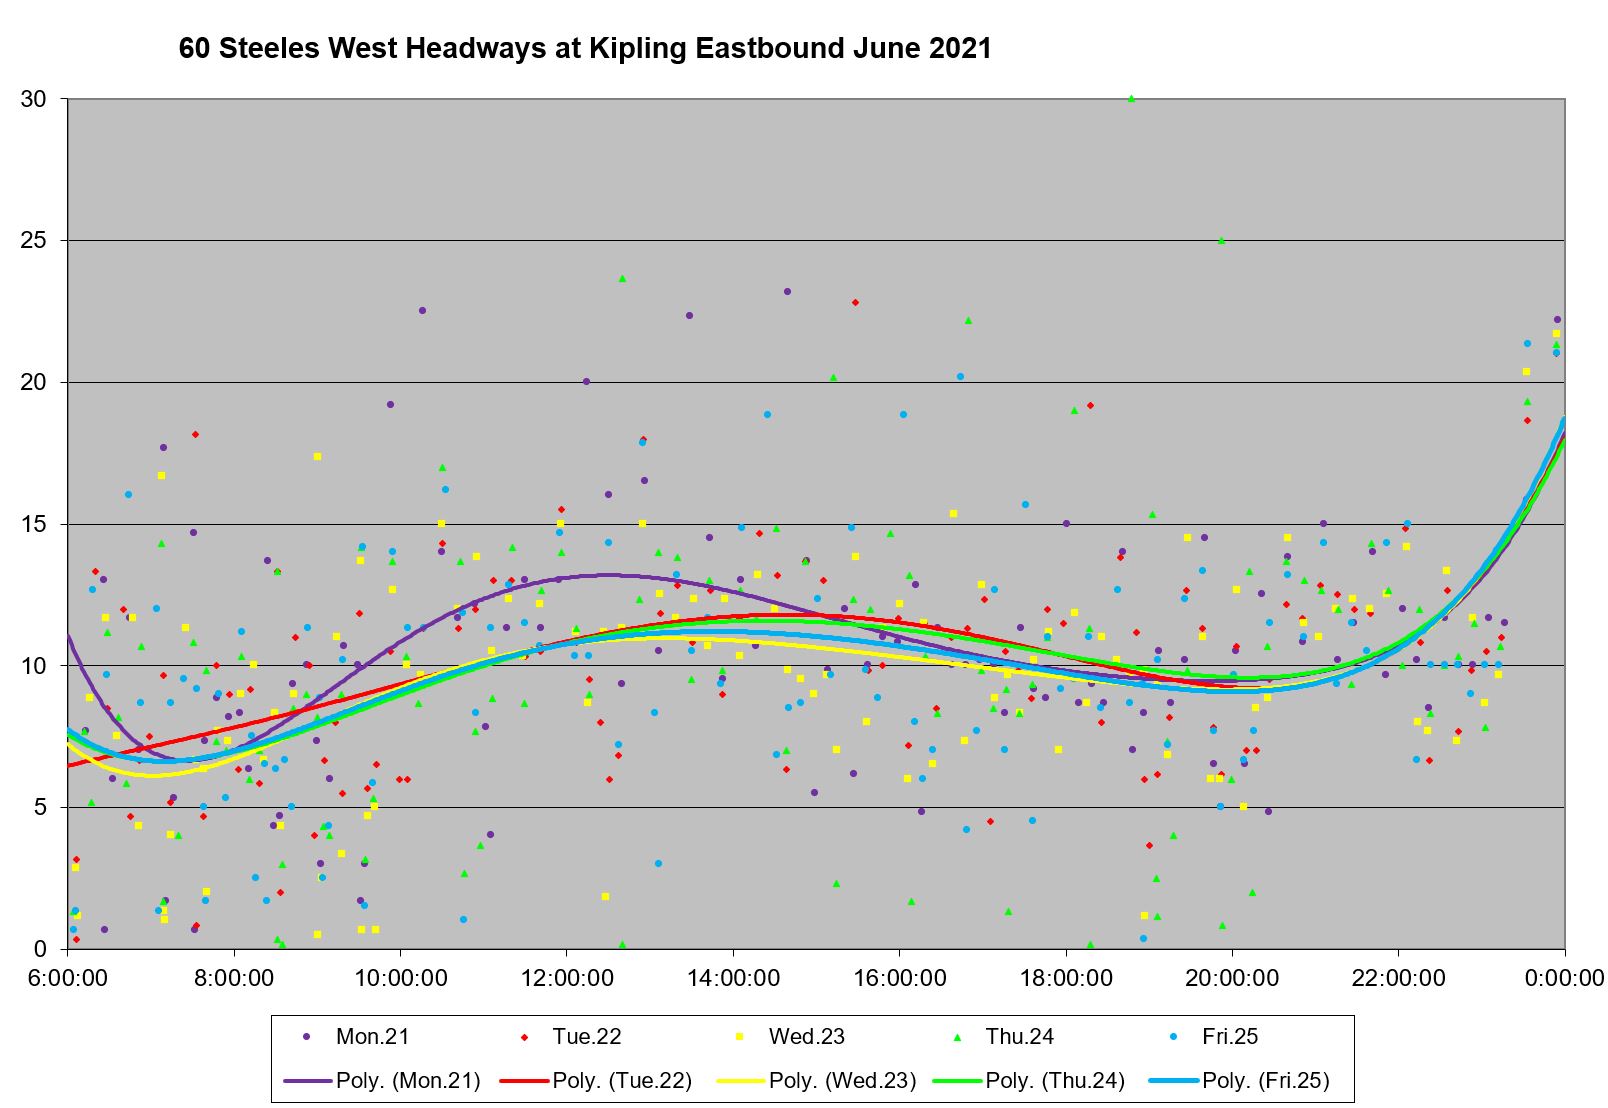
Headway Reliability
This section reviews headways from November 2019, June 2020 and June 2021. Generally speaking, service was not well-regulated, headways were erratic, and bunching/gaps were common. During June 2020 when lighter traffic conditions should have produced better service, the reliability was actually worse.
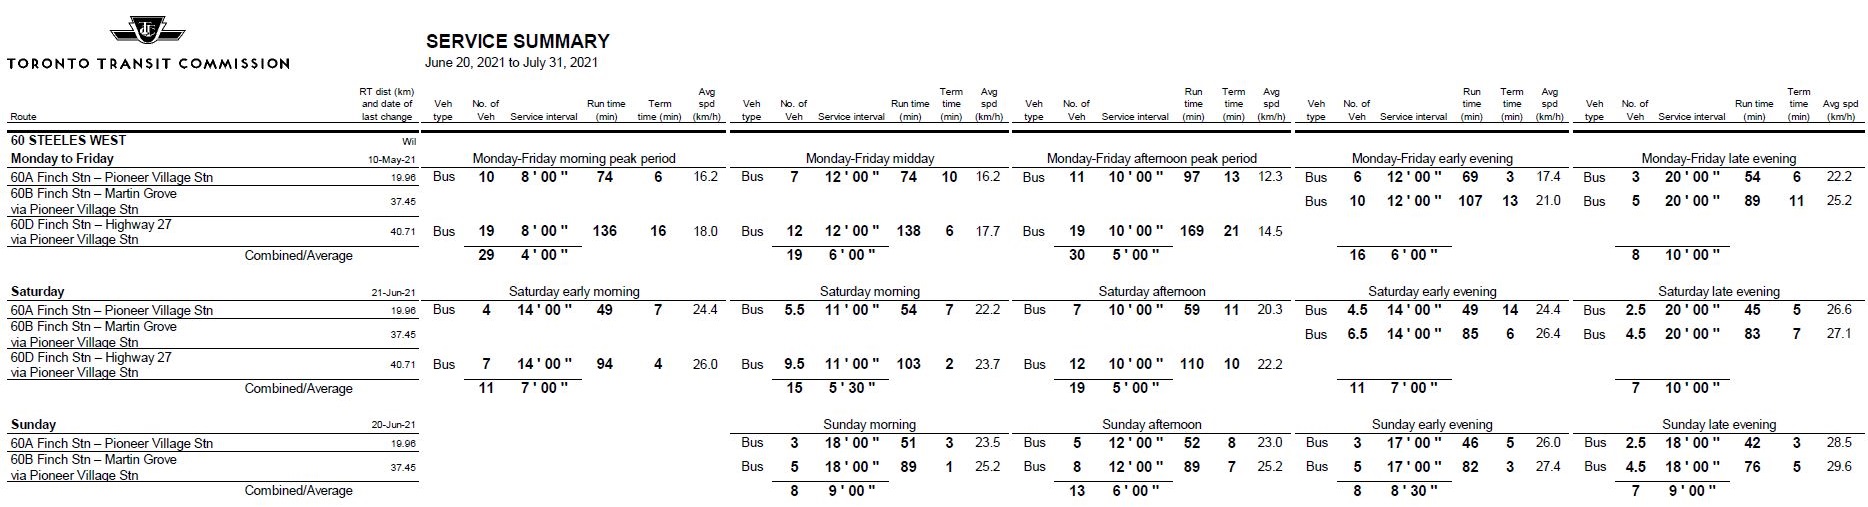
The schedules in effect in late June 2021 are summarized below.

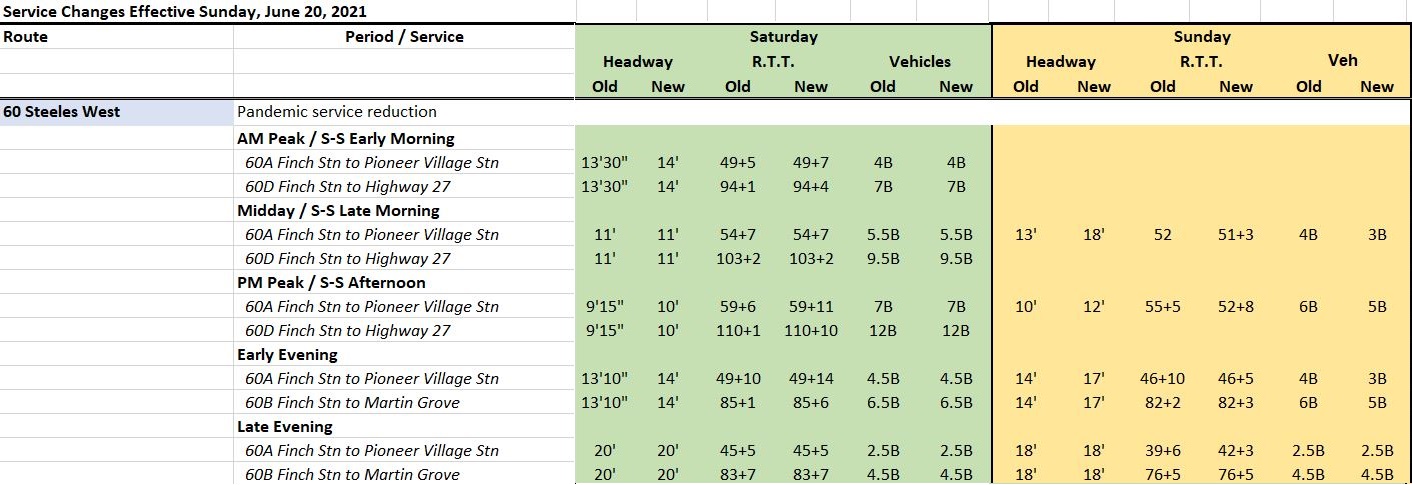
The weekend service was changed on June 20, 2021. Here is a summary of the changes.
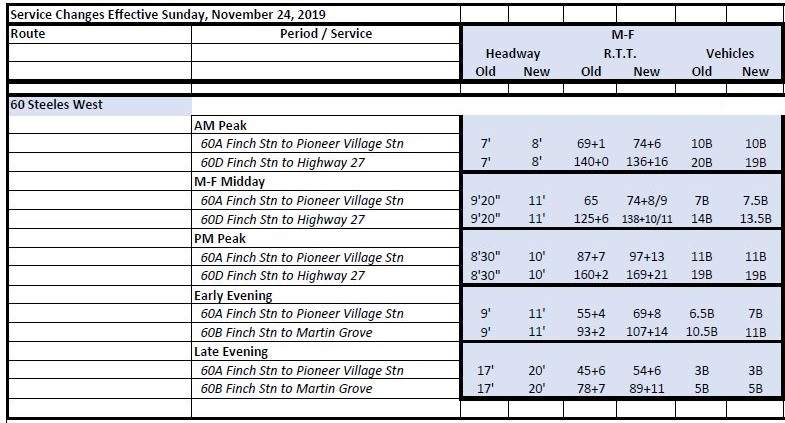
Back in November 2019, there was a weekday service change intended to improve route reliability by stretching the running times. Scheduled service fell by 12 to 15 per cent although, allegedly the result was more reliable service.
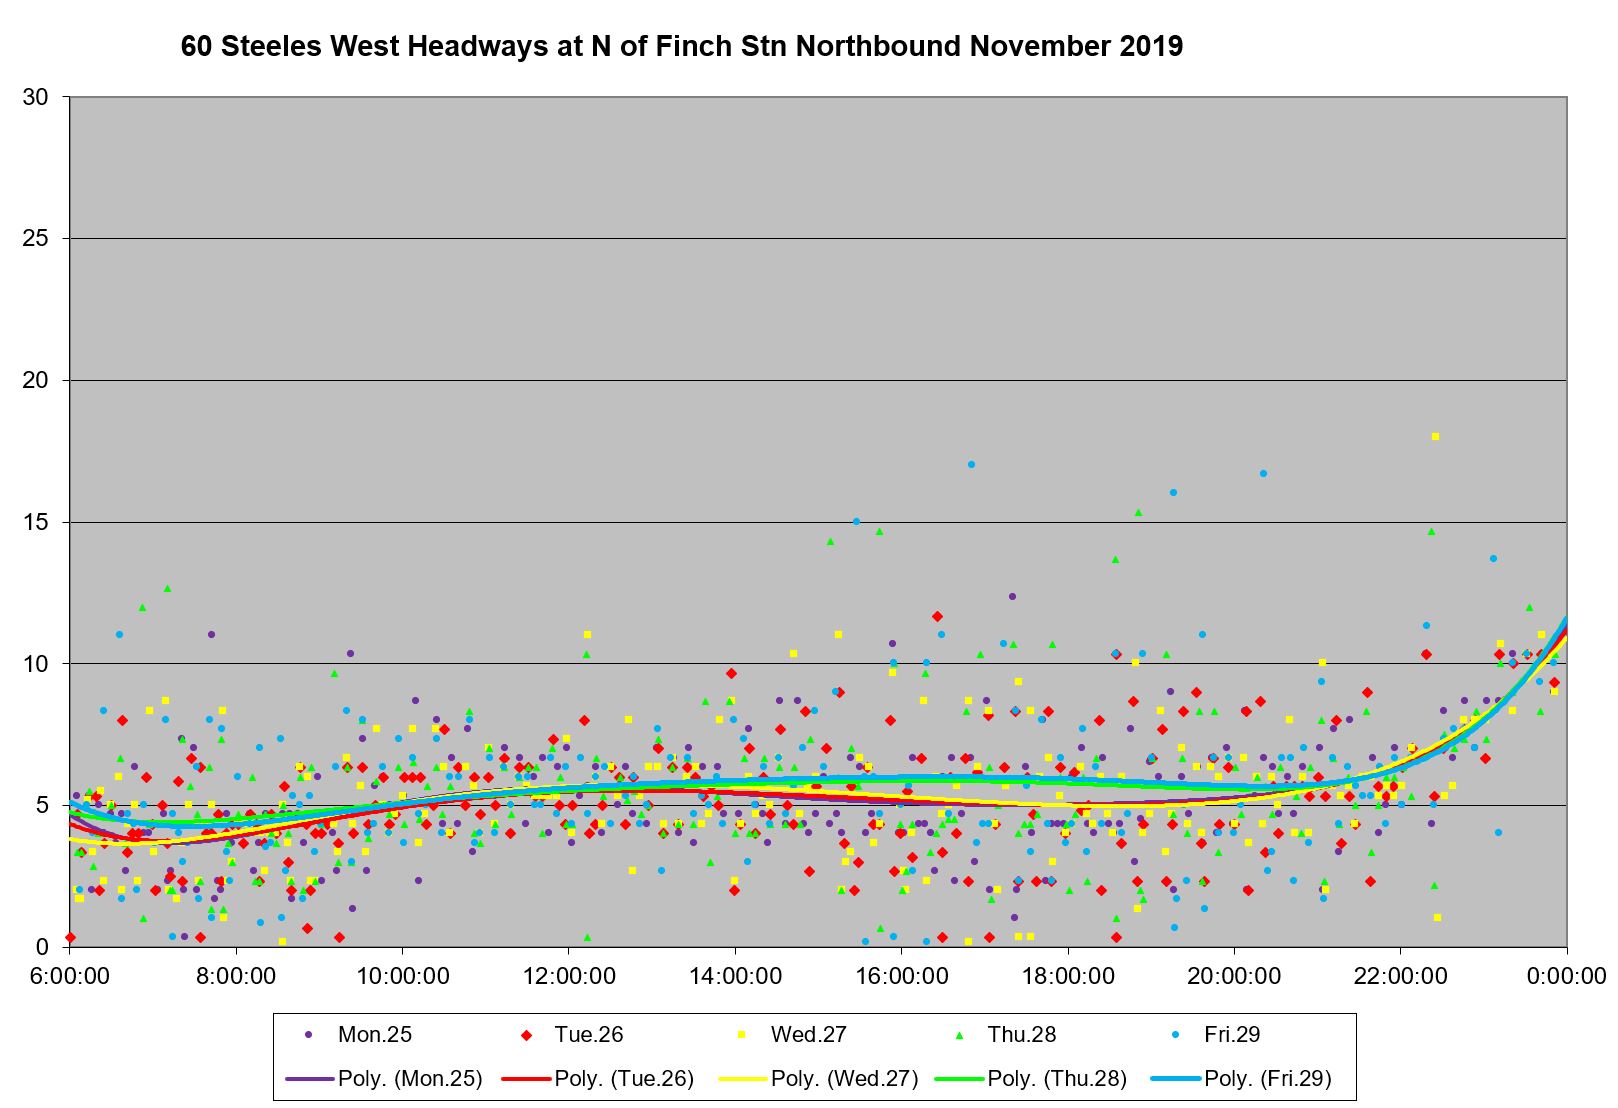
Service Northbound from Finch Station
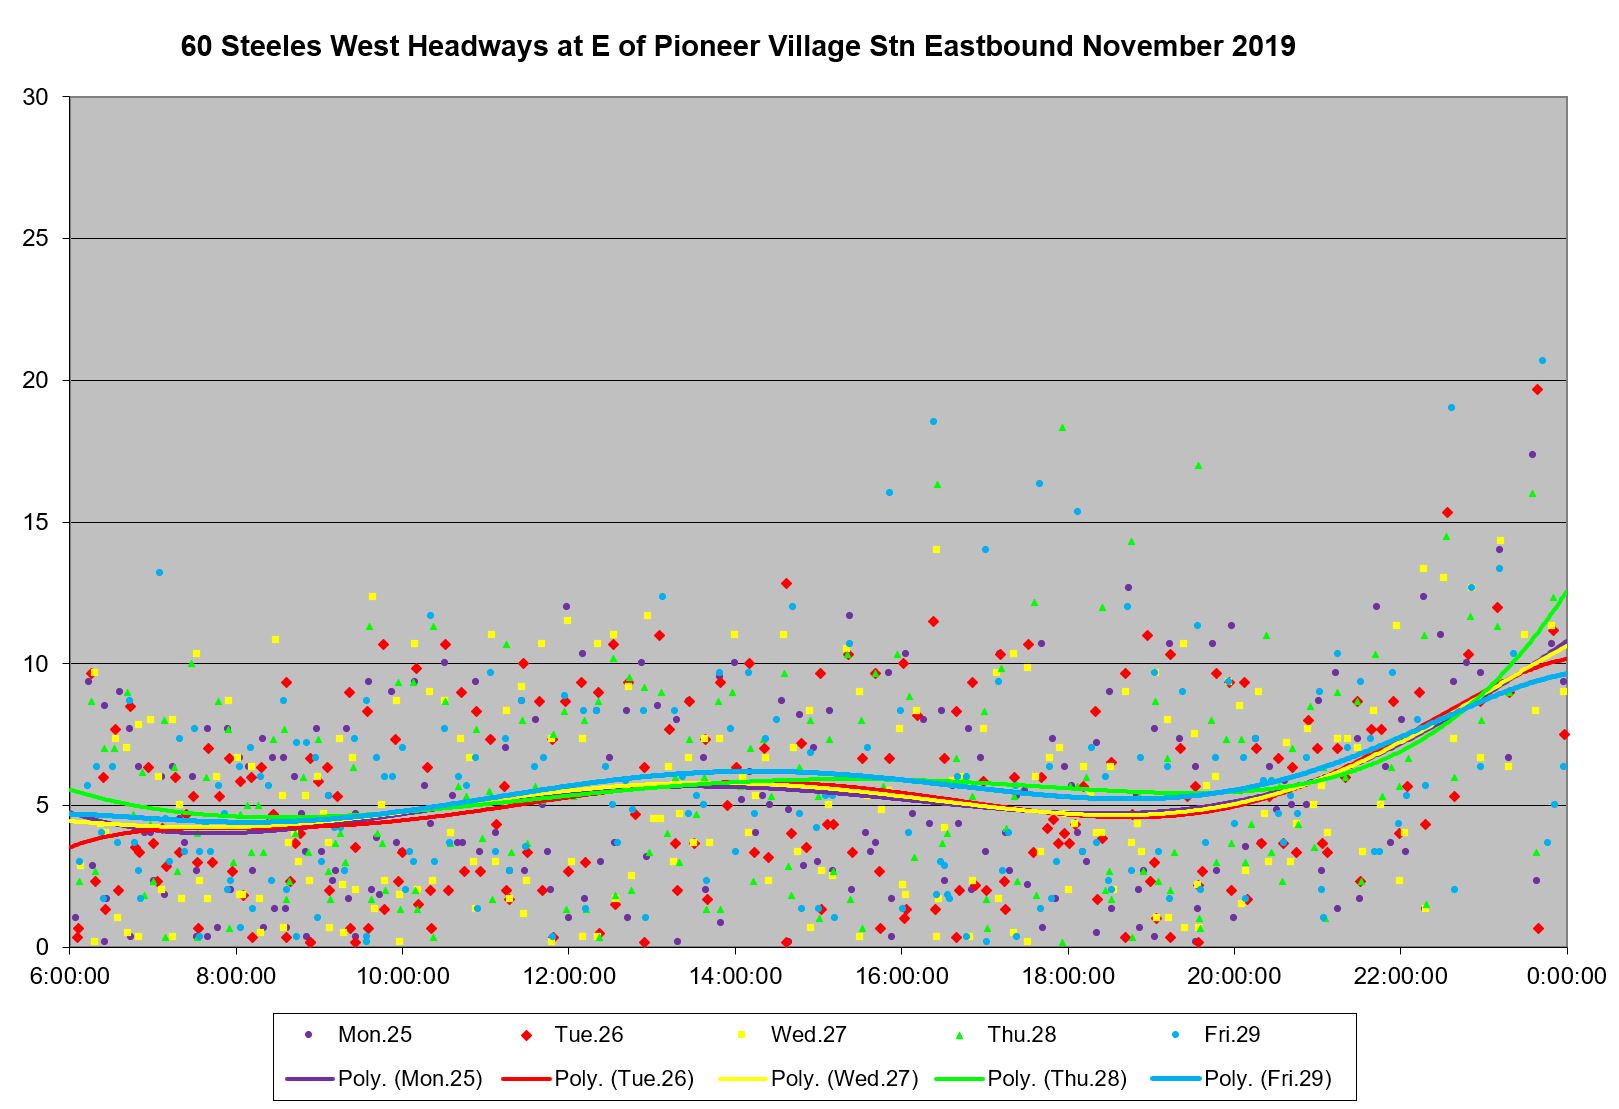
In early November 2019, service from Finch Station on 60 Steeles West was disrupted by a diversion of service off of Yonge Street onto Willowdale Ave. However for week 4, which operated on the new schedule, all service ran via Yonge. Here is a chart of the actual headways leaving Finch Station. There is some bunching in the peak periods although mid-day headways are clustered within a few minutes of the trend line through the values (roughly equivalent to the scheduled headway).
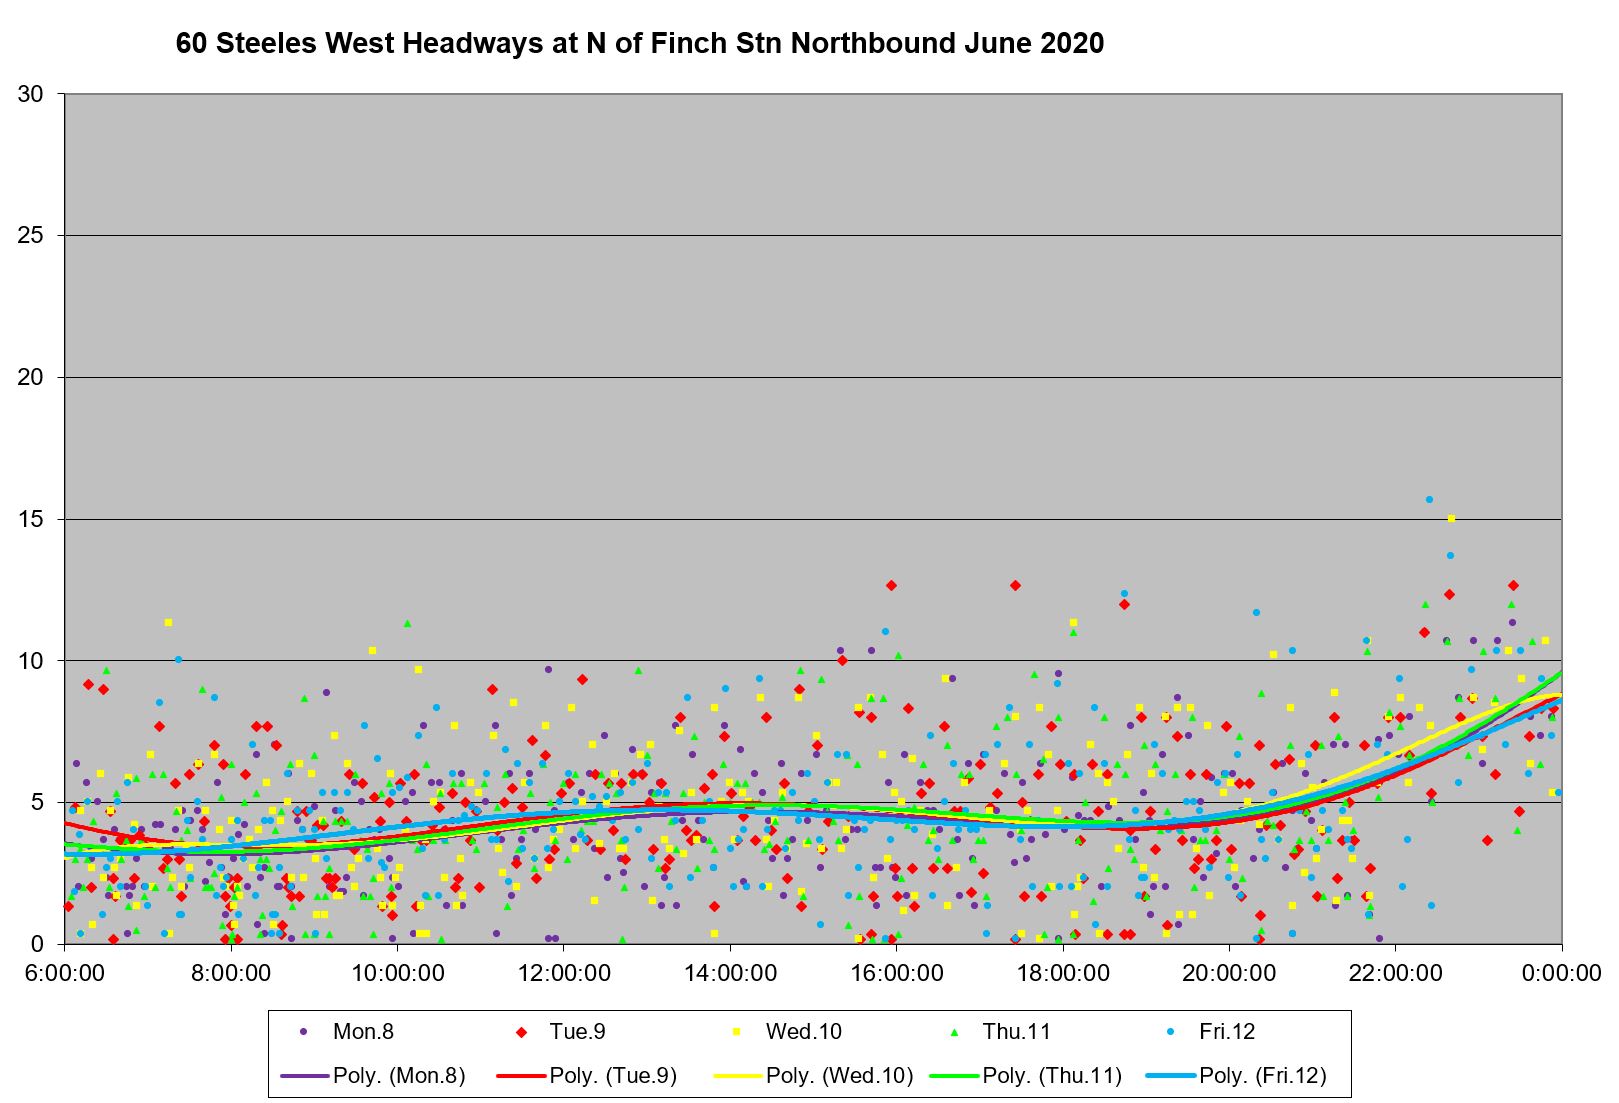
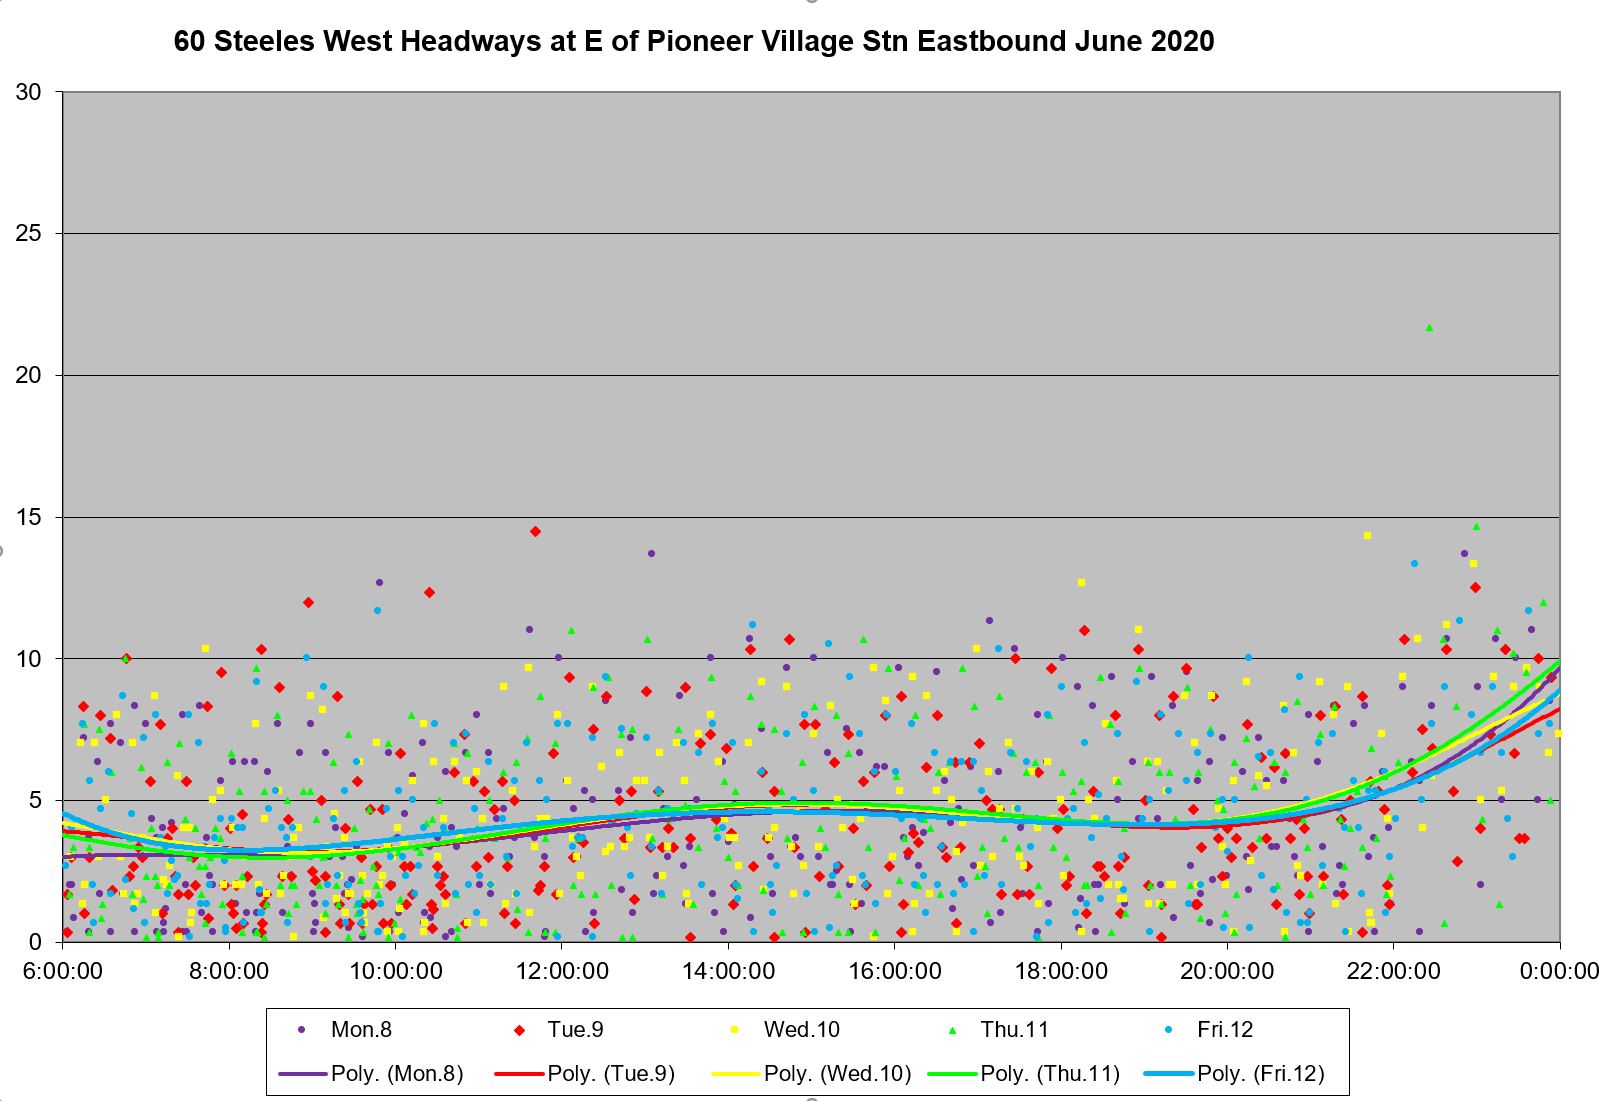
By June 2020 when interference from traffic congestion was much lighter than normal, bunching is much more common as shown by the number of data points at or close to the horizontal axis. Headways are scattered across a ten-minute range all day long even with ideal conditions for travel on the route.
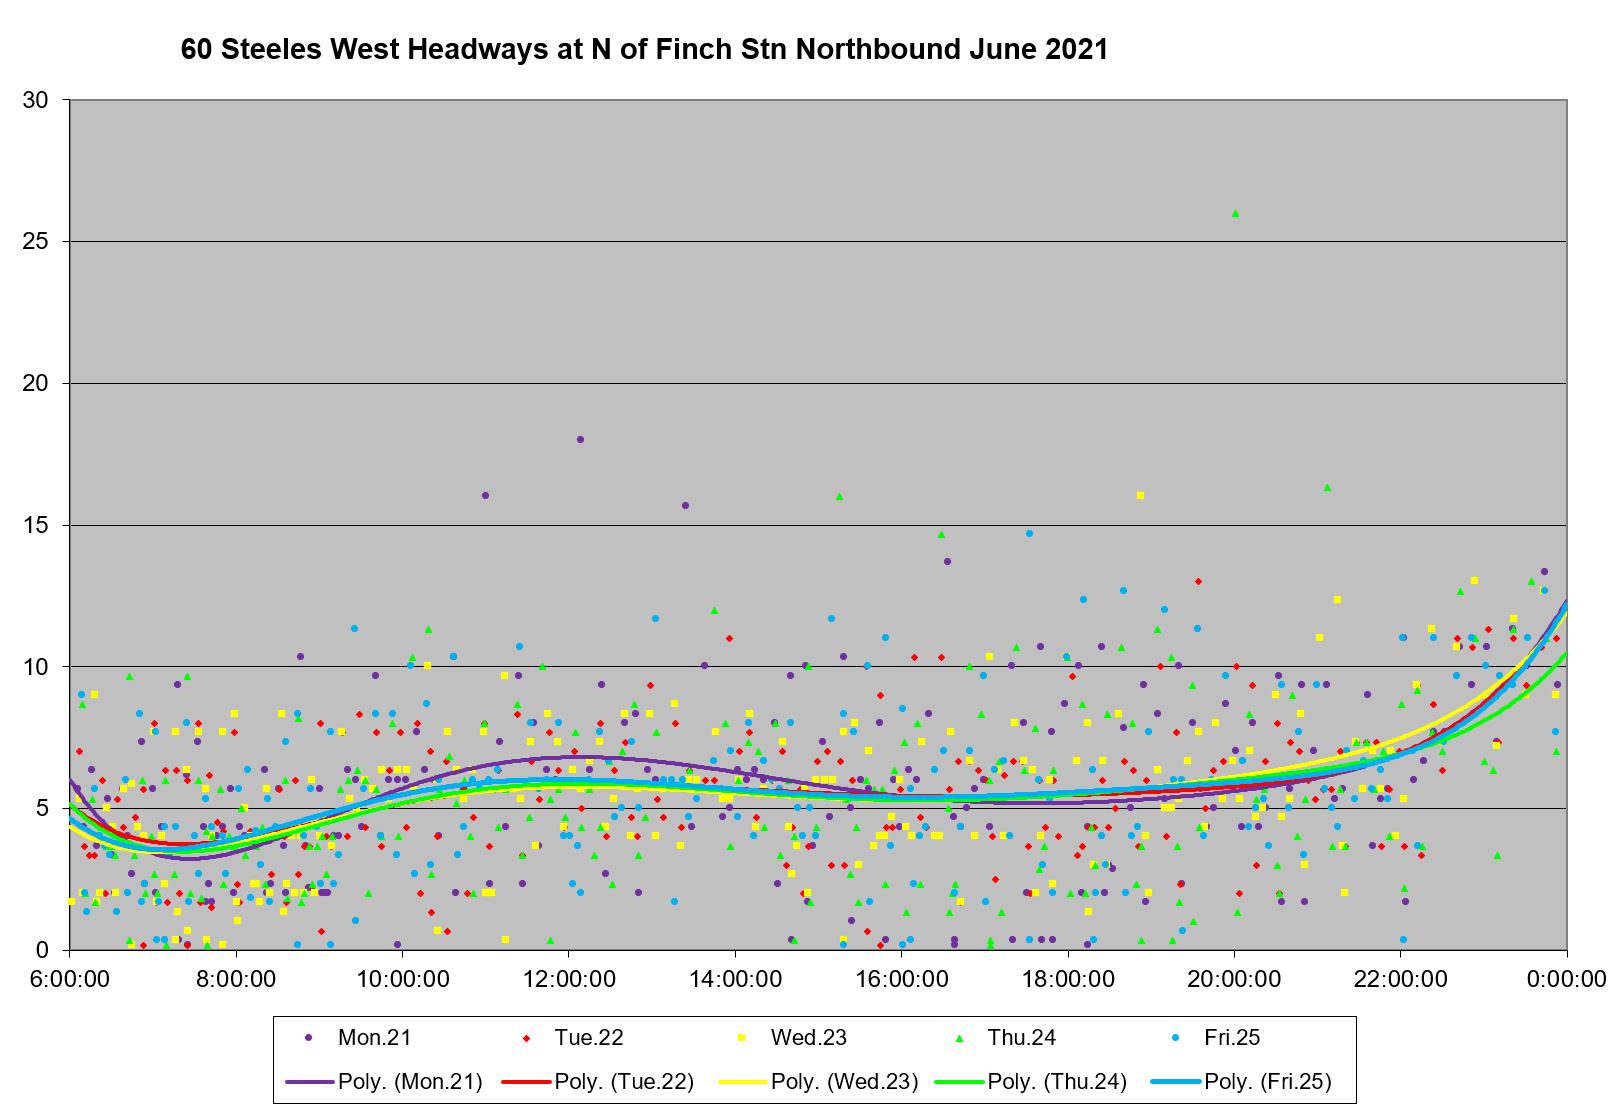
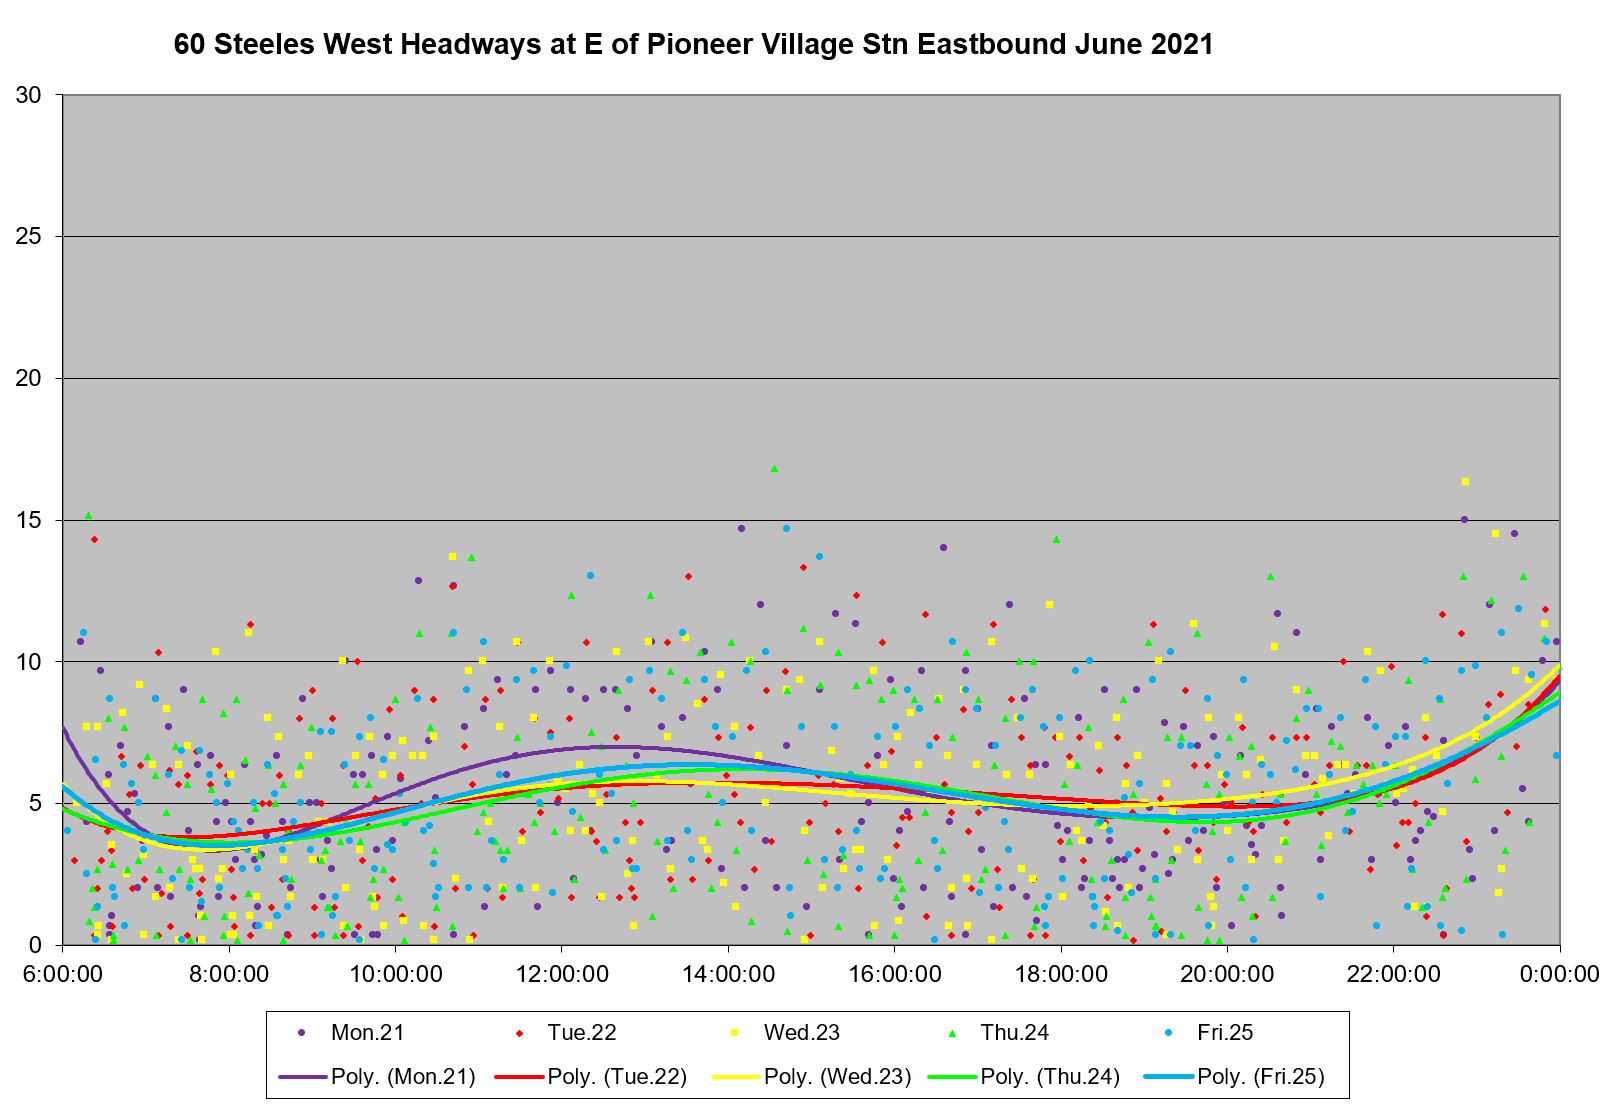
In June 2021, the pattern with bunching continues although not as badly as in 2020.
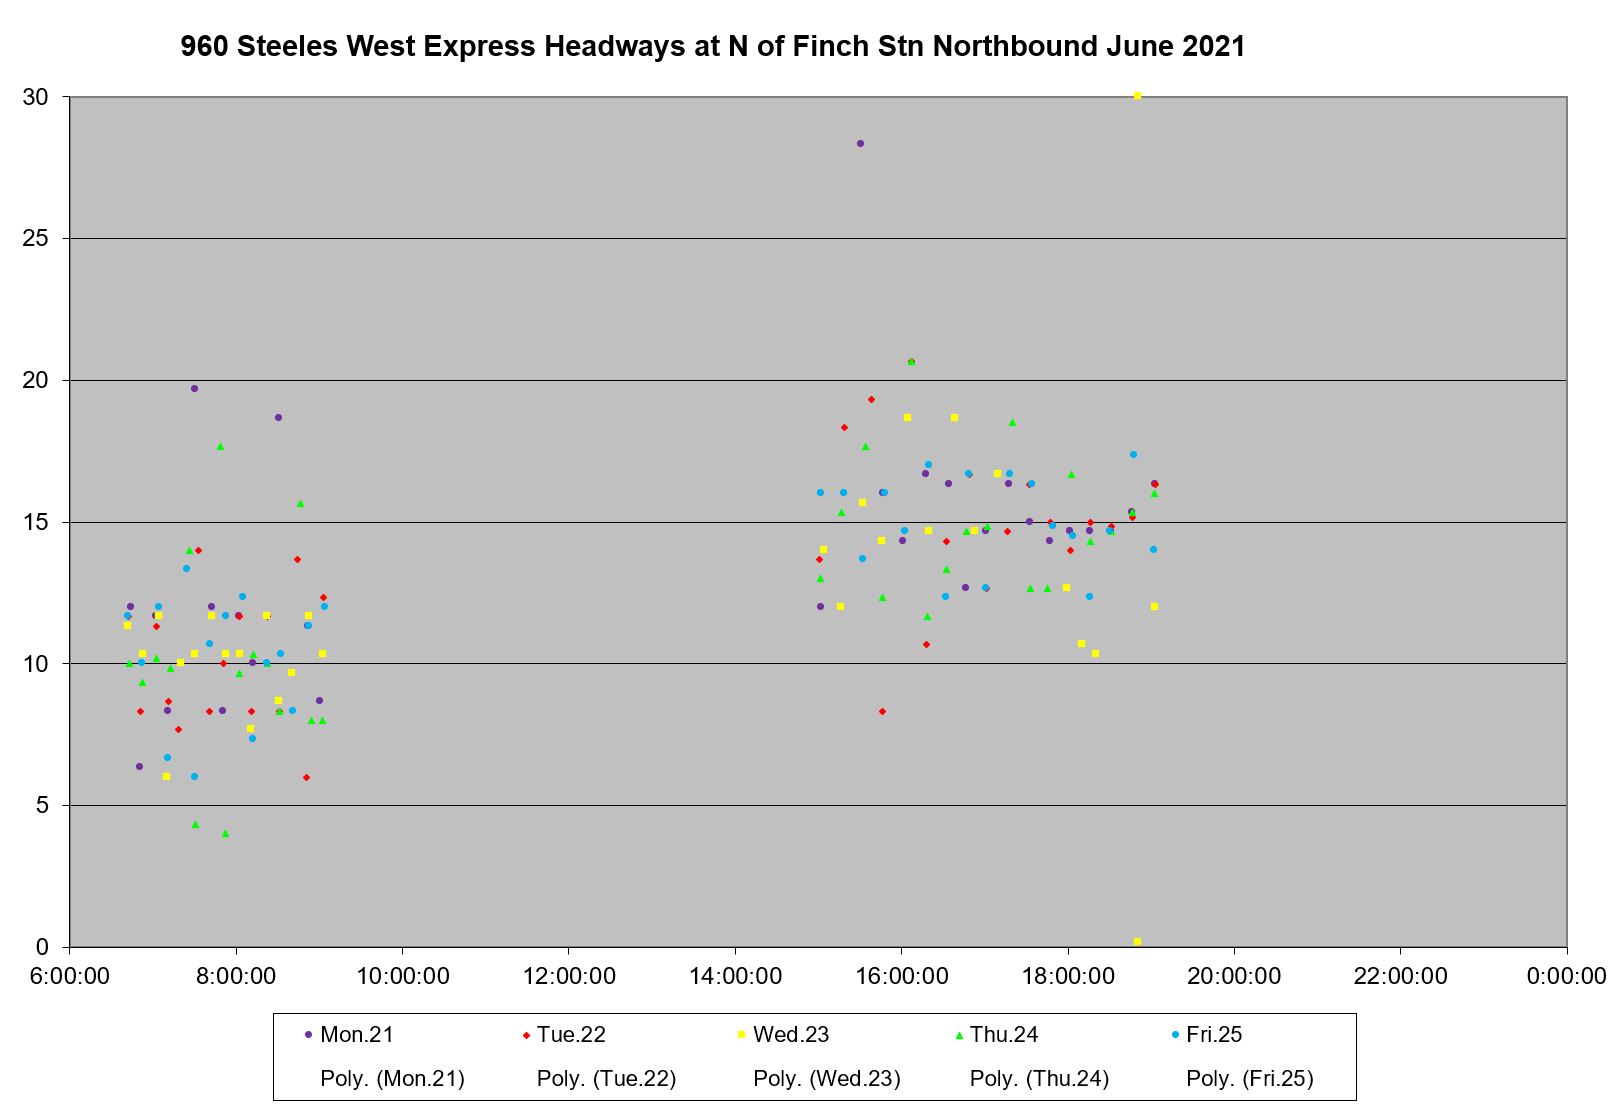
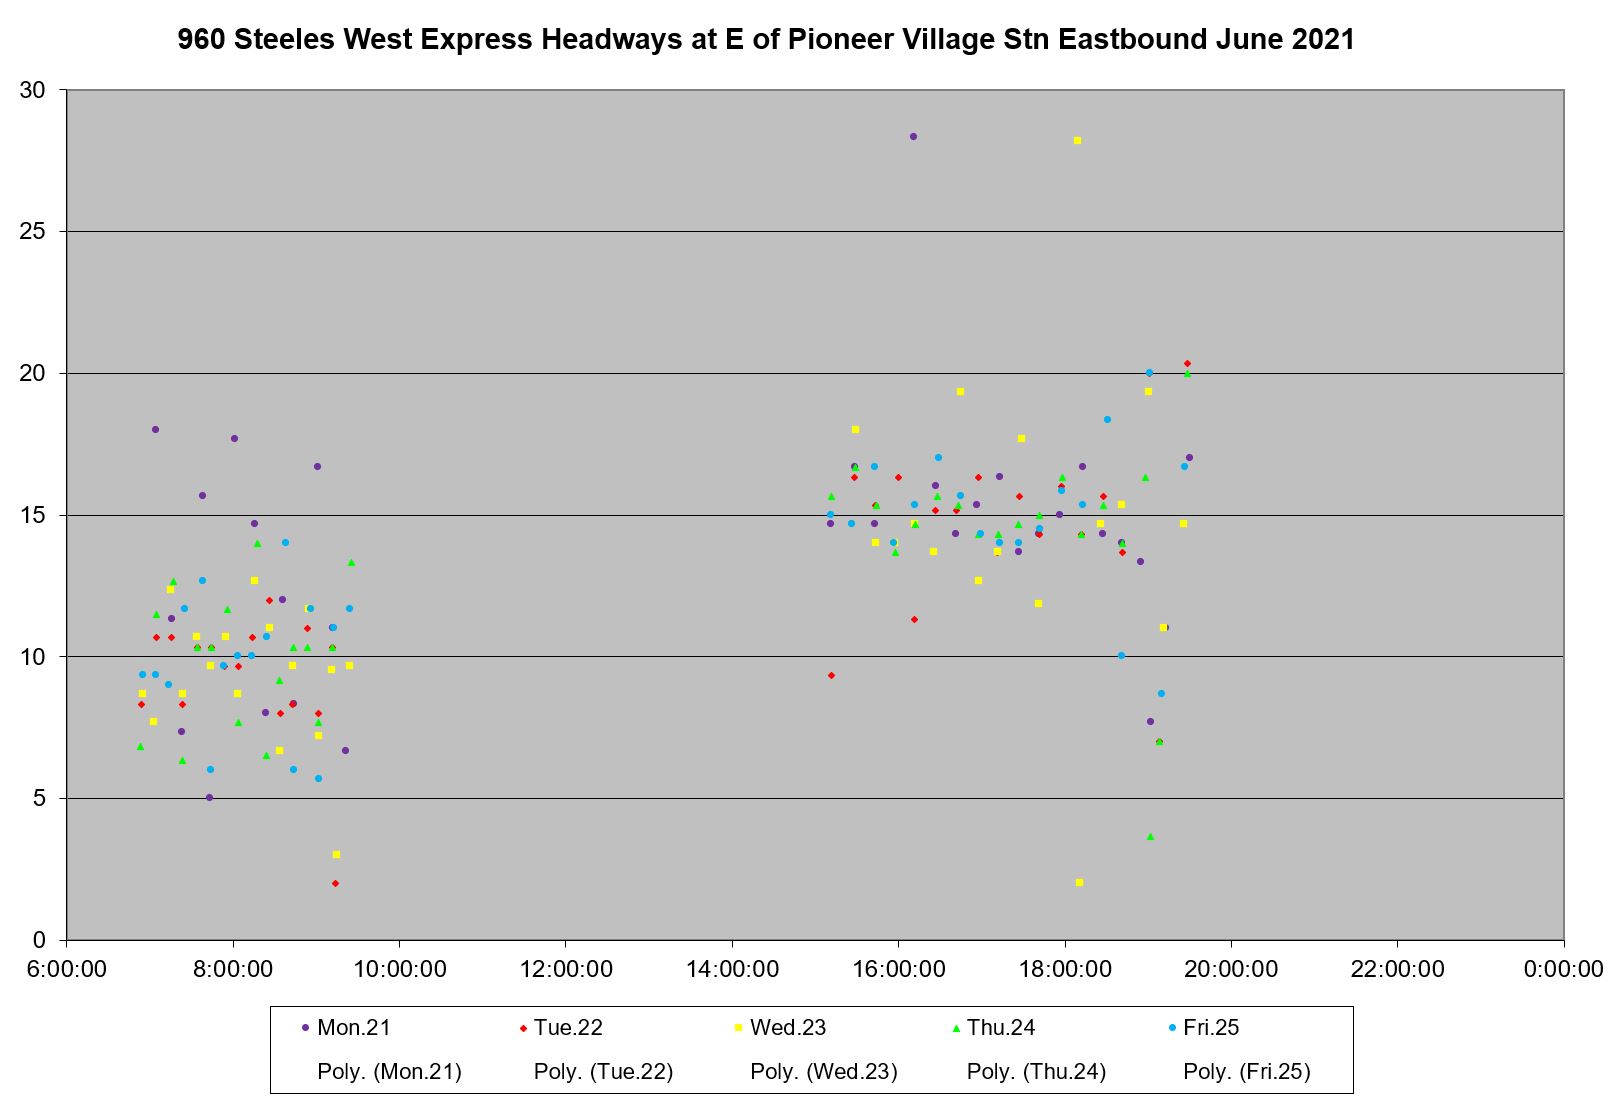
The 960 Steeles West Express service does not show much bunching because of its wider scheduled headway, but even so, headways are distributed over a nearly 10 minute range.
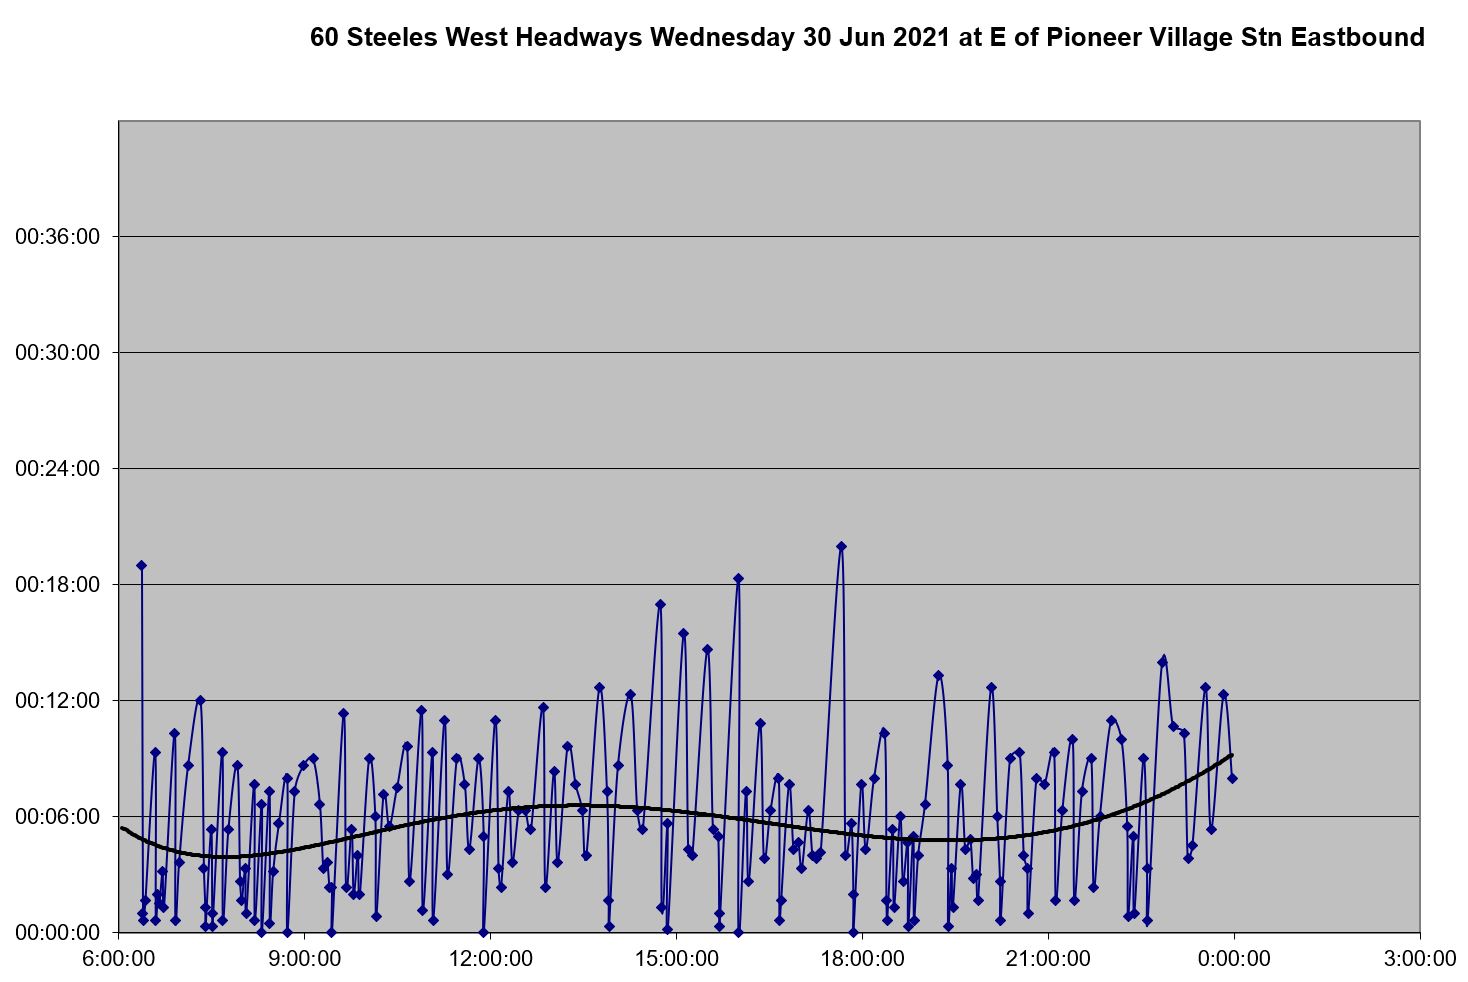
Eastbound from Pioneer Village Station
The service eastbound from Pioneer Village Station suffers from the problem of all branching services in that the merge of inbound trips is quite random. On some routes, this occurs on street (for example, the 54A/54B Lawrence East services), but on Steeles this happens at an off-street terminal. There is little excuse for being unable to dispatch a consistent headway from this point eastward.
In November 2019, bunching and wide headways were common even though the data are from week 4 when a new schedule was supposed to improve service reliability.
By June 2020 with much less competition from road traffic, the situation had not changed at all.
June 2021 shows a similar pattern, and if anything the “cloud” of data values is beginning to expand.
960 Express trips originate at Pioneer Village Station, but even so their headways are scattered over a band about 10 minutes wide.
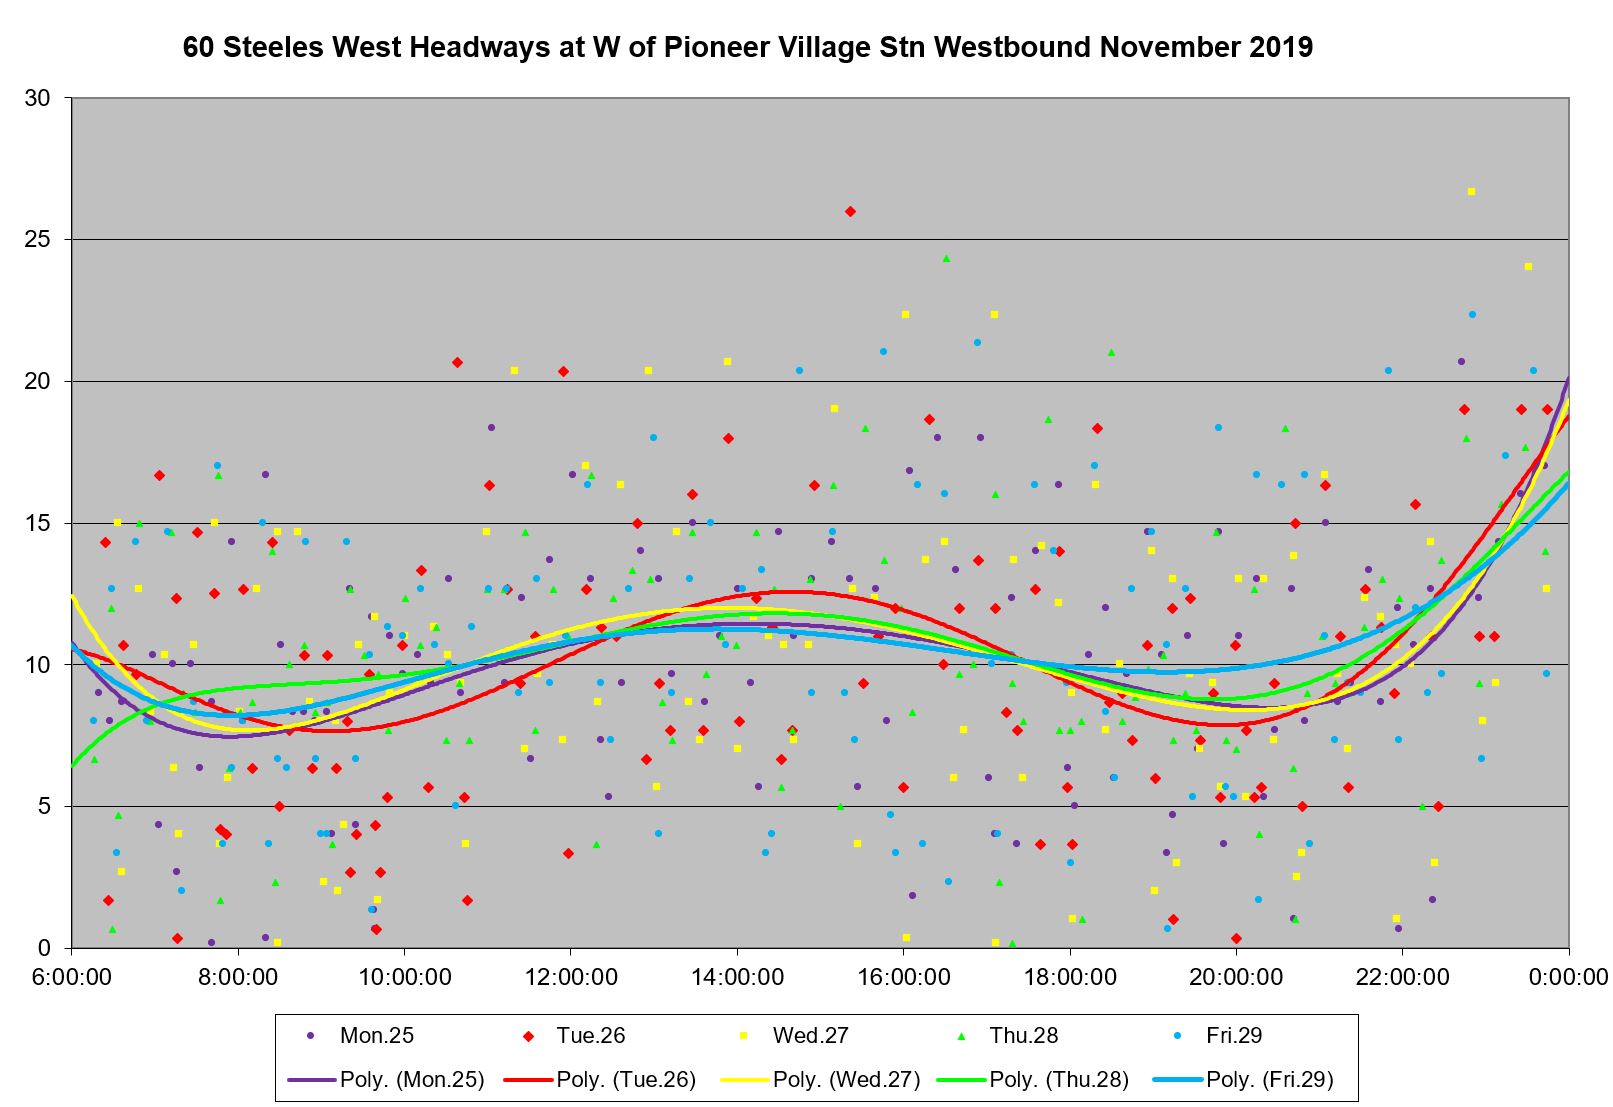
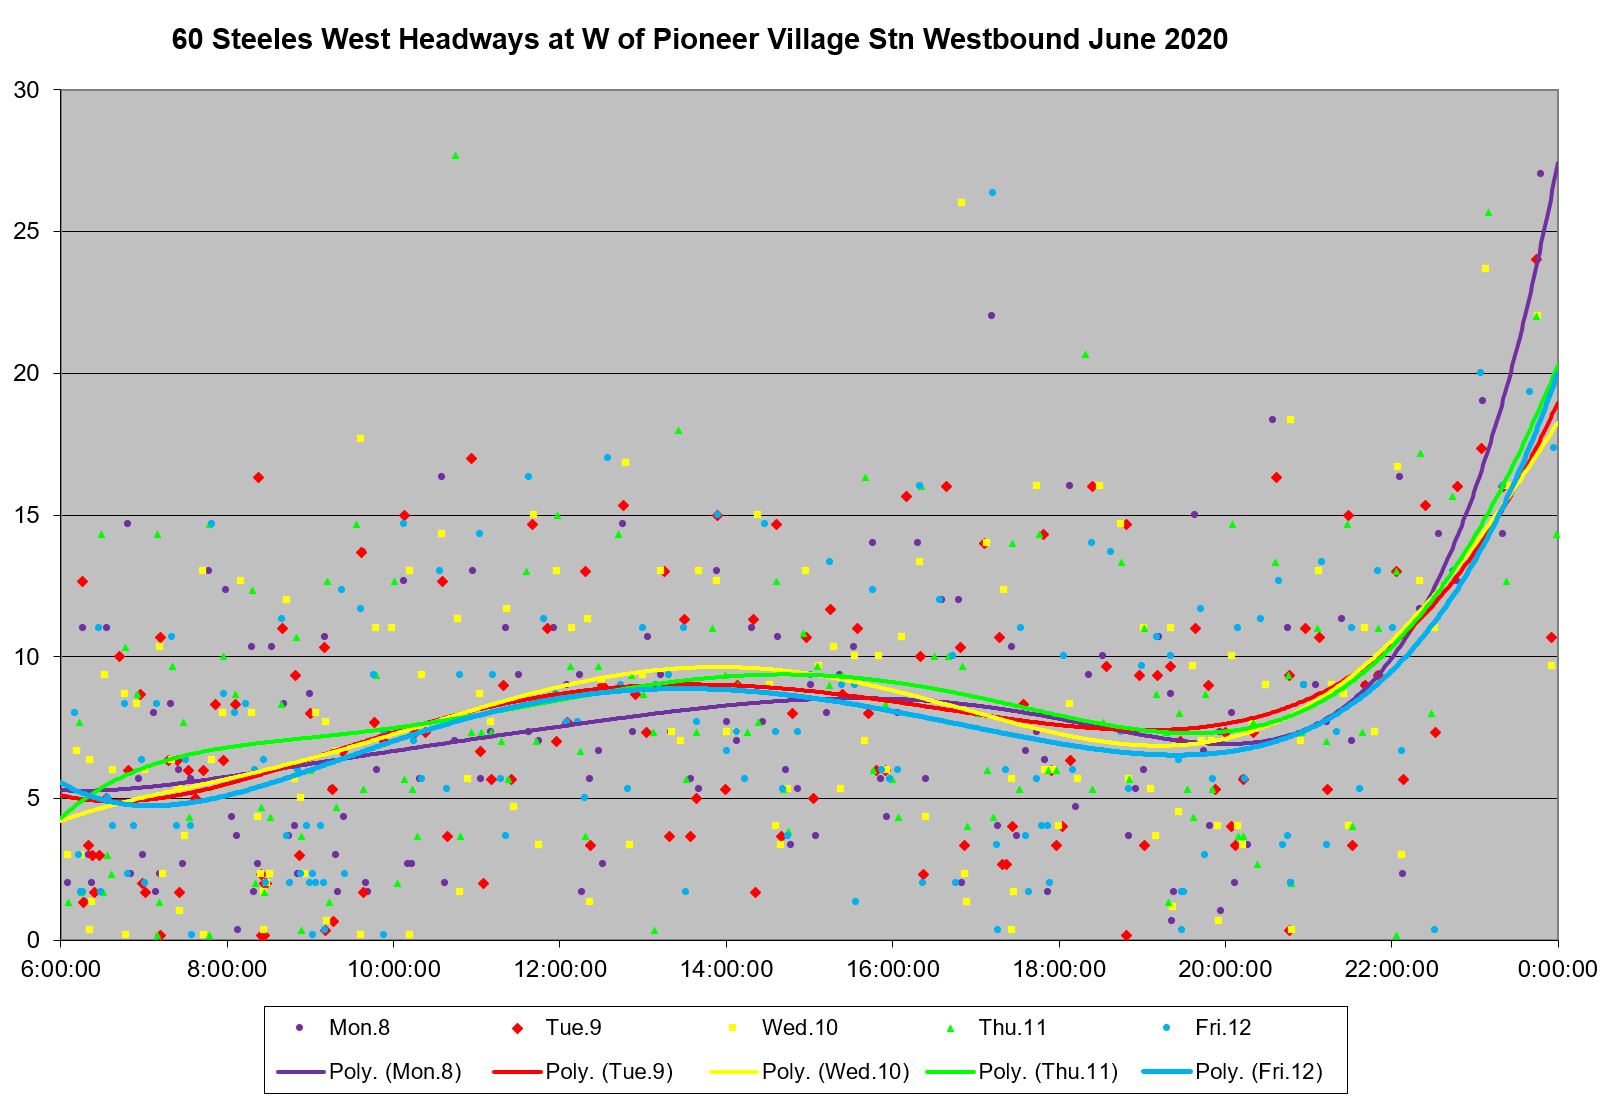
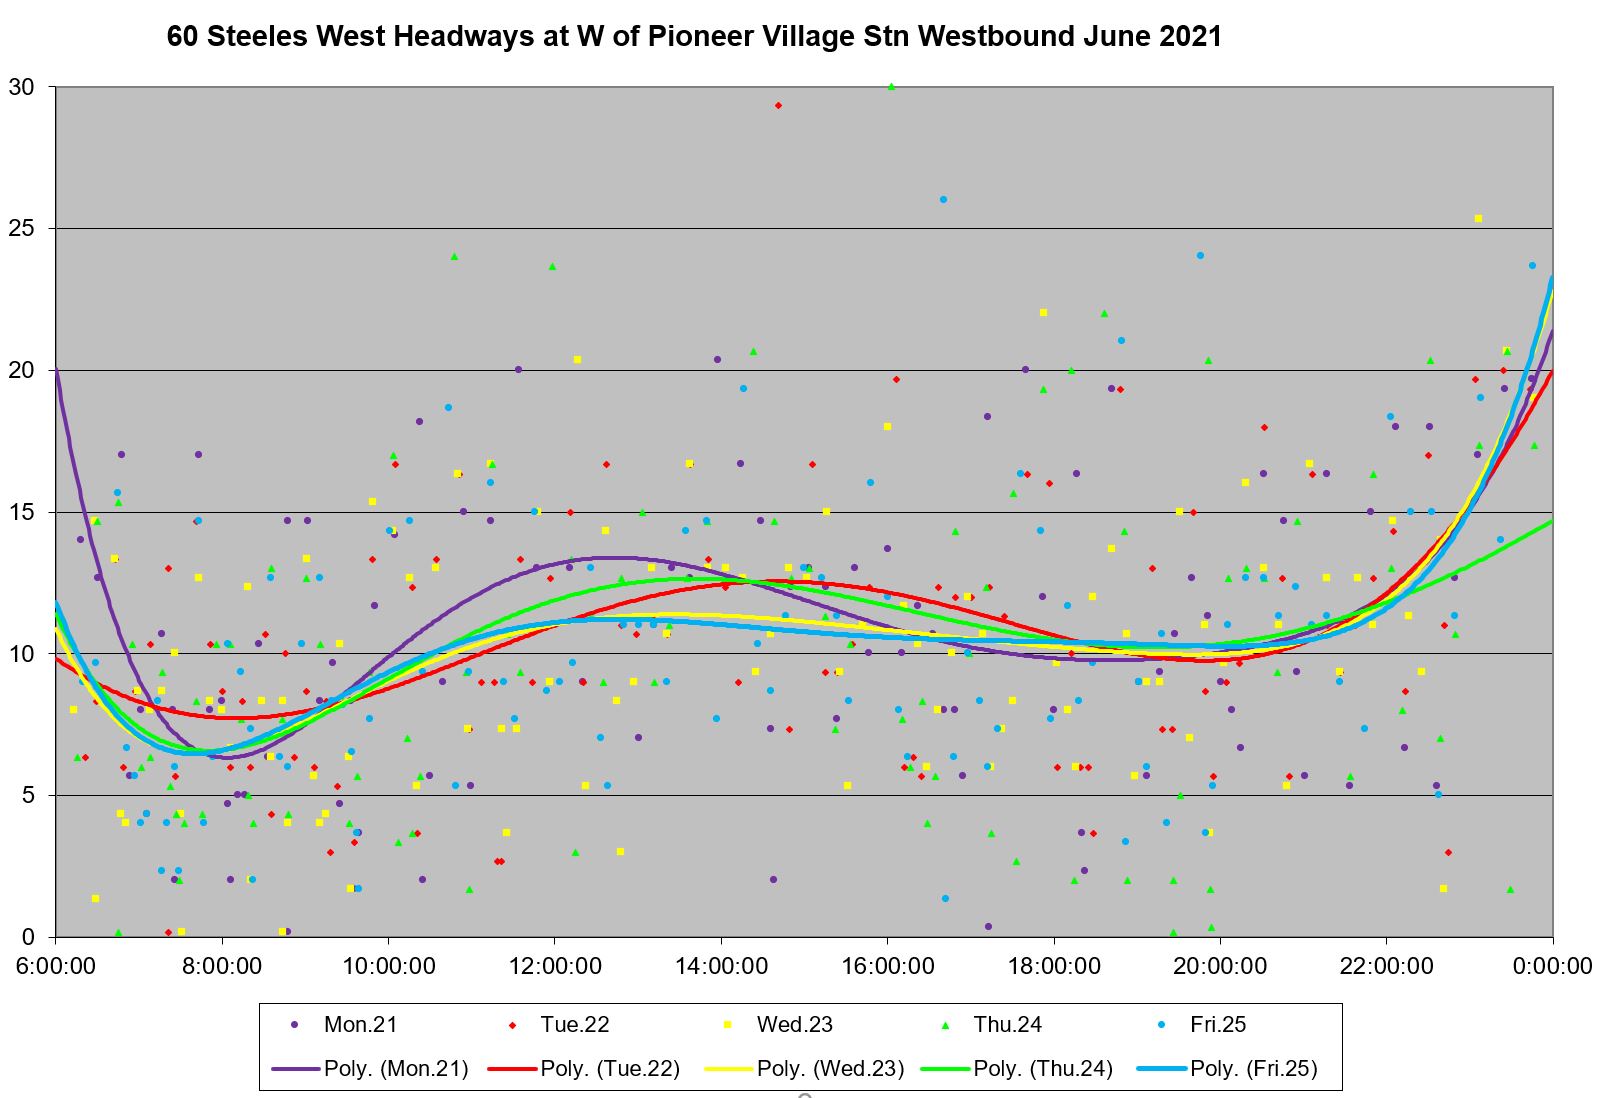
Westbound from Pioneer Village Station
West of Pioneer Village Station, there is only half as much local service and no express buses as compared to the segment to the east.
In November 2019, the headway values are scattered across a band 15 to 20 minutes wide. There is no way this can be described as a “reliable” service. As with eastbound service, this should be a location where buses can be dispatched more or less reliably, but clear that was not the case.
In June 2020, with better traffic conditions, the scatter in headways is a bit improved from November 2019, but the bad is still 15 minutes wide all day with any buses running nose-to-tail on what is supposed to be a service of medium frequency.
In June 2021, the situation was more or less back to the 2019 quality with a 20 minute wide band of headway values all day long.
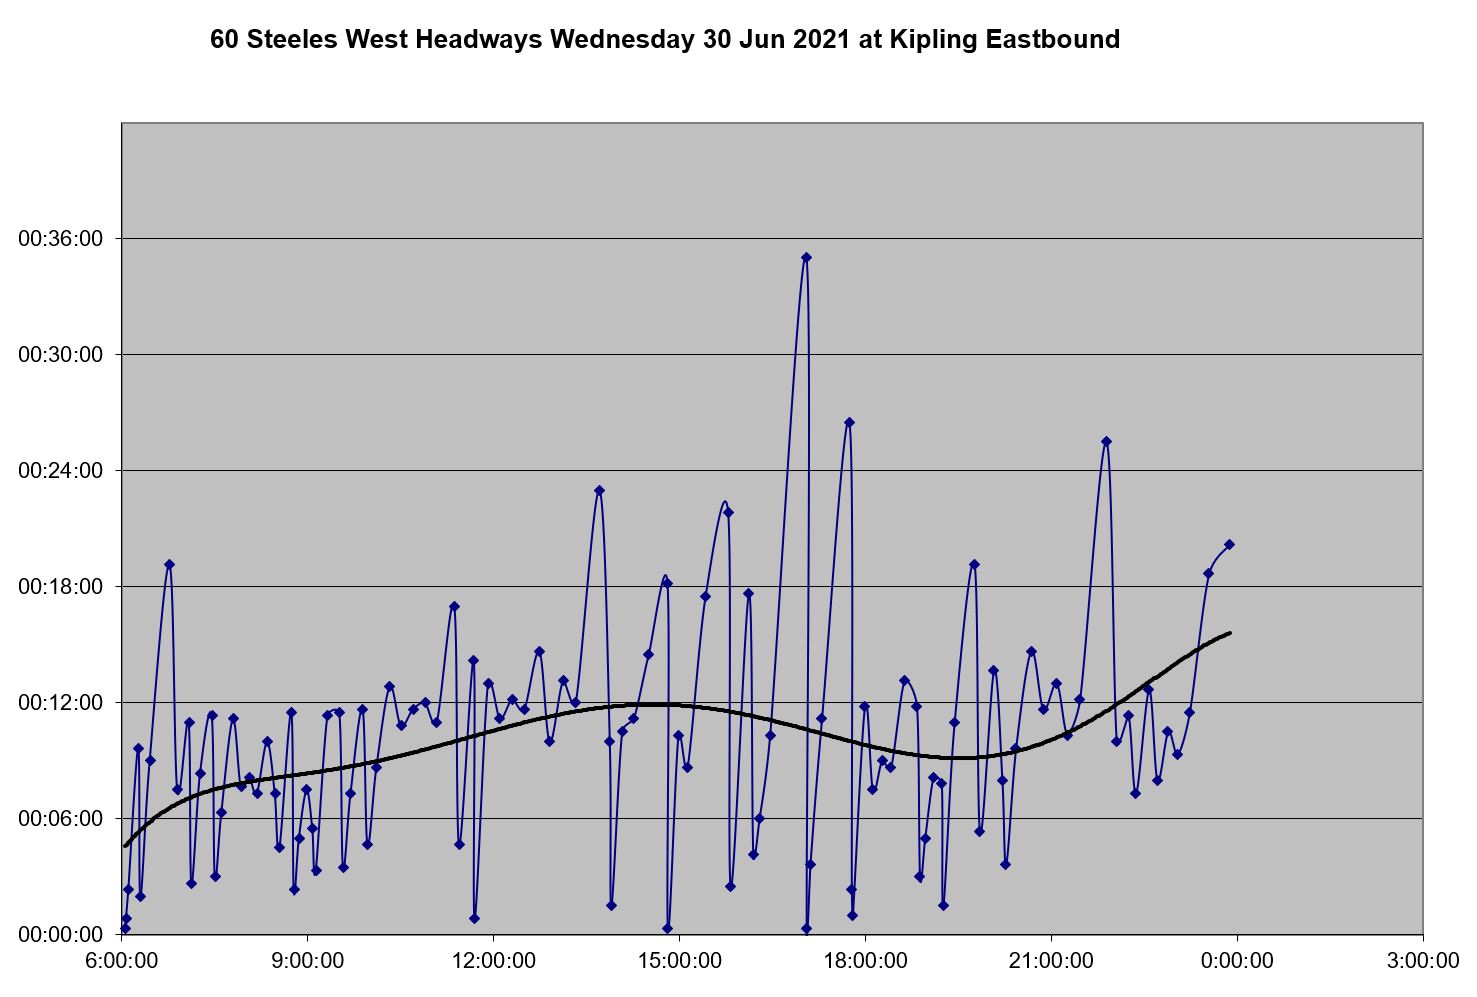
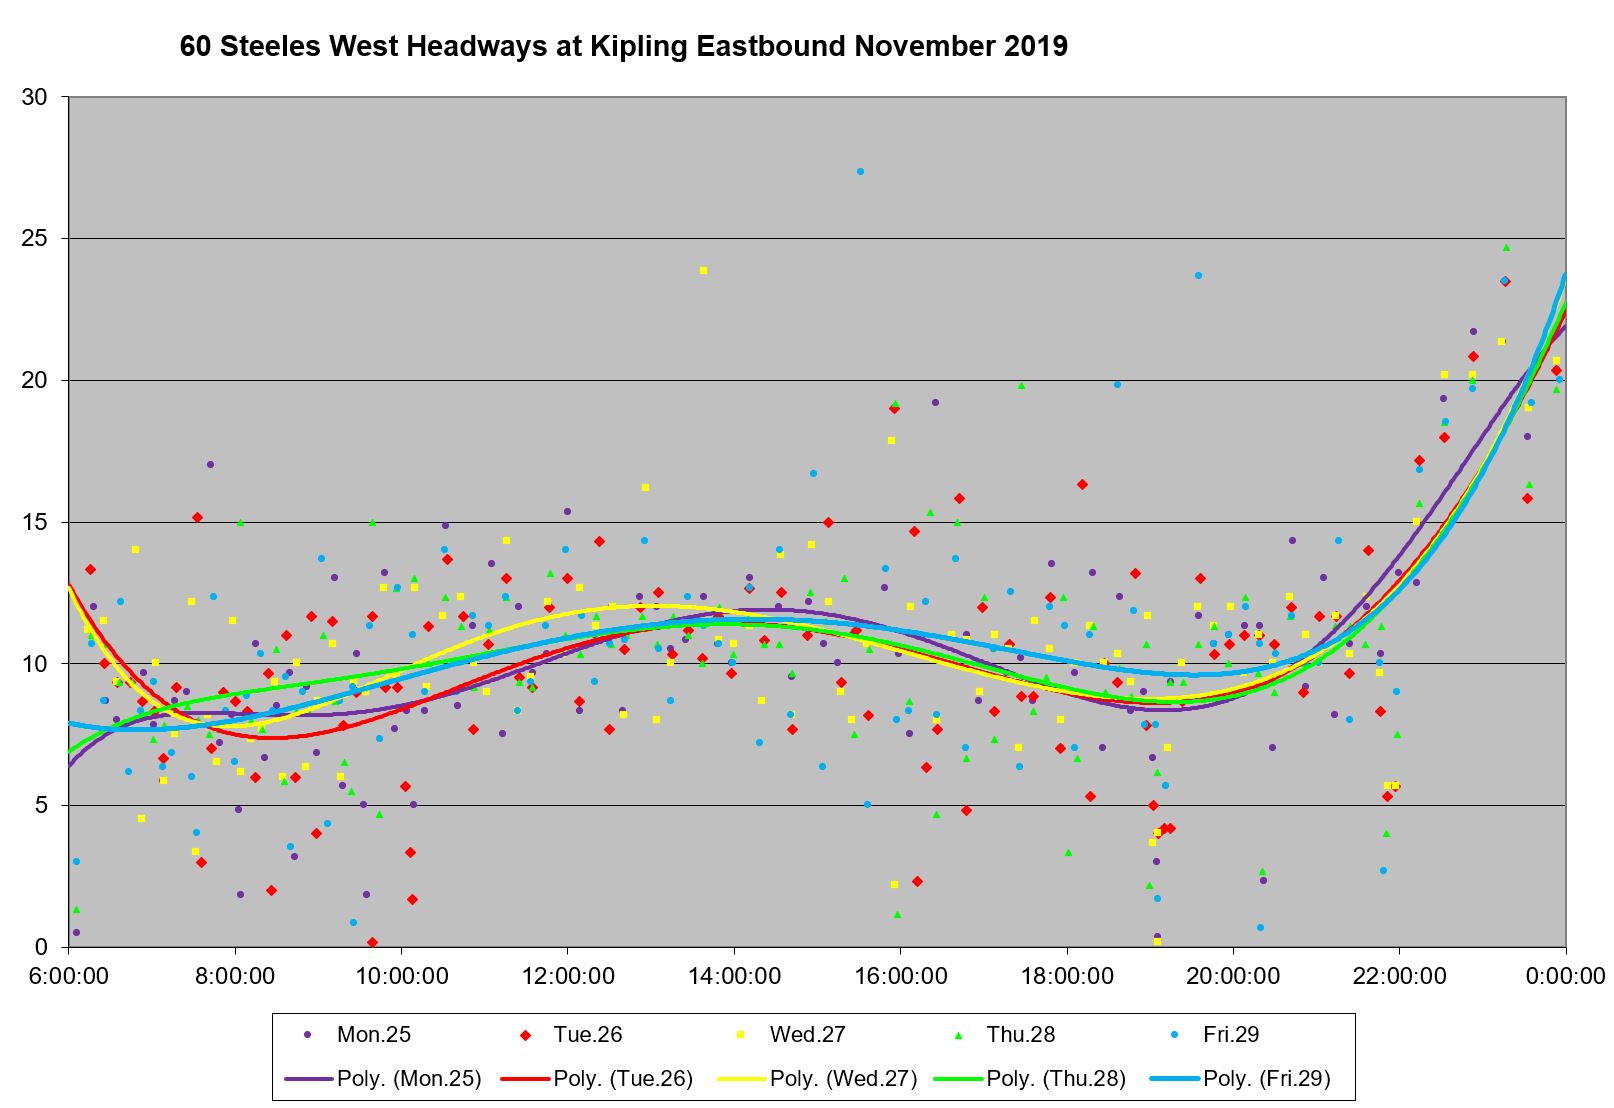
Eastbound from Kipling Avenue
For the eastbound service, I have used Kipling Avenue although it is not the terminal because it is common to both the Highway 27 and Martin Grove services.
In November 2019, the off-peak service is fairly reliable with a narrow band of headway values as compared to the peak periods, and to service westbound shown above.
In June 2020, even though traffic conditions were better, headwas were less reliable, although still somewhat better at midday. Bunching and gaps are fairly common.
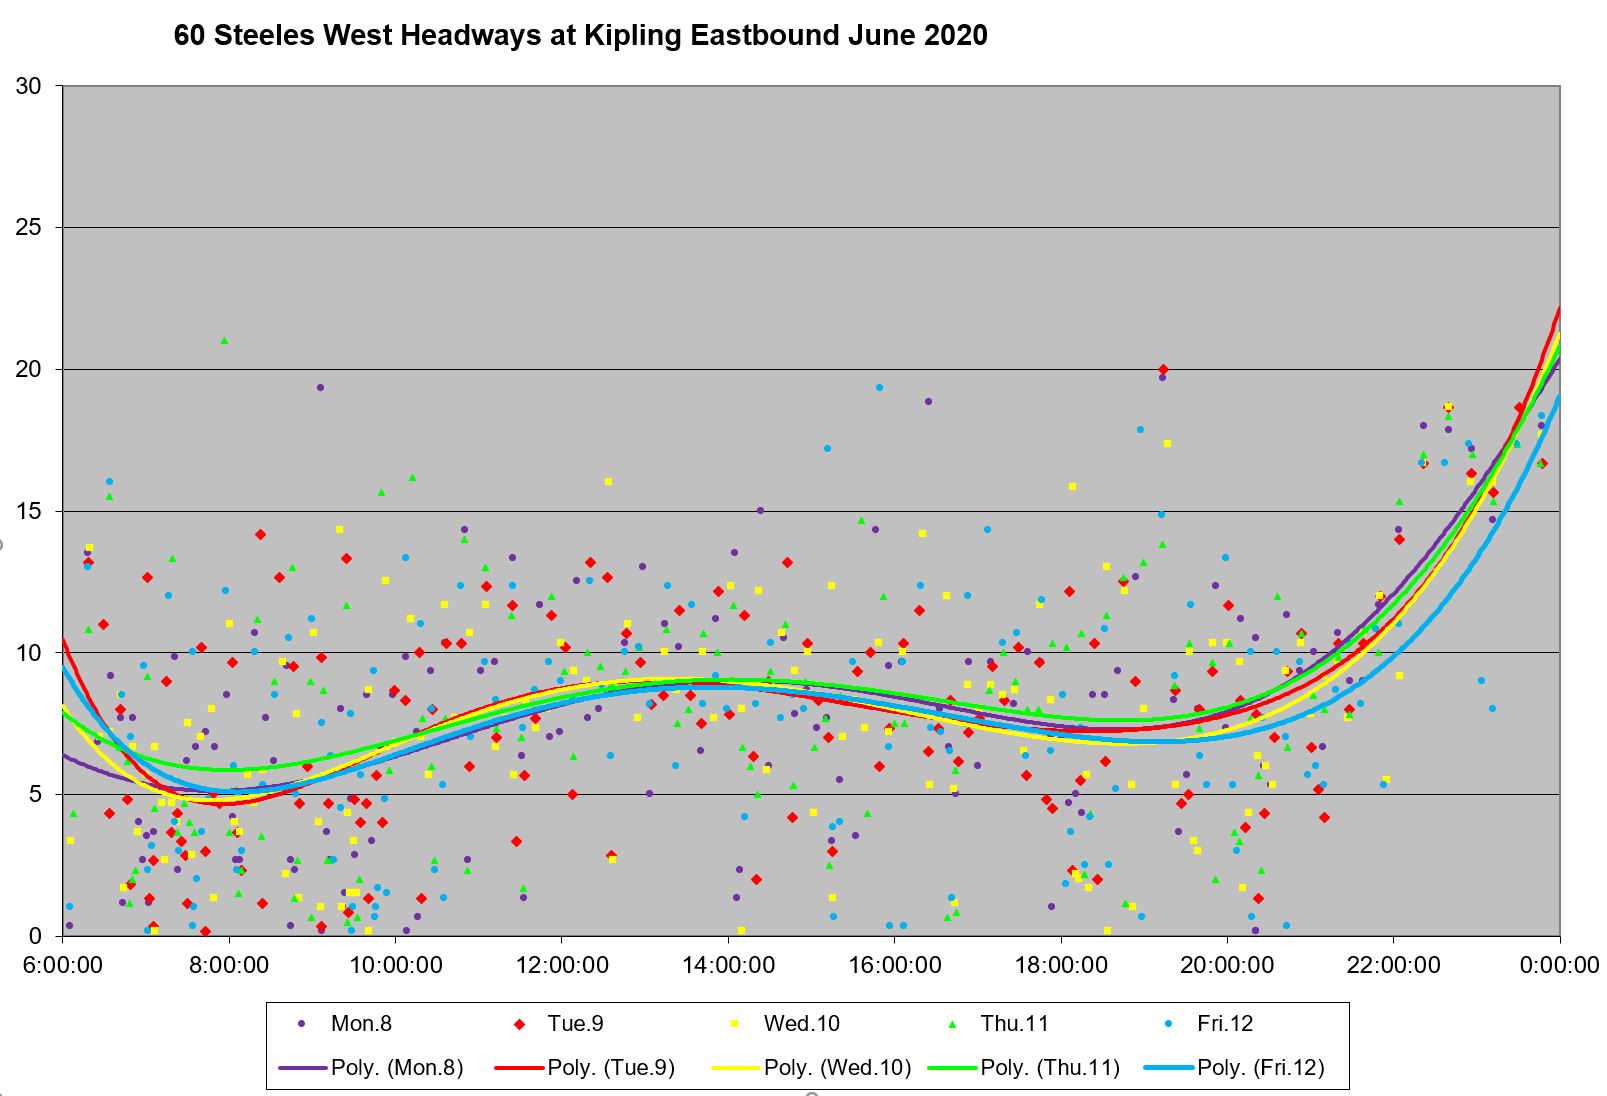
In June 2021, the headway values are spread over a 15 minute band all day until mid evening, and the AM peak is particularly bad.
Full Chart Sets
Travel times 2018 to 2021:
- East of Pioneer Village Station to West of Yonge & Steeles
- West of Yonge & Steeles to East of Pioneer Village Station
- Kipling to West of Pioneer Village Station
- West of Pioneer Village Station to Kipling
Speed comparisons 2018, 2019 and 2020:
Speed comparisons 2020 and 2021:
Speed comparisons 2018 to 2021
June 2021 Monthly Data for Pioneer Village to Kipling

Since long routes tend to have lower reliability, would there be any advantage in having two separate routes – 60 Finch Station – Pioneer Village Station and 260 Pioneer Village Station – Highway 27?
Steve: There are two relevant questions here. First, how much through riding is there between the eastern and western segments? Obviously with much less service west of Pioneer Village Station, this would have to be a minority of riders in the corridor. Second, will splitting the route improve headways on the western leg considering that buses today do not leave on a regular headway even though there is plenty of time in the schedule. This could turn out to be a perfect example of a “fix” that avoids addressing the line management problem while appearing to “do something”.
LikeLike