
In recent weeks, I have been working through the RapidTO bus priority corridors, existing and proposed, looking mainly at travel times and the effect of the pandemic era traffic reductions. (Still to come are the Finch East and Lawrence East corridors.)
An important part of any transit priority scheme is not just to move buses faster, but to improve service. An important outcome of the King Street Pilot was that although, on average, streetcars did not move blindingly fast across downtown compared to the pre-pilot era, the time they took was much more reliable. This led to better service because riders came to expect regular arrivals of streetcars and predictable travel times.
Much attention is lavished on priority schemes as “the solution” to transit problems when this does not address basic issues with service quality. At the current rate, we will see half a dozen RapidTO projects over an equal number of years, and much of the system will be untouched.
Shortening travel times does not, in itself, make for more reliable service.
Reliabilty is one aspect of the recent City/TTC Dashboard that was created to provide ongoing updates on the effects of the Eglinton-Kingston-Morningside red lanes. See: A Dashboard for Scarborough Red Lanes
As a starting point, here is the chart from that dashboard:
Leaving aside that some of those percentages are not very impressive, there is the general question of just how the reliability metrics in the TTC Service Standards are calculated and what they mean (see 3.3 Service Reliability starting on page 15 of the pdf). There are several components to the Standards.
- Service should depart from terminals no more than one minute early and no more than five minutes late. The overall goal is that 90 per cent of service hits this target.
- Service should arrive at terminals no more than one minute early and no more than five minutes late. The overall goal is that 60 per cent of service hits this target.
- Where headways (the interval between vehicles) is greater than 10 minutes, the +1/-5 standard above should be achieved 60 per cent of the time. It is unstated whether this applies to terminals or mid-route locations.
- Where headways lie at or below 10 minutes, service is measured on how close headways are to scheduled values because timetables mean little to riders. The allowable range depends on the scheduled service:
- Headways between 5 and 10 minutes have a 50 per cent marginal allowance. At least 60 percent of service should hit this target.
- Headways under 5 minutes have a 75 percent marginal allowance. At least 60 percent of service should hit this target.
This all sounds quite methodical, but there are problems lurking in what might appear to be a “reasonable” formula.
(Note that the TTC has never reported on the terminal arrival time metric. This target conflicts with actual operating practice where many schedules have extra running time to deal with varying conditions. If operators drove to worst case conditions so that they did not arrive at terminals early, riders would be much displeased. In practice streetcars tend to dawdle, and buses tend to race across their routes with generous layovers at terminals.)
The TTC usually measures achievement of its targets on an all-day basis. The chart above is unusual in that it considers only the peak hour and a mid-route point, not a terminal. In that sense it is much closer to what riders actually experience than the usual TTC stats where periods of poor service are averaged in with periods of good (or at least better) reliability. Measurements at terminals tend to be “best case” numbers because there is some hope for managed departures, but reliability quickly deteriorates as buses move along their routes.
For very short headways, there will always be problems with bunching because (a) it is easy for a following bus to catch up to its leader and (b) traffic signals tend to “marshall” buses into packs based on their cycle time.
This shows up in some of my headway charts where the values lie in bands corresponding to multiples of a cycle. Buses head off at the start of a green cycle and cross the invisible screenline in the middle of the intersecting road. This does not occur at locations with farside stops where buses can depart whenever they are ready.
A 50 per cent allowance on moderate headways means that, for example, buses that are supposed to arrive every 6 minutes can be as close together as 3 minutes and as far apart as 9 minutes while still being acceptably within standards. The problem with this is that a bus on a 3 minute headway is likely to be much less crowded than one on a 9 minute headway.
The 60 per cent target, if measured on an all-day basis for a route with reasonably good off-peak service means that in practice some periods of operation could have very poor headway reliability and yet the route overall would be considered as meeting the standard. This is nonsense.
For example, on 60 Steeles West, between Finch and Pioneer Village Stations, the buses per hour (June 2021) are shown in the table below. This is a rough estimate as the hours for each period of service will vary, but the basic premise holds. 40 percent of trips would be 76 of the 189 total. Much of the peak service (81 trips) might operate completely outside of the standard while the overall stats indicated that service was acceptable. Alternately, the evening service (48 trips) could be atrocious, but this would be smoothed out in an all-day average.
| Period | Hours | Buses/Hour | Total Buses |
| AM peak | 3 | 15 | 45 |
| Midday | 6 | 10 | 60 |
| PM peak | 3 | 12 | 36 |
| Early evening | 3 | 10 | 30 |
| Late evening | 3 | 6 | 18 |
| Total | 18 | 189 |
When the headway goes beyond 10 minutes, a completely different standard based on the schedule applies, although this is only measured at terminals. One problem the standards do not address is how to measure branching routes where the combined service runs every 10 minutes or better, but the branches do not. Which standard should apply?
More generally, where branches of routes converge, it is pure luck whether there is a properly blended headway, and no standard measures how well this is achieved.
This can also apply to unscheduled short turns where the absence of management of vehicle re-entry to a route can lead to bunching rather than gap filling. If a bus or streetcar re-enters based on its scheduled time, this might not actually split a gap in service coming from the terminal. Indeed an inbound gap car or bus could continue carrying the load with a short turn pulling in immediately behind.
The -1/+5 minute rule for longer headways brings its own problems. A six-minute window for being on time may look good, but it can produce very ragged service. Consider services like those shown below. In each case, alternate buses arrive five minutes late and one minute early. The resulting minimum and maximum headways are a long way off from the service riders might expect, and yet they fall within the Service Standards.
| Headway | Scheduled Times | Actual Times | Min | Max |
| 12 | 0 12 24 36 48 60 … | 5 11 29 35 53 59 … | 6 | 18 |
| 15 | 0 15 30 45 60 … | 5 14 35 44 65 … | 9 | 21 |
| 20 | 0 20 40 60 … | 5 19 45 59 | 14 | 26 |
Again this is nonsense. It should not be possible for headways to vary by a factor of 3 (6 vs 18 minutes) and be considered as “reliable” service. When headways are uneven, the shorter headway at a terminal (where the standard is monitored) quickly becomes even shorter along the route and the gaps become wider to the point where pairs of buses travel together on double the scheduled headway.
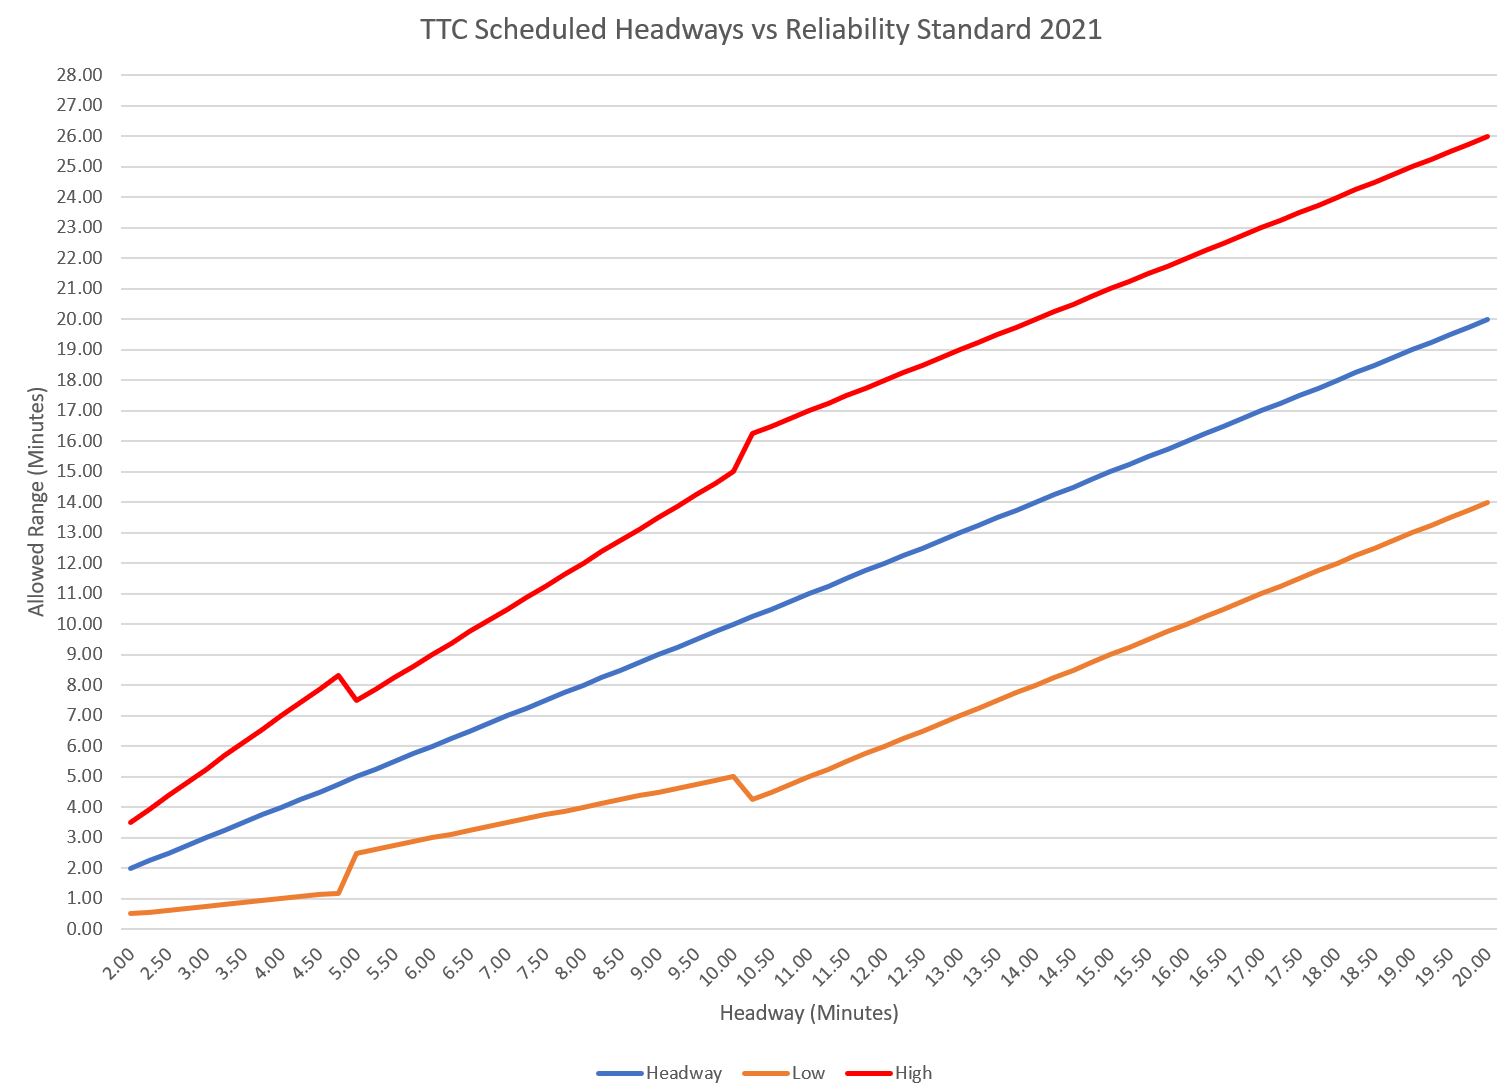
The effect of the standards on what is considered “reliable” are summarized in the chart below.
- The blue line is the scheduled headway and it rises smoothly from one side of the chart to the other.
- The red line is the maximum possible headway that is within the standard.
- The orange line is the minimum possible headway that is within the standard.
There are notches in the red and orange boundary lines corresponding to transitions between the TTC Standards for short, medium and long headways. The common point, however, is that the standards allow a wide range of headway values compared to what is advertised. They can claim to be providing “reliable” service within those standards while riders experience nothing of the sort.
A further problem is that once a headway is outside of the allowed bounds, it could be very long or very short, but nothing in the standards flags this particular problem.
I have no delusions that this problem will be fixed overnight. Holding TTC operations to a better level of headway management will not guarantee instant results especially on routes where laissez faire management leaves the bus opeators to fend for themselves.
However, if the standard is too lax, there is no indication of what needs improvement. The numbers might fall below targets with a tighter standard, but at least they would show where problems exist. Management should not get gold stars for hitting targets that leave riders wondering if their bus will ever arrive.
These standards are at times referred to as “Board approved” with the clear implication that they were carefully considered and understood. In fact, technical standards like this fly through Board meetings almost untouched because the actual implications of what they contain are not understood. The Board assumes that management knows what it is doing. They might debate buying boxes of widgets at the best possible price for hours, but Service Standards that affect every rider’s experience get only a brief nod.
At a minimum, the following changes are needed:
- Actual headway behaviour should be reported on an hour-by-hour basis through the day rather than all-day averages so that problem periods can be identified.
- Reports should look not just at terminals but at key points along a route (this change is likely to be proposed as part of the 2022 Standards).
- An upper bound should be set on the actual gap between vehicles that does not allow headways to vary by a large factor. A six minute maximum, akin to the +1/-5 on time standard, should apply.
- Large gaps and bunches (such as headways below 2 minutes) should be reported separately so that these are flagged separately from trips outside of the headway standard.
