
The TTC Board will meet on Tuesday, February 3, 2026 at 9:30am in North York Council Chamber. The agenda is rather thin, and there are several confidential issues that will trigger an in camera session. There is no formal item regarding Line 5 Eglinton, although one never knows what might come up in debate.
Of interest are the following items:
Updated February 2 at 10:10am: Slide decks for the invited presentations have been posted on the TTC site. Links to them are added below.
- CEO’s Report
- Invited presentations from:
- Narayan Donaldson on “Opportunities to improve Transit Signal Priority in Toronto”. According to the covering report “This presentation will discuss the strengths and weaknesses of the Transit Signal Priority (TSP) system used on Toronto’s streetcar, bus and LRT systems, compare it to a TSP system commonly used in the Netherlands, and suggest areas of improvement.”
- Jonathan English on “Developing a Surface Transit Revitalization Plan” According to the covering report “This presentation will discuss steps that can be taken to improve speed and reliability of the streetcar network, as well as new LRT lines.”
After the meeting, I will write up the presentations in an update to this article.
CEO’s Report
Conversion to the new format is complete. Although the layout has changed, the underlying methodology is mostly the same.
Vehicle-specific data are now reported only occasionally on a rotation of subway, bus, streetcar and Wheel-Trans in every fourth report. In theory this should review each mode three times per year, but the Board does not meet often enough. In 2025 there were only 10 regular meetings, and even fewer are planned n 2026 thanks to the election.
This makes tracking of changes much more difficult because the former monthly reporting of metrics has been dropped along with detailed charts showing data for past months. As a convenience for readers, I have consolidated statistics from the five CEO Reports in the new format later in this article.
The report also includes some sloppy editing and formatting of the data. This is not a new problem.
This is the second report to consider the subway system in detail. A continued absence from the report is an overview of fleet utilization and availability. It is one thing to say that 100% of scheduled service was actually operated, but this gives no indication of the scope for service improvement using spare vehicles. For several years, the TTC’s spare ratio (fleet size versus peak requirement) has run well above 20% (1 spare for every 5 scheduled), a common industry standard.
Any “strategic planning” for the short term has to work with the fleets on hand and net new additions in the short term, but the scope for expansion is never presented to the Board. This is an important issue for the Ridership Growth Strategy which is supposed to come to the TTC’s Strategic Planning Committee in March and the full Board in April.
Service reliability metrics continue to be based on “on time performance” for surface routes rather than actual spacing. On many routes, the service standard allows buses to run in pairs but be considered “on time”. Performance continues to be reported as an overall average rather than by route and time of day to highlight problem areas.
There is no report on the proportion of service running on extremely short headways or wide gaps, and only a short update on the status of the bunching and gapping program.
Surface routes Bunching & Gapping Pilot year end improvement 5% timing points and 7% end terminal in 16-week Phase 2 leveraging route supervision and AI pilot Headway management, expanding to all streetcars through Q1.
Stop-level analysis developed for B&G pilot to extend to all surface routes Q2 2026. [p. 10]
A related topic is the Ridership Growth Strategy. Back in September, this was expected in the fourth quarter:
TTC will deliver a Ridership Growth Strategy in Q4 2025, outlining priorities to support recovery of with focus on near and mid-term. Attracting lapsed customers and non-transit trips (78% trips in Toronto).
In the current report, the RGS is now promised for March/April:
Ridership Growth Strategy: examining travel patterns, post-pandemic ridership shifts, and financial constraints, integrated approaches to attract new riders and retain existing customers, will be presented on March 2 SPC [Strategic Planning Committee] and final strategy to the Board in April. [p. 5]
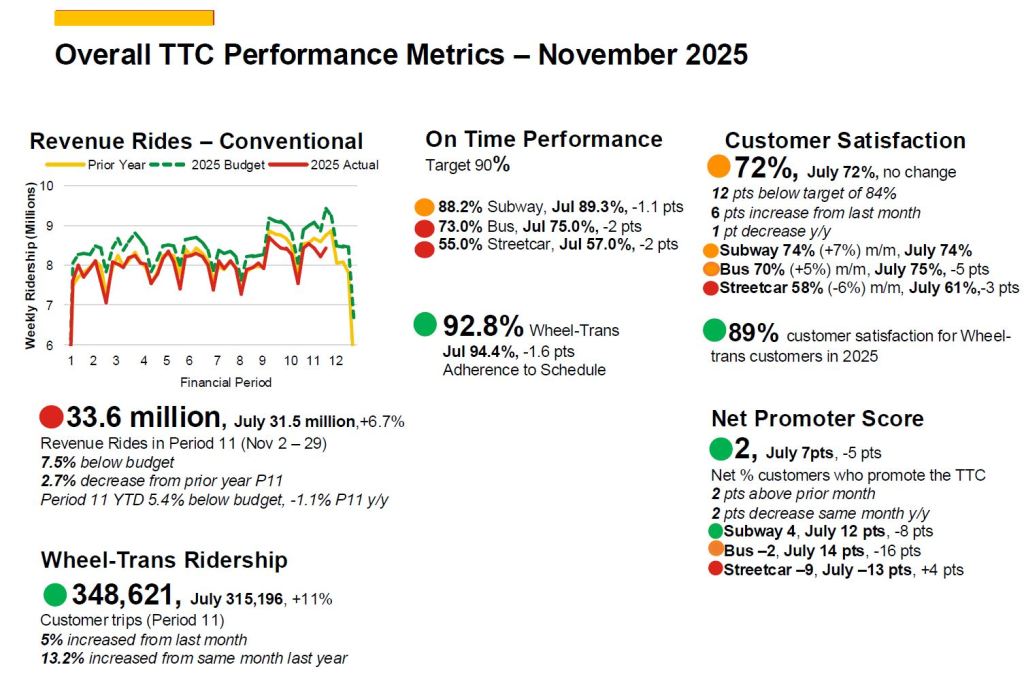
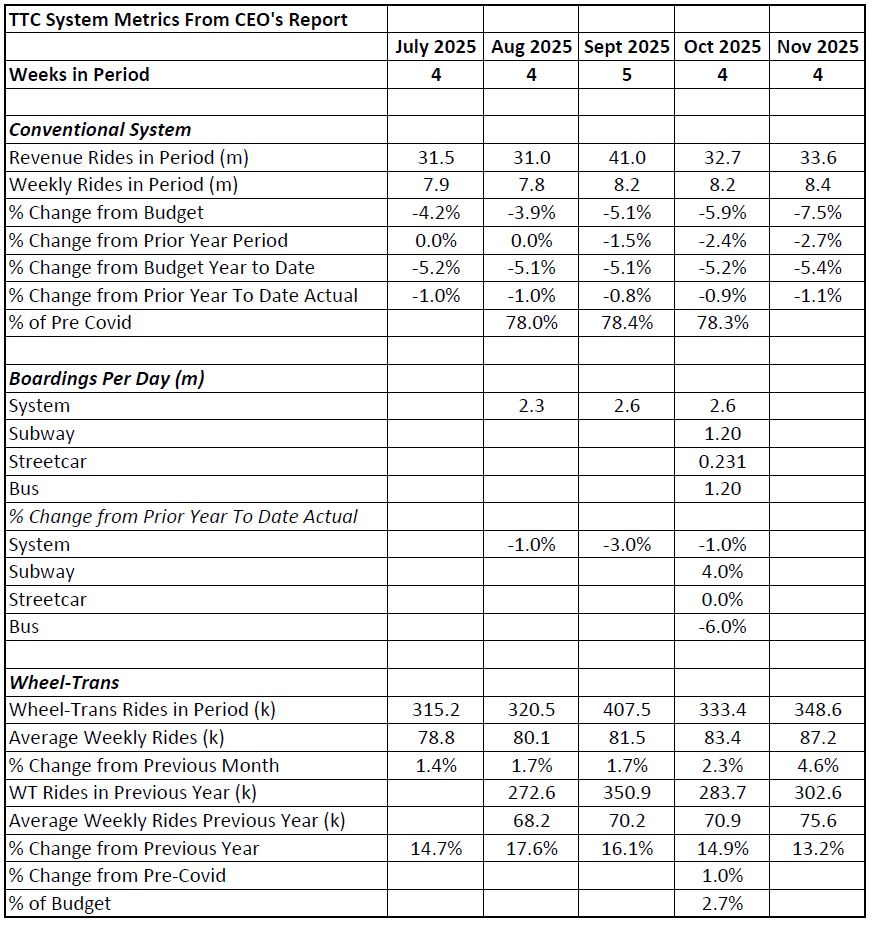
The new format of metrics reporting condenses many figures onto a single page, but at the cost of some clarity and detail. The November data are compared with July, the last month for which subway was examined in detail in the September 2025 CEO’s Report. This leaves a long gap where we see little detail of the evolution of values over time. In particular, the Overall Metrics are compared with July even though more recent values from October were presented in the December 2025 CEO’s Report.
A large increase in riding would be expected given that fall riding is always higher than in the summer. The real story lies in the comparison to previous year (-1.1% year to date, -2.7% for the comparable period) with even larger shortfalls against budget.
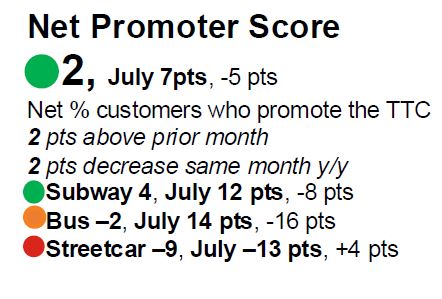
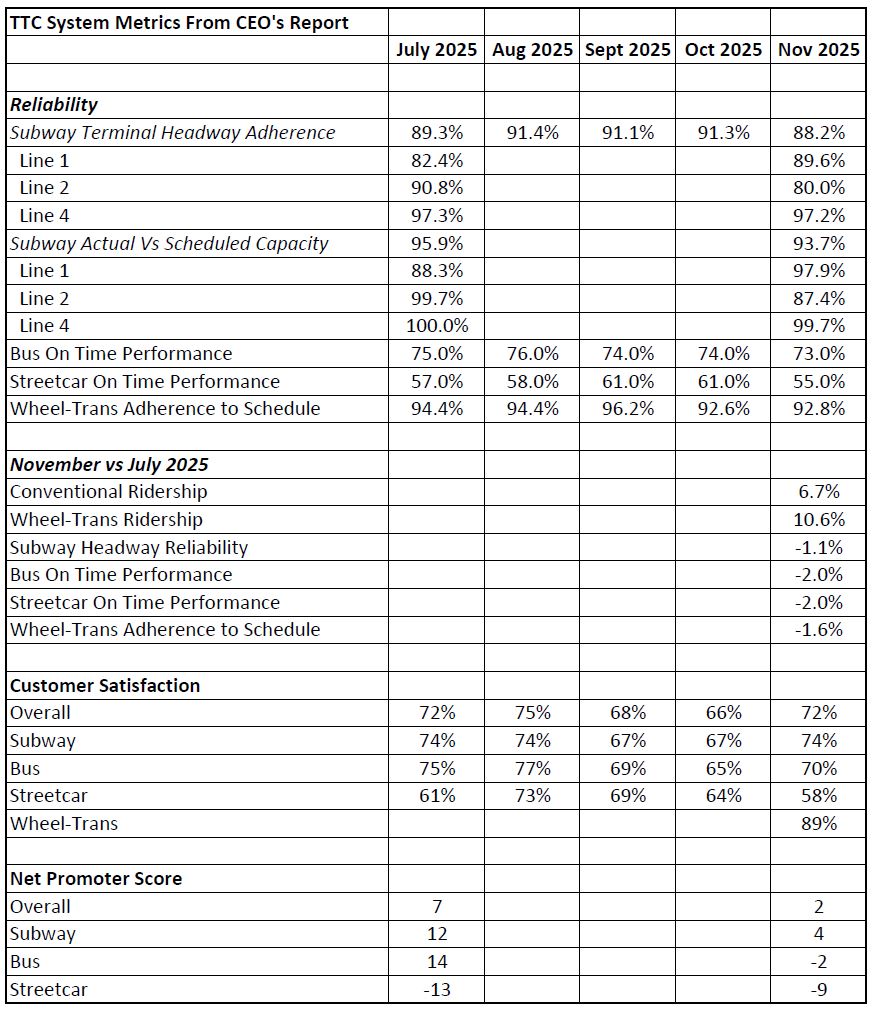
Of particular note is the difference in the trend for Customer Satisfaction and “Net Promoter Score”. This measures the difference (as percentages) between people who would recommend the TTC to friends versus those who would not. Ideally this should be a fairly large positive number, but current values are mostly in single digits, and some are negative.
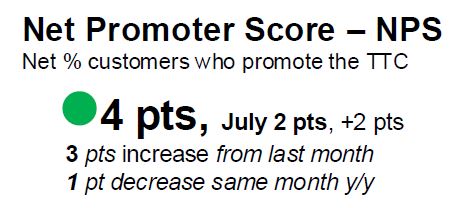
Customer Satisfaction is static since July on a system basis, rising for subway and bus, falling for streetcar. The Net Promoter values are going in the opposite direction with big drops for subway and bus and a slight rise for streetcars. Moreover, there is a substantial discrepancy between the “Net Promoter Score” for the subway which is shown as rising between July and November 2025 from 2 to 4 on one chart [left below] and declining from 12 to 4 on another [right below]. The value of 12 for July matches that shown in the September 2025 CEO’s Report [p. 9]. In other words, the TTC thinks more people would recommend their service to others when in fact the reverse is true. Something is wrong with these stats.
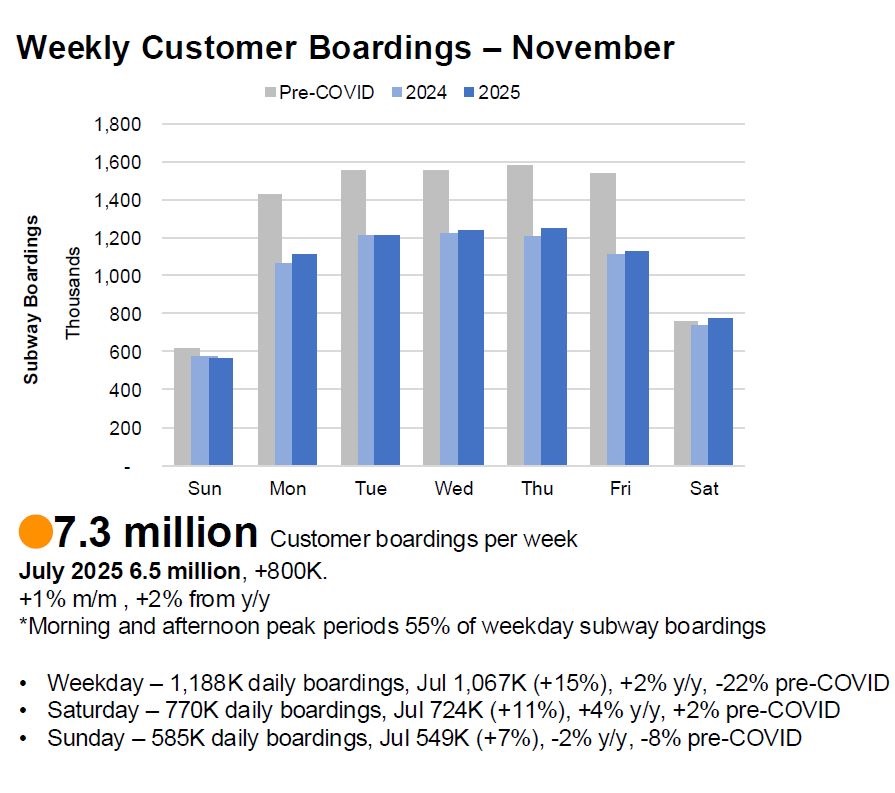
From a separate slide we learn that subway ridership is up 2% year-to-year [upper right below]. This implies that bus and streetcar boardings must be down more than the system average, but these modes are not broken out in the report. Note that the overall metric reports “rides” (linked trips, loosely equivalent to single fares) while the subway counts show boardings (unlinked trips). (On the subway, the TTC does not count transfers between lines as new boardings, and so “rides” and “boardings” on the subway are equivalent.) Weekend boardings are back to pre-pandemic levels, but weekday demand suffers from changes in commuting patterns.
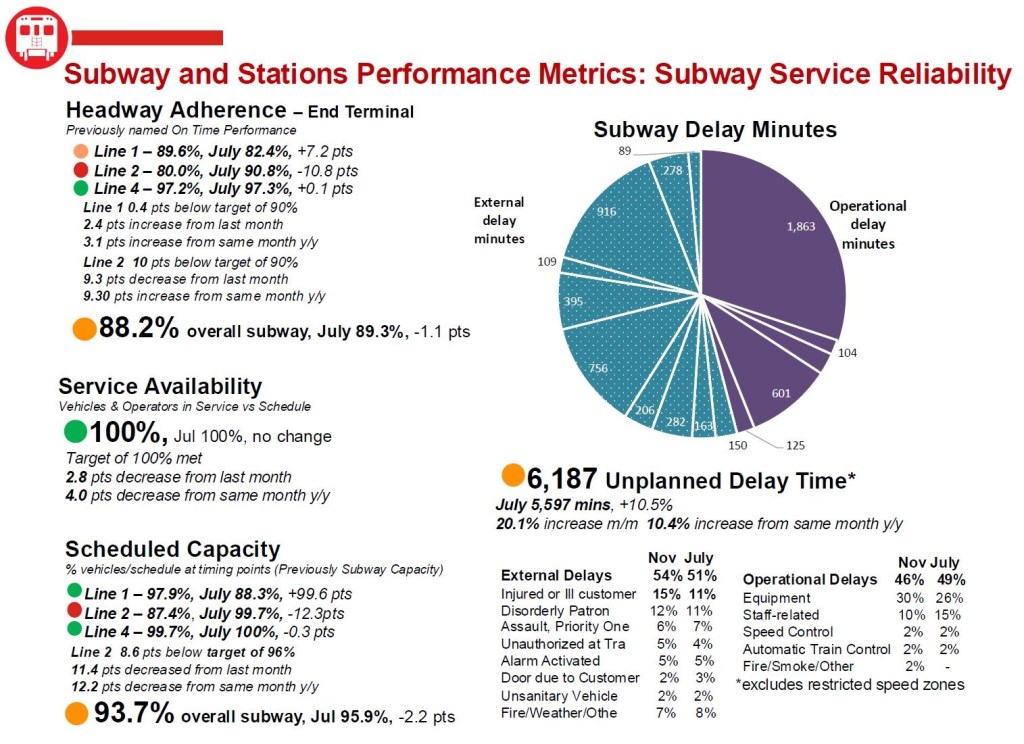
The chart and table of subway delay minutes [lower left below] includes a pie chart with numeric values but no legend. The components are listed in order of prevalence, but not the same sequence as the slices of the chart. An important issue here is that the numbers represent the length of delays, not the compounding effect of the number of trains and passengers affected. An incident with a stuck door might hold one train and a few following for a short period, while a major interruption might block service in both directions over an extended distance and require shuttle buses. The length of the delay will not necessarily reflect the extent of the effect on service and riders.
Other selected metrics
Misrepresentation of Bus Reliability in Past Reports
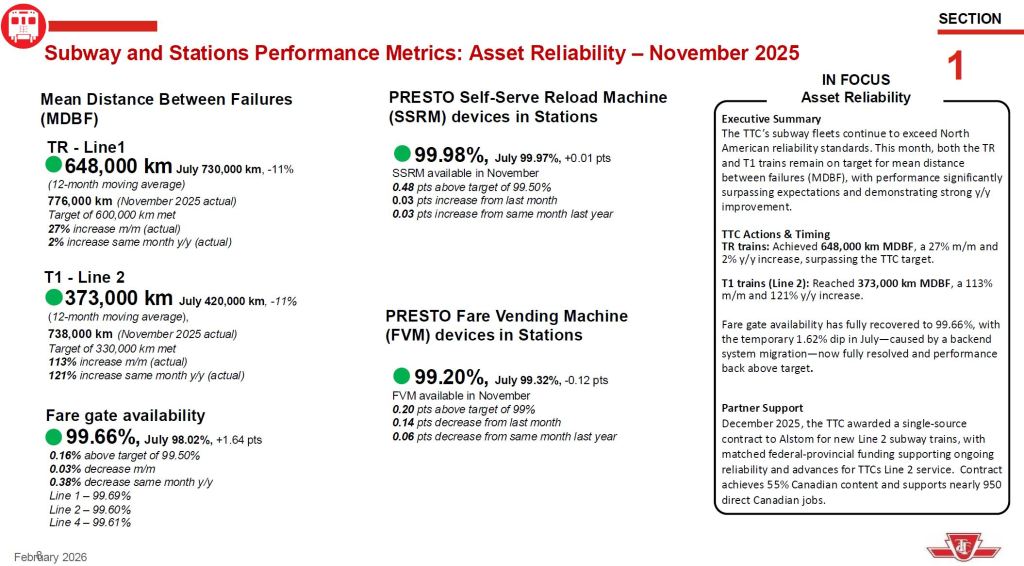
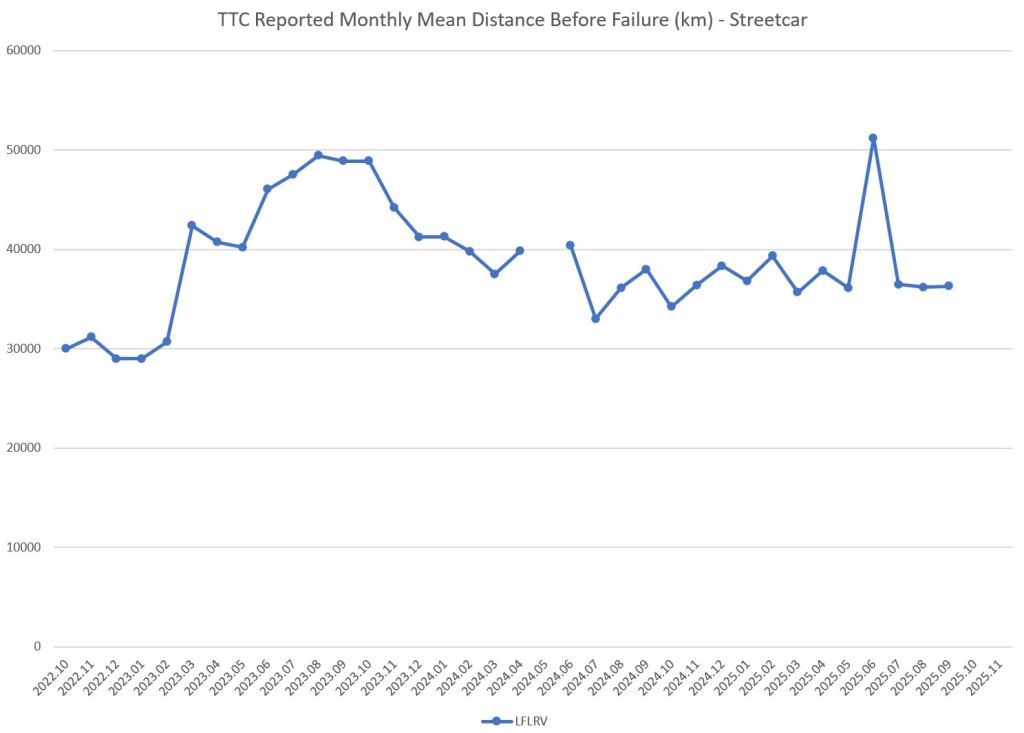
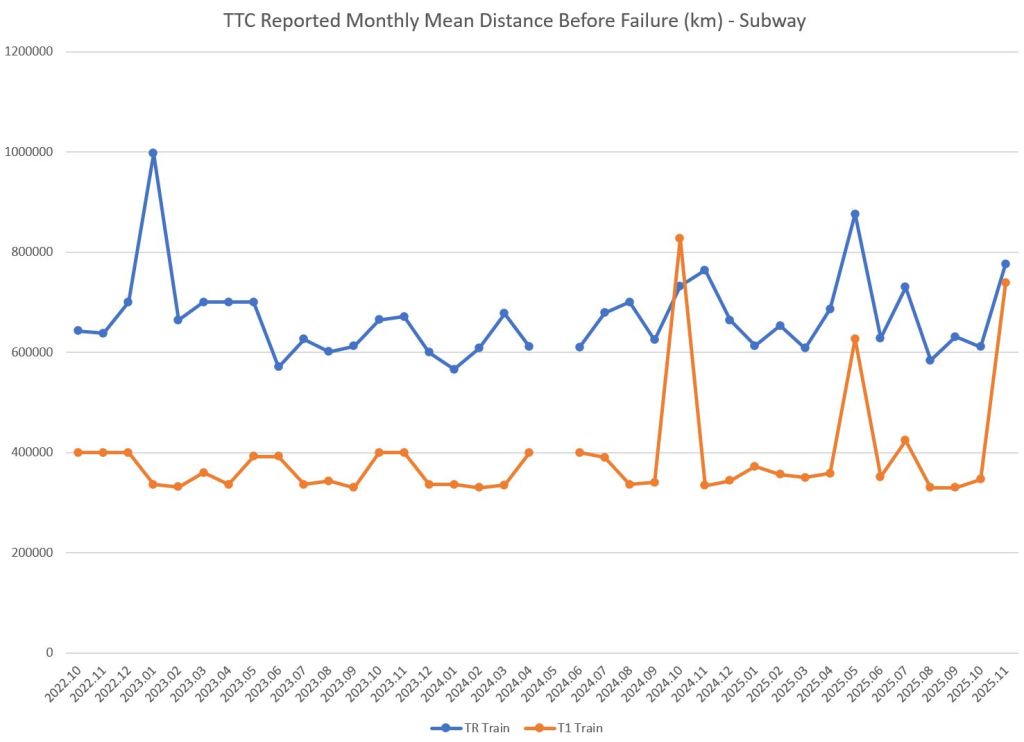
Vehicle reliability is expressed as the Mean Distance to Failure (MDBF), the number of kilometres between in-service failure causing a delay of five minutes or more. The values for subway trains are much higher than for surface modes because a single-car fault might not disable an entire train.
There are few train failures per reporting interval, and so the mileages per failure tend to sit at similar levels corresponding to a change of 1 or 2 in the count. Similarly, a month with fewer failures than normal can cause a spike in the MDBF.
For many years, data for buses were simply not credible. The MDBFs for both clean diesel and hybrid buses were reported as 20,000km and 30,000km respectively every month until August 2025. Finally, in September 2025, very different numbers appeared. This is also the point at which monthly reporting ceased.
The mis-reporting of vehicle reliability allowed the eBus fleet to appear better by comparison with other buses than it actually was. Moreover, eBus values bounced around from month to month but reported values were capped at 30,000km. It is very hard to believe that these are real values.
One must ask whether the TTC Board was kept in the dark about eBus problems by misrepresenting their performance compared to other buses. Most of the trial eBus fleet is now retired, and current stats, as and when they are published, should reflect the new group of buses now in delivery. It would certainly be worthwhile to report performance broken out by bus vendor, not as a system average, as this would inform any decision about which vendors receive future orders.

Consolidated Stats From CEO’s Reports for July to November 2025
The CEO’s Report includes a page showing Overall Performance Metrics. However, the information presented there has varied from report to report, and some is scattered on other pages. The table below is intended to pull these numbers back to a single place for easy tracking. Some of the values have been calculated based on reported percentage changes because the raw value is not shown in every report.
For accounting purposes, the TTC breaks the calendar into periods. Most of these are 4 weeks long, but some are 5 making values reported on a period basis out-of-scale to the others. This has been adjusted in the tables where necessary.
The February 2026 CEO report includes the November 2025 data and compares them with July 2025. This masks the evolution of some values over the intervening periods.
Presentation: “Opportunities to improve Transit Signal Priority in Toronto”
To be added following the meeting.
Presentation: “Developing a Surface Transit Revitalization Plan”
To be added following the meeting.

CEO report… damn those are ugly slides. I’m guessing they were done in-house because I can’t imagine a competent media agency delivering such shoddy work.
Steve: It’s not an internal TTC presentation and I have to put the quality down to the authors. The content reveals a lack of basic research in some cases: don’t just cite problems but quantify their effect. For example stop spacing is routinely trotted out as an issue, but even TTC itself recognizes that most stops fit the existing standards. It’s a hobby horse where poorly managed service can be blamed on squeaky wheels who value accessibility over alleged improvements in speed.
LikeLike
Something is certainly wrong with those NPS scores – I use them in my day job. The calculations are defined/owned by Bain & Co (so a TTC specific version shouldn’t exist,) so it’s pretty clear they aren’t using them correctly (either that or the results are absolutely awful.) A score of 2 or 4 isn’t good and shouldn’t be a good news/green metric.
Short version:
Clients rate on a 0-10 scale. Promoters are those that answer with a 9 or 10, detractors answered 0-6. Passives are 7-8 and are ignored.
NPS score = % Promoters – % Detractors.
LikeLike
Interesting that the new CEO is very data focused but is giving less information.
Thoughts on Head of Bus Transportation, Robert Smith’s retirement?
Steve: Not someone I know, so no comment.
LikeLike
Any report which doesn’t address all of the TTC’s absurd self-imposed Zero Vision operating rules of safety theatre is fundamentally useless as it avoids half the problem. The people who developed these rules misunderstood the assignment and should get an F.
On some routes the TTC’s big brained act of crippling door operating speeds, at minimum, by itself adds a couple of minutes to the runtime needed for a one-way trip. I say at minimum as that number doesn’t include any time lost from missing green lights due to slow door operations and the resulting delayed departures.
LikeLike
This is complete speculation on my part with no factual basis. But maybe the bus MDBF numbers were capped based on servicing intervals? So a diesel bus would need an oil change every 20k km anyway, so it would need to be taken out of service and brought into the shop for that. By being in the shop and off-the-road, it might get counted in the statistics as failed or unavailable. Of course, if that were the case, the diesel bus numbers should be lower than 20k since some buses fail between oil changes. Maybe they were previously only gathering statistics for ebuses (since they don’t need oil changes) and just made up the numbers for diesels and hybrids.
Steve: Yes, complete speculation. TTC has calculated mdbf numbers for as long as I have been following them. They are based on in service failures causing a delay, not planned overhauls. The shift to capped values only began in 2018 and such values are meaningless. In earlier times they were proud to cite values above targets as symbols of how well they were doing, and raised targets when performance was consistently higher. You can look back at old CEO reports to see this change as well as past practice.
Management might claim that it was a case of hitting targets so by how much didn’t matter. The effect was to mask variations in performance above the cap which was explicitly labelled as such in 2018 charts.
If I give them the benefit of the doubt that this was just some error, it went on for years and shows incompetence in preparation of the report.
Here are links to the “before” and “after” versions of the CEO’s Report.
January 2018 (see p. 66)
June 2018 (see p. 57)
LikeLike
I read Jonathan English’s “surface transit revitalization” plan and it focuses solely on the streetcar network, with no solutions on how to improve bus service. Why is there never any ideas on how to improve the buses?
The “solutions” are nothing new that we haven’t heard before, IIRC streetcar stop consolidation has been tried before? I assume he’ll talk about how the TTC is lagging behind in maintaining the tracks leading to slow sections? The TTC posts RSZ for the subway, nothing for the streetcar network.
Double blade switches? During the last snow storm I don’t recall hearing issues with the switches and it’s well known the TTC needs to upgrade the switches to handle longer cars.
Fewer shuttle buses? I don’t understand what this means? I would say make the bus subustition routes less complex. And easier to understand.
Finally, the presentation seems hastily put together with different font types used in the body of the presentation. (I’m being nitpicky, to be fair.)
Steve: Yes it’s thin and repeats many of his usual tropes, but I’m waiting to see what he says and what debate this raises.
LikeLike
I’m all for signal priority for streetcars, long overdue. But this same incentive needs to be extended to bus routes particular major transit corridors like Finch, Steeles, Sheppard , etc.
The same motion to get signal priority for streetcars could have easily included the word bus in there. Why leave bus routes out. It’s known they’re the backbone of TTC and carry the majority of the ridership. I wish Chow and team was more aggressive regarding this.
I didn’t realize that a good chunk of the original 60 EV buses have already been retired. I thought it was just the Proterras because of vendor issues and not necessarily the buses performance.
I’m curious if the cold weather is negatively affecting the charge retention of the batteries on EV buses. I get TTC ultimately works for council/Board and tries to make them look good at all times. But being transparent to the actual users and riding public about EV bus reliability is also important. And I say that because Andy Byford admitted so.
On the topic of EV, have all garages been fitted with charges and in use. If I recall, by 2025 all garages with the exception of Queensway should all have chargers.
Is there a link to the Board agenda, I recall it used to be in TTC website, which made sense. Thank you!
Steve: The new eBuses have a small diesel engine whose purpose is to keep the batteries warm to avoid charge loss. Yes, there is a certain irony here.
The presentation should have talked about buses too, but with the fixation on Finch and Eglinton, and by extension the surface rail network, buses were not mentioned. That’s a shame because with curb loading, the dynamics of TSP for buses are different than for streetcars.
According to the fleet list in the January 2026 Scheduled Service Summary [last page], there is one BYD still in service, all 25 New Flyers and no Proterras. According to the Major Projects Update in December 2025, the first phase of chargers at Arrow Road, Eglinton, Birchmount, McNicoll and Malvern are installed, and Wilson is under construction. The second phase at Eglinton and Mount Dennis is scheduled for completion in April 2026. This does not complete the rollout, but the schedule is constrained by funding and the fact that garages are far from 100% electric in the near future.
Since January 27, 2025, TTC agendas are on the City’s meeting management system, TMMIS. The current one is here and you can get to others from a drop down iist. Older agendas are on the TTC site under “The Board”.
LikeLike
I’ll be curious how Donaldson and the subsequent discussion handle the intertwined issues of TSP and schedule padding. Slide 57 seems to suggest triaging the level of TSP based on early vs on-time vs late performance of a vehicle. This can be reasonable, if the transit agency is running aggressive schedules.
But, in my opinion, this ends up neutering any meaningful discussion of TSP here in Toronto given the way TTC pads out schedules. If you’re designing the schedule at low speeds, and then tying TSP use to being behind schedule, it doesn’t matter how good your TSP algorithms and policies are… they will never result in rapid transit (they can definitionally only provide less-slow transit). To solve this problem really requires addressing both: we need strong approaches to TSP, but we also need courageous schedules that are designed to get people places quickly, rather than maximize on-time performance to boost statistics.
Steve: There was a passing reference in the presentation to the issue of padded schedules, but he didn’t dwell on it. There are two big related issues on top of the obvious one that TTC pads schedules. First, the TTC is contemplating a move to headway based line management and “on time” will not be a meaningful term. Second, diversions have big problems because there is no TSP to assist with commonly used turns, and of course a car on diversion is by definition not on schedule. Too often schemes are concocted to deal with only modestly disrupted service, bt have no provision for more extreme conditions. My attitude is that transit should always get priority, and the concept of only providing it for “late” vehicles is a sop to motorists so they won’t be inconvenienced too often.
LikeLike
Critics: They have not implemented any transit priority.
Transportation Services/Apologists: Ackshually you’re misunderstanding our complex traffic control systems. We definitely have transit priority and it will be deployed if vehicles are running behind schedule. Checkmate critics!
TTC: Develops a 100% safe and sane schedule that allows for vehicles to approach foot speeds and still maintain The Schedule thus never triggering any transit priority.
Critics: *notices slow speeds with the padded schedules and absence of transit priority* You people are morons.
TTC CEO: Hey I’m still here! I wanted to clear a few things up and say that I can’t control the speeds because that’s all in the schedules! It’s not slow, it’s the schedules. The schedules!
LikeLike
Has New Flyer delivered all the ebuses that they were contracted to yet? I am hearing the TTC plans on not ordering any more in the future because of problems compiling with them. Have you heard anything?
Steve: According to the January 2026 Service Summary [p. 62], 121 of 204 New Flyers are delivered and 65 of 136 Novas.
The numbers are different in the quarterly major projects report for 3Q25 [p. 38] where there is also a note about a “stop shipment” notice to New Flyer.
There is supposed to be an eBus update to the Board in March.
LikeLike
Hi Steve,
My presentation was an informative piece on how TSP works for streetcars, because that’s what the TTC and City are currently working on. As I’m sure you’re aware, there is only so much one can fit in a 15-minute presentation, so I decided to use my scarce time to go into depth on one topic rather than spreading myself thin on many.
Just because I didn’t mention explicitly talk about buses does not mean that I underestimate their importance. The TSP system for buses and streetcars is currently identical, and I did include a photo of a bus to avoid implying that TSP is only for Streetcar/LRT.
Just because I used the term “on-time” does not mean that I promote schedule-based line management. On the contrary I have been a fierce proponent of headway management for my entire career, and I explicitly stated in the presentation that conditional priority can be relative to headway or schedule. Furthermore the transit signal priority system on the streetcar network can ONLY do headway-based priority, since it has no connection to the CAD-AVL system.
Just because I didn’t spend precious time ranting about the over-padded schedules does not mean that I overlook the issue. On the contrary, I explicitly stated that improving TSP for “late” streetcars (i.e. those with above-average headway) will allow us to shorten schedules. And if the threshold for “lateness” is less than a minute, those streetcars are effectively on time and we can tighten schedules just as much as an unconditional system. The reason schedule padding exists is that travel times are wildly inconsistent. Using TSP to proactively neutralize delays will clearly allow schedule padding to be reduced dramatically.
Ultimately my intent was to provide factual information to the Board to help them better understand Transit Signal Priority, with the hope that it helps them make meaningful improvements to the system.
Steve: If you check the whole thread, you will see that the issue of emphasis on streetcars lay more with Jonathan English’s presentation than with yours. I think if your intent was to give an overview of TSP options and implementations, then the whole issue of “on time” vs absolute priority is important because it is a major policy decision/debate. Also in any discussion of improving surface ops, the issue of padded schedules and the TTC policies that led to them are important. I didn’t have the sense that you stressed there are issues the TTC is responsible for itself, and it’s not just a case of implementing TSP.
As a general note, any presentation that seeks to clarify and educate needs to provide specific examples. You had a few, but some sense of the variation in types of intersections and transit services, and the quantity of these in the whole system, would put the relative impact of various changes in context. Changing the operation of Spadina, St. Clair, Finch and Eglinton is valuable, but the situation for other routes like Dufferin is completely different. I was glad you made the point that TSP and farside stops are an essential pair. One important issue you missed is the question of upstream vehicle detection. The streetcar TSP depends on loops in the pavement which are often too close to a signal to give time for it to cycle in the streetcar’s favour, are difficult to move to adjust behaviour, and are prone to failure. GPS based TSP can be much more easily “tweaked”.
LikeLike
Hi Steve, my presentation already used every bit of my 15-minute allotment, so any additional important thing or example I were to include would be at the expense of an important thing or example in the presentation. Hope this helps!
Steve: This can be handled by putting the less important things in an appendix and referring to them if they come up in the Q&A.
I should mention that advocates get five minutes if they’re lucky, not an extended invited presentation.
LikeLike