With no fanfare at all, the list of planned service changes for November 21, 2021 has appeared on the TTC’s website.
As a result of operator workforce shortages, Line 2 Bloor-Danforth, one streetcar route, and 57 bus routes will experience temporary service reductions and/or period of service suspensions. Provisions have been made to protect service on the busiest corridors in the system during the busiest periods. November schedules will continue into December, with some minor adjustments.
TTC Service Change Notice for November 21, 2021
As I have recently documented in a series about service reliability on short routes, the TTC has already been missing buses regularly on its service, and there would be problems even without the ongoing issue of service reliability and an abdication of headway management.
I do not yet have the detailed memo explaining service changes thanks to the TTC’s email system outage, and can only report at this time on the information in the TTC’s post. When I do get the memo, I will produce the usual detailed spreadsheet showing all of the changes.
Changes Unrelated to Service Cuts
A few changes are due to factors other than the need to cut back on service.
In September, the 60 Steeles West bus was cut back to Pioneer Village Station and the 960 Steeles West Express took over the western portion of the route during most periods. The service level west of Pioneer Village has proven too low, and the 60 Steeles will provide a 15 minute service west to Kipling on top of the 960 during weekday daytimes.
The 953 Steeles Express will now stop at Leslie Street both ways.
Construction Changes
75 Sherbourne will divert via Jarvis street between King and Dundas Streets due to water main construction until late December.
501 Queen, 504 King, 505 Dundas and 506 Carlton (together with related night services) are affected by various projects. Details are in a separate article.
Service Cuts
Service on many routes has been trimmed, and some express operations have been dropped. The details, to the extent that they have been published, are shown in the spreadsheet linked below.
In many cases, I have simply put “Reduced” against a time period until I know the specifics of the changes. This spreadsheet will act as a template to accumulate information as it becomes available.
The TTC has announced that for the schedules coming into effect on November 21, 2021, service will be trimmed in response to the reduction in staff available due to the Covid vaccination mandate.
The plans are focused on protecting and maintaining scheduled service on the busiest routes
TTC Media Release, October 27, 2021
The TTC will give priority to the busiest routes in the system and the busiest times of the day, particularly bus routes where ridership has returned more strongly than on other parts of the network. The announcement cited “Wilson, Jane, Eglinton, Finch and Lawrence East, among others”.
Changes on other routes are described as similar to seasonal adjustment for summer and Christmas/New Years. The hours of service will not change. The level of service will be based on TTC Service Standards.
Operators will be made available for service in several ways:
Capital projects will be temporarily deferred and weekend/night-time closures will be cancelled so that shuttle bus operators are available for regular service.
New operator hiring will continue over “the next several months”.
Operators now used for moving vehicles between divisions will be redeployed to regular service.
Recently retired operators will be invited to return to work on a temporary basis.
Employees who are unvaccinated or have not shared their status by the end of the day on Nov. 20 will be placed on unpaid leave until they receive all their required vaccine doses, or Dec. 31, whichever comes first.
These measures do not apply to employees with an approved Ontario Human Rights Code exemption.
As of today, 88 per cent of the agency’s 15,090 active employees have shared their COVID-19 vaccination status. In total, close to 86 per cent of unionized, and 94 per cent of non-unionized employees have shared their status with the vast majority already fully vaccinated.
TTC Media Release, October 27, 2021
When I receive the detailed memo of planned service changes, I will produce the usual breakdown for readers.
Although I am sympathetic to the labour-management strain of this situation, there are a few home truths for either side.
Operators are in an essential, public-facing role. Both their vaccination and disclosure to the TTC should not be up for debate. This should not be a matter either on the basis of one’s political preference or as a side-effect of the contentious labour-management relationship.
A major problem today with service quality is that route supervision is sorely lacking, especially at evenings and weekends, as my ongoing series of route-based reviews shows. Operators who habitually run nose-to-tail with other vehicles, and supervisors who do not break up such bunching, are equally to blame.
A further problem exists in a shortage of operators for the scheduled service today. Buses vanish from service when relief operators fail to appear to take over vehicles. The missing buses compound other service reliability issues.
As for management, statistics purporting to show that good service is provided tell more about the pursuit of gold stars on their report cards, than of a real care for service quality. At the political level, the TTC Board seems utterly unwilling to demand that the organization provide reliable service and that metrics truly reflecting what riders see are used to monitor quality.
The TTC claims that they have run-as-directed buses to fill gaps. However, the prevalence of gaps on the few routes I have already reviewed in detail implies that the number of RAD buses is far fewer needed for this task. The generally laissez-faire attitude to route management suggests nobody even notices or cares when service is out of whack, much less dispatches RADs to fill in. The TTC produces no report showing how these vehicles were used, and they are difficult to track with the vehicle location data feeds. There is also a basic question of how these vehicles can fill gaps when they are also used for subway shuttles.
These will be difficult months for riders just at a time when demand on the system builds up again. The TTC refers to its Service Standards, but riders on any busy route will recount tales of overcrowded vehicles and pass-ups of waiting passengers. With erratic service it is impossible to know which of these situations are due to route overcrowding and which to poorly regulated vehicle spacing.
The TTC tells riders that service meets “standards”, but those are based on averages and have wide margins for missing targets. The effect is something like a guarantee that the sun will shine and weather will be good “on average”.
I hope that drivers who have not disclosed do so and are able to return to work as soon as possible. This is not a case of “individual rights” but of workplace and public safety. As for those who have no legitimate reason to go unvaccinated, let them find work elsewhere if anyone will hire them.
As for TTC management, it is time to acknowledge problems of bunching and gapping, and to actively work against them. The TTC Board should demand this as a basic management goal. If management is unwilling or unable, then find new management.
TTC service is only as good as the TTC makes it, and recovery, even without staffing challenges, depends on doing the best possible for riders.
A common theme in these pages is the TTC’s constant problem with providing reliable service. Many problematic routes lie outside of the core on long east-west routes that must deal with varying traffic conditions, the difficulties of blending branched services, and a faster return of demand and post-pandemic traffic levels than in the central area.
These are not excuses for poor service, but at least represent some of the challenges faced. This is not true for short routes primarily in the old City. For these routes, a trip between Eglinton and Lake Ontario is comparatively long, and some reach only a few kilometres from Line 2 Bloor-Danforth south.
They should be routes that run like a clock, but they suffer many problems seen on their longer cousins outside of the core. If the TTC cannot operate these reliably, how can we expect them to fare with behemoths like east-west routes on Lawrence or Finch, or routes from Line 2 north to Steeles and beyond?
This article is an introduction to a series that will examine service on:
A factor among many of these routes is that service is not particularly frequent. If there is a bus missing, or pack of buses running together (effectively the same thing), the gap is wide. The added waiting time (assuming a rider bothers) can be greater than the time they will spend riding from point “A” to “B” on the route. Waiting times hurt transit because riders see them as unproductive, and this can be compounded by uncertainty about the next bus’s arrival and capacity.
Here is an overview of service frequencies on these routes during selected periods. Some of these have 10 minute or better service during some periods, but many do not.
In some cases, pairs of buses run together over the course of two or more trips indicating that there is no effort made to evenly space service.
For branching services, buses on each branch do not blend evenly where the branches combine.
In the worst case situations, all of the vehicles on the route are running as a pack.
Buses missing from service, with the remaining buses not spaced to account for the gap. In some cases, a route is served by only one bus when there should be two or three.
Missing buses are most common during evening and weekend periods when spare operators are harder to come by, in part because many of the “run as directed” operators are used for subway replacement services. Because TTC has fewer operators than crews in some cases, there are open crews that are only filled if there is a spare operator available.
Although the TTC has standards defining what constitutes acceptable service, almost none of these address the problems listed above. That is because:
Buses can be running close together but still be “on time” according to the service standard.
There is no standard that addresses gaps and bunching explicitly.
There is a standard related to missed trips, but no statistics have ever been reported for it.
The standards accept a wide range of exceptions with a goal of achieving targets only 60% of the time. There is no reporting of the proportion of service lying outside the standard even if it would be within the target.
There is no co-relation of vehicle crowding with service reliability.
To put it quite bluntly, these so-called standards allow management to claim to operate the system to “Board approved” targets, even though the TTC Board members probably have no idea of just how lax these standards actually are.
In turn, when riders complain, they are often told that the service is operating within standards, and that where there are problems, “run as directed” buses are dispatched to fill the gaps. This is simply not possible because there are not enough RAD buses to fill all of the holes in the service. Moreover, the TTC does not track or report on the usage of these buses to establish that they really do provide the benefits claimed for them.
TTC management hopes to lure riders back to buses, but the single most common complaint is that more service is needed. Part of “more” service involves simply running what is already there better. There is no point in advertising frequent service if what is actually on the street is anything but.
When they were approved, there was a staff presentation that set out the standards but did not actually explain what they might allow. The Board nodded in approval of something technical that looked impressive, but was clearly beyond their ken. The old Razzle-Dazzle works every time.
Updated October 14, 2021 at 2:45 pm: The description of the new 51B service to The Donway has been corrected to explain it as an extension of an earlier proposed 51B that would have ended at Laird Station.
Updated October 27, 2021 at 12:15pm: Links to TTC pages and reports have been updated to point to the new website.
The TTC has released the final version of its Service Plan for 2022 after a second round of stakeholder advisory group meetings. Much of this plan is the same as the interim version released in June 2021 and described in TTC 2022 Service Plan Consultation.
There is an updated Presentation Deck and a route-by-route description in text of the planned changes for the Line 5 Eglinton Crosstown opening in 2022. A map from the presentation is included later in this article.
The TTC Board will consider this plan at their November 17, 2021 meeting. They will discuss the 2022 Operating and Capital Budget which will include provisions for these changes, subject to funding availability, at their December 8, 2021 meeting (unless a special, separate meeting is called for the purpose).
There is no mention in the Service Plan of the possible effect of staff shortages as the condition which may trigger this (vaccination mandates) were not an issue when the plan was drawn up. Nor is there any discussion of a “plan B” for what might happen to service in the absence of sufficient subsidy from various governments.
Ridership and Crowding
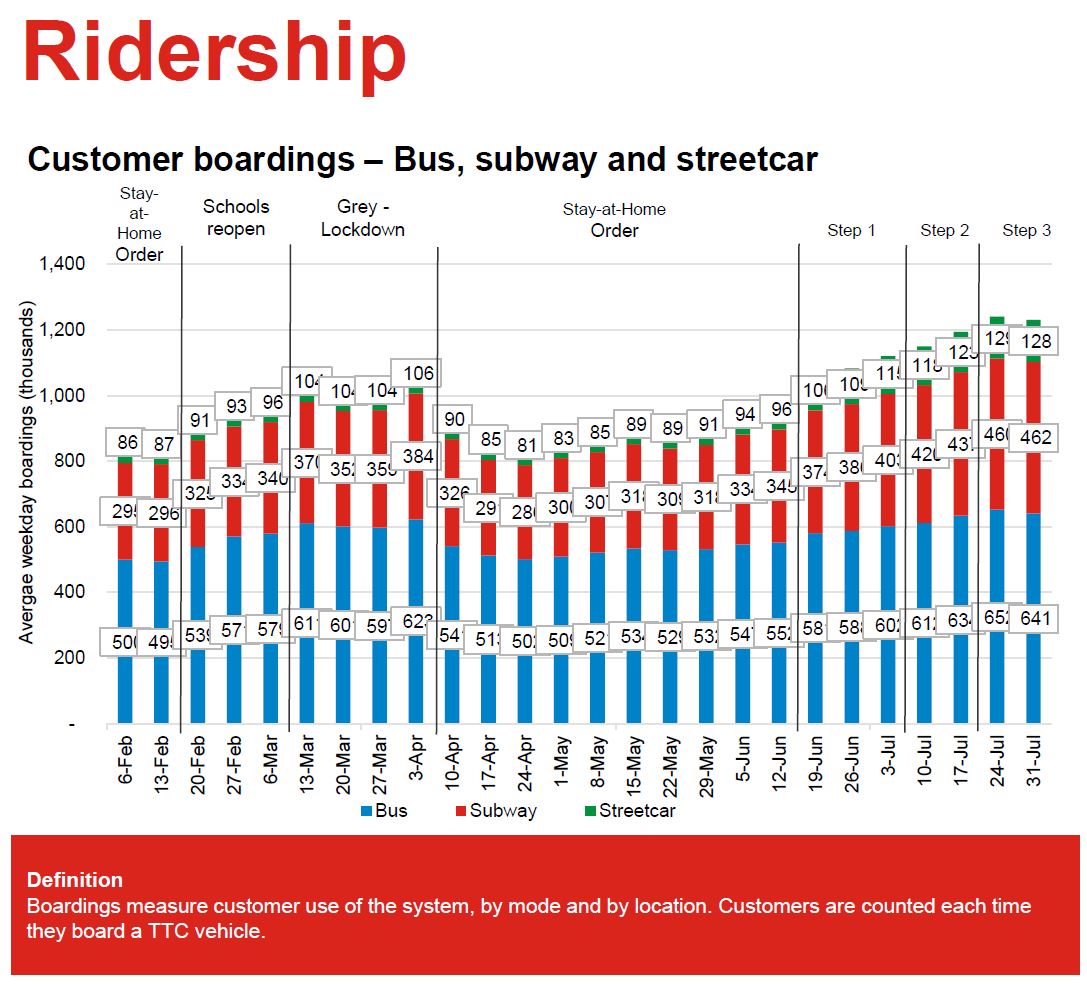
As of mid-September, ridership as measured either by boardings (unlinked trips with each transfer counted as a new trip, except in the subway) or by revenue rides (linked trips) sits at 45-46 per cent of pre-pandemic levels. The strongest recovery is on the bus network, followed by the streetcars and then the subway. The effect of the much-reduced downtown commuting is apparent for routes serving that area.
The TTC has not yet published an October CEO’s Report which might contain more recent counts. Personal observation from my own riding is that ridership has grown since mid-September.
As demand recovers, crowding will become more common (and already is in many places and times). The TTC has already passed the threshold of 30% ridership where full pre-pandemic service is required to provide physical distancing. As riding grows, this will no longer be possible. TTC Service Standards for what constitutes “overcrowding” that requires more service will shift as demand recovers. In many cases, vehicles will simply be more crowded, but in the worst cases the TTC will make tradeoffs between existing lightly-used services and routes that are overcrowded.
Occupancy levels are growing as are boardings. The values below are all-day totals and they do not break out growth by time of day or location. The blue line shows that as of mid-September 34% of trips were above the 30% capacity line and the trend is upward.
There is no provision in the Service Plan for growth and any addition must be offset by a reduction elsewhere.
Service Reliability
Notable by its absence in the Service Plan is any discussion of service reliability as a line management strategy. Regular readers and riders will know that bunching and gaps are a constant problem across the system. This wastes capacity and results in more riders seeing crowded conditions than would be the case with reliable, regularly spaced service. The TTC has yet to produce Service Standards and metrics that reflect this aspect of service.
When times are tight, better operation of what is already on the street is a low-cost way to improve service. Alas this requires both an acknowledgement that there is a problem within the TTC, and some improvement in labour-management relations to aid with implementing better service regulation.
The Plan mentions adjusting schedules to fit actual conditions. This practice began a few years back with padded travel times to ensure that short turns were rare, but now more commonly changes involve removal of the excess travel time. This can either free up vehicles for other routes, or be used to improve service at no net cost on the route with a new schedule.
Other planned changes include reduction of non-revenue service where garage trips are “dead headed” with vehicle out of service and a pilot of timed connections on the Blue Night Network.
Changes for Line 5 Eglinton Crosstown
The map of post-Line5 services is very similar to the June 2021 version.
Two routes have been modified in response to rider feedback.
34 Eglinton
This route was originally planned as a parallel surface route between Mount Dennis and Science Centre (Don Mills) Stations. It has been extended east to Kennedy Station so that there will be a surface bus paralleling the LRT service. This will maintain service at existing bus stops that would have otherwise disappeared.
51 Leslie (Corrected)
In the original proposal, there would have been a gap in service on Lawrence west of Don Mills Road where the 162 Lawrence-Donway bus turns south on its way to Science Centre Station, and service would have been removed from the loop around The Donway.
This has been revised by extending the proposed 51B Leslie branch that would have turned back at Laird station. It will now turn east on Lawrence from Leslie and loop around The Donway.
Other Route Changes
Five new/modified routes were proposed in the original service plan, and these remain as is. There is no announced implementation date.
Other Planned Improvements
Other potential changes/goals for 2022 include:
Improve stop accessibility and provide for articulated buses
Heated shelter pilot
Jane-Finch hub design
RapidTO Jane Street (Eglinton to Steeles)
3 queue jump lanes (Locations TBA)
Advanced Transit Signal Priority at 100 locations (2022-23)
Cross-border service pilot
Improve connections with private microtransit shuttles
Automated Transit Shuttle Pilot report
Integration of cycling and transit infrastructure
Additional details on specific proposals are likely to appear when this plan goes to the TTC Board for approval.
The City and TTC have launched phase 1 of consultations on expansion of RapidTO Transit Priority to bus and streetcar lines. Both a video and a presentation deck are available on the City’s page for this project.
The premise of this round is to determine priorities for the types of improvement people want to see and the locations where they might be implemented.
Phase 1: Understanding Your Priorities to commence in Fall 2021
Phase 2: Identifying Top Roadways throughout early 2022
Phase 3: Roadway-Specific Studies between 2022 and 2031.
There is not much new here, and regular followers of the TTC will know that they have been talking about this sort of thing for years.
The problem is well-known: slow and unreliable service, and the primary solution on offer is transit priority.
We have all known that traffic congestion is a problem for transit pretty much since the first time we rode a bus or a streetcar. Although there was some respite during the pandemic era because fewer cars were on the road, this trend quickly reversed, and on some corridors the travel times in mid-2021 are longer than they were before March 2020, and they are growing.
For details, please see the series of article on the behaviour of RapidTO candidate corridors:
A generic statement that “22% of buses and 34% of streetcars experienced delays” does not address the detailed picture including the time and location of delays. Most routes have problems in certain places, directions and times, even by day of the week, and priority treatments will have limited benefit if used where there are no delays today.
Conversely, if priority is given only where it is easy to implement, key problems may go unsolved. Even worse, if the “priority” actually slows transit (as has happened with signalling on some reserved lane implementations) then we are not giving transit its due.
With streetcars and buses carrying 70 per cent of TTC riders, they deserve priority treatment. The subway may carry a lot of people because it consolidates demand in a few corridors, but without the surface routes, the subway would be starved for passengers
… it is essential to make bus and streetcar service a practical and reliable travel option for the most people.
RapidTO Presentation, Slide 3
The argument continues by claiming that transit priority can:
… make bus and streetcar service more reliable, reduce delays and shorten travel times on congested roadways … [and] also provide relief on overcrowded bus and streetcar routes.
RapidTO Presentation, Slide 4
The presentation then wanders off through a set of slides about how better transit will assist the City to achieve various goals including environmental improvements. Eventually we get to the statement:
When buses and streetcars are given priority, they will operate more efficiently and reliably. Ultimately, the hope is that we can provide people with a practical travel option other than driving personal motor vehicles.
RapidTO Presentation, Slide 7
That “ultimately” is a key word. At the rate any road use changes are implemented in Toronto, most riders will not see much if any improvement to their routes. The idea that transit will improve is a mirage, something that happens elsewhere, if at all. Riders travel on a network and only with network-wide improvements will the majority of riders see progress.
This has political implications because only with widespread support will continued and increased spending be popular, not to mention any moves to shift road capacity in favour of transit riders. Benefits that always appear to go to someone else do not endear transit to voters.
The reconstruction at Wilson Station that will displace routes from the lower level bus loop to a temporary area in the parking lot has been deferred to the schedule change in mid-November.
The reconstruction of track at Lake Shore and Kipling that would have required diversion of bus services has been deferred with no new date.
StudentMoveTO Moving Post-Secondary Students in the GTHA: Preliminary results from a survey and study on student mobility in the Toronto Region (An invited presentation by Roger Keil of York University and Danya Tugg of Ryerson University)
Ridership is growing slowly on the TTC with the largest changes, proportionally speaking, coming on the streetcar and subway systems that serve downtown. These modes are now at 31 and 37 percent respectively of pre-covid levels while the bus system is at 46 per cent as of July 31, 2021.
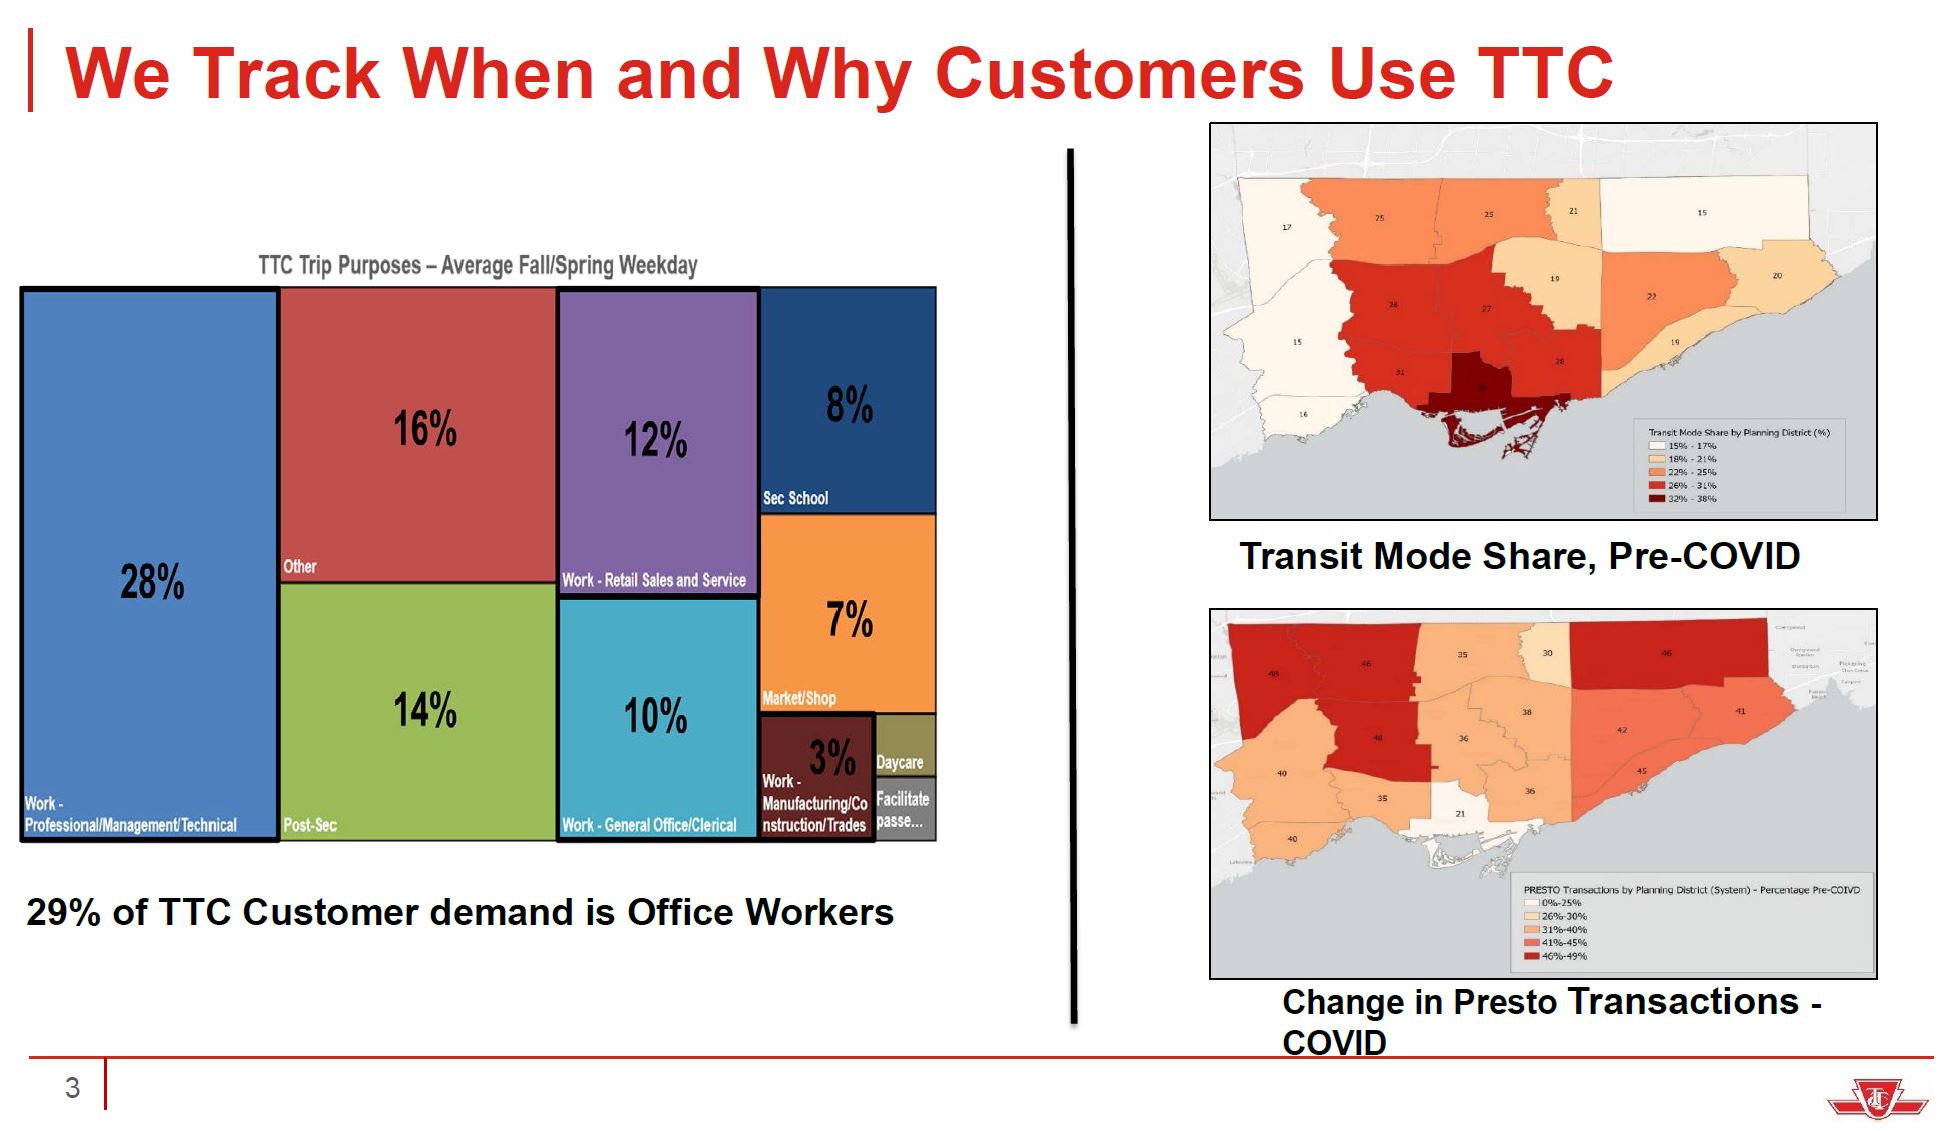
TTC Staff presented an overview of ridership trends and projections looking ahead to 2022 and 2023. An important part of looking ahead is understanding where the TTC was in pre-pandemic times. A great deal of planning and political effort focuses on commuters, especially those headed to the core area, but they are only part of the overall travel demand served by transit.
The chart on the left below shows the purpose of transit trips. Just over half, are work trips with a breakdown of:
28% “professional, managerial, technical” (a group most likely to embrace work-from home),
12% retail sales and service,
10% general office and clerical, and
3% manufacturing and construction.
This breakdown will also reflect the job locations and the relative ease of travel to them by TTC. What is not shown is the mode share for each group, something that would have to be further subdivided geographically. The overall mode share was, to no surprise, concentrated downtown, and it falls off to the outer suburbs.
The map flips when charting the change in Presto usage (a surrogate for trip counts) in the pandemic era. The greatest retention of riders occurs in the locations where overall transit mode share was low showing that these riders have much less choice in whether to travel by transit. By extension, demand in these areas did not fall as much as downtown, and compounded by service cuts, even a reduced demand could produce crowding.
Planned service changes taking effect on Thanksgiving weekend include improvements on many routes and new or restored services on express bus routes. Construction on the 501 Queen route will continue to disrupt service there until year-end.
There are no subway service changes in October because Lines 1 and 2 are operating with a transitional combination of scheduled, gap and extra trains while the TTC determines how strongly ridership returns. See How Much Has Subway Service Improved? (II) for details.
Updated September 24, 2021 at 6:15 pm: Planned construction work at WIlson Station and at Kipling/Lake Shore has been deferred.
Express Bus Changes
Several routes will have new or expanded express service. Where this happens, service on the local branch will be reduced, but the combined express and local services will improve over existing local-only schedules.
The affected routes are:
929 Dufferin Express: Sunday morning and afternoon service added.
943 Kennedy Express: New peak period service between Kennedy Station and Steeles.
Northbound stops: Kennedy Station, Lawrence Avenue East, Ellesmere Road, Progress Avenue, Antrim Crescent, Village Green Square, Sheppard Avenue East, Finch Avenue East, McNicoll Avenue, Steeles Avenue East, Midland Avenue.
Southbound stops: Midland Avenue, McNicoll Avenue, Finch Avenue East, Sheppard Avenue East, Village Green Square, Antrim Crescent, Glamorgan Avenue, Ellesmere Road, Lawrence Avenue East, Kennedy Station.
953 Steeles East Express: Service to Staines Road will be added weekday midday and early evening, and on weekends during the morning and afternoon. Service will run via Yonge and Steeles rather than the route via Bayview used by the PM peak express buses.
960 Steeles West Express: Service to HIghway 27 added on weekend mornings and afternoons.
968 Warden Express: New peak period service between Warden Station and Steeles.
A few routes will have minor changes to improve on-time performance:
900 Airport Express
937 Islington Express
501 Queen Restructuring for Construction
This route will be affected by several new and ongoing construction projects. Working from west to east:
The approach to Long Branch Loop westbound will be rebuilt including a queue jump lane to aid streetcars entering and leaving the loop, revised signalling and improvements for pedestrian safety.
The intersection at Kipling and Lake Shore, as well as Kipling Loop will be rebuilt. This will require a diversion of the 501L Queen and 44/944 Kipling South service with dates and routing details to be announced.Deferred with no new scheduled date.
The King-Queen-Queensway-Roncesvalles project is, as I write this on September 9, stalled due to Toronto Hydro problems. The date for a move to “Phase 2” with through running across Queen and closure of King Street east of the intersection has not been announced. The “Phase 1” routings will continue operation in the meantime.
In October, the west end of the Bay-to-Fennings reconstruction project will begin working east from Fennings (east of Dovercourt). This project includes replacement of the intersection at Shaw Street on dates to be announced.
The central Queen diversion of service via King to Charlotte Loop will continue until year-end rather than having streetcar service revert to McCaul Loop in October. Overhead conversion work is not yet complete for pantograph operation on this portion of the route. In January, streetcar service will return to Queen, but will operate only to Wolseley Loop at Bathurst Street because the KQQR project will not be completed.
Service east of Russell Carhouse (effectively from Greenwood) on Queen to Neville Loop will be converted to bus operation during overhead conversion for pantographs. Initially streetcars will turn back from the carhouse while a 501N Queen bus operates from Neville to Lake Shore Garage (at Commissioners and Leslie) as a replacement service. In November, the TTC expects overhead conversion for pantographs will be complete far enough east that streetcars can operate through to Woodbine Loop, and the 501N will operate west only to Coxwell. This arrangement implies that 501 Queen will convert to pantograph operation.
503 Kingston Road cars will continue to operate using trolley poles as the overhead on Queen will be in hybrid format. The date for pantograph conversion on Kingston Road has not been announced.
301 night service will be provided by buses over the entire route to provide a transfer-free trip.
The nomenclature for various parts of the Queen route will be:
501L to Long Branch westbound
501H to Humber westbound
501B to Broadview eastbound
501N between Commissioners and Neville, later between Coxwell and Neville
Route 69 Warden South
The naming of the two directions of service will change for consistency with other looping routes. Route 69A will operate clockwise while 69B will operate counterclockwise. This is the reverse of the current arrangement.
Route 70B O’Connor Replaced By Full Time 70A Service
The northern branch of 70 O’Connor will operate as 70A to Eglinton during all hours rather than looping at Eglinton Square as 70B on weekday late evenings and Sundays.
Route 95A York Mills Extended
The 95A service that now operates to Kingston Road & Ellesmere will be extended to Sheppard Avenue & Port Union Road.
Revised 121 Esplanade-River Route
Route 121 Fort York-Esplanade will be renamed as Esplanade-River in line with a substantial change to the route.
The route will operate between Bay & Front Streets and Broadview & Gerrard (see map below).
The seasonal service to Ontario Place and 121 service west of Bay Street generally will be discontinued.
The seasonal service to Cherry Beach will end. Service for 2022 will be announced as part of the upcoming Service Plan.
Service will improve noticeably on weekday daytimes because the extended travel time and headways for congestion between Union Station and the Exhibition will no longer be required.
Other Seasonal Changes
Service to the Toronto Zoo will be cut back because of the reduced hours there over the fall and winter.
The 175 Bluffer’s Park bus will end for the season with the last day of service being Thanksgiving Monday, October 11.
Other Construction Changes
The interline between 28 Bayview South and 14 Glencairn will end because the bus loop at Davisville Station will reopen. At the same time, the schedules of the two branches of 97 Yonge will be modified to improve vehicle utilization during some periods.
The lower level of Wilson Station bus loop will close for repairs until some time in 2022. During construction, a temporary bus loop will be used in a corner of the parking lot east of the north end of the station. The following routes will be diverted to that loop: 29 Dufferin, 929 Dufferin Express, 104 Faywood, 160 Bathurst North.This project has been deferred to the November schedule change.
Service Improvements
Weekday service improvements are planned for 14 Glencairn, 24 Victoria Park, 32 Eglinton West, 34 Eglinton East, 43 Kennedy, and 88 South Leaside. Weekend service will improve on 68 Warden.
Adjustments for Reliability
Schedules will be adjusted on several routes to improve reliability. When this program began a few years ago, the typical adjustments involved longer travel times and, in some cases, less frequent service to compensate. Now, the TTC is trimming some travel times in recognition that they are excessive causing extended layovers and unreliable departure times at terminals.
Running times in some periods have been reduced and service improved on:
20 Cliffside
22 Coxwell
23 Dawes
51 Leslie
56 Leaside
113 Danforth
900 Airport Express
937 Islington Express
Running times are increased and service will be less frequent on:
30 High Park
69 Warden South
Other changes:
8 Broadview: Running time has been changed to terminal layover time during most periods, but headways remain at 30′ except late evenings when they will be 20′.
53 Steeles East: This route is affected by changes in the 953 express service, but running times for the local service in some periods have been reduced.
59 Maple Leaf: Running time has been changed to terminal layover time during many periods, but off-peak headways remain at 60 minutes on each branch.
68 Warden: This route is affected by the new 968 express service in peak periods. Running times for the local service in some periods have been reduced.
73 Royal York: PM peak and early evening service rebalanced between La Rose and Albion Road branches.
97 Yonge: Running times and the interline arrangements between branches have been adjusted during some periods. Peak period service will improve, but off peak service remains half-hourly on both branches.
The Details
Details of existing and planned services are in the spreadsheet linked below.
Recently I wrote about the discrepancy between the TTC’s claimed improvement in subway service for September and the information available in various sources. See How Much Has Subway Service Improved?
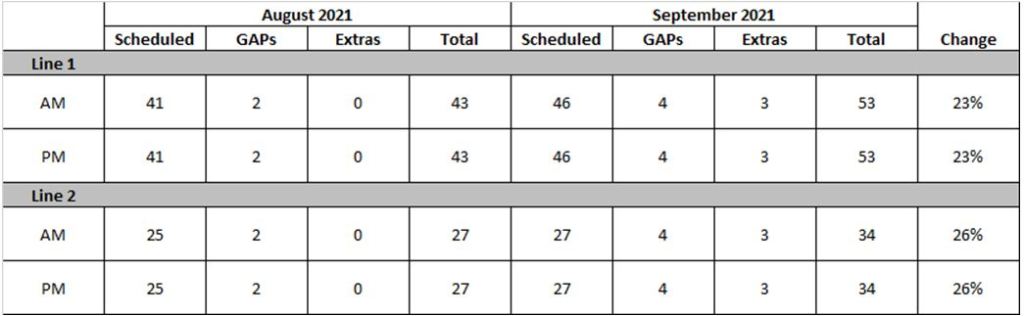
The TTC has provided an update on their service for the next few months as shown in the table below.
Source: Email from Mark Mis, Head of TTC Service Planning, September 9, 2021
The discrepancy between previously available figures and the claimed level of increase arises from various factors:
In addition to scheduled service and “gap trains”, the TTC will operate three extra trains on each of lines 1 and 2.
The City and TTC statements about percentage increase are based on the number of trains, not the capacity of scheduled service.
On Line 1, two of the additional trains are used to extend the scheduled travel times.
On both lines, there are five more unscheduled trains (gap trains and extras) in September than in August.
The TTC advises that this arrangement will last through the September and October schedule periods (which run through mid November) as they determine the level of subway demand and appropriate level of scheduled service.
Extra trains are deployed by operations. This provides the flexibility to adjust the number and time of these trains and crews outside of the normal board period window. The extra trains on the subway are being deployed by operations starting this week on a regular basis to coincide with back to school.
We took this approach for the September + October board periods because we want to see how our estimated demand projection compares to actual demand.
We will be reviewing ridership numbers over September before making a final decision on the number of GAP trains and extra trains on Line 1 and Line 2 for the November board period.
Source: Email from Mark Mis, Head of TTC Service Planning, September 9, 2021
The effect on actual service should appear in stats included in the CEO’s report showing the ratio of actual to scheduled trains/hour at peak points. With 7 unscheduled trains, the actual service operated should be well above the scheduled level, and this metric would show how these trains affect capacity at key locations.
Fact check on a City of Toronto press release: “To accommodate increased demand in September, the TTC is increasing service system-wide to support the expected increase in ridership, including 25 per cent more subway trains on Line 1 and Line 2 at peak times on weekdays…”
2. The actual change in peak services are: Line 1 peaks were every 3’45”, now every 3’30”. Line 2 changes from every 4′ to 3’45” during peak periods. Count of scheduled trains goes up partly due to more gap trains (spares), longer Line 1 travel time, and more frequent service.
3. Change in capacity is about 7%, not 25%. The number of trains changes from 43 to 50 on Line 1 (+16%), and from 27 to 31 on Line 2 (15%). Capacity is driven by trains/hour past a point, not by total train count.
4. The press release overstates the actual change in subway capacity during peak periods.
5. Early evening service is improving substantially. Line 1 from every 5′ to 3’30” (43%), Line 2 from 7’15” to 6′ (21%). Late evening Line 1 from 7′ to 5′ (40%), same change as early evening on Line 2.
6/6 Why are the City and TTC overstating the peak improvements?
TTC’s Stuart Green replied somewhat later in the day:
Oh, Steve. Looks like I have to interrupt my vacation to correct you. Ten trains more. 43 in August 53 in Sept. (some additional trains added last minute based on demand expectations). 23.25 per cent. We rounded to 25 based on commonly accepted rounding practices.
The problem is that available TTC information, on which I based my claims, says nothing about those extra trains, but matches what I have published here and written on Twitter.
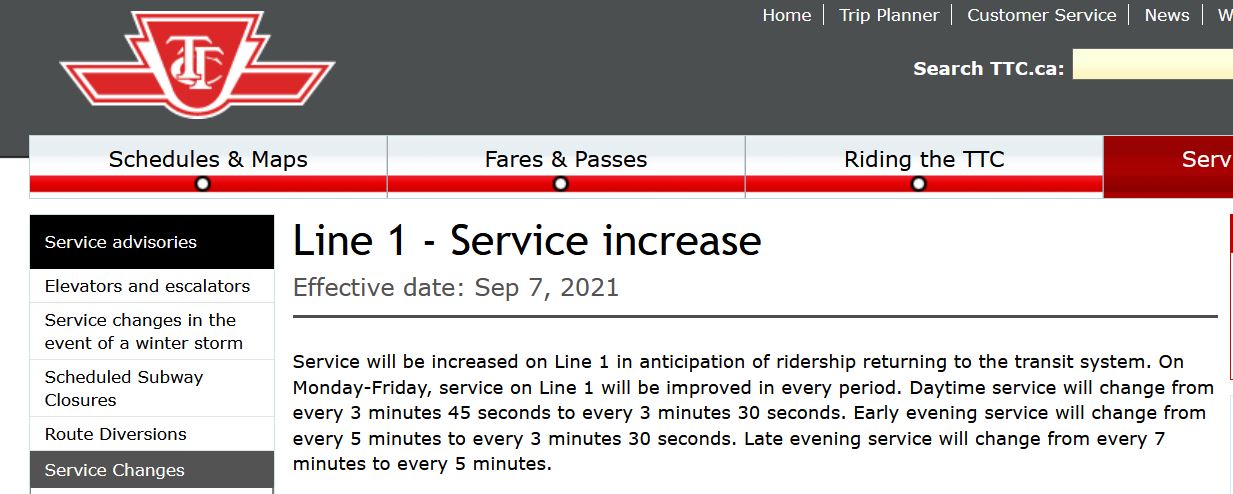
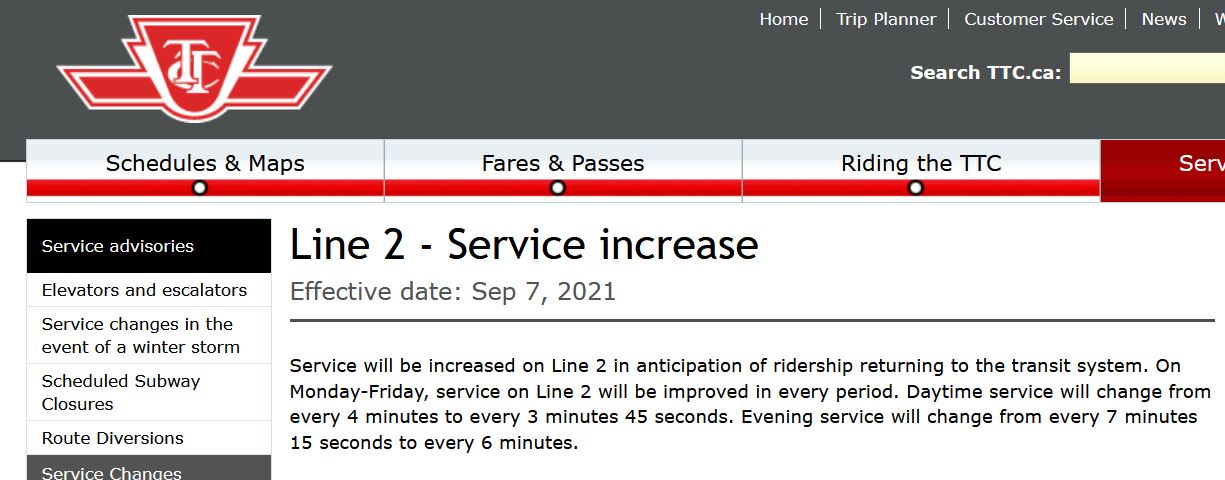
Source: TTC Website copied September 7, 2021Source: TTC Website copied September 7, 2021
Another source of scheduled service information is the electronic version of schedules that are published on the City of Toronto’s Open Data site by the TTC. Without going into the mechanics of reading these, they clearly show the 3’30” and 3’45” headways advertised above for Lines 1 and 2 respectively.
This information also corresponds to what is stated in the Board Period Memo issued by Service Planning on August 13 (this memo is the basis for my regular previews of service changes).
Service will be restored on Line 1 in anticipation of ridership returning to the transit system. On Monday-Friday, service on Line 1 will be restored to January 2021 service levels, with two additional gap trains for demand responsive service (increasing to four gap trains).
…
Service will be restored on Line 2 in anticipation of ridership returning to the transit system. On Monday-Friday, service on Line 2 will be restored to January 2021 service levels, with two additional gap trains for demand responsive service (increasing to four gap trains).
TTC Board Period Memo issued August 13, 2021
Note that restoration is to January 2021, not 2020 or pre-pandemic levels.
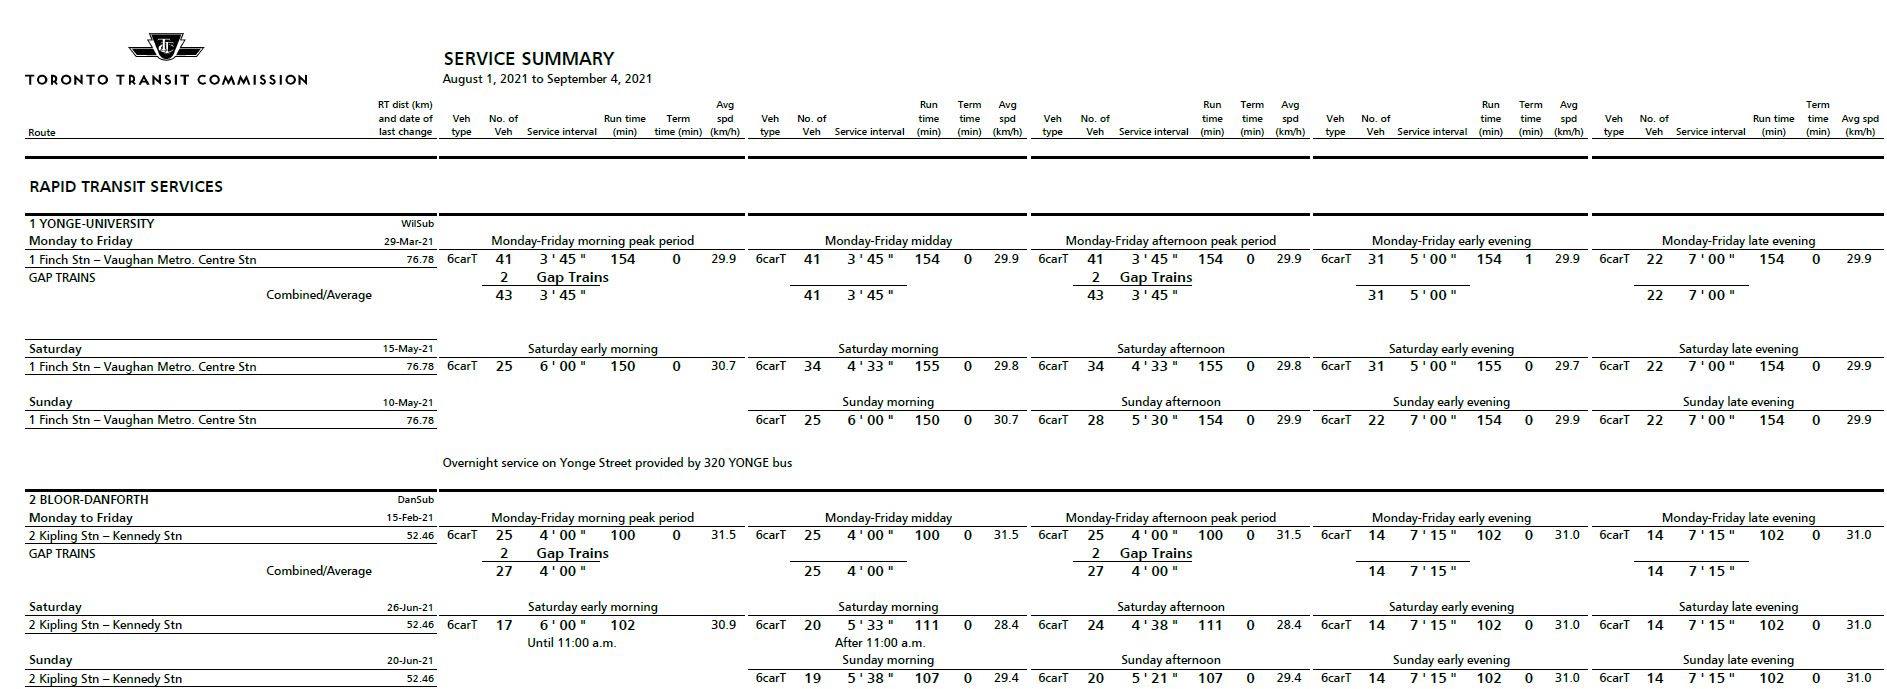
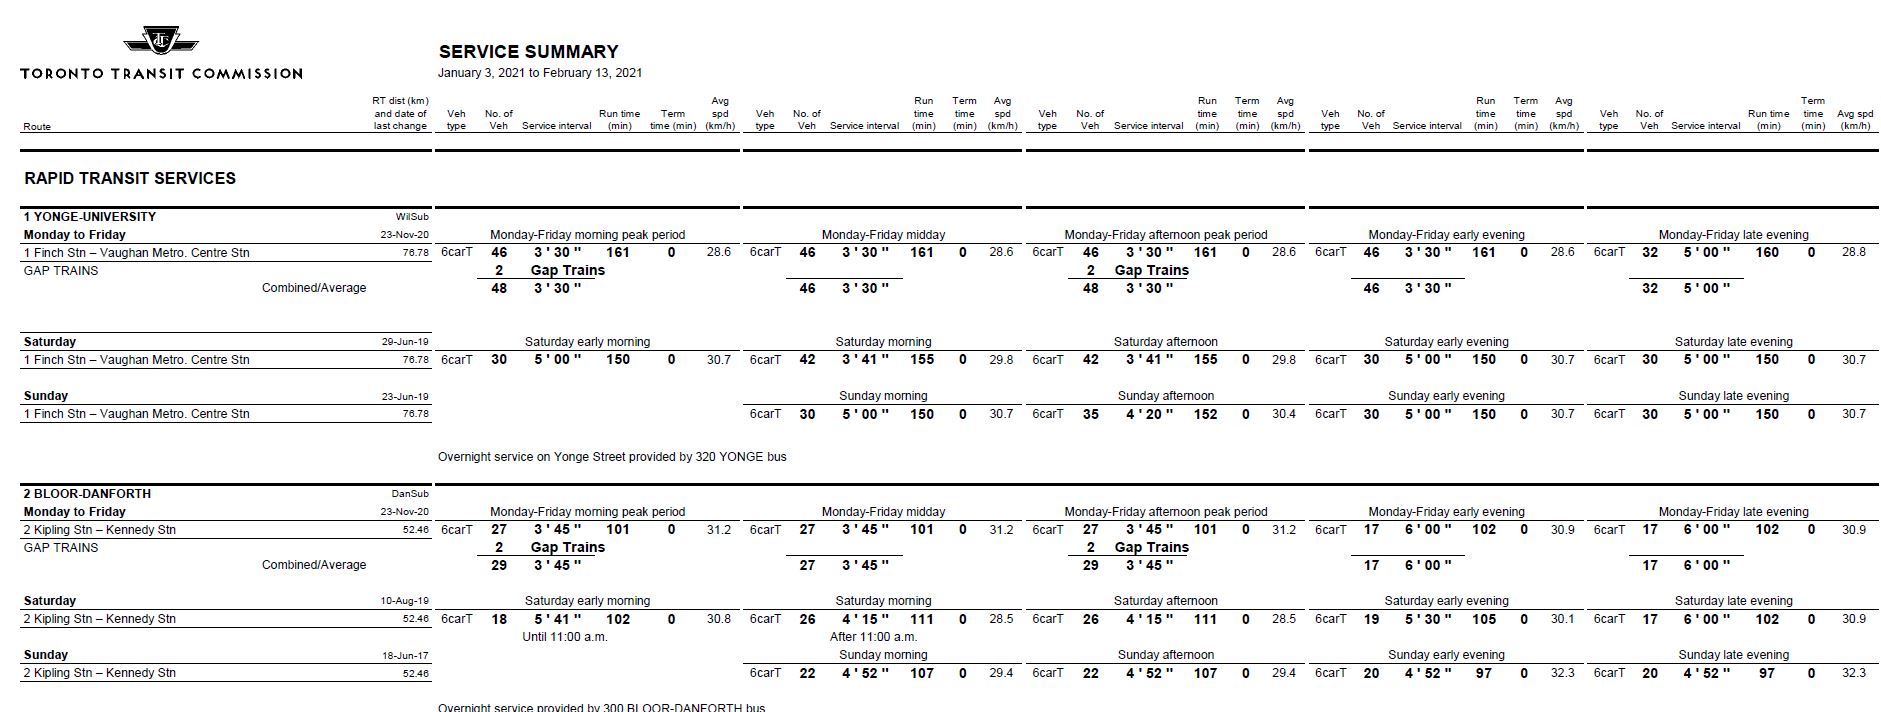
Below are excerpts from the TTC’s Scheduled Service Summaries for August and January 2021. Note that the round trip time for Line 1 is 161 minutes in January, but only 154 minutes in August. Some of the “restored” trains simply go to extending the trip time, not to providing more capacity. On Line 2, the round trip times are almost identical (101 vs 100 minutes).
Every source I have for info on how much service is running says that there is a smaller percentage increase than the press release claims.
Moreover, the press release uses the change in train count as an implication of a capacity increase greater than is actually provided.
This distortion arises from various factors:
Of the seven trains added to the Line 1 schedule, 2 are gap trains that are inserted where needed on the line. They may or may not add to the total service provided depending on where and when they are used.
Changing the scheduled headway from 3’45” (225 seconds) to 3’30” (210 seconds) would require 3 additional trains if the travel time were not changed. Providing extra travel time requires two more trains.
The TTC says that they have added three more trains above the scheduled level (49 versus 46 regular trains). If these are integrated into the schedule, the headway would fall to 3’17” rather than 3’30”. This is still only a 14% increase in capacity versus the August schedule of 3’45”.
The rounding used by the TTC from 23.25 to 25% is equivalent to almost an entire train. This is not a trivial rounding error.
A 25% increase in the number of trains does not translate to a 25% increase in service capacity because four of the additional trains are added as gap fillers or to stretch the scheduled travel time.
The press release states that this is applicable to both Lines 1 and 2. If extra trains above the scheduled level on Line 2 were also added, the TTC has been silent on the details as I write this.
Between extra trains the TTC has added and counting trains in service rather than trains/hour past a point, the press release claim of 25% more trains is correct on its own terms. However, it gives the impression of a greater increase in service capacity than what is actually provided.
This is a subtle but important difference. Tempered by accepting that the TTC has added three more trains to Line 1 service than shown in previously published information, I stand by my statement that the City’s press release exaggerates the degree of service improvement.