
This article continues my analysis of corridors where RapidTO “red lanes” have been installed or proposed to speed bus operations. Previous articles in the series are:
- Red Lanes, Express Buses and Service Reliability in Scarborough
- A Dashboard for Scarborough Red Lanes
- Service Reliability on 35/935 Jane
- Service Reliability of 29/929 Dufferin
- Service Reliability of 60/960 Steeles West
This article reviews travel times and headway reliability (the intervals between buses) primarily through the pandemic era to July 2021 with April 2018 data as a pre-pandemic reference.
The High Points
Finch Avenue East is a corridor with a considerable amount of service through the combination of several express and local branches. Service will improve on weekends starting in September with the reintroduction of express service, but that is beyond the scope of this analysis.
As on many routes, travel times fell in March 2020 with the onset of the pandemic shutdown, the drop in road traffic and a big drop in transit demand. Through March, the travel time pattern changed from a pre-pandemic character with traditional peaks to an almost flat travel time value all day long. This drop, corresponding to a condition with little interference from traffic, probably represents a “best case” of the improvement that a transit priority lane can bring to Finch Avenue East.
This effect was primarily on weekdays on Finch with a smaller drop on weekends. The AM peak completely disappeared, and the PM peak has only re-emerged in recent months.
Travel times are climbing through 2021 and are in some cases back to pre-pandemic values, although not during peak periods.
Speed profiles for the local and express services based on the second and third weeks of July 2021 differ somewhat, but not as much as on other routes. However, a speed profile indicates how fast buses are moving when they are moving, and a stopped bus only counts as a “zero” once regardless of how long it sits serving passengers or waiting for a traffic signal.
Average speeds for buses at some times and locations on Finch exceed the posted 50 kph speed limit. This is no surprise to anyone familiar with suburban traffic patterns. Whether this will persist as traffic volumes build remains to be seen.
As in many of these route analyses, the weak point is headway reliability. All the speed in the world is of little benefit if a bus does not show up reliably and regularly. This can be compounded by vehicle crowding when buses are running in packs rather than on an even spacing.
The article includes charts of headways (the time between buses) in the first week of July 2021, a period when conditions were about as favourable as we will see for weather and the level of demand. At several points on the route, both the local and express service headways can vary quite widely with large gaps and groups of buses travelling together.
The average headways are close to the scheduled values indicating that all of the scheduled trips were operated. The problem simply was that they were not reliably spaced. This problem exists during all operating periods and on weekends, not just weekdays.
Existing and Future Service
Service on Finch East if markedly different from other corridors in that the express branch, 939, provides a substantial portion of the service during most operating periods.
On weekdays, there are six separate services:
- Local from Finch Station:
- 39A to Neilson Road
- 39B to Old Finch and Morningview
- 39C to Victoria Park (peak only)
- Express:
- 939A from Finch Station to STC (evenings)
- 939B from Finch West Station to STC (no late evening service)
- 939C from Finch Station to Morningside Heights (peak only)
These services overlap to provide a various levels of service and travel options at different times during the day.
The summary below shows the August schedules.
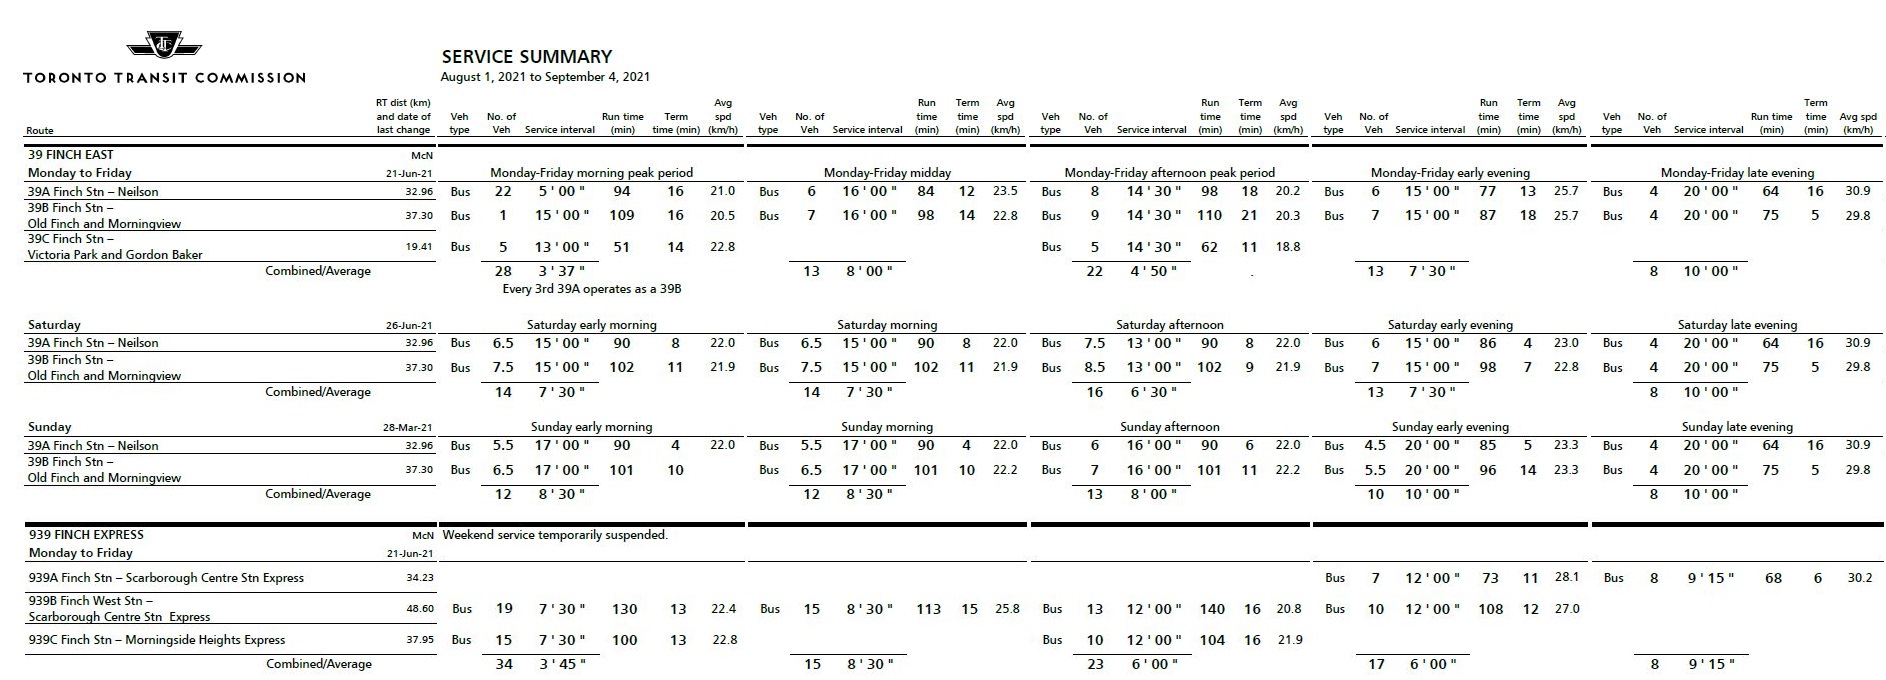
In September, the express service will return on weekends. During the daytime and early evening on Saturdays and Sundays, about half of the buses will be express trips, and these trips will be in addition to the local service that is already scheduled. Weekend service will substantially increase.
For example, on Saturday afternoons, there will be a 14’30” headway on each of the 39A and 39B services. The combined service at 7’15” will be only slightly wider than the existing 6’30”. New express service on 939A and 939B each running every 12′ (6′ combined) will be added on top of the local trips. This will take the buses/hour count from about 9.23 up to about 18.3.
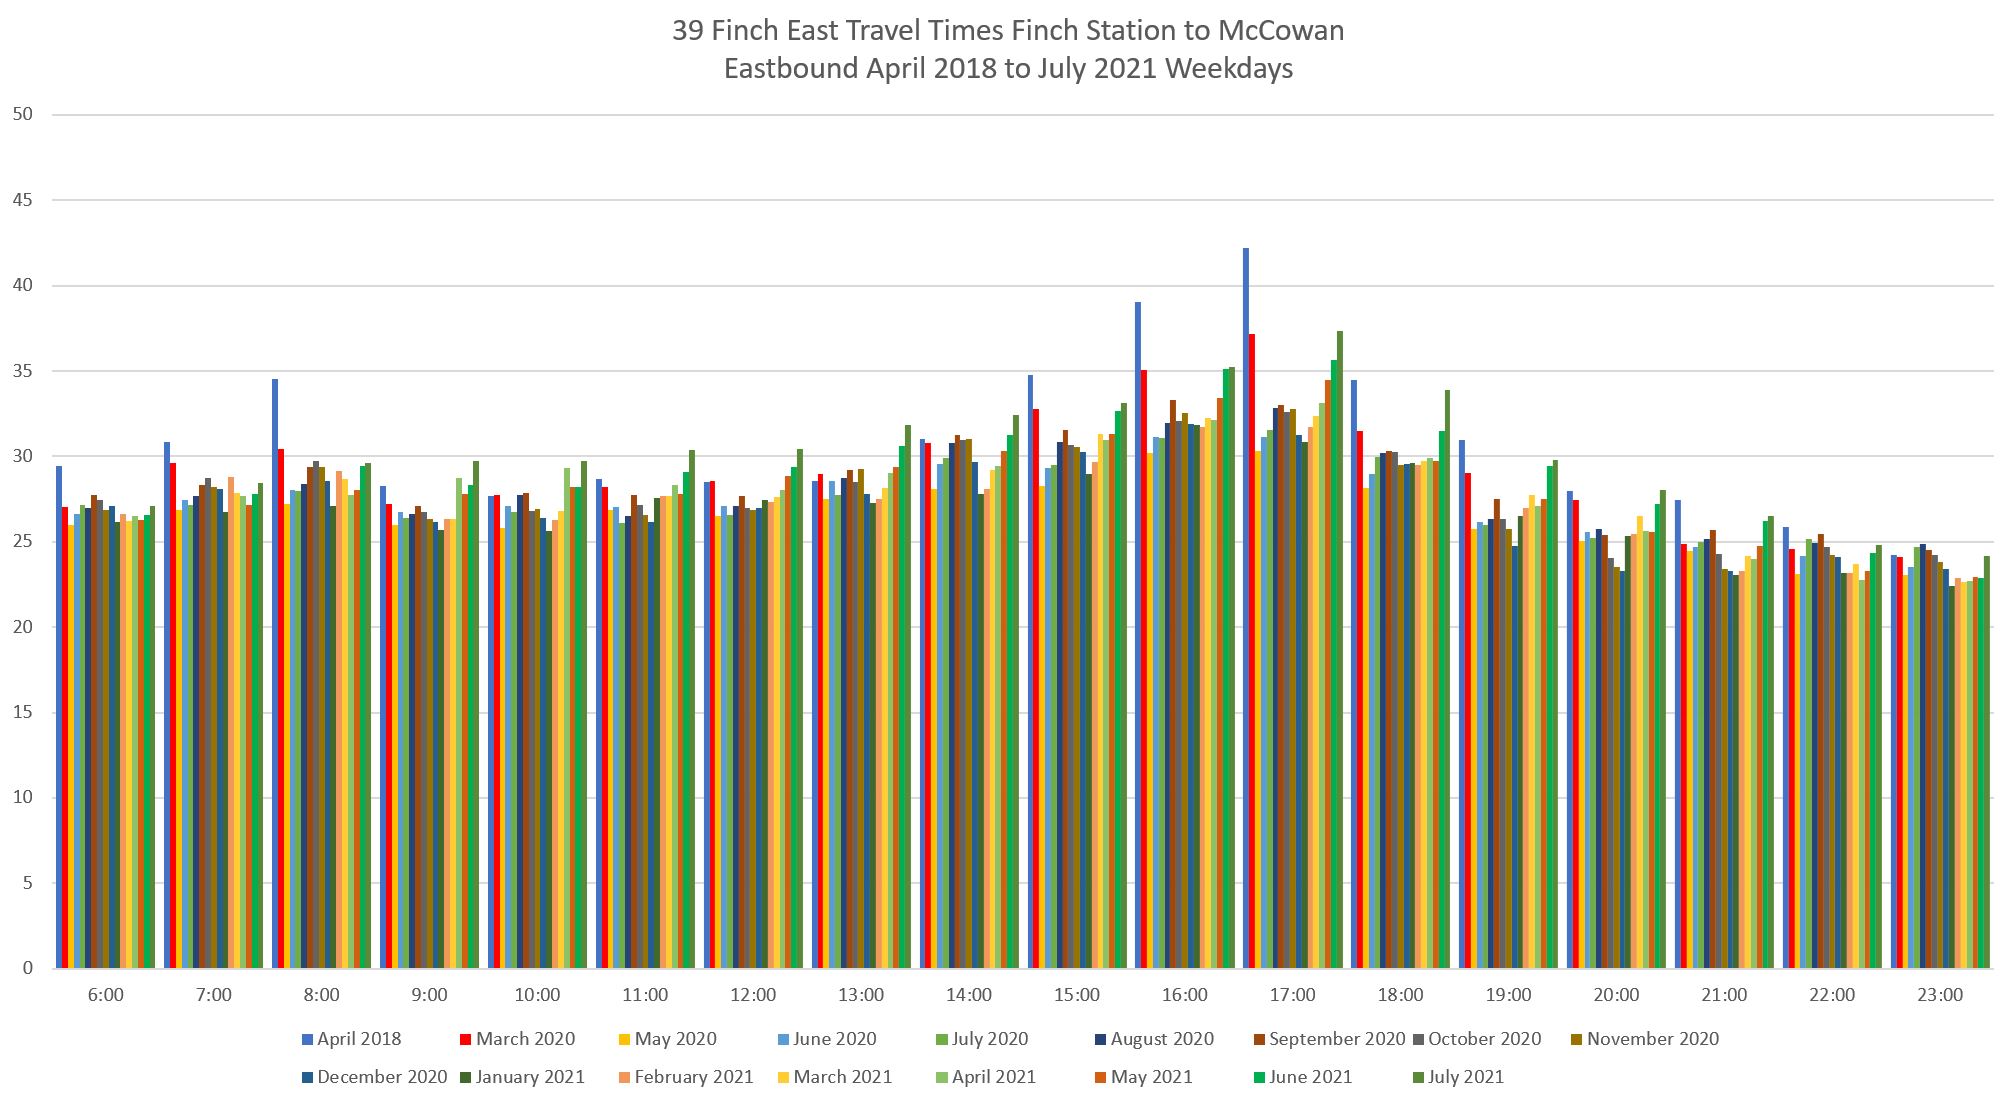
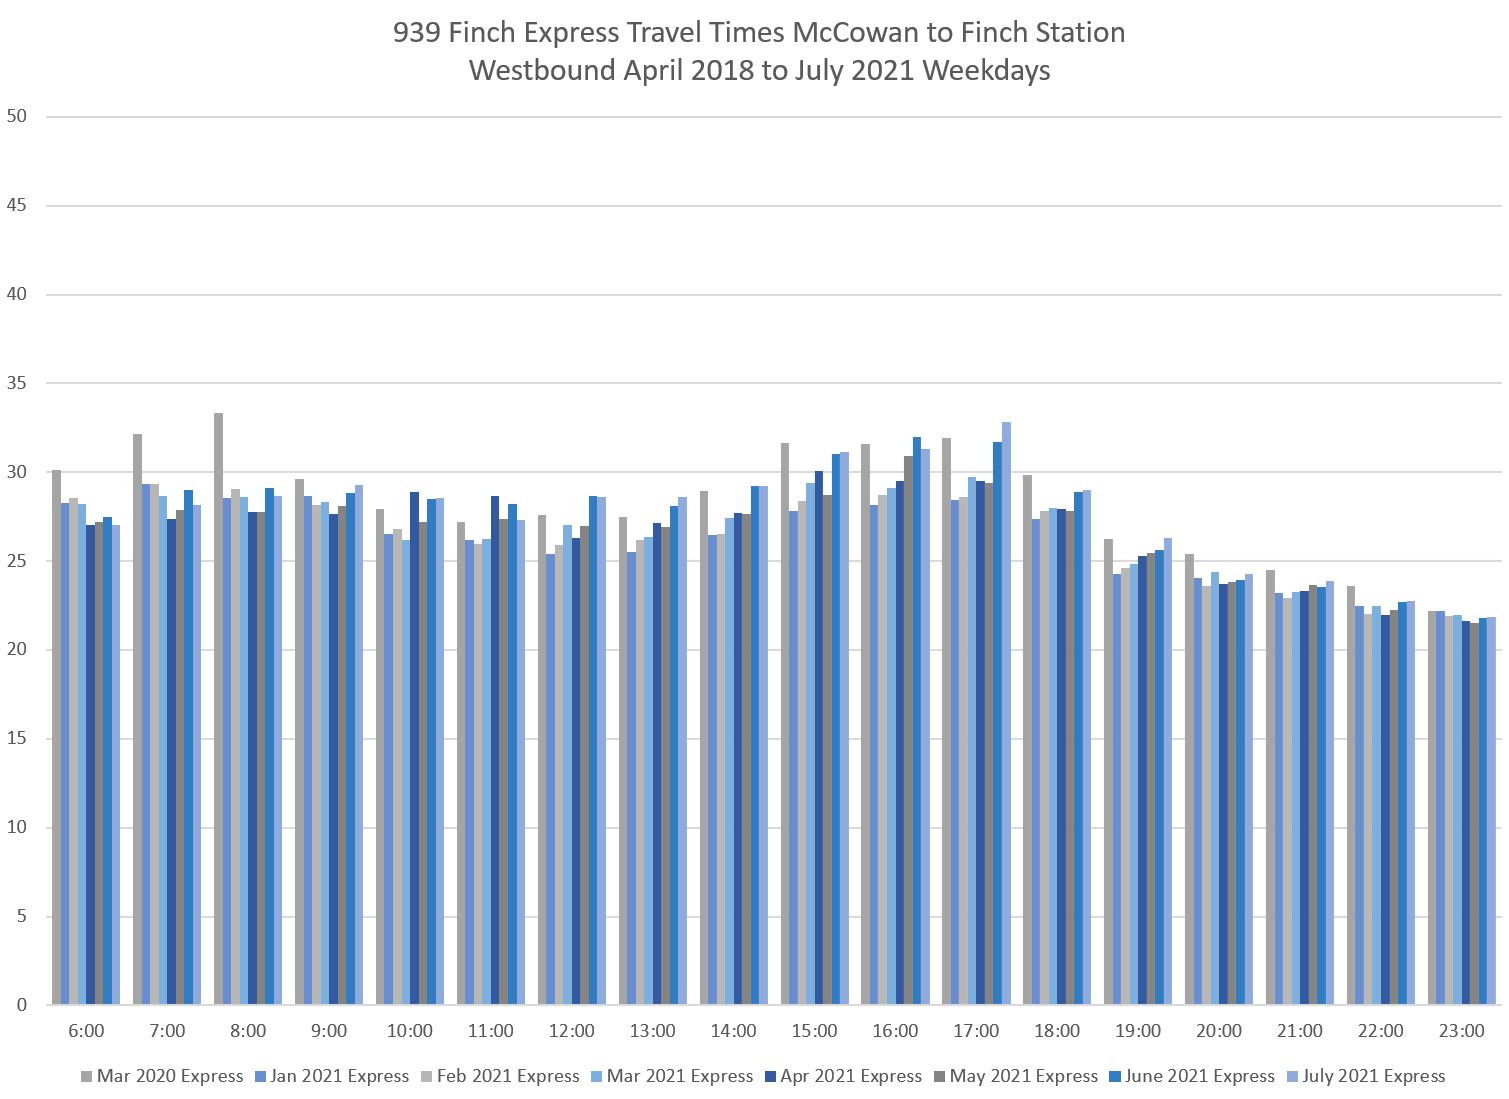
Evolution of Travel Times Between Yonge and McCowan
The data here begin with April 2018 as a pre-pandemic reference, then follow from March 2020 through to July 2021. Note that for April 2018, I do not have the 199 Finch Rocket data, and so the express travel times are shown only from March 2020 onward when the 939 service was operating.
In the charts for local service, March 2020 is shown in red to mark the point at which traffic and service levels changed. This happened over the course of the month, and so the values for March 2020 represent a blend of pre- and post- conditions. (See weekly breakdowns later in the article for examples.)
Light traffic conditions through 2020 probably represent the best that can be hoped for with the implementation of a bus lane to eliminate traffic congestion. Given the frequent service on the combined 39/939 route, a related issue will be how easy it will be for express trips to bypass locals to gain the combined advantage of a traffic-free lane and fewer stops.
Note that the segment between Yonge and McCowan is common to all branches, and is the portion of the route proposed for RapidTO red lanes.
Weekdays
Peak period travel times are noticeably higher than off-peak in the April 2018 data, but less so in pandemic era months, although PM peak times have been building up in 2021 for both the local and express services. Thereis a gradual buildup through 2020, a dip at year end (typical of holiday periods) and then growth again through 2021. Travel times are not yet back to April 2018 values for peak periods, but there is a clear trend in that direction.
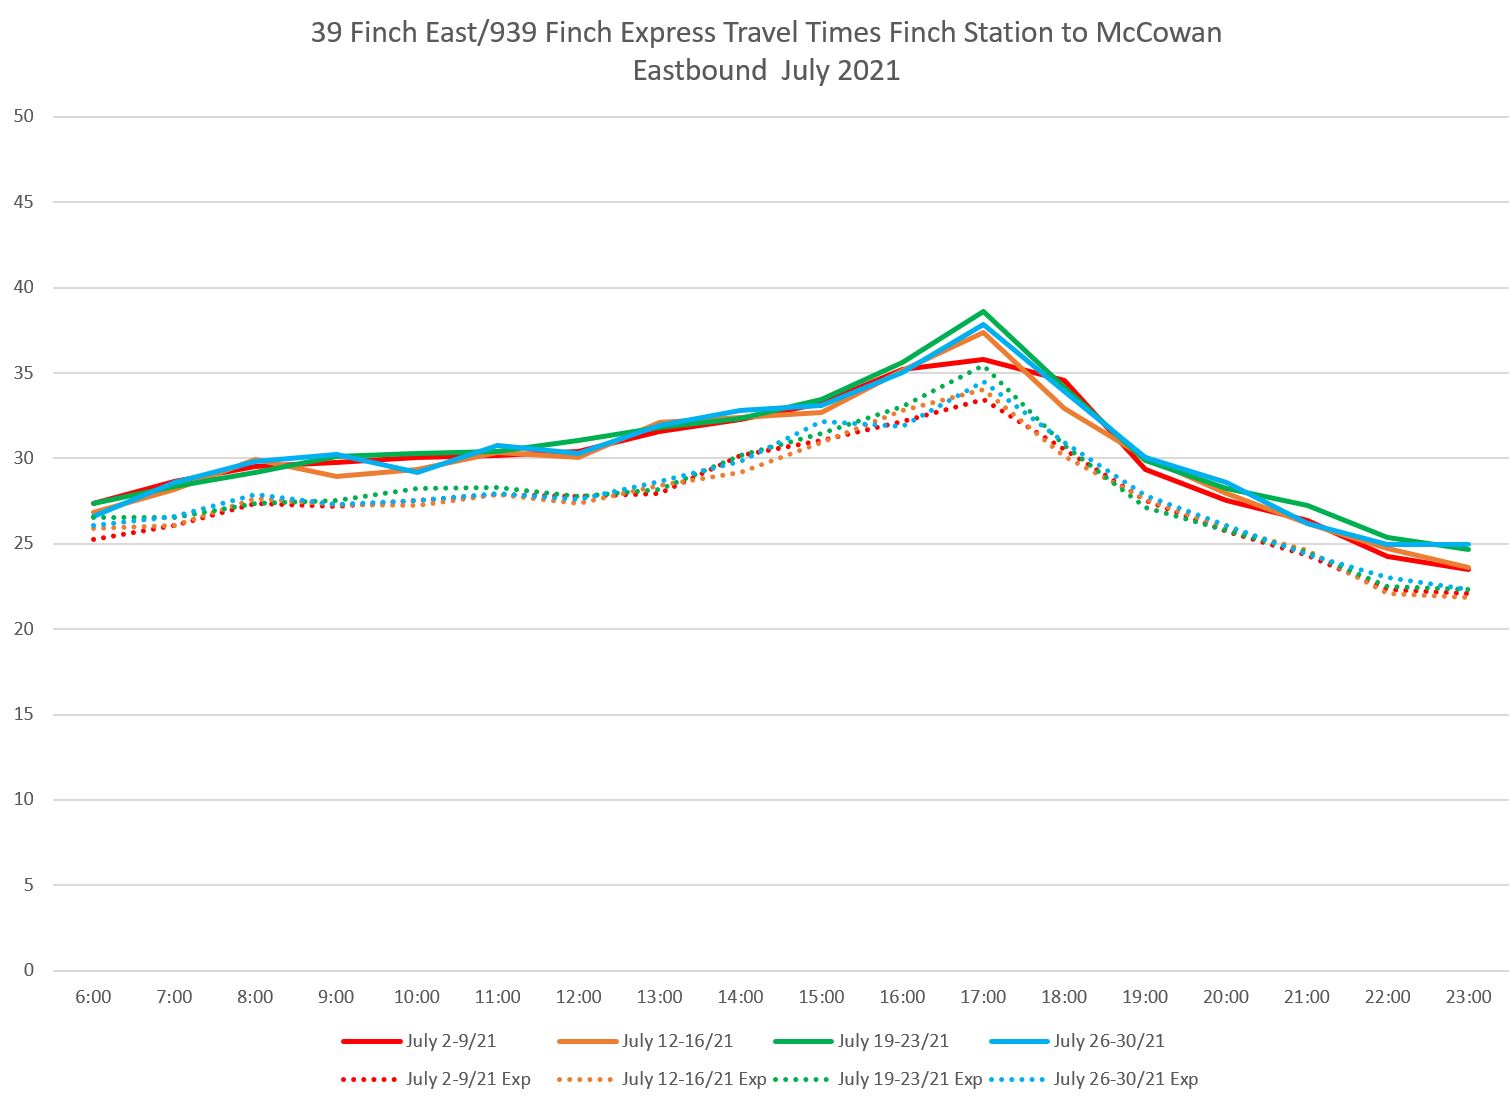
Eastbound

Westbound
Westbound data show a similar pattern to eastbound, except that the AM peak is more pronounced in pre-pandemic data. It has yet to return although growth in PM peak travel times are evident in both the local and express data.

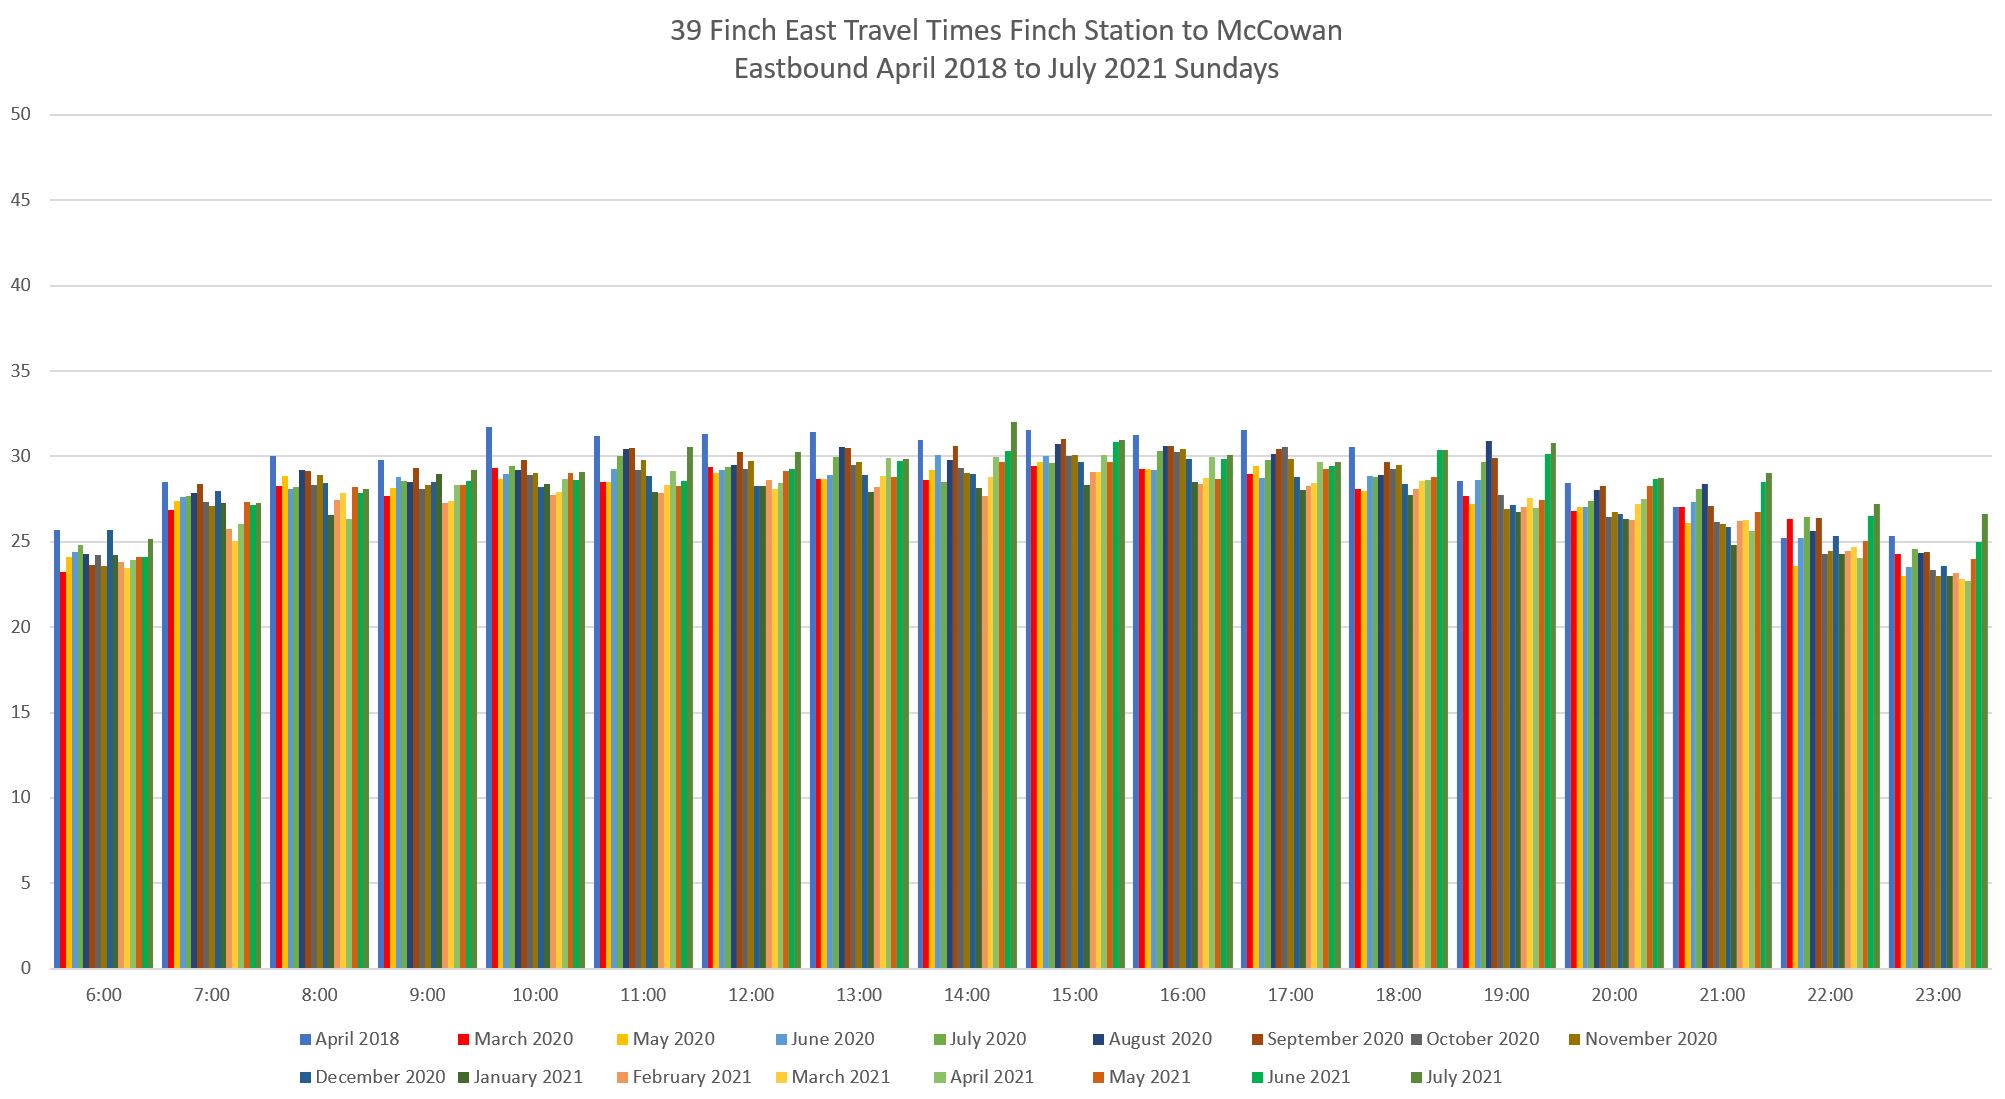
Weekends
The drop in travel times from March 2020 onward is much less pronounced for weekends than for weekdays, and in some cases the values have rebounded to April 2018 levels or slightly higher. This suggests that the saving from red lanes on Finch will have less effect on weekends. The changes, such as they are, are slightly larger on Saturdays than on Sundays.
Eastbound

Westbound


Week-by-week Data
April 2018 shows the week-by-week average travel times which have a classic peak, although stronger in the PM than in the AM.
Eastbound

In March 2020, the first two weeks operated with pre-pandemic conditions, and then travel times quickly fell as both road traffic and passenger demand evaporated. The peaks more or less disappeared. By month-end, most of the express service had been cancelled.

By September 2020, there was a small return of the PM peak. At this point, the express service was still suspended.

In July 2021, the PM peak has grown a bit more, and that pattern is shared by the express service. Note that there is only a small difference in travel times between the local and express services. What remains to be seen is whether the gap between them will open up as traffic congestion and stop service time go up later in 2021.
Westbound
The westbound pattern differs from eastbound in that it has two strong peaks, especially in the AM.

March 2020 shows the same changes eastbound as westbound including the disappearances of peaks from week 3 onward.

September 2020 shows the beginnings of a PM peak westbound, but this is really not evident until more recently as shown in the July 2021 data.
The bulge in week 2 between 4 and 6pm (1600 to 1800) was caused by severe traffic congestion between Don Mills and Victoria Park on September 9-11. This condition did not exist before or after those dates.


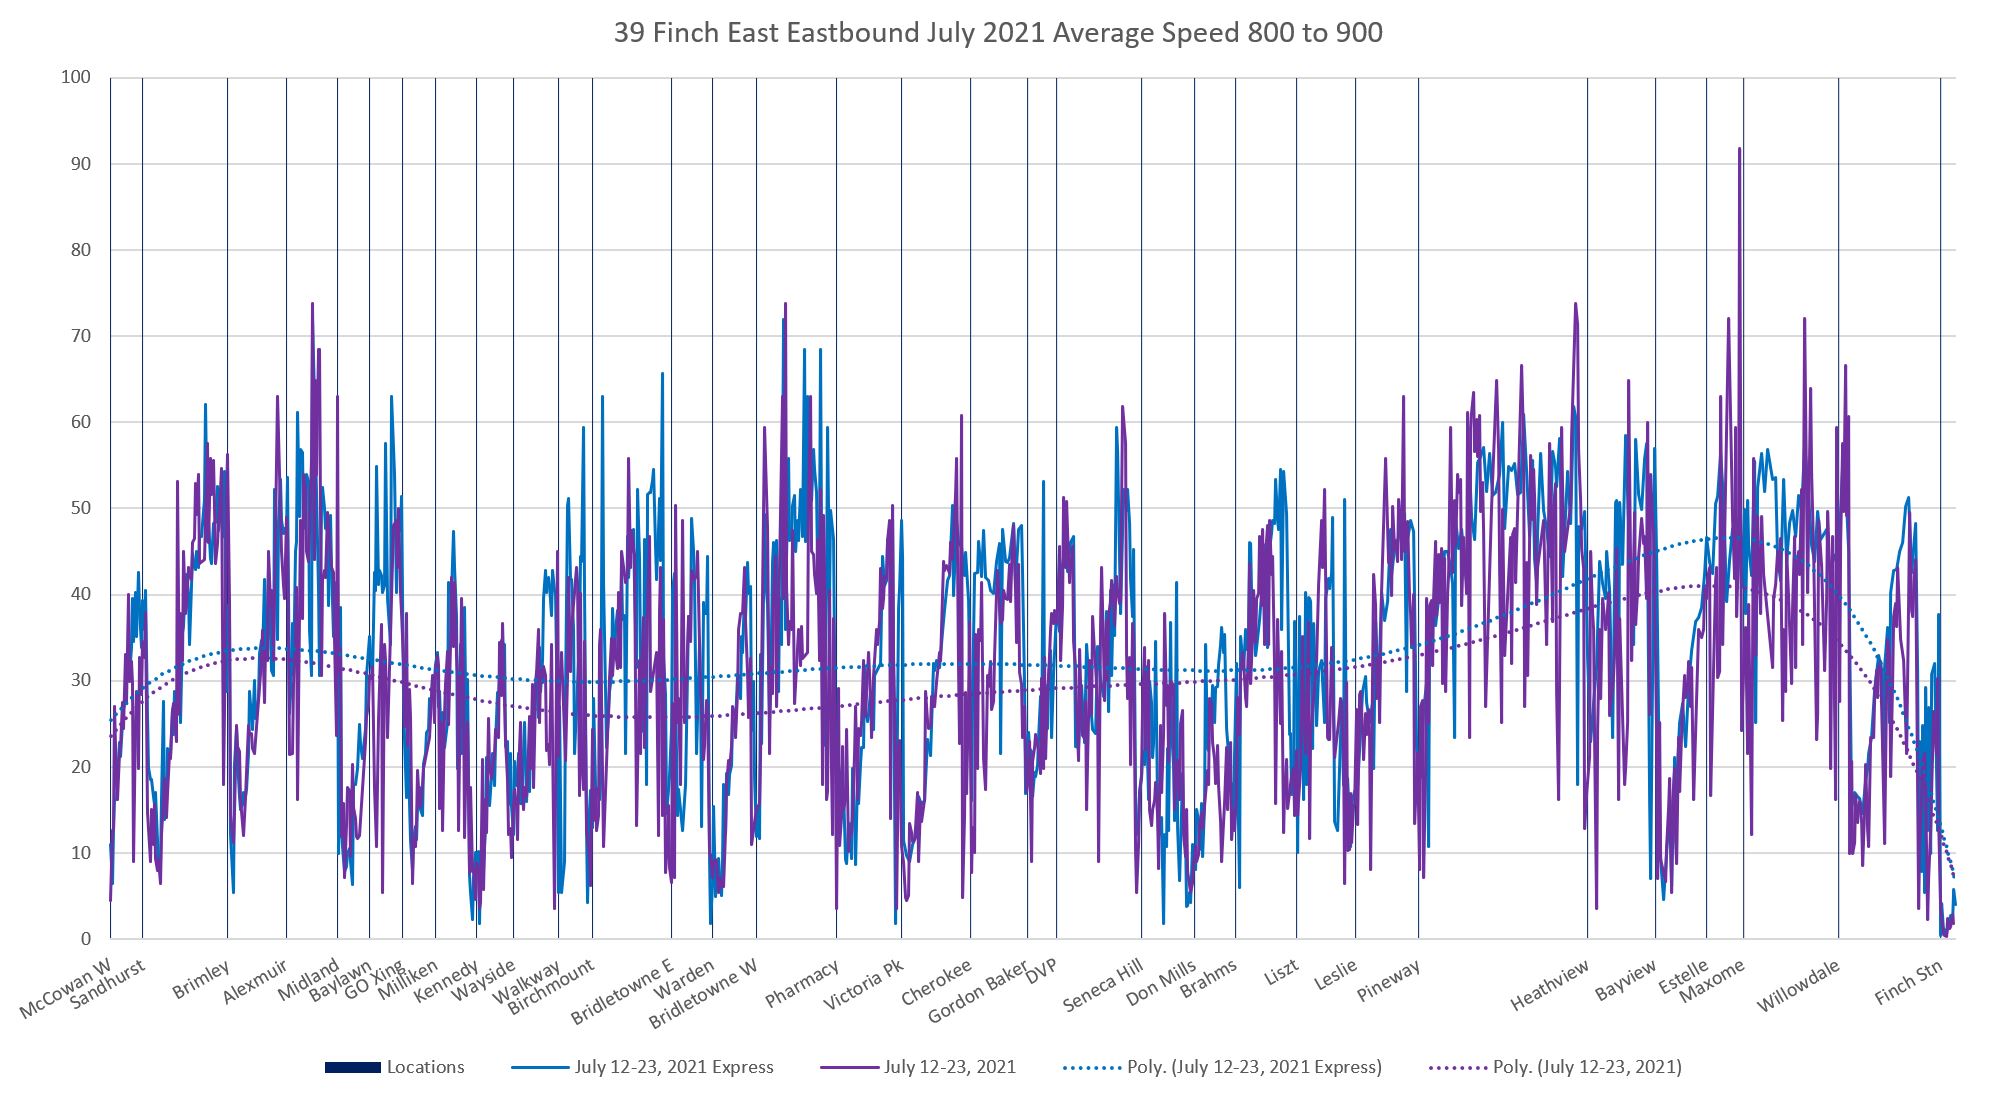
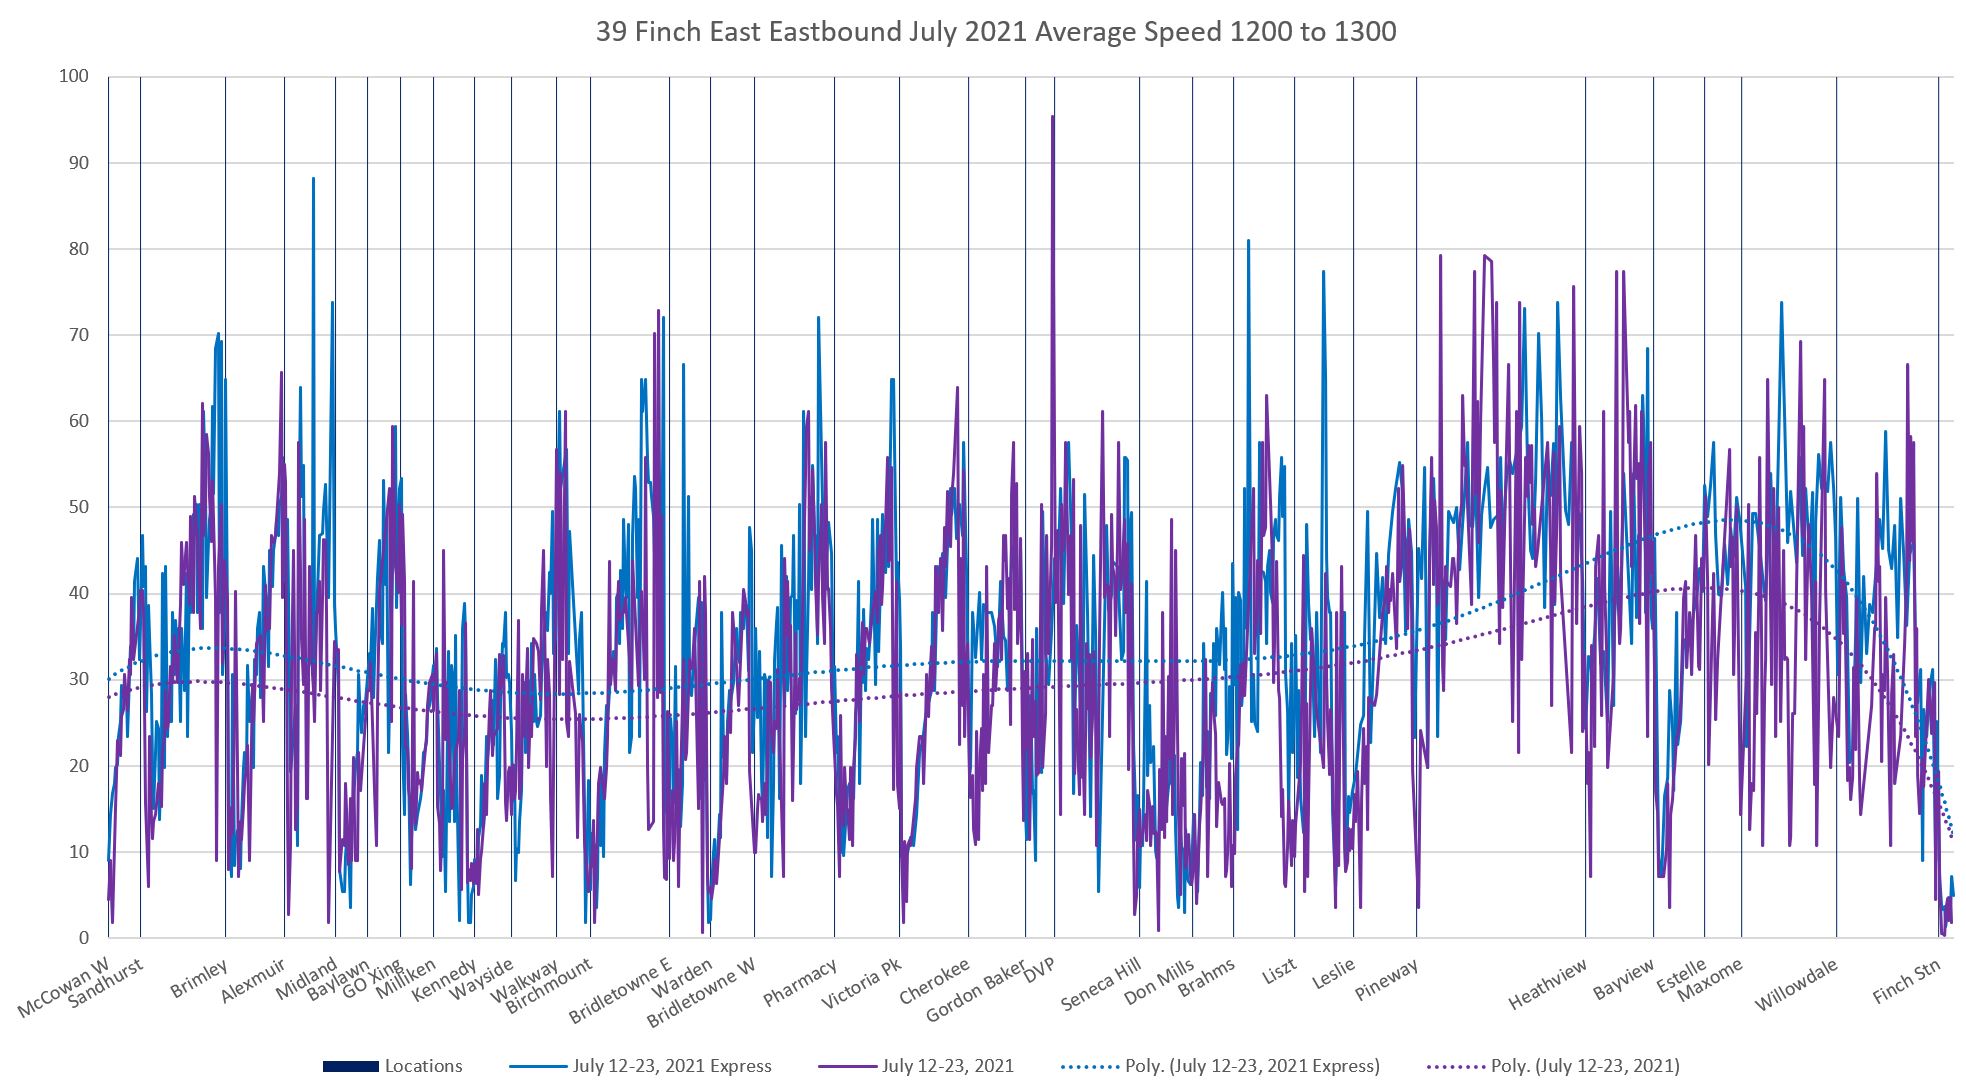
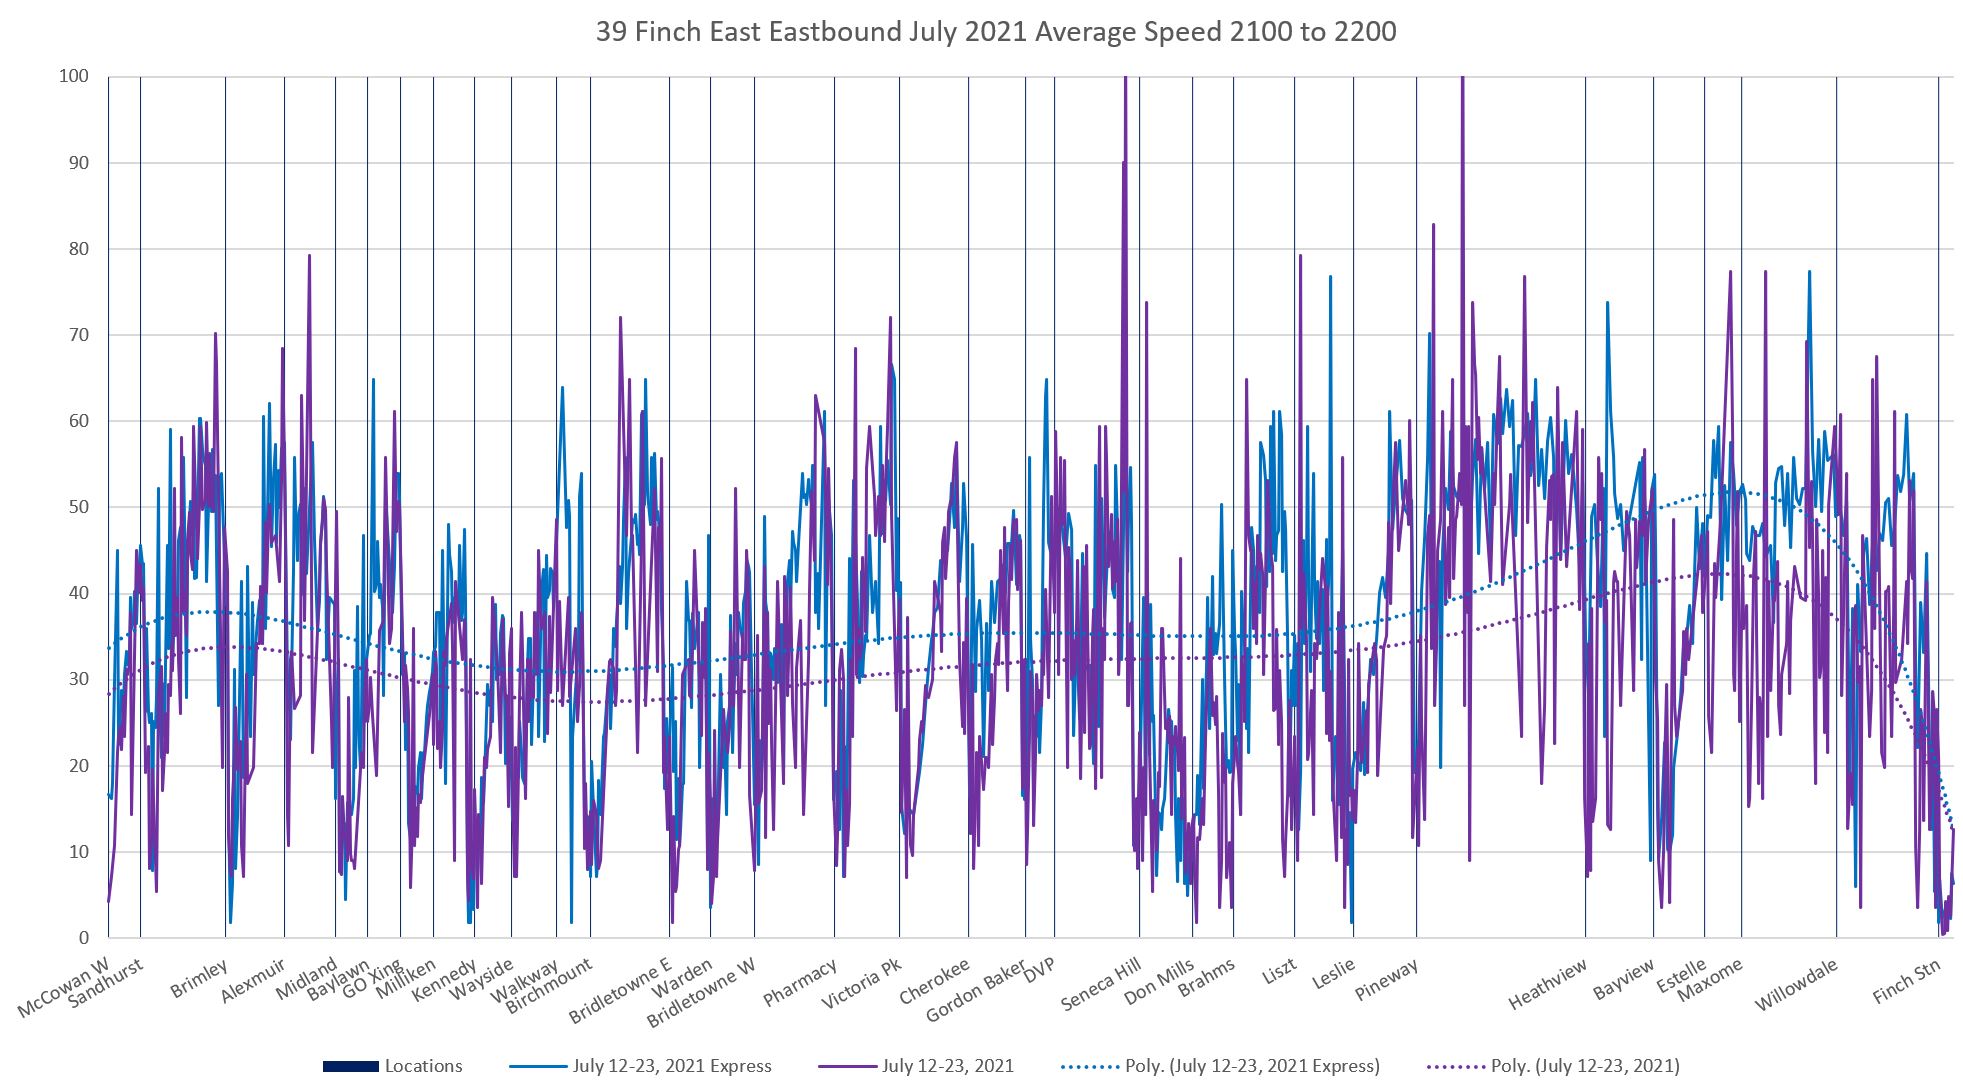
Speed Profiles
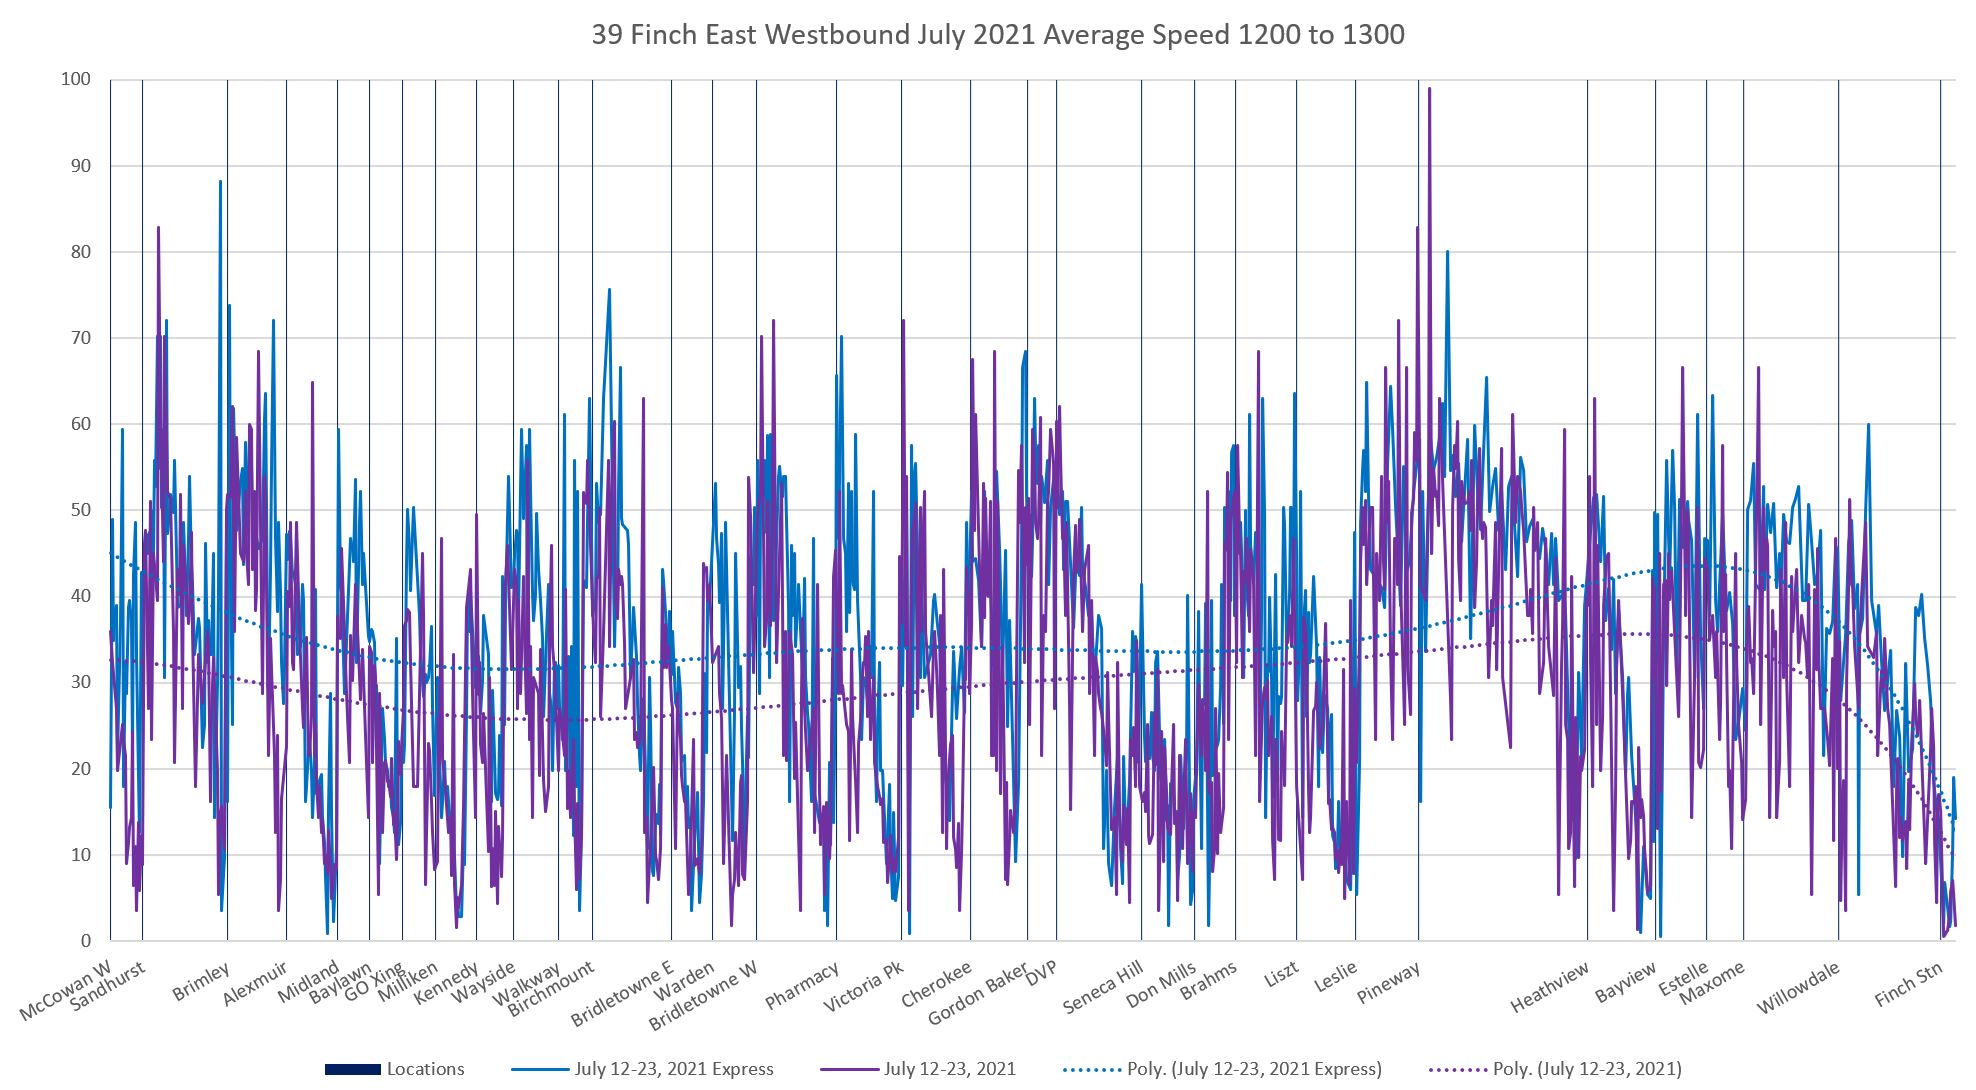
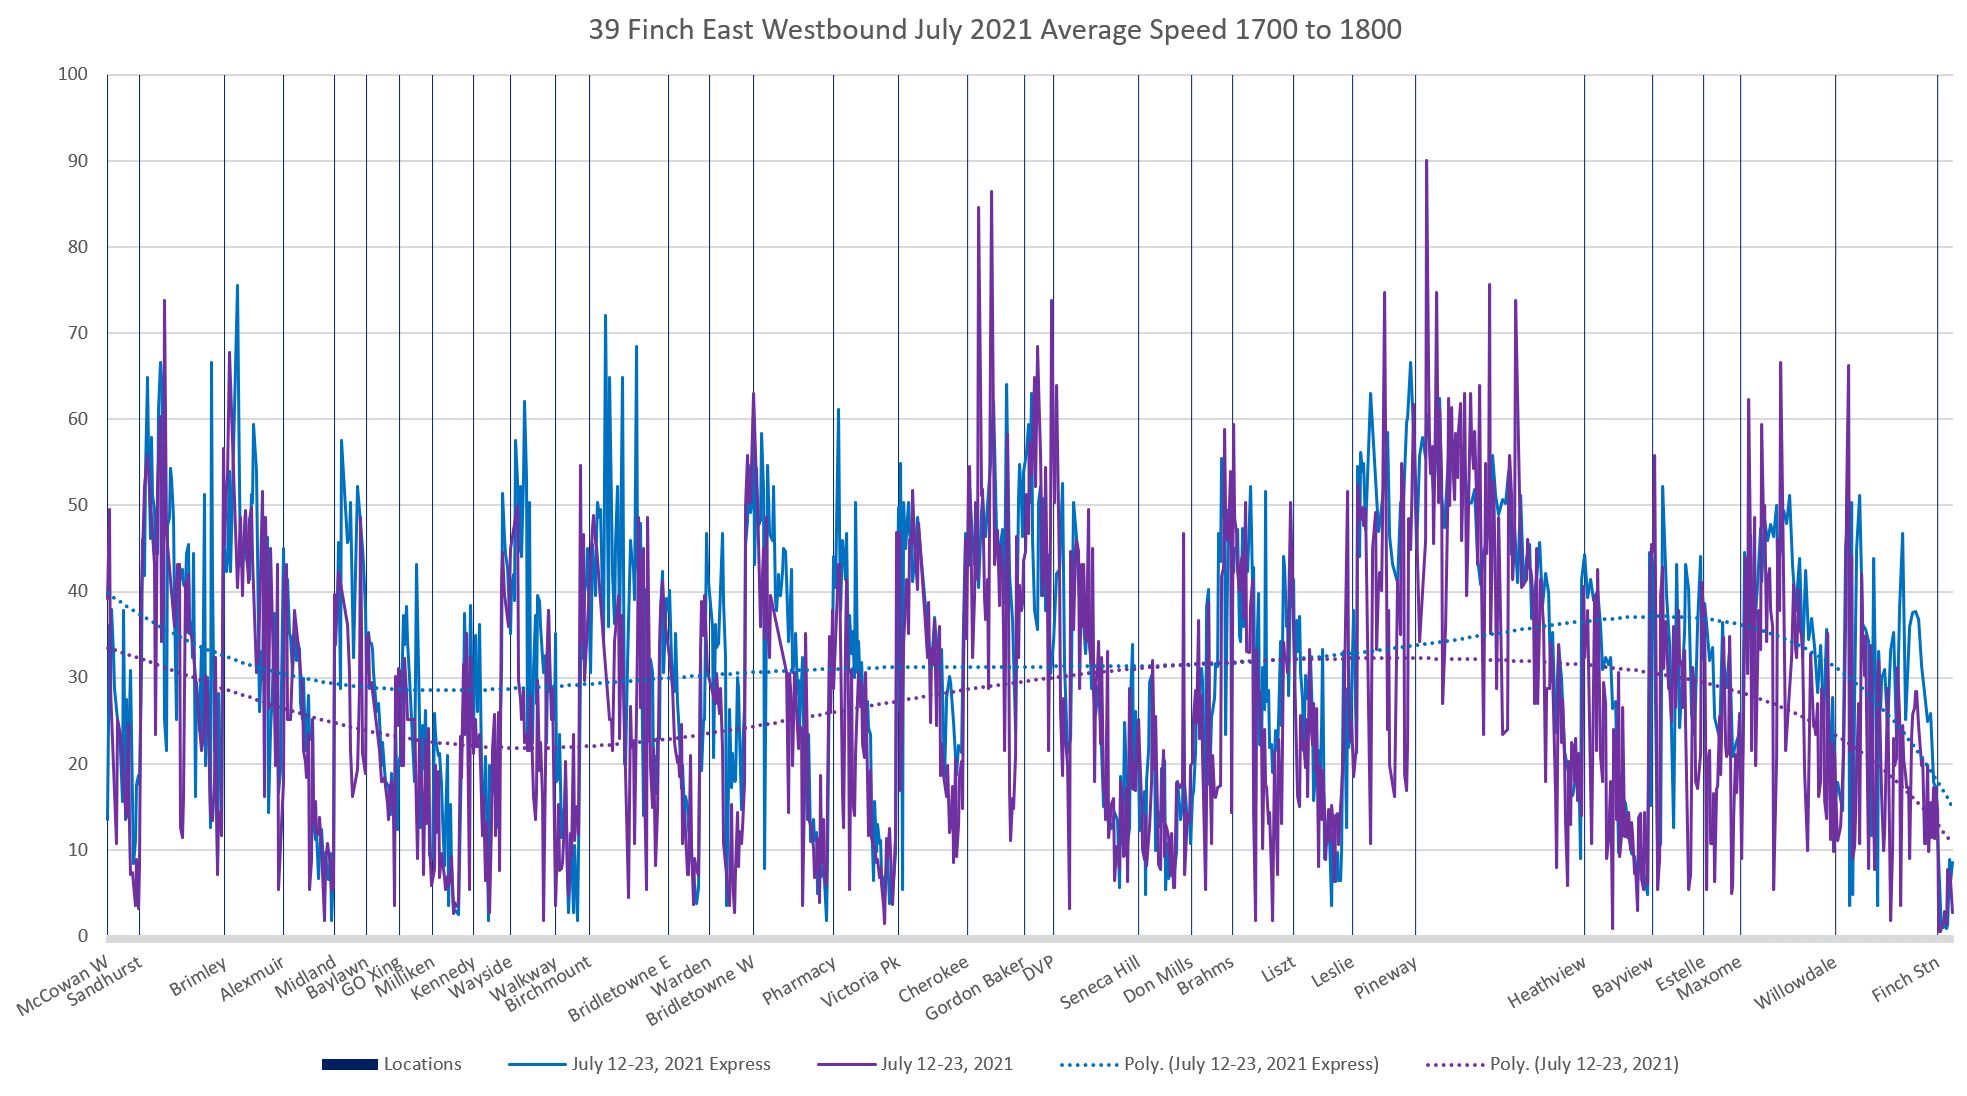
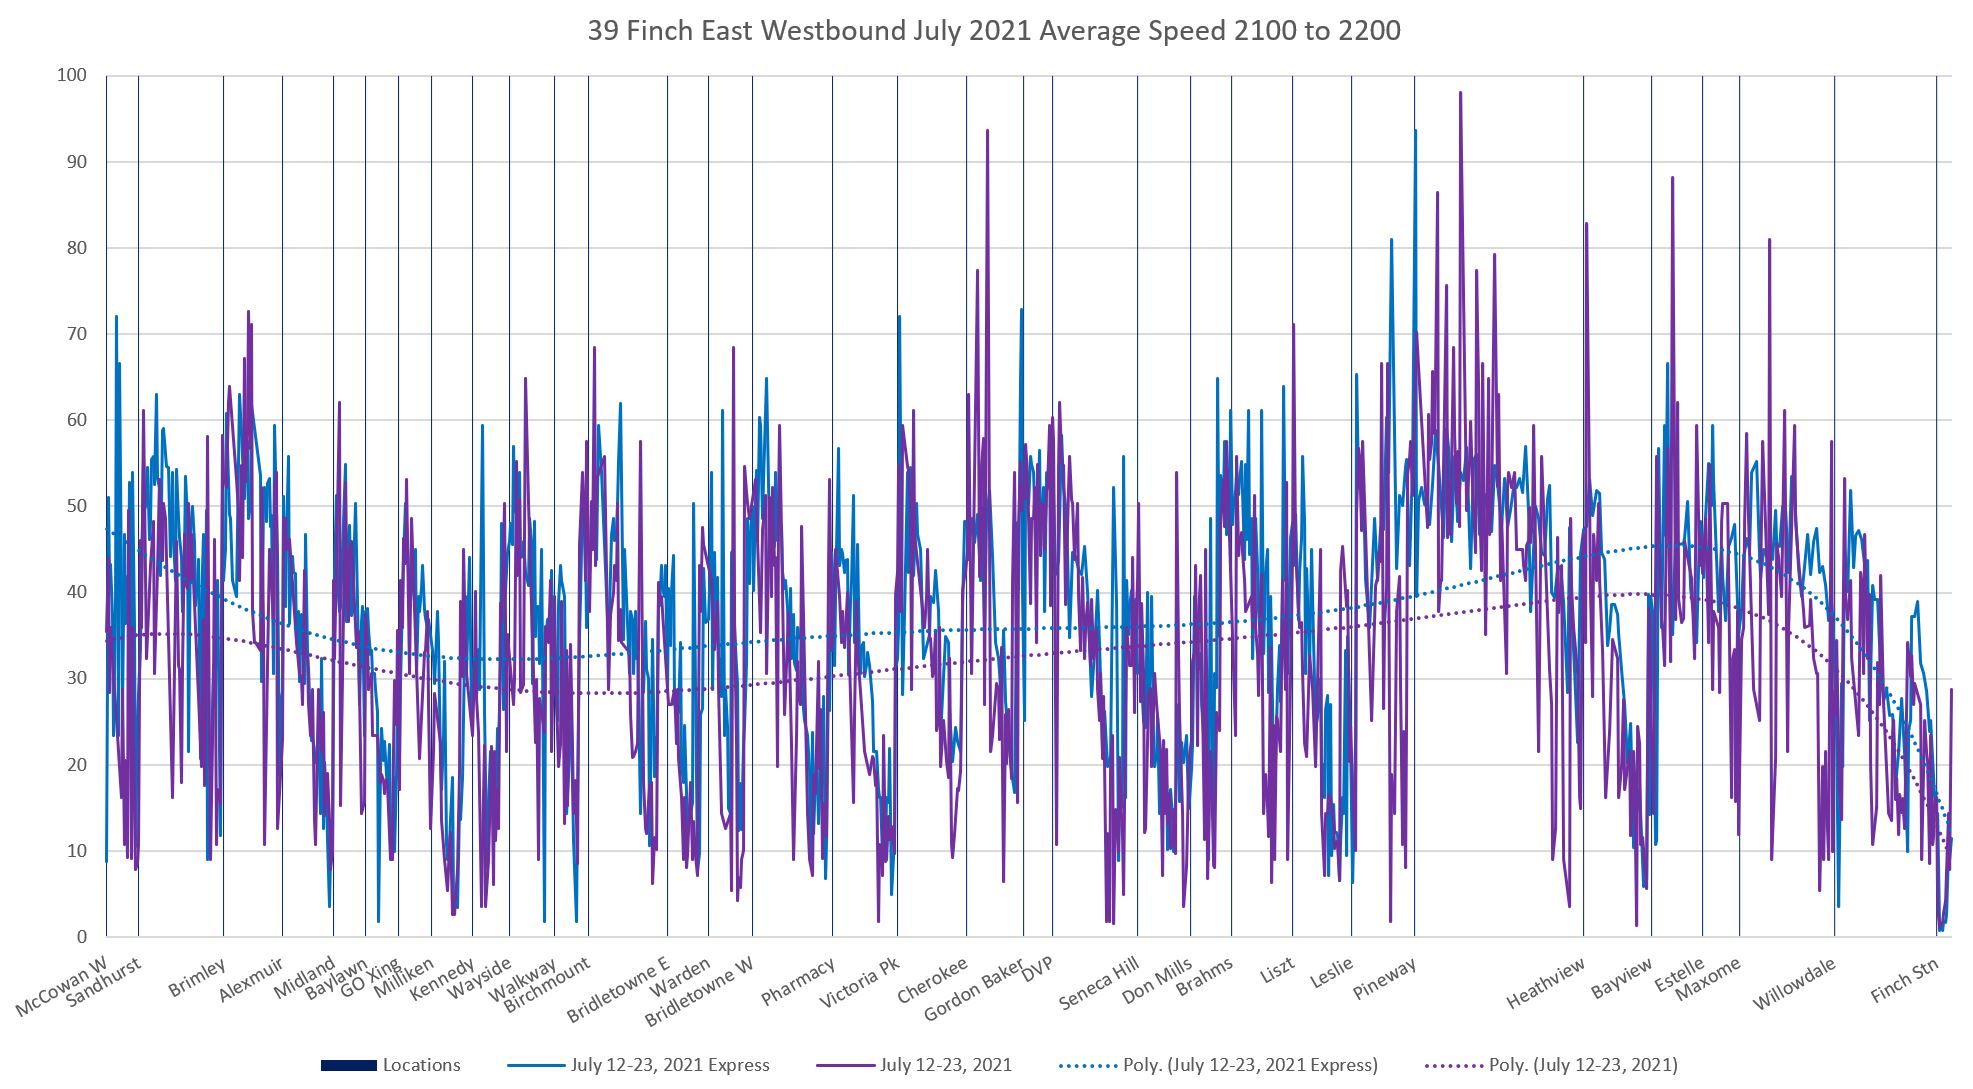
The charts below compare the average speed of buses on the local and express service for the second and third week of July 2021. Ten weekdays’ worth of data are combined to produce these averages.
Finch Station is at the right edge of all charts, and a point on Finch west of McCowan (chosen so that data from the 939 express runs joining the route here are included) is at the left edge. Westbound travel is left to right, eastbound is right to left.
Each downward sawtooth in the pattern corresponds to a point where buses slow, typically at a stop or traffic signal. Where the value is low for some distance rather than just at a point, this indicates congestion that prevents buses from moving at traffic speeds.
The dotted trend lines through the charts are not moving averages, but rather a best fit interpolation to follow the overall shape of the data.
Generally speaking, the express and local services do not differ by much in their travel speeds when the buses are moving. This is not the same measurement as the overall travel times shown earlier in the article because the effect of stops affects each type of chart differently. On travel times, the stops contribute to overall times. On speeds, a stop counts as a “zero” speed whether a bus is there for 10 seconds or 5 minutes. These charts identify places where the express runs have a speed advantage as well as locations where buses are slowed by general conditions that are not at stops.
Note that the speed limit on at least part of Finch Avenue is 50 kph. It is not unusual for traffic, including the buses, to exceed this value.
Sample charts are shown for the AM peak, such as it is, from 8 to 9 am; for midday from noon to 1 pm; for the PM peak from 5 to 6 pm; and for mid evening from 9 to 10 pm. A link to the full set of charts on an hourly basis from 6 am to midnight is included at the end of the article. Stepping from page to page, one can see how the conditions evolve through the day.
Finally a note that these are summer conditions and traffic on Finch is still not back to pre-pandemic levels. I will return to this route and comparisons late in the fall to see what might have changed.
Westbound From McCowan to Finch Station

Eastbound From Finch Station to McCowan

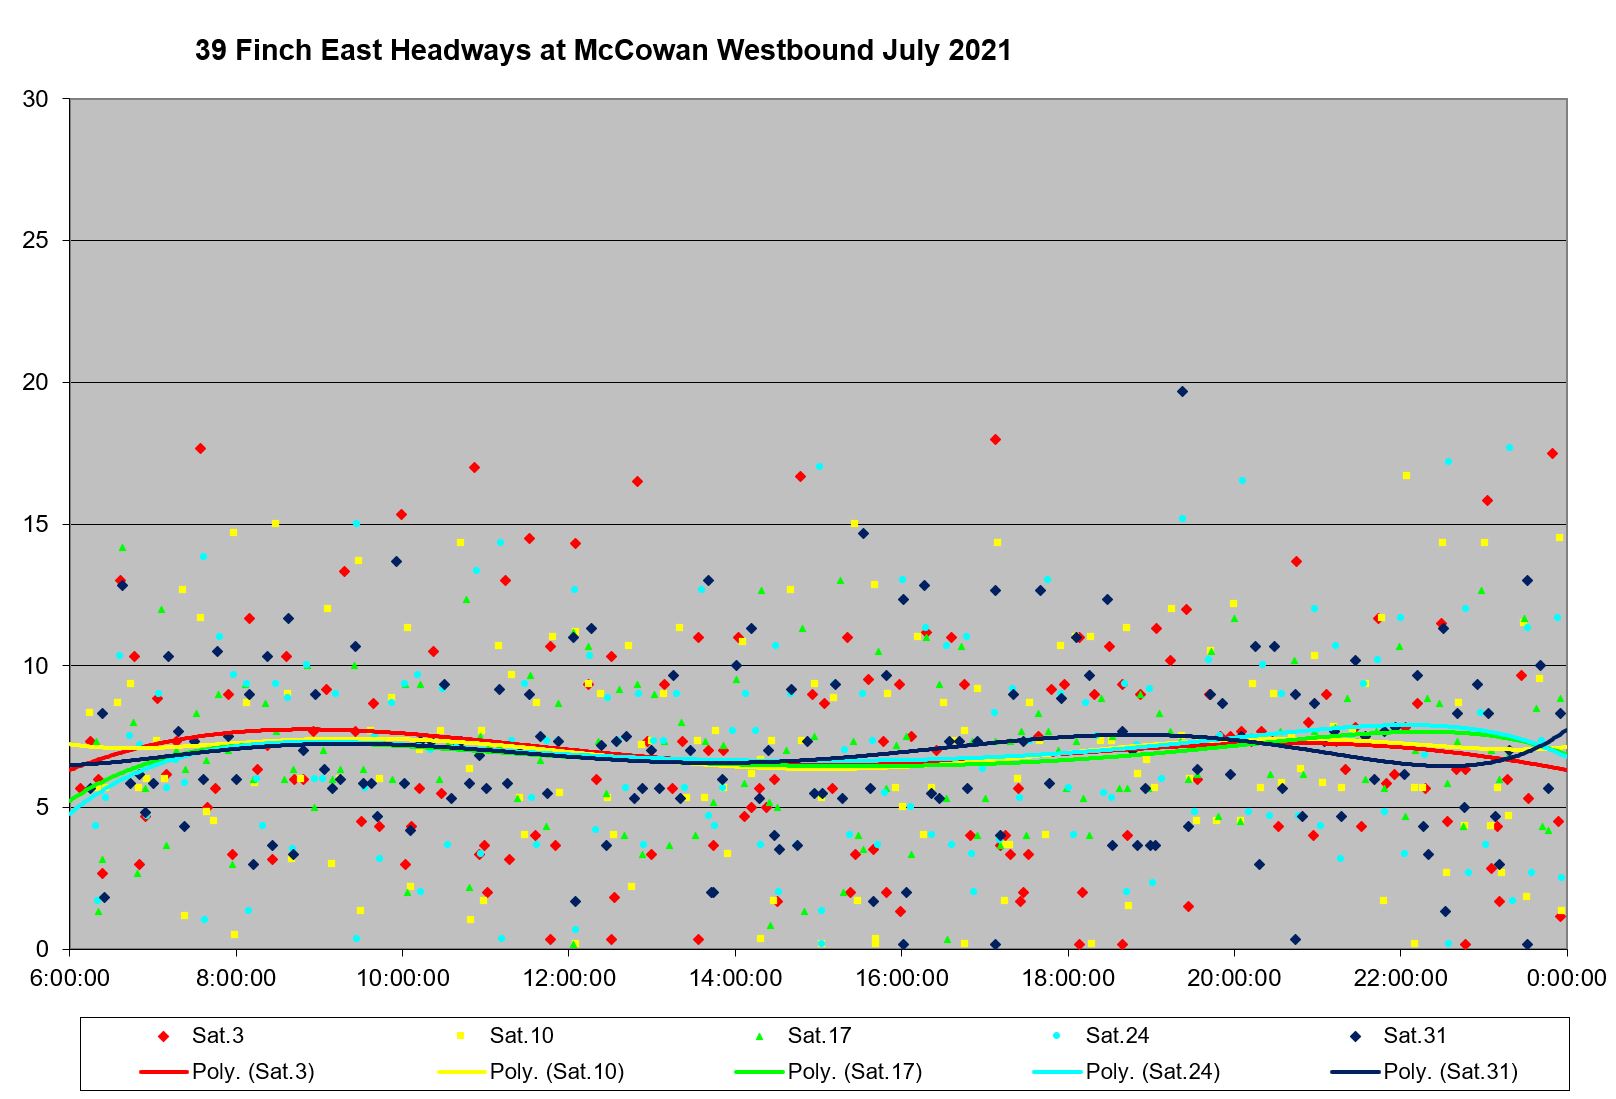
Headway Reliability
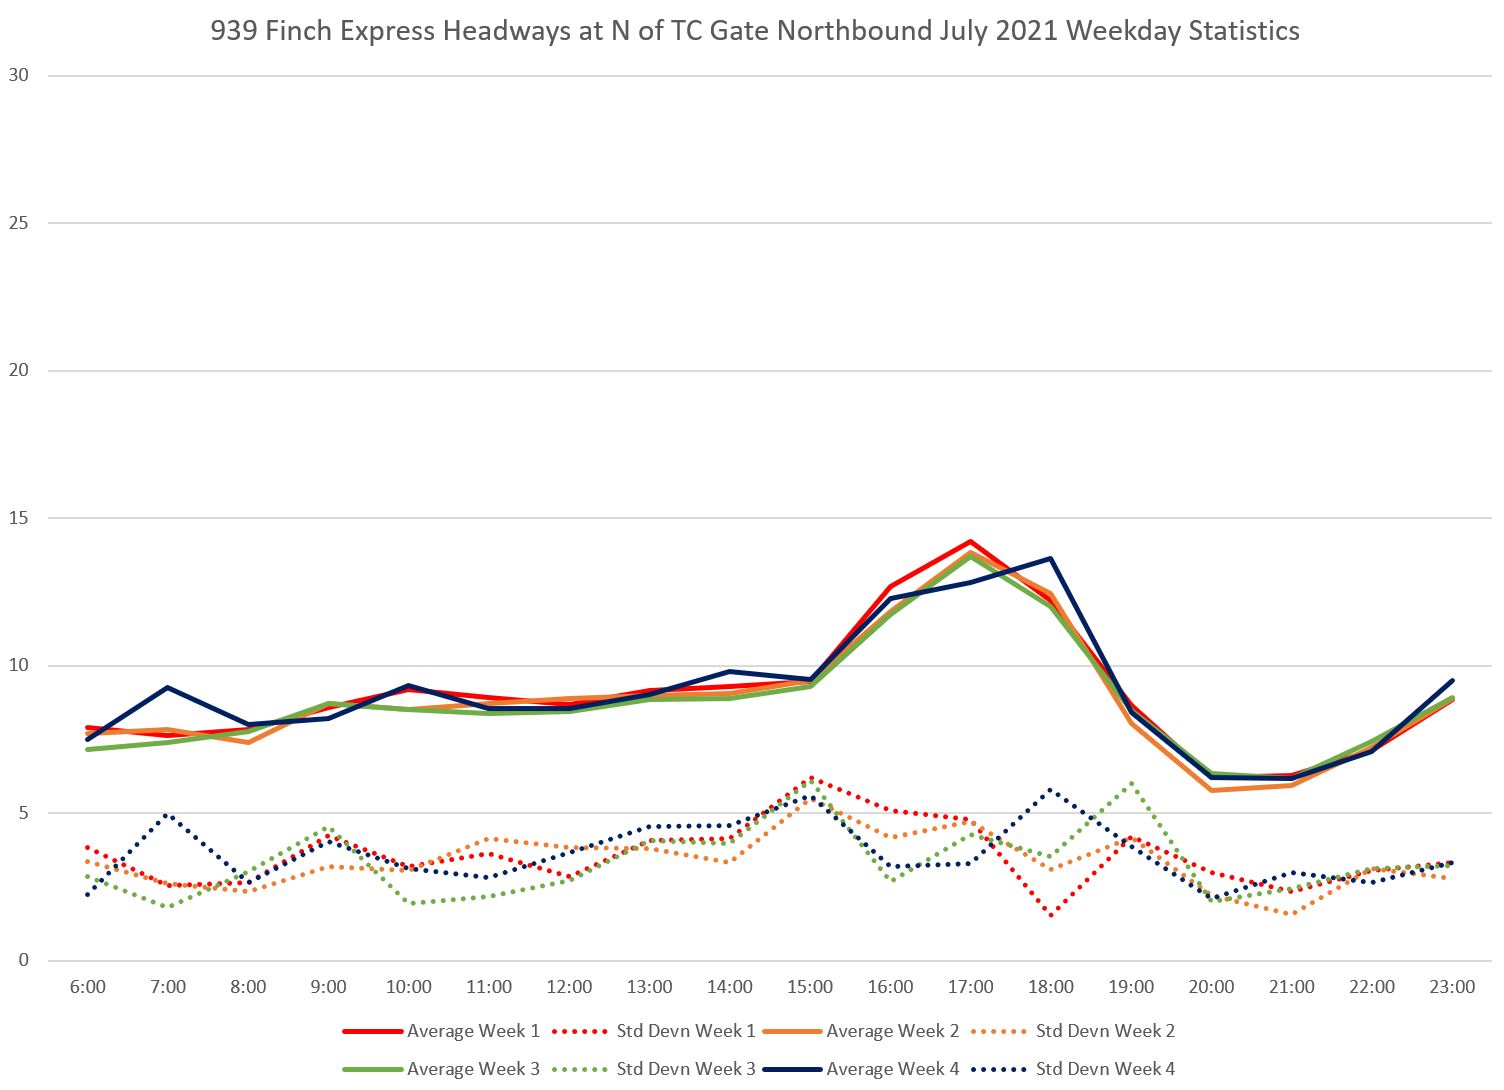
Throughout all of these route analyses, the week point has always been headway reliability.
Local Service Westbound from Littles Road
From the east end of Finch, the service is consistently inconsistent. Although the service is scheduled every 15 minutes (and clearly it all shows up becase the average headway stays at roughly that level), the standard deviation of the values sits at 4-6 minutes meaning that the actual headways have a range from 10-20 minutes in many cases with outliers that are worse.

This can be seen in the details for week 1 of July. The averages hide the fact that there is a lot of bunching and very wide gaps especially in the late afternoon and early evening. (Weeks 2 to 4 look similar to this.)

On Saturdays, the scheduled service is slightly more frequent, but still very disorganized. Wide gaps and bunching are common, although this varies from week to week. Note that the trend lines lie at roughly the scheduled headway showing that all buses were operating even though their adherence to the schedule varied wildly.

Sunday is slightly better.

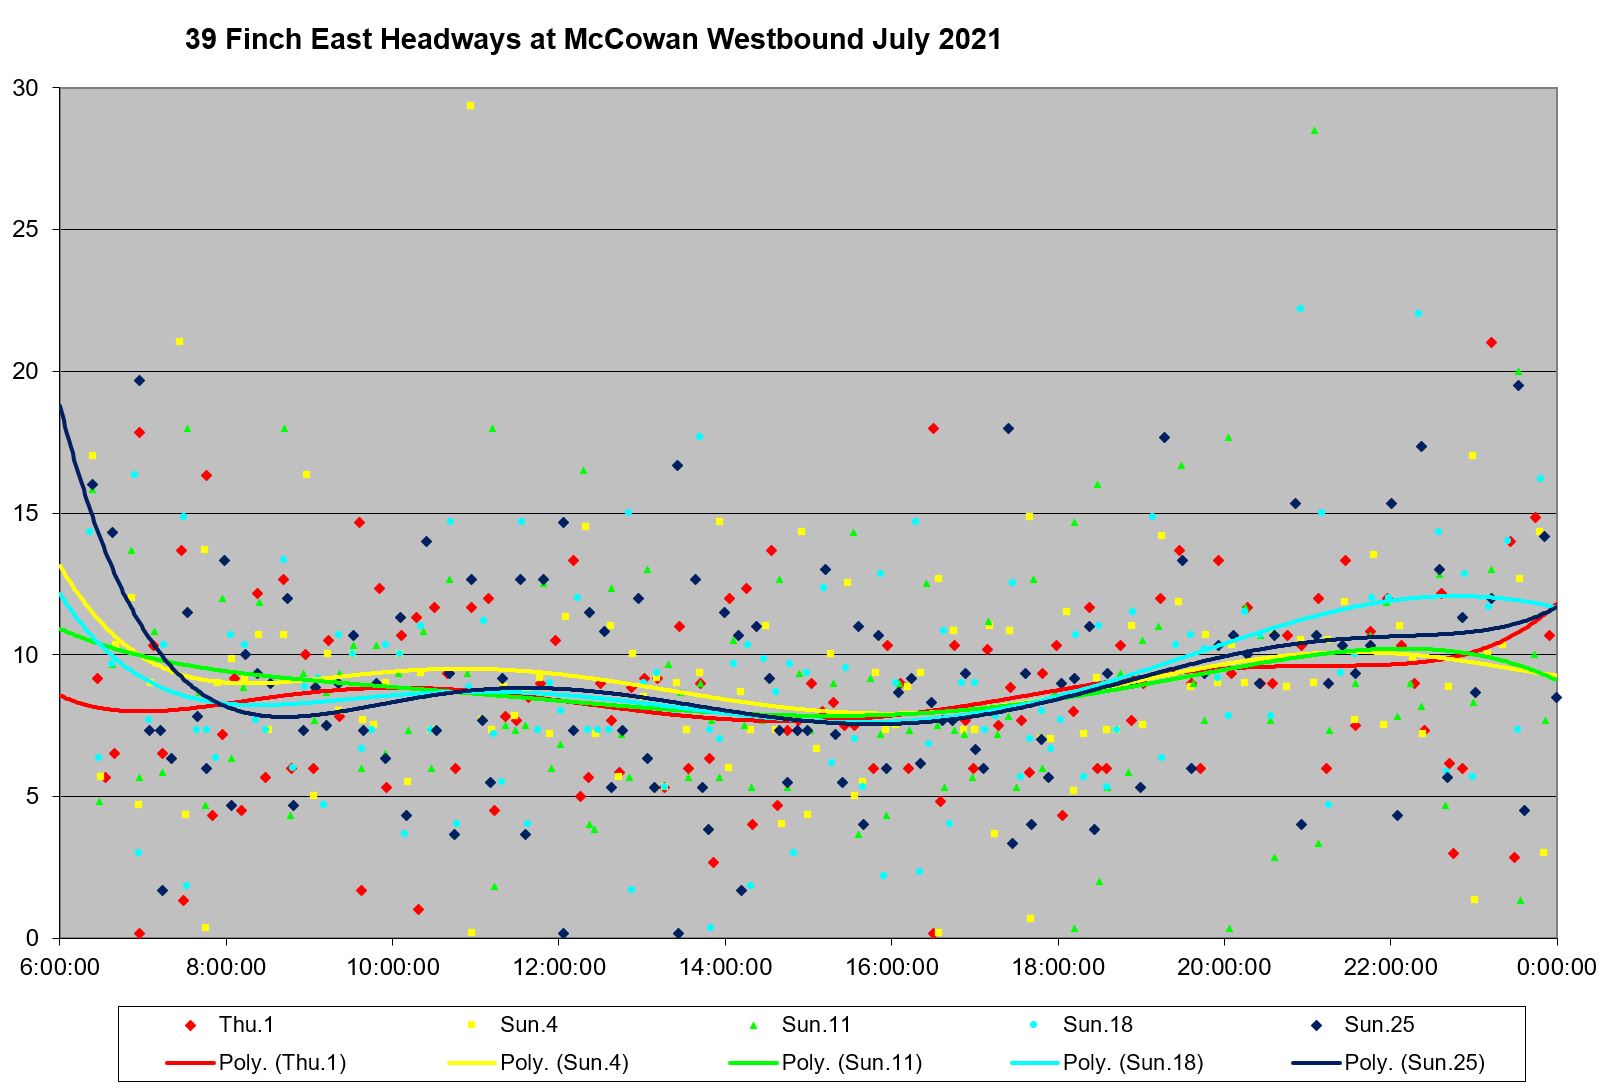
Local Service Westbound from McCowan
At McCowan, both branches of the service have merged, but the SD value is still high, especially relative to the shorter scheduled headway.

For week 1, headways lie across a broad range from 0 to 20 minutes with some even higher outliers. This is a common problem with branching routes. Even if the individual branches are more or less on the target spacing, the services do not blend reliably.

On weekends, headways lie in a band from 0 to 15 minutes on both Saturdays and Sundays.
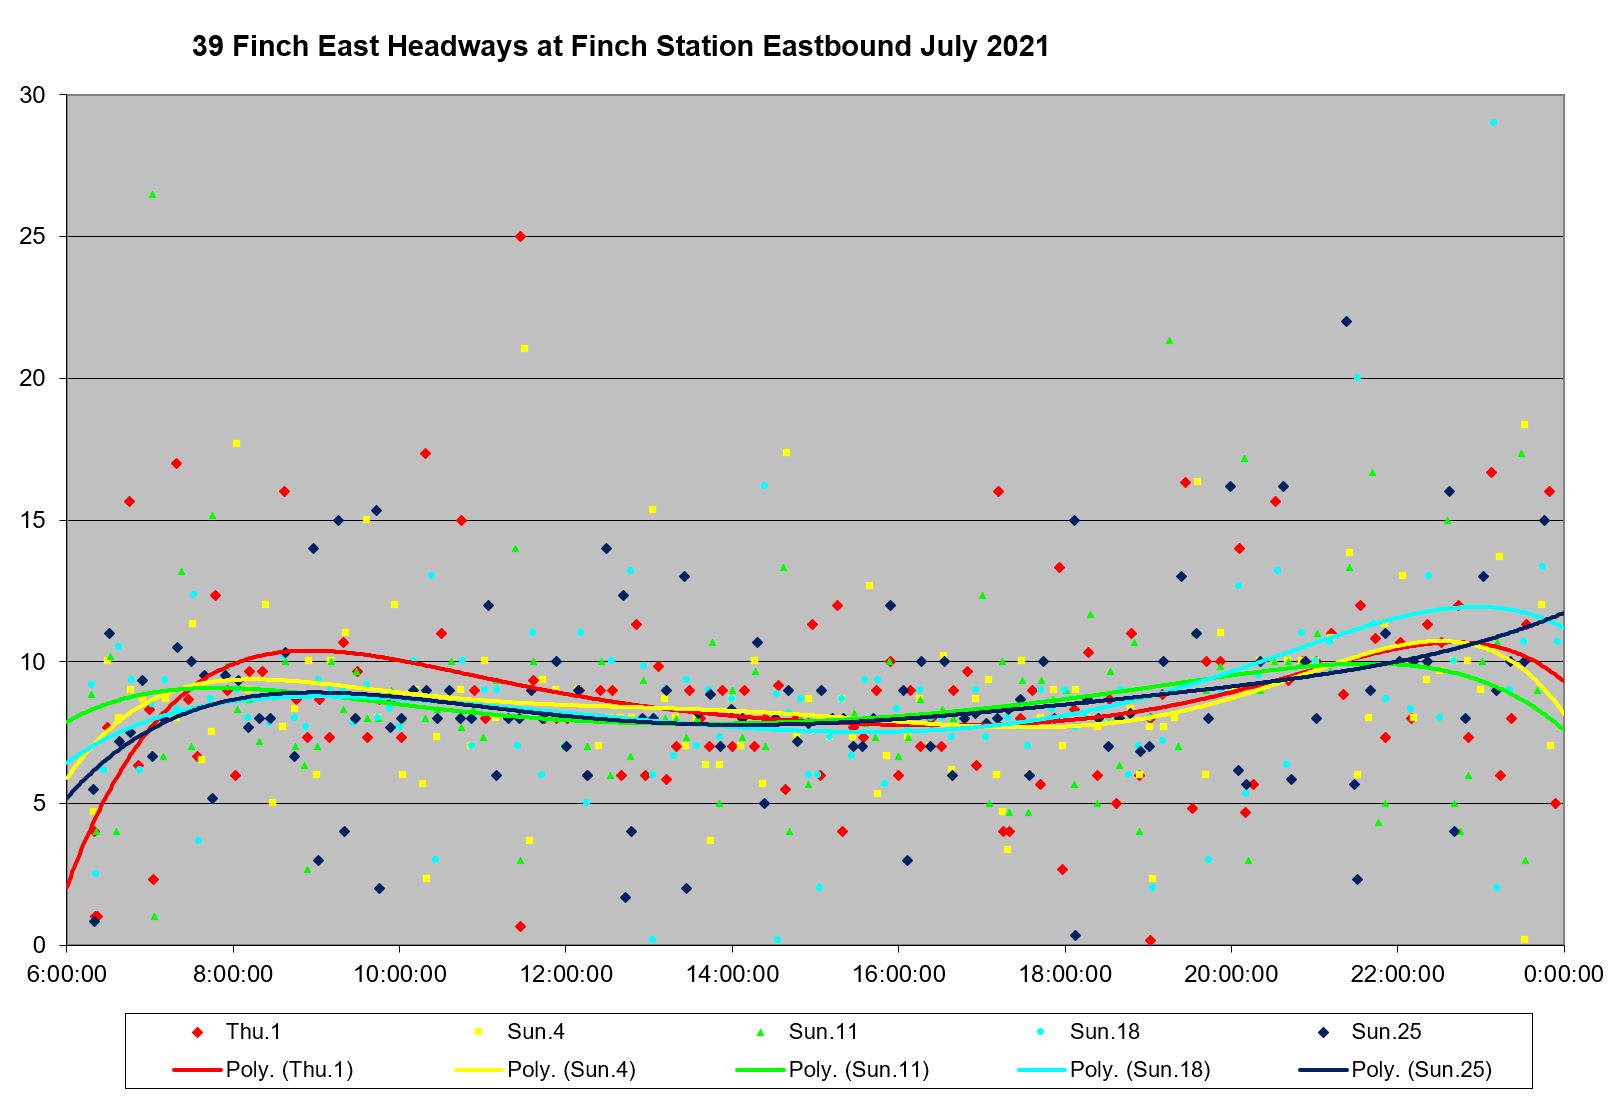
Local Service Eastbound from Finch Station
Service eastbound from Finch Station includes the scheduled short turns to Victoria Park. Again, there is a wide range of headway values, and buses running in pairs with offsetting gaps are common.


The situation on weekends is only slightly better than on weekdays.

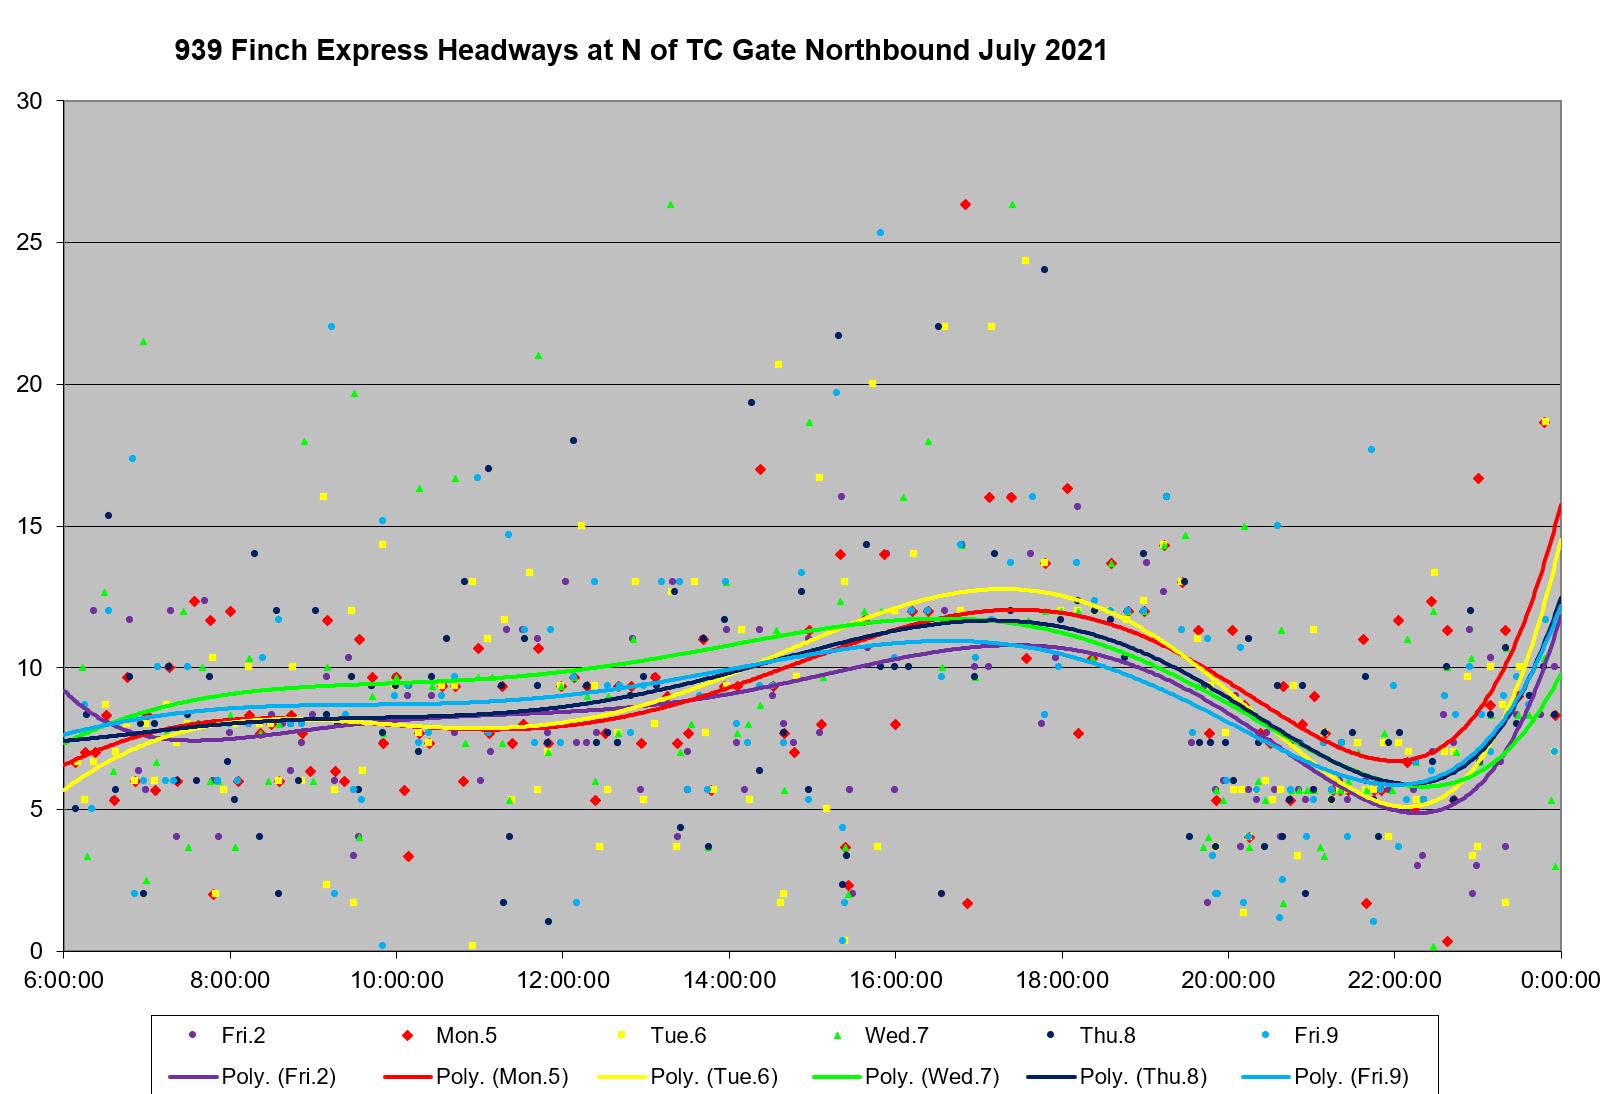
Express Service Westbound from Scarborough Town Centre
As with the local service, there is a wide range of headways on the 939 Express service. Leaving STC, the standard deviation in headways creeps above 5 minutes by the PM peak.
The actual headways are scattered over a wide range, and bunching is a particular problem in the mid-late evening hours. Although STC is a terminus and service should be well-regulated leaving this point, the headways are quite irregular.
Express Service Westbound from Morningside
Express service leaving from Morningside only runs in peak periods and shows a fair amont of bunching and gapping. This is a terminus where service should be on close to scheduled headways, but it is not.


Express Service Eastbound from Finch West Station
The express service eastbound originates from Finch West Station for most of the day but headways there are erratic. They get worse by the time service reaches Yonge Street.


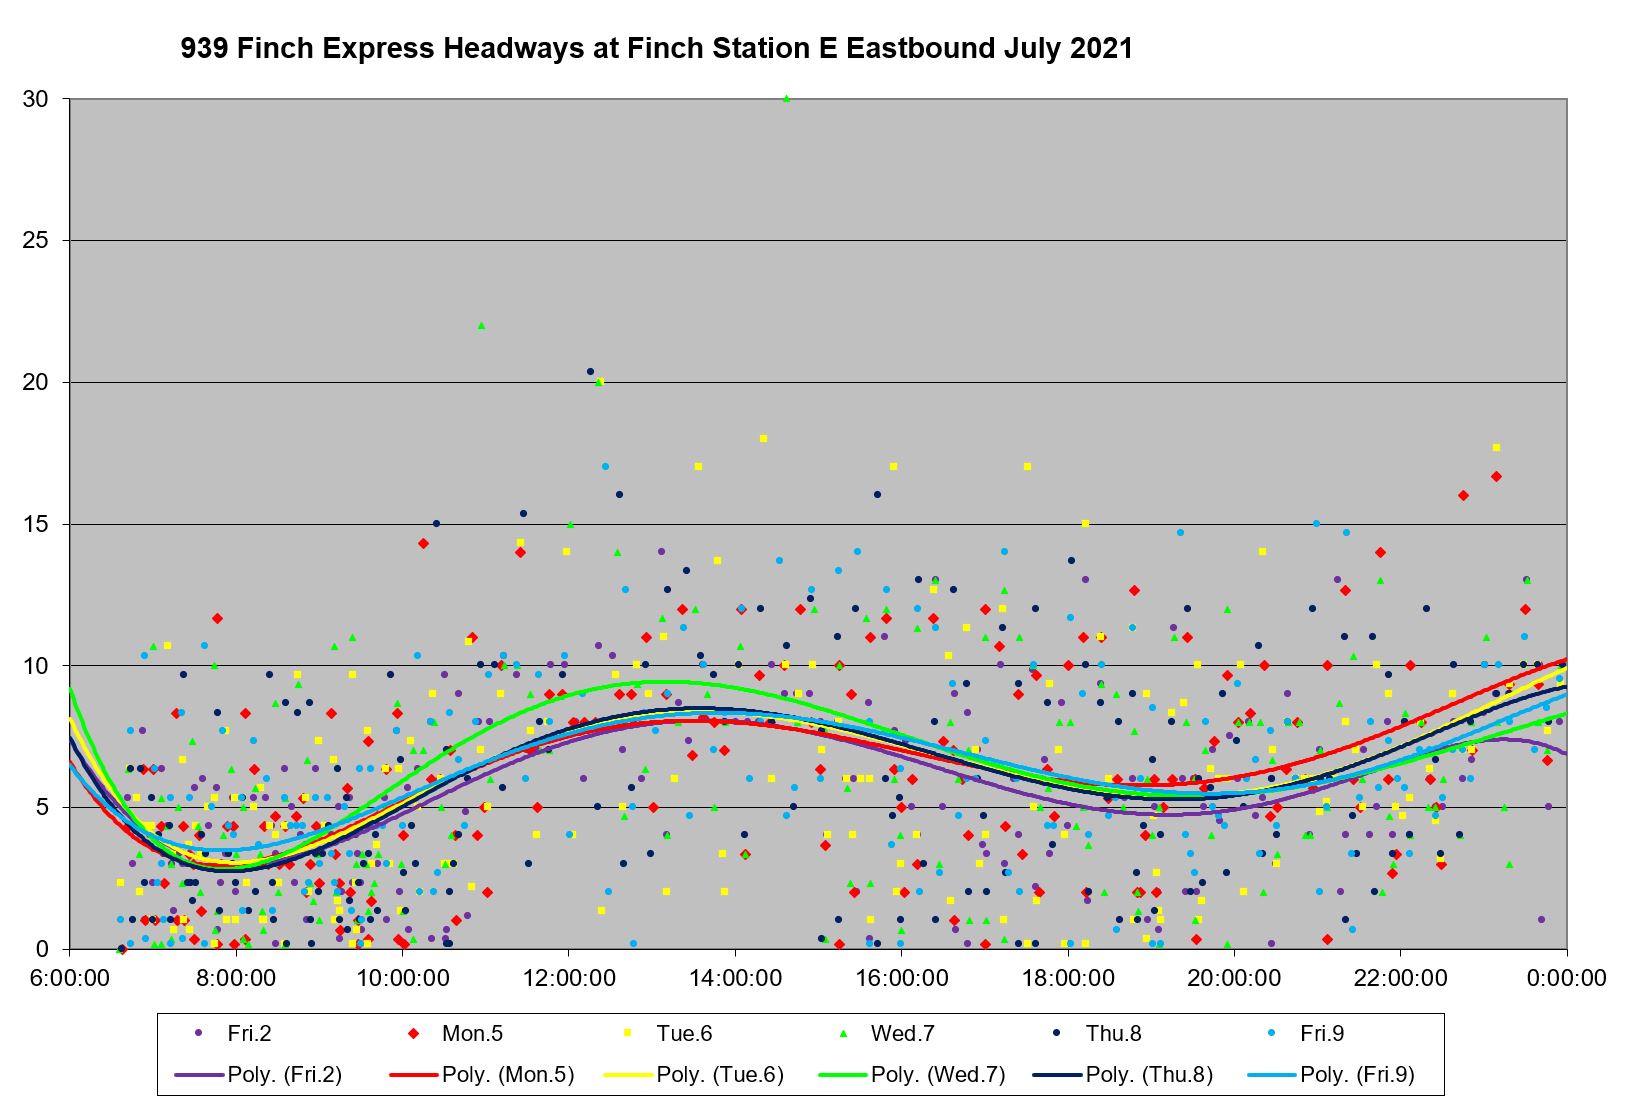
Express Service Eastbound from Finch Station
The 939 Express service from Finch Station is bunched and gapped all day long with many buses operating nose-to-tail as they leave. Although this is not a terminus, strictly speaking, it is a location where some degree of headway management should be possible because buses are off street.

Full Chart Sets
Travel Times Between Finch Station and McCowan Road
Speed Comparison Local vs Express July 2021
Headways July 2021
