
This article is a follow-on to How Slow Is The 510 Spadina Car? and an update of The Gradual Slowing of 512 St. Clair (Parts 1, 2 and 3).
Like the Spadina route, St. Clair operates in a reserved lane with many farside stops. The route has also been through the transition from CLRVs to Flexitys, and is subject to many of the same operational rules as the Spadina car. However, there are a few significant differences: St. Clair has fewer intersections (special track work) where slow orders apply, and the transit priority signalling is supposed to be active except at major intersections where cross-street capacity takes precedence.
The charts here are in the same format as those shown in the previous Spadina article for ease of comparison.
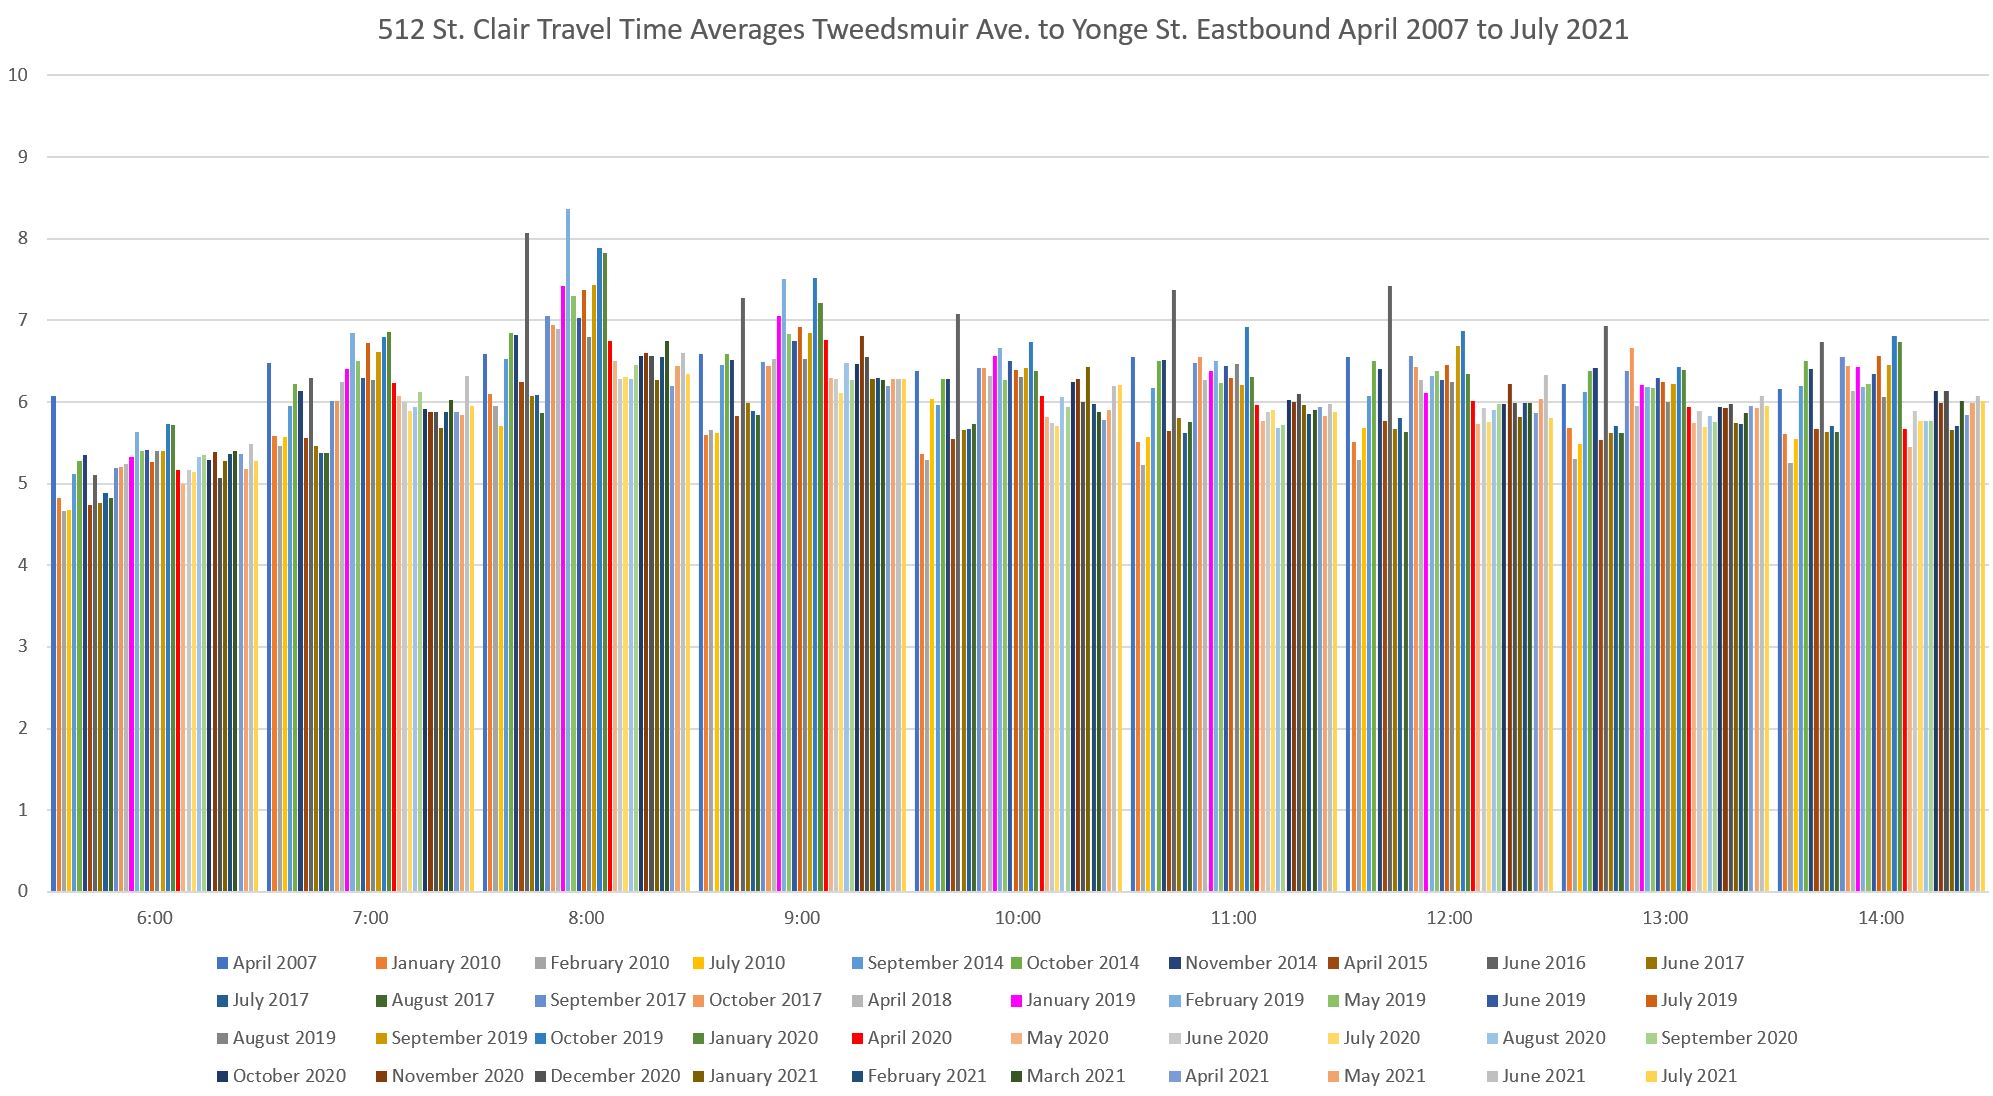
Travel Times From 2007 to 2021
To eliminate effects from layover times at terminals and at the St. Clair West transfer station, I have broken the route into two segments west and east of that station and limited the analysis to the portion of the route that does not include these loops.
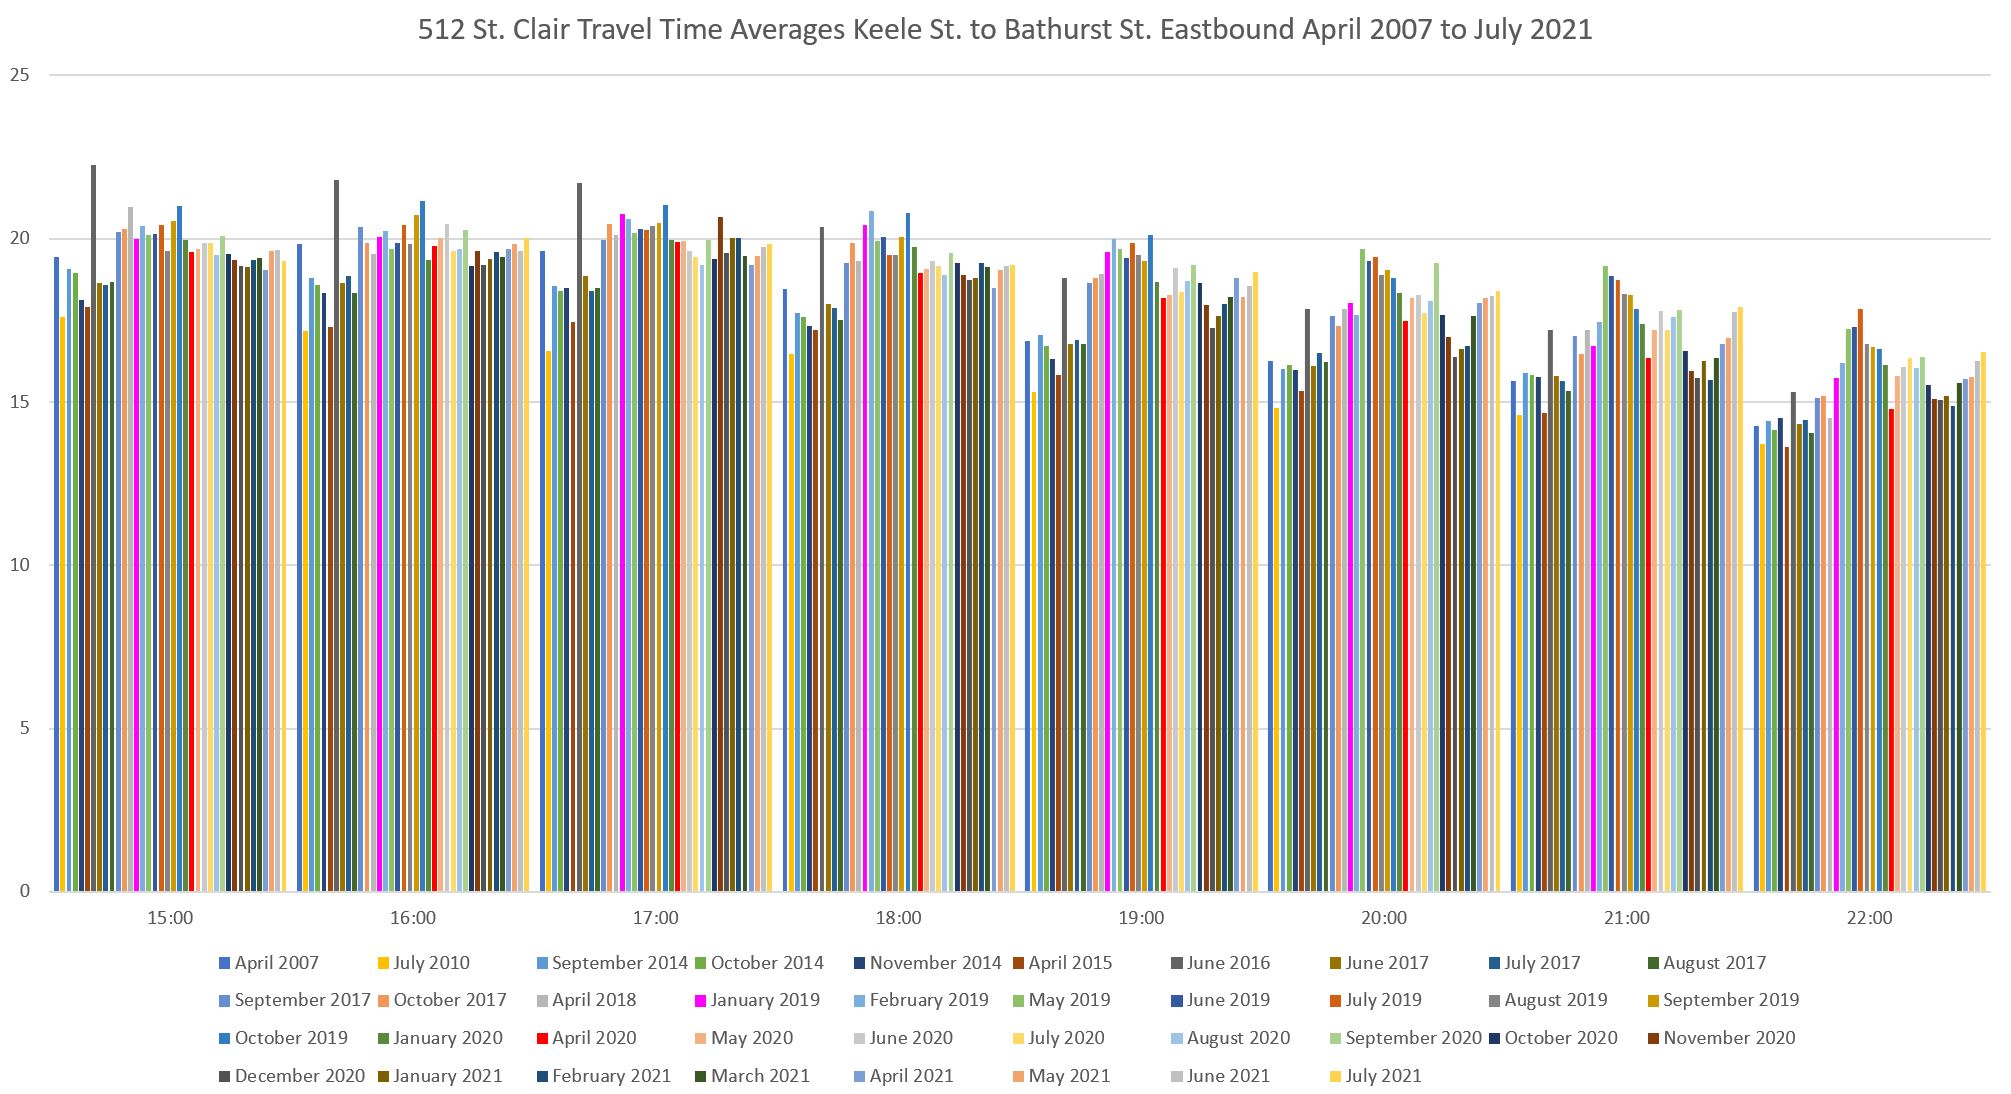
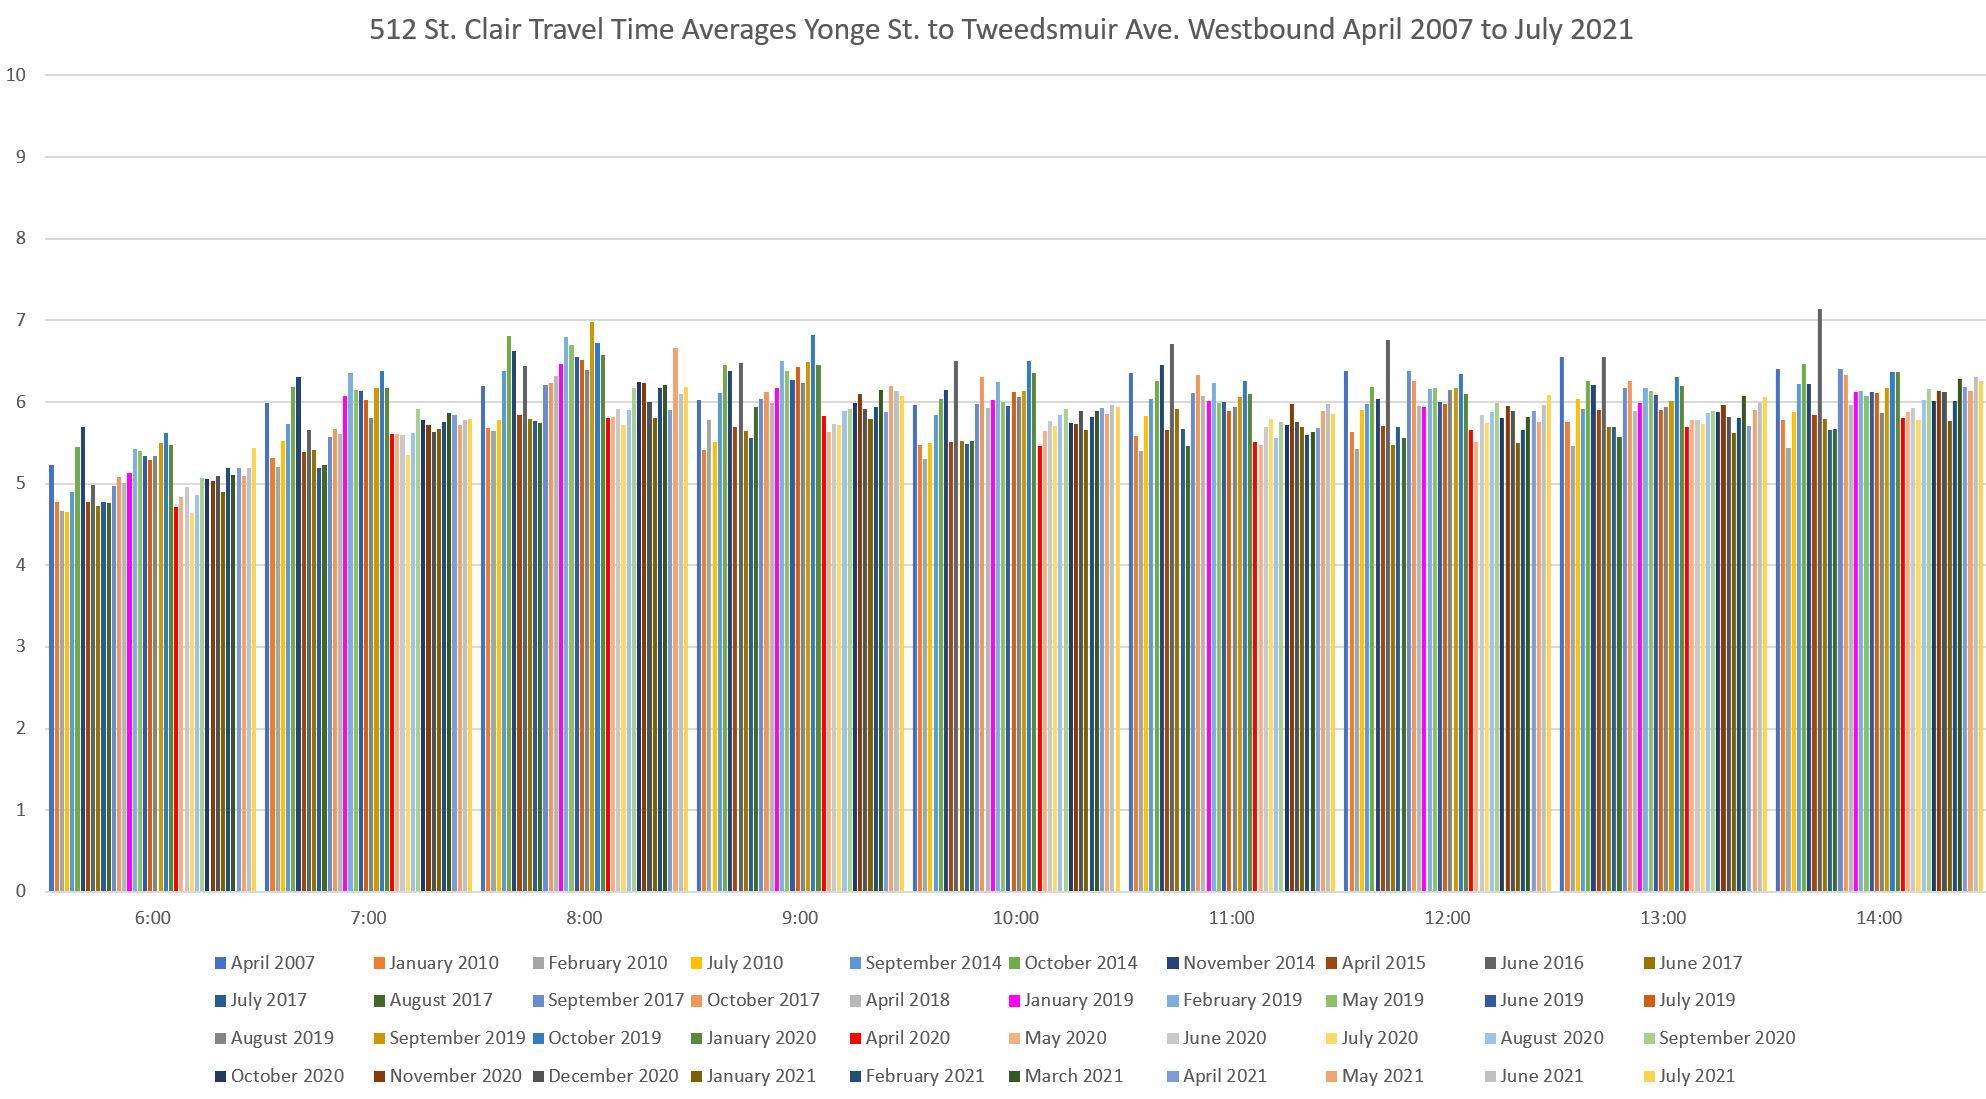
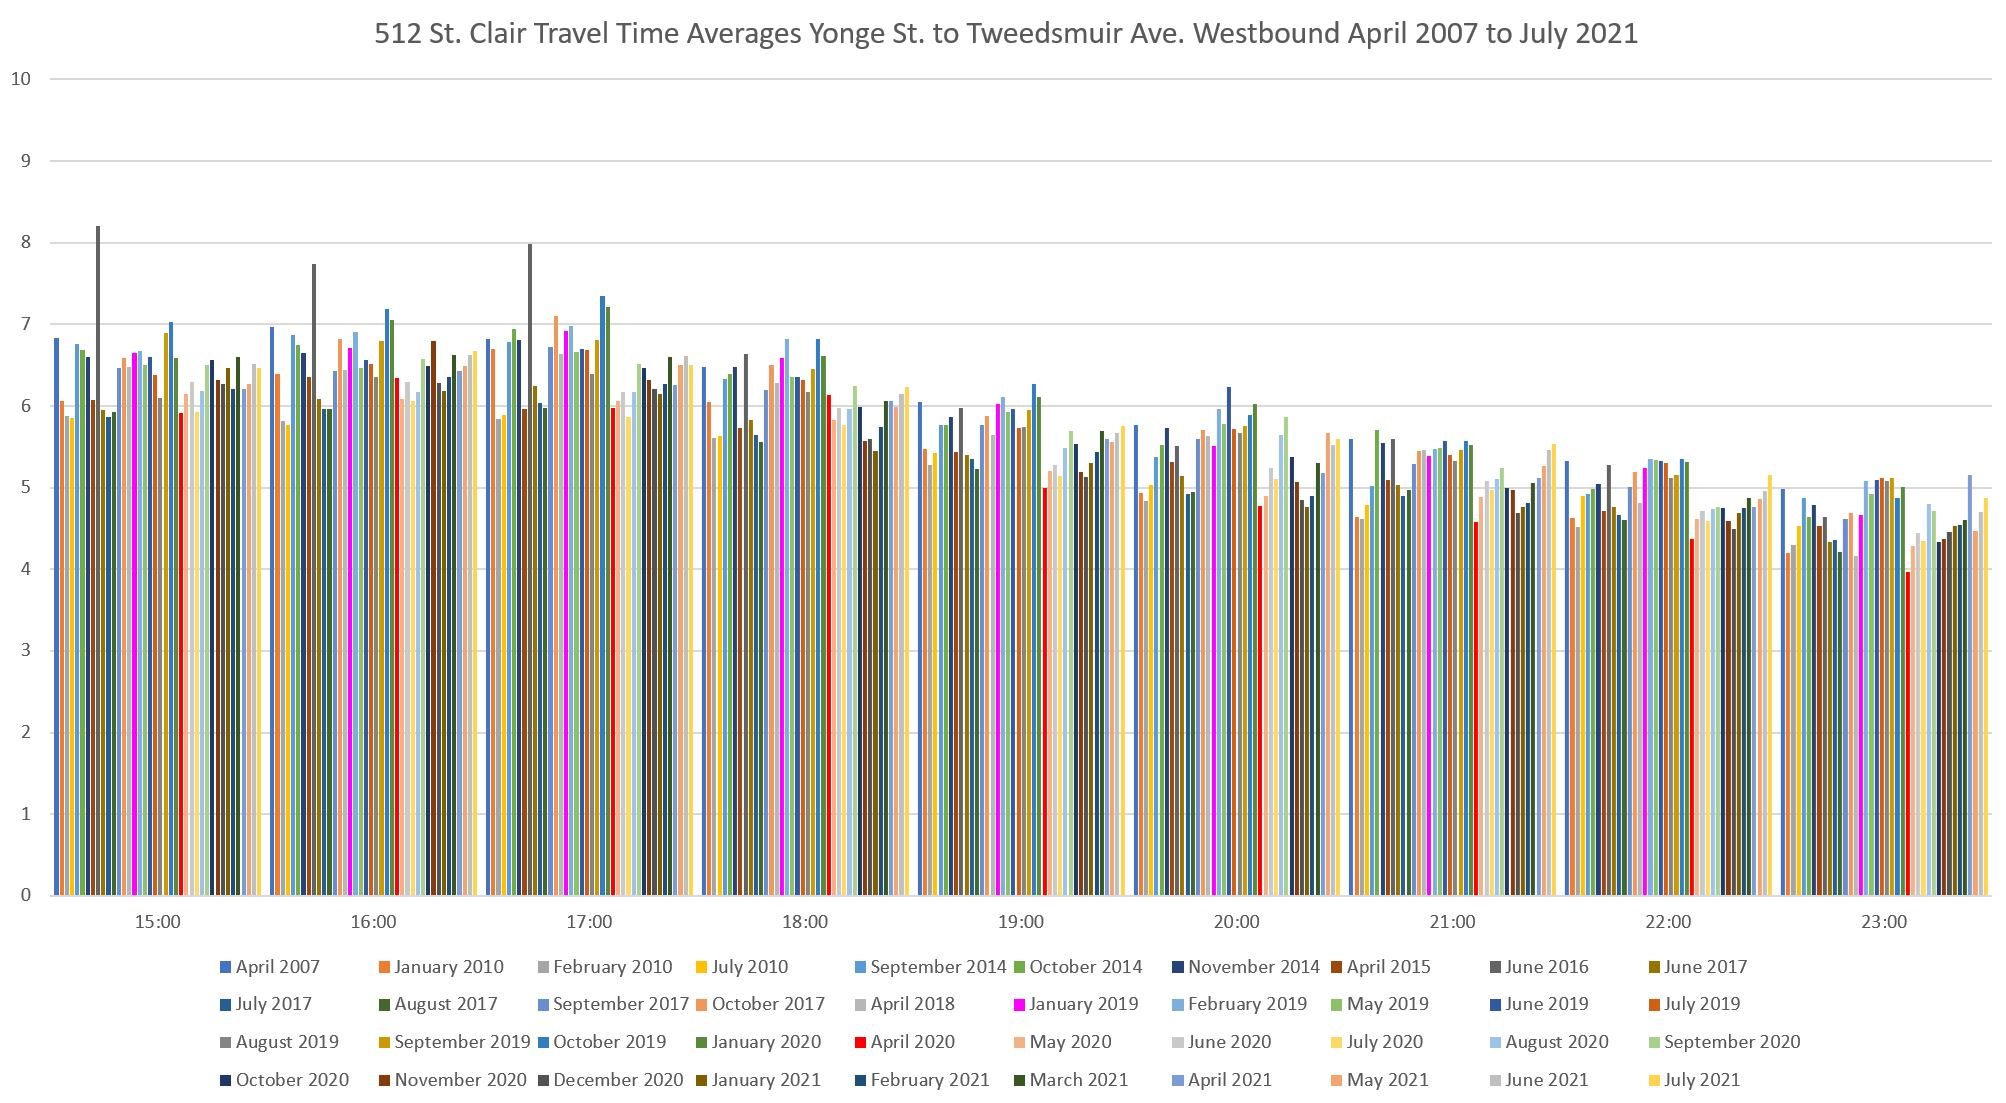
Each group of columns in the chart represents data for one hour, and the individual columns show values for specific months. The entire span of the day from 6 am to midnight is split into separate charts so that the columns are not too crowded. (Click on any chart for a larger version.)
A noteworthy point about St. Clair is that peak travel times do not differ from off-peak times to the same degree as found on most routes, especially pre-pandemic. This shows the benefit of operation on a reserved lane where interference from “traffic” is largely absent.
The bright pink column, January 2019, marks the change in scheduled vehicle type from CLRV to Flexity. This actually started in September 2018, but I do not have data for the route for that month.
The bright red column, April 2020, is the second month of the pandemic which brought shorter travel times during some but not all parts of the day. The effect was small compared to some other routes.
Note that there are gaps in the dates for which data are shown because I was not collecting it on a regular basis for this route.
In summary, travel times on St. Clair grew slowly over the years with a jump at the point where Flexitys began to replace CLRVs. There was a slight drop in travel time with the pandemic-induced drop in traffic and travel, but this was not substantial compared with some other routes where traffic congestion was (and is becoming again) a major factor.
Bathurst to Keele
The charts in this section show travel times measured from screenlines in the middle of the Bathurst/St. Clair and Keele/St. Clair intersections. In other words, the start and end times are counted from when a streetcar crosses the intersection.


Yonge to Tweedsmuir
This section is much shorter, and so the vertical scale used here is different from the charts for the western portion of the route topping out at 10 minutes rather than 25. Changes in the height of the bars therefore represent a smaller absolute rise or fall in travel times for this segment compared to the charts above.
The screenlines for this section are in the middle of Yonge Street in the east, and west of the stop at Tweedsmuir before the portal into St. Clair West Station in the west.
These charts include data for January and February 2010 which do not appear for the western section because streetcar service only ran to Lansdowne during that period.

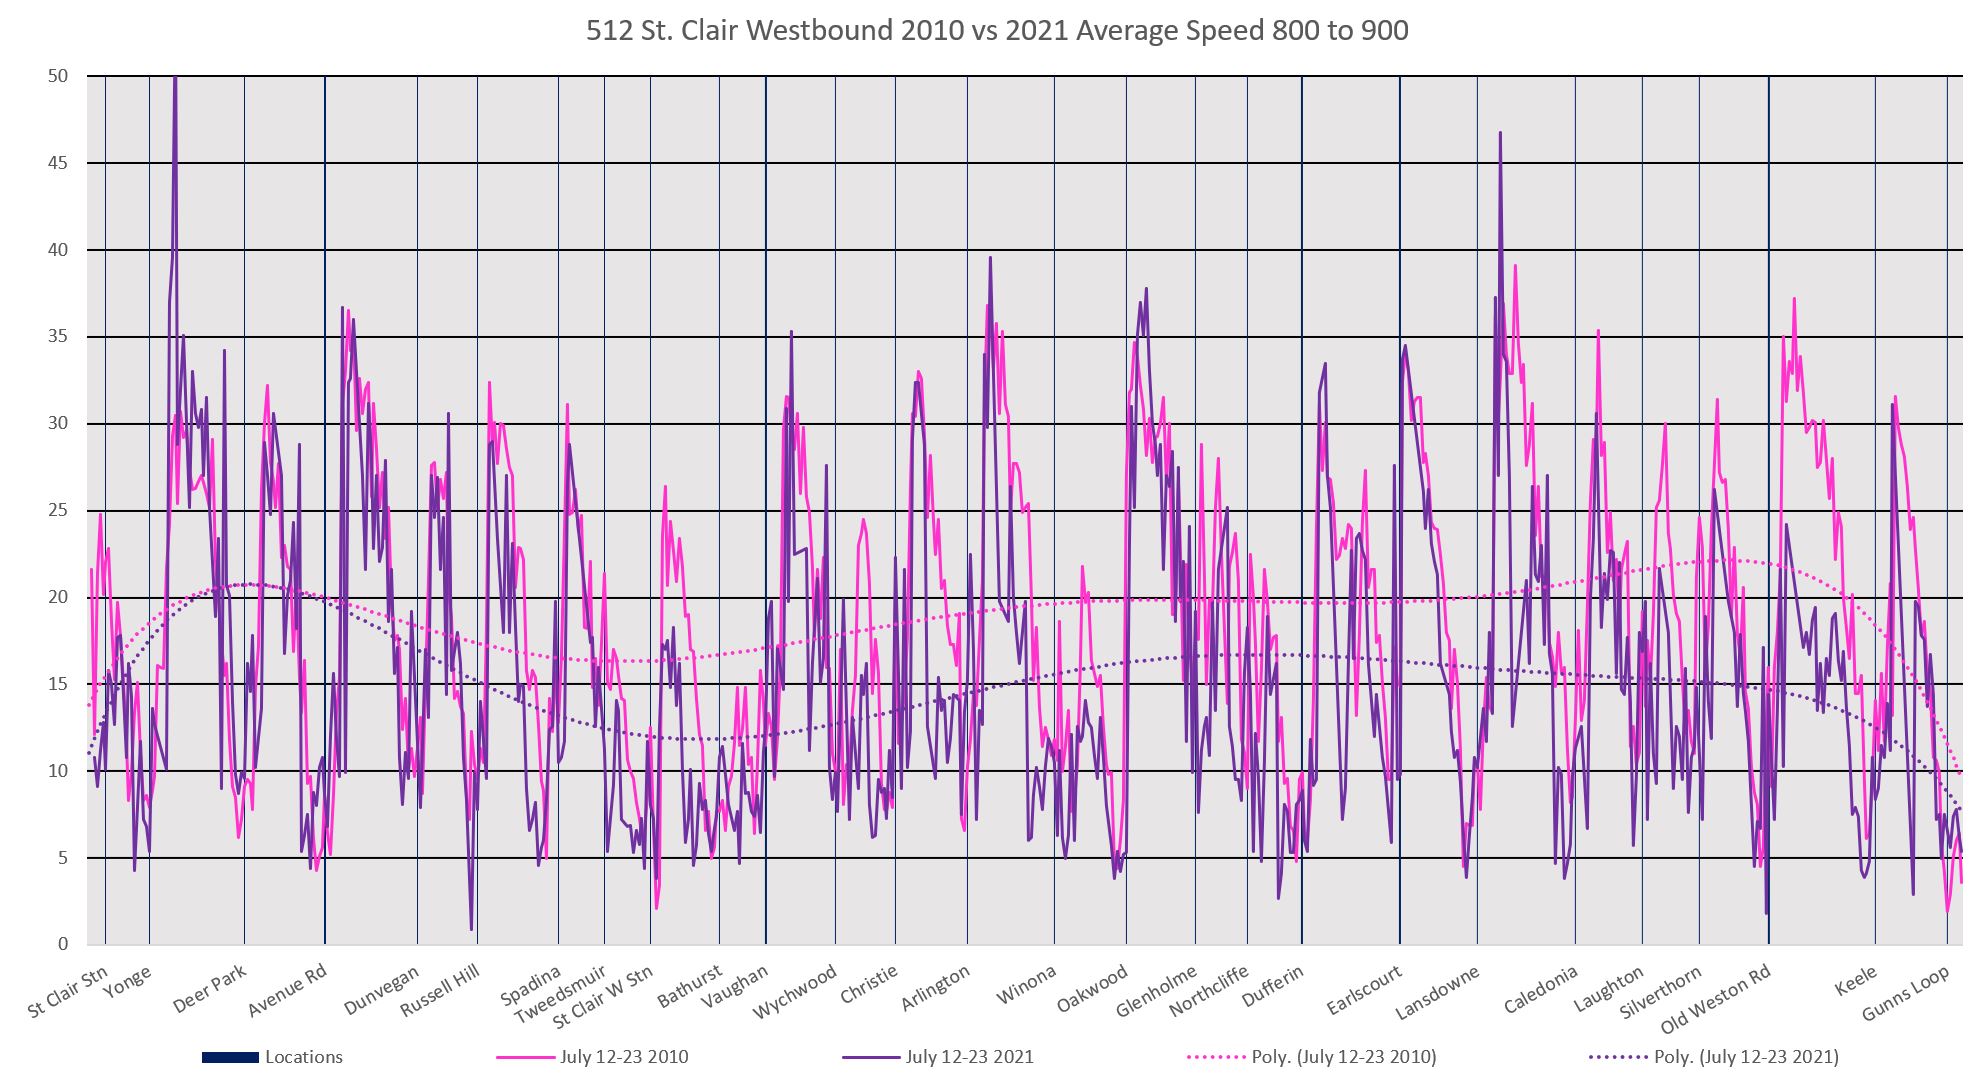
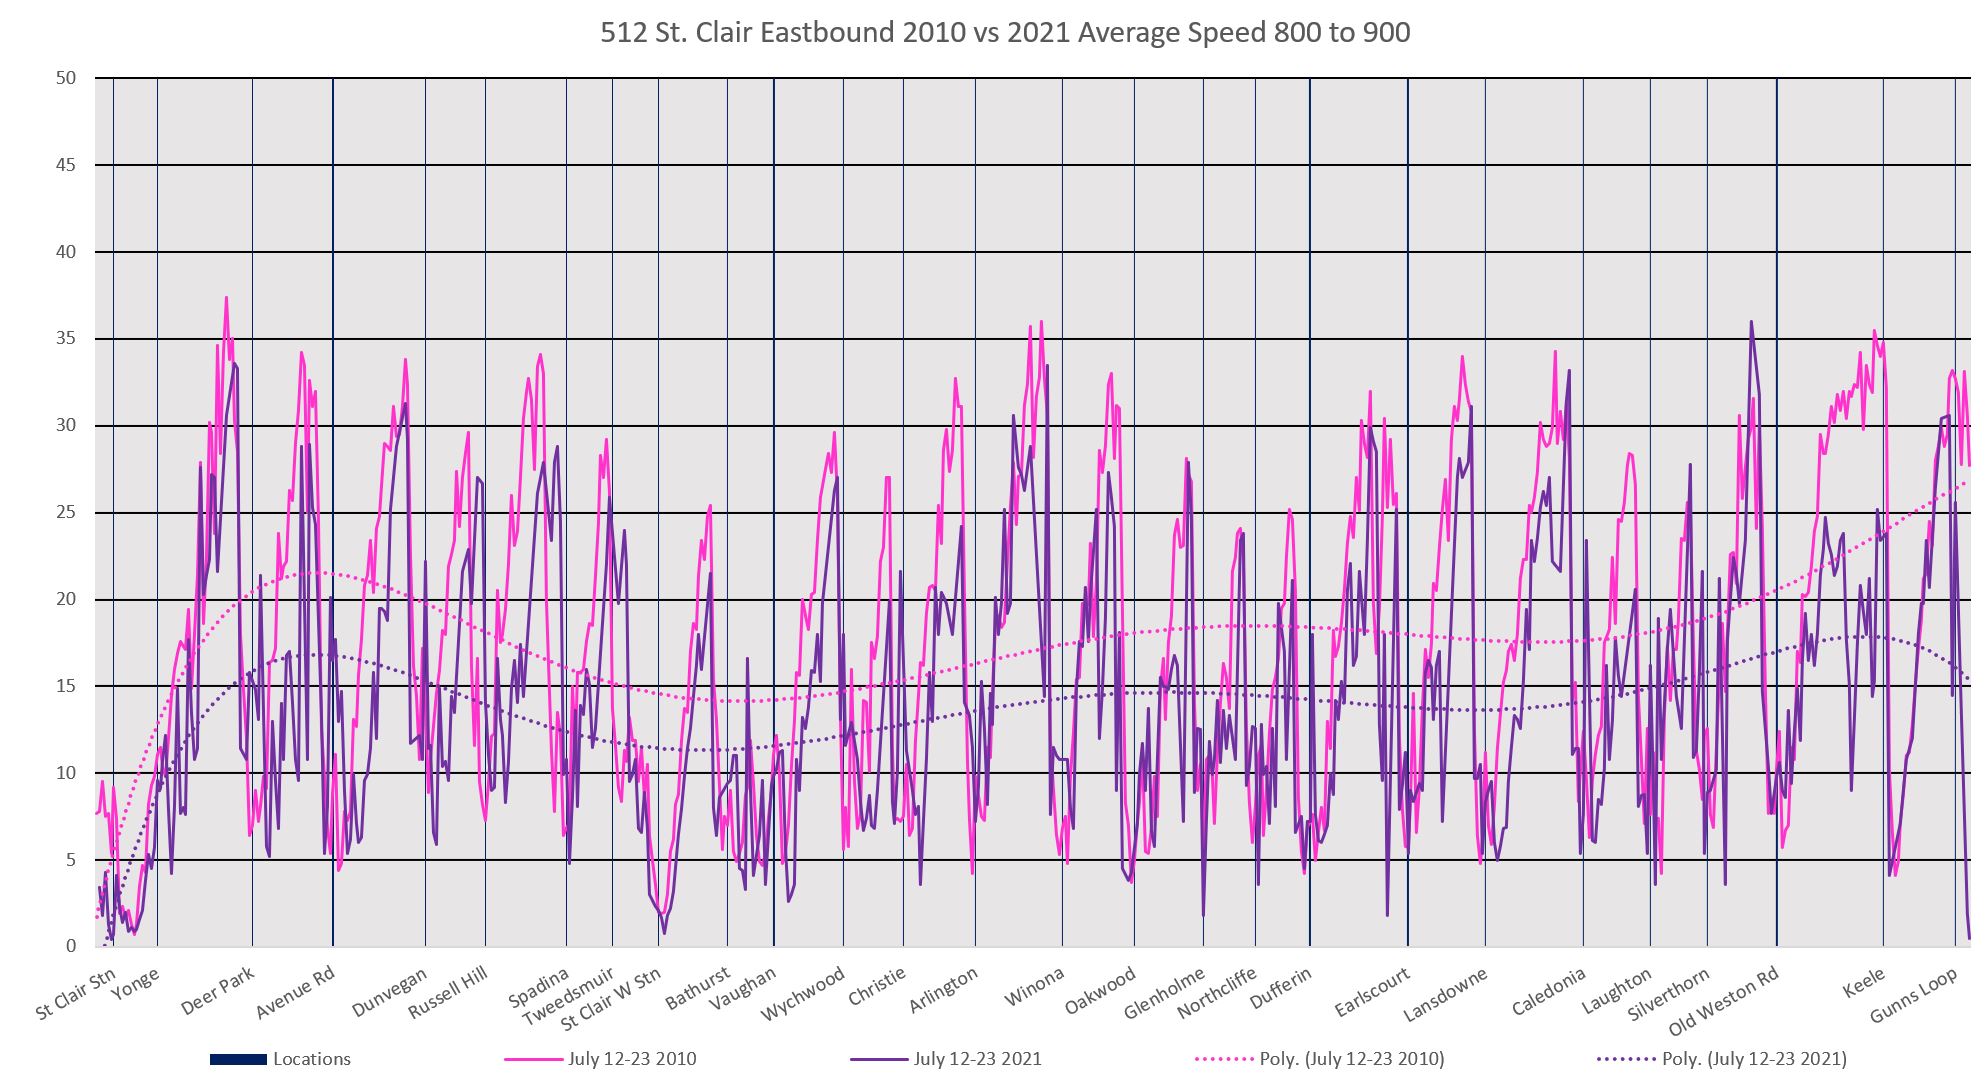
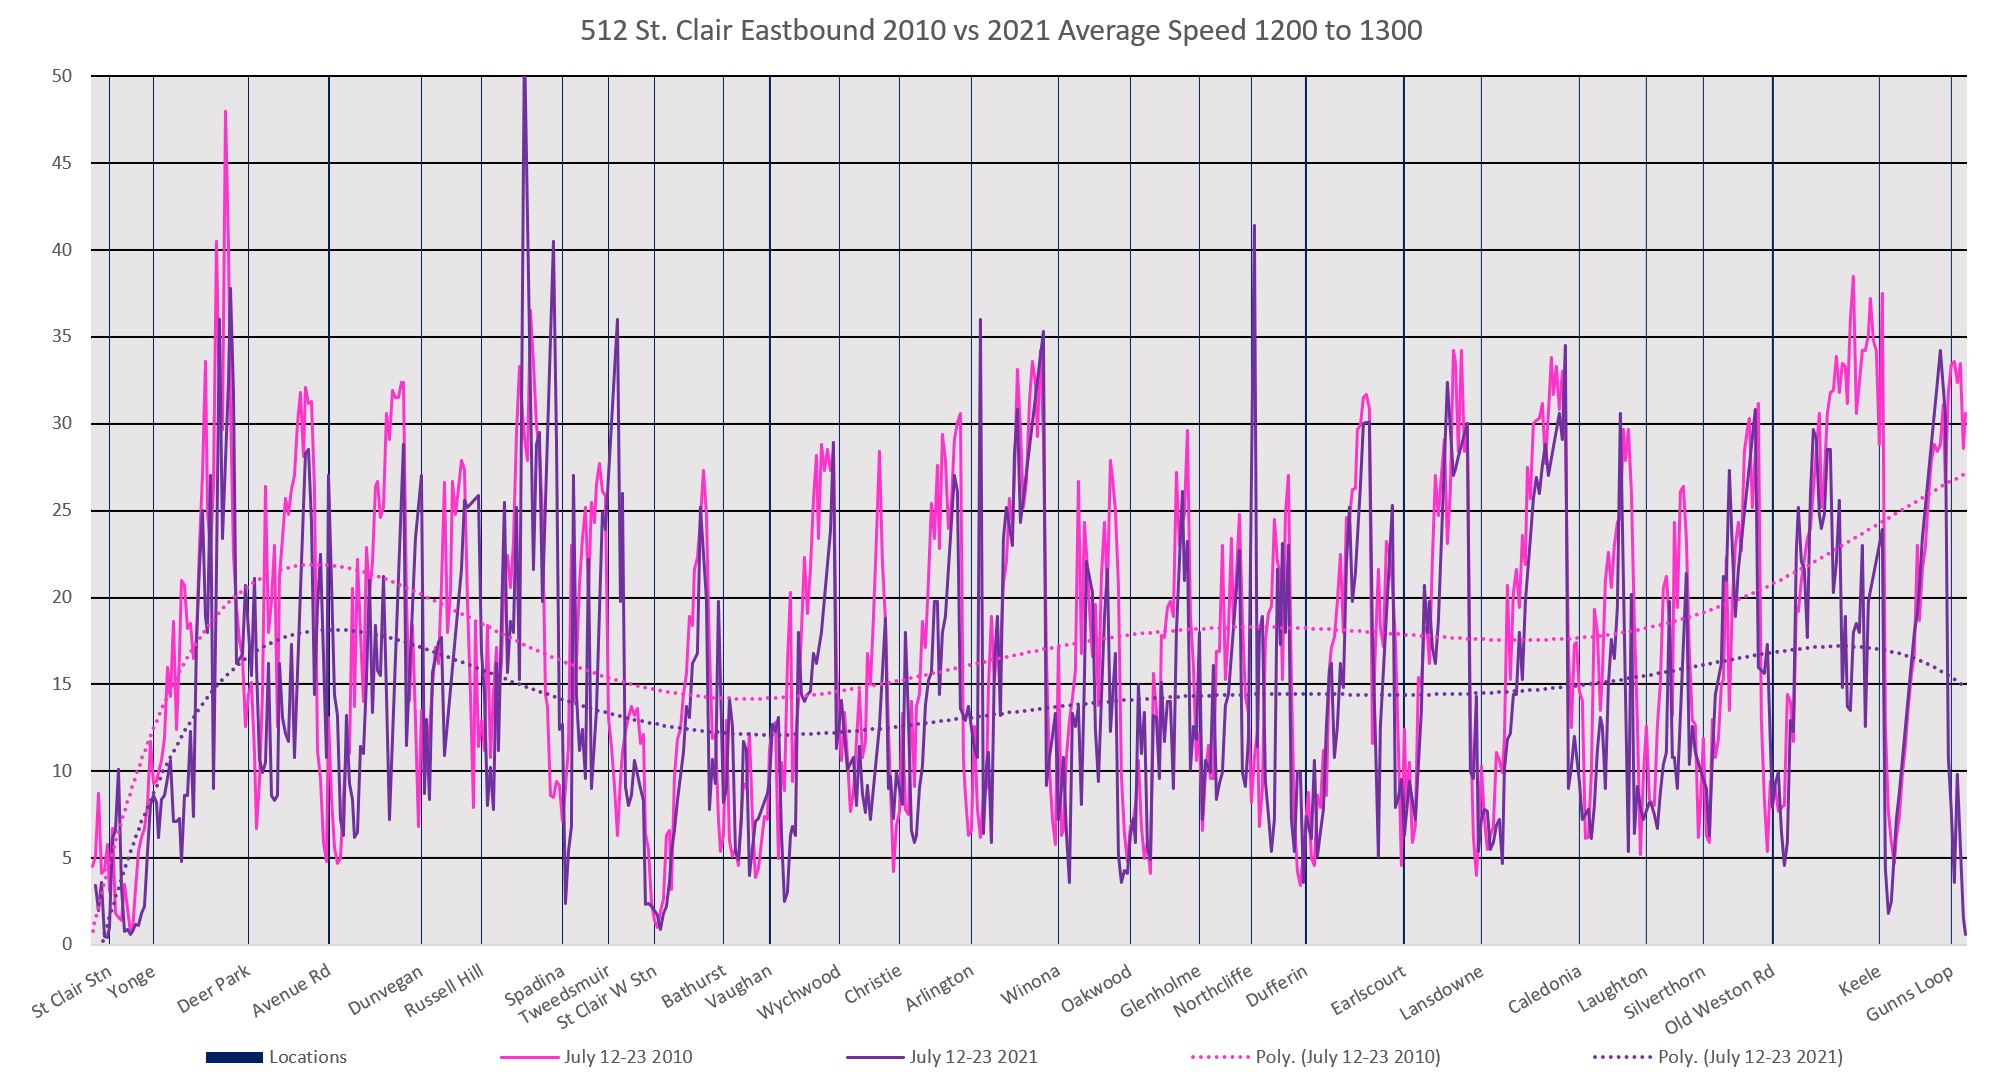
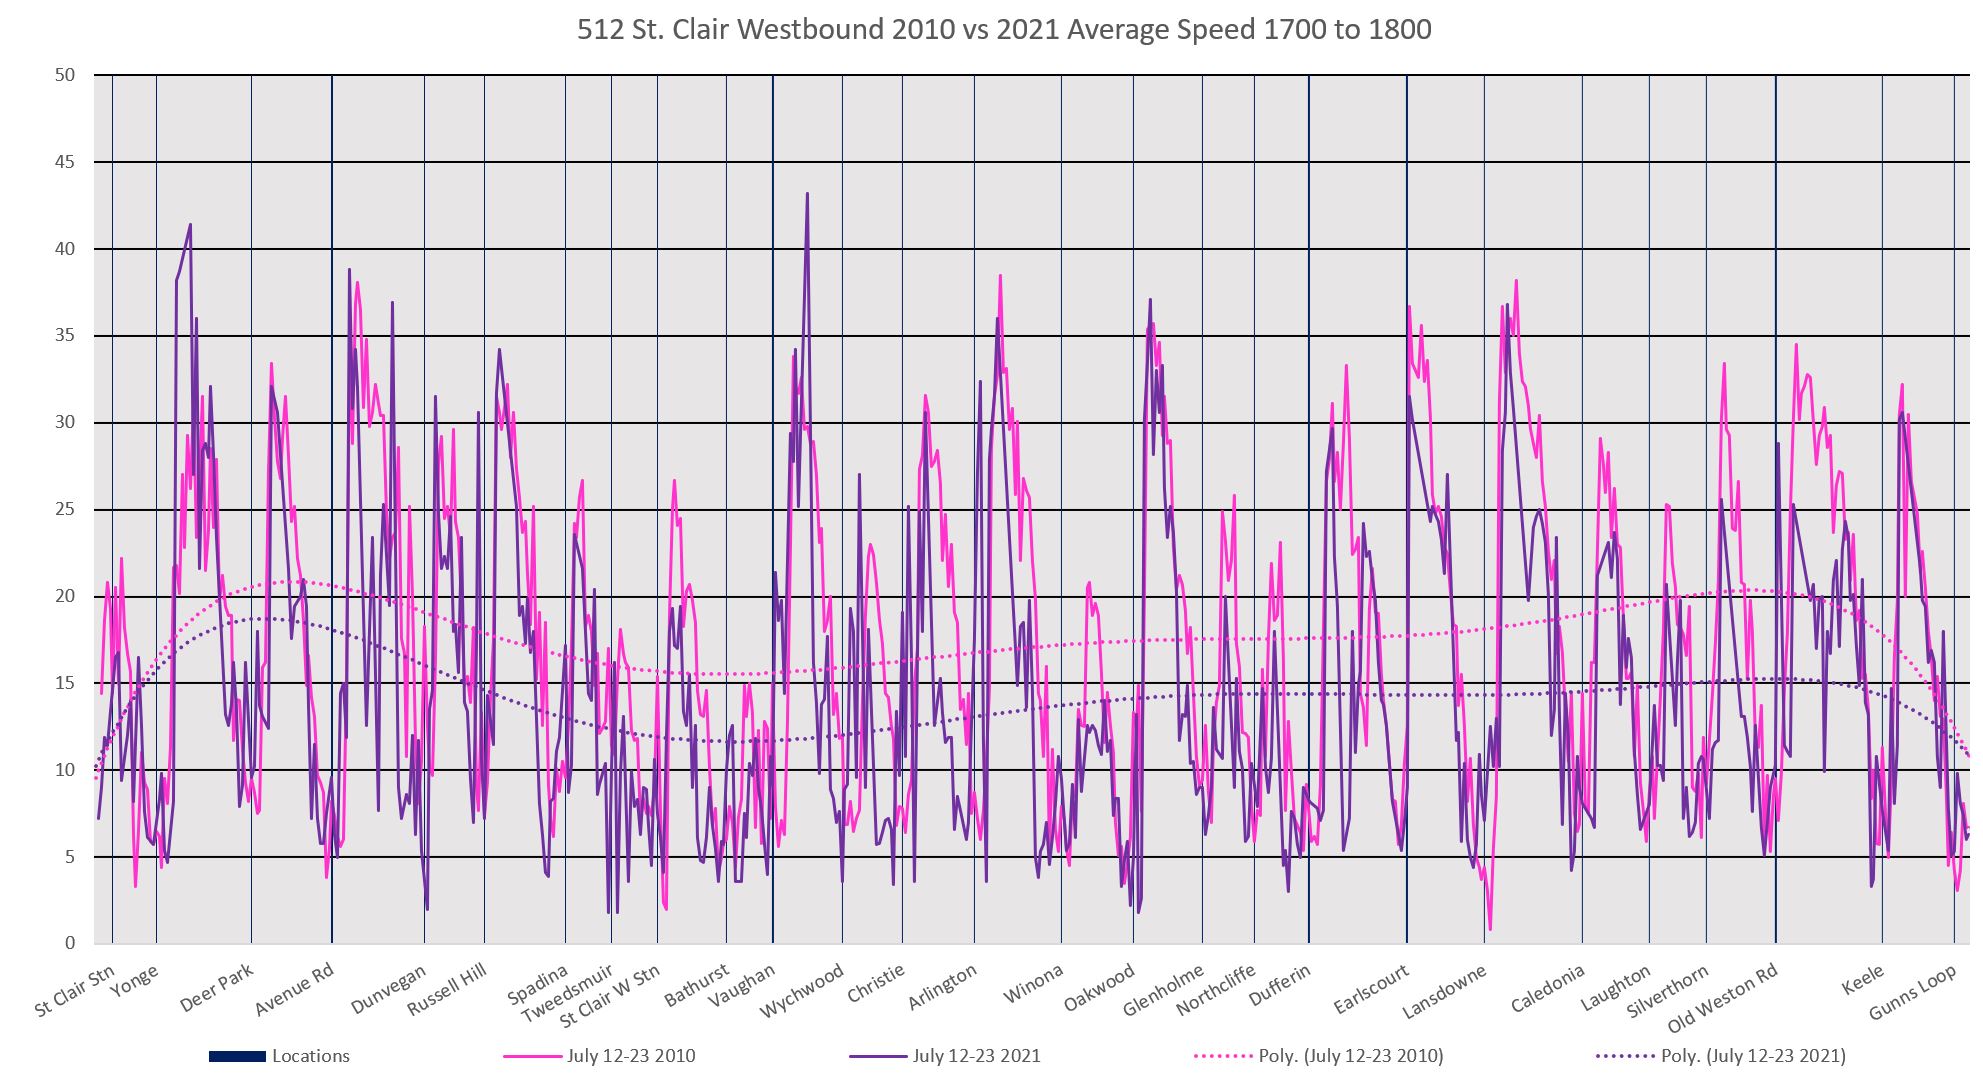
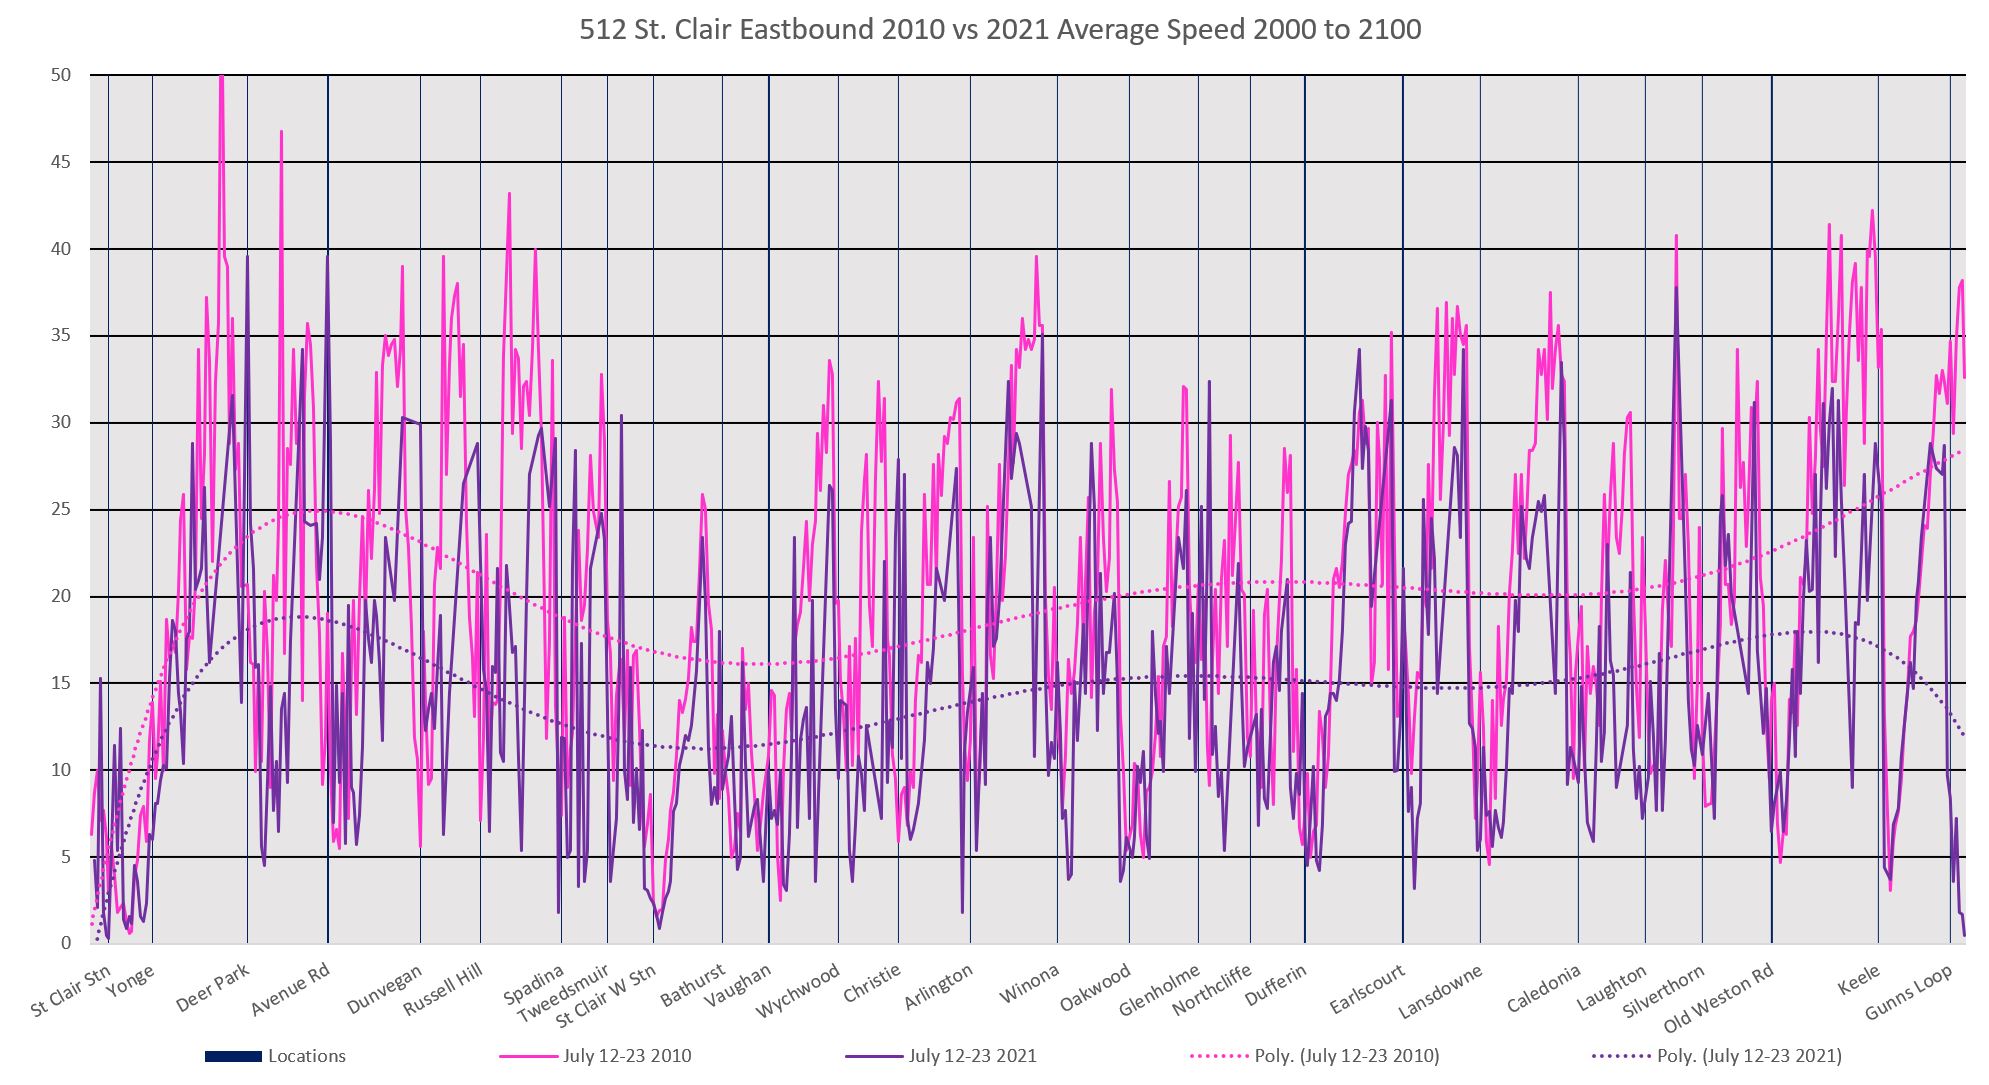
Comparison of CLRV (2010) and Flexity (2021) Travel Speeds
The charts in this section compare average vehicle speed along the route by time of day for the period July 12-23 (weekdays) in 2010 and 2021 (the calendars for these years are identical, and this period contains weeks 2 an 3 of the months).
The charts are oriented identically for eastbound and westbound travel. Westbound charts should be read from left to right, while eastbound charts from right to left. Here are the charts for the hour between 8 and 9 am.
The pink line is 2010 data and shows the speed of service operated with CLRVs at that time. The dark purple line is 2021 data showing speeds for Flexity operation. A few points to note about these data:
- A general pattern is that the CLRVs accelerate to a higher speed after leaving stops in many cases although the Flexitys do catch up to the same top speed in some cases. This contributes to an overall faster trip as shown by the trend lines (dotted).
- Operation by the Flexitys through the underpass east of Keele is considerably slower than for the CLRVs probably due to a standing slow order.
- Although many stops on St. CLair are farside, there is less evidence of double-stopping (before and after crossing to the platform). This indicates that in many cases streetcars are receiving priority, or more accurately are not being held by traffic signals as commonly as on Spadina. This is generally achieved with green time extension for St. Clair by “stealing” cross-street green time when there is a streetcar nearby.
- The overall shape of the charts is similar for all time periods reflecting the fairly uniform conditions and travel times seen on the route. (Readers interested in other dates between 2010 and 2020 should refer to the previous articles linked above.)
- These charts do not show dwell times at stops.
The next charts show mid-day behaviour.
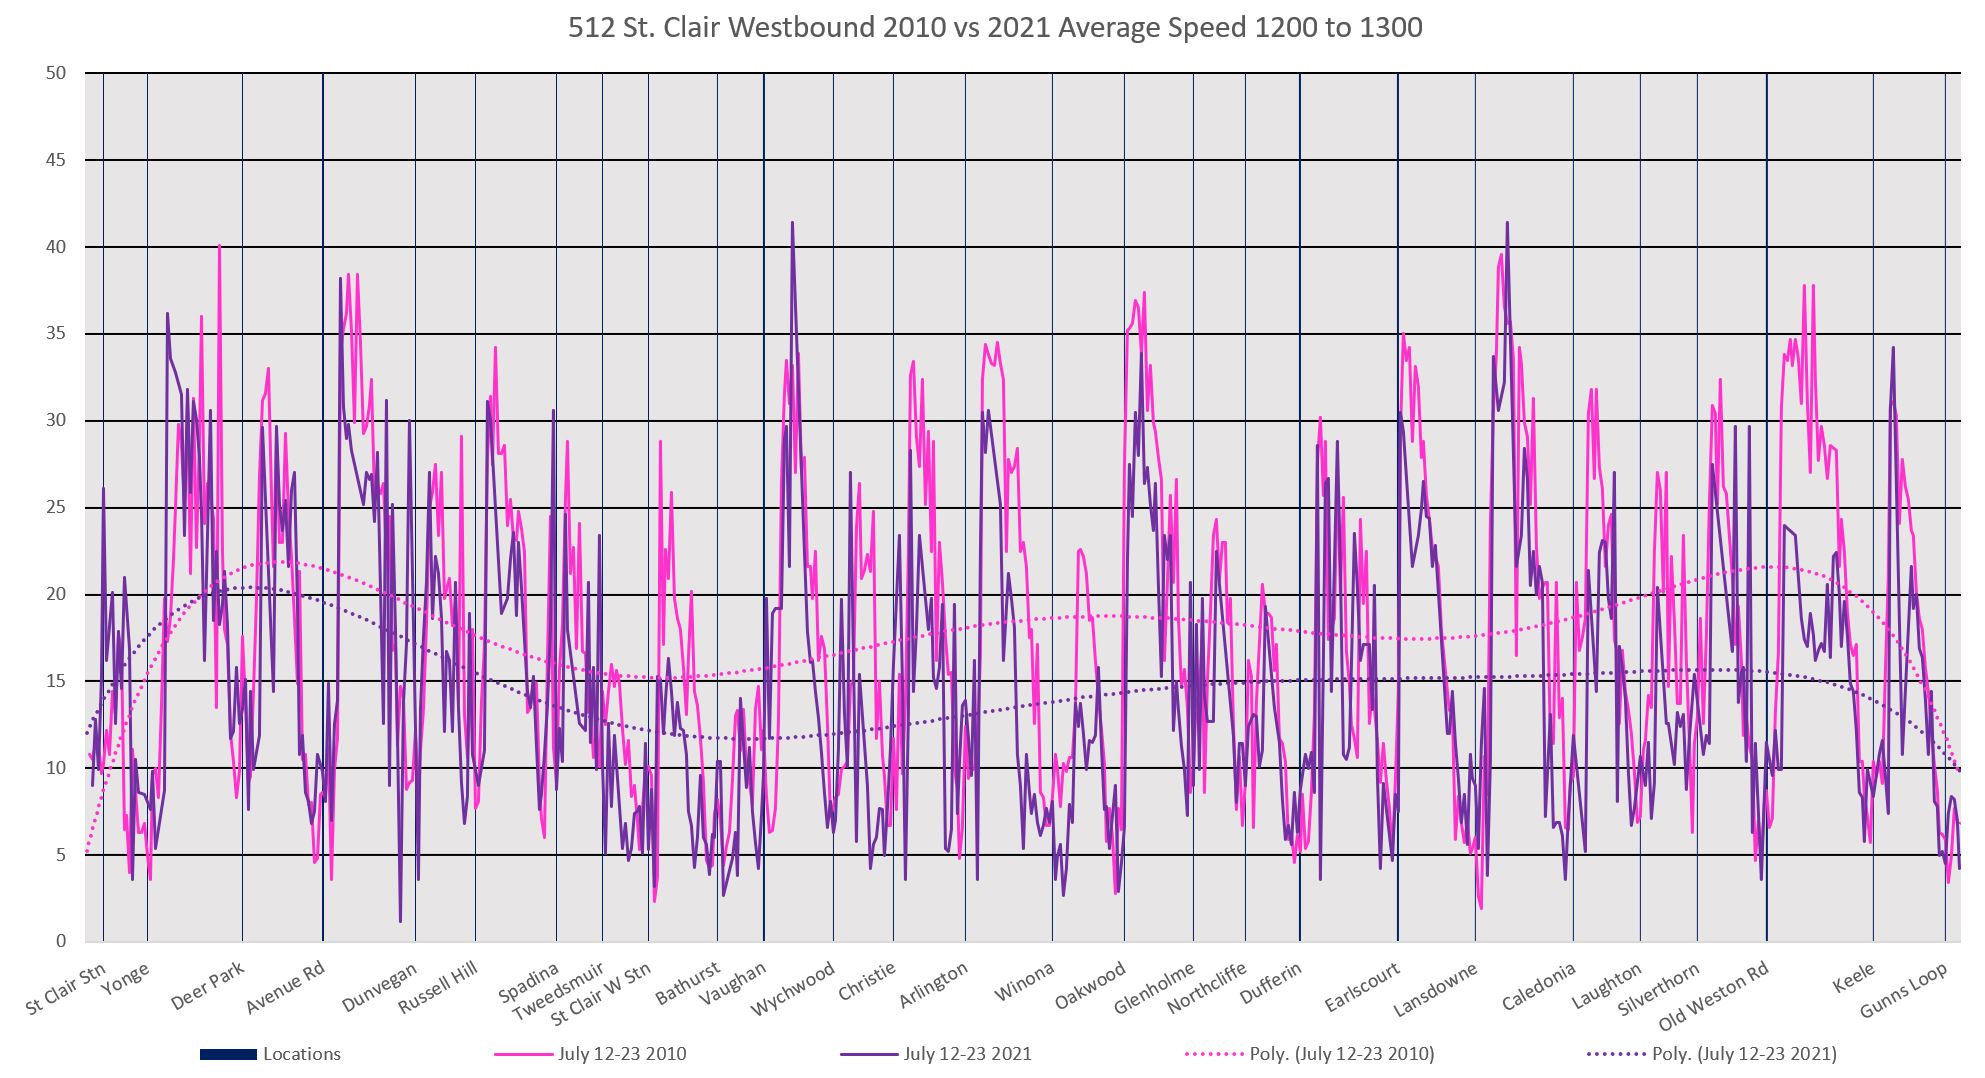
In the PM peak

Mid-evening

Full Chart Sets
Travel Time Charts:
Speed Comparison Charts:
These charts contain one page for each hour of the day. Readers can view how the travel speeds evolve from hour to hour by stepping through the pages in a “flip chart animation”.

The original 1913 St. Clair streetcar right-of-way had no left turn lanes, no priority for the single-occupant motor vehicles, and little in traffic signals. When the installed the right-of-way by 2009, the all mighty automobile disciples at city hall forced left turn lanes upon St. Clair Avenue West, along with priority to the single-occupant motorists making left turns, at a cost of a loss of sidewalk space. The horseless carriage was and still is king.
LikeLike
Though in theory signal priority could guarantee streetcars a green at every minor street, a quirk in how the signals handle left turns from St. Clair prevents that.
When a left turning vehicle is detected during the St. Clair green, the signal first calls the side street green (including the pedestrian crossing) and only shows the left turn green after that finishes. This means that after the initial flashing don’t walk (about 10 seconds), streetcars get about 45 seconds of red that they can’t influence (~35s for the possibly empty side street, ~10s for the left turning car).
Oddly, though most (all?) intersections on St. Clair behave like this, some others in the city don’t have this problem. Danforth Avenue at Danforth Road gives left turns a green on demand without a mandatory cross street green before it, and Spadina at Lakeshore inserts a green for streetcars between the cross street and left turns.
Steve: Yes. The cases where a side street gets a green it does not require certainly waste time. I suspect that the premise is that it is needed to stop all St. Clair traffic in order to activate the left turn, but obviously, this could simply be accomplished by going from green for St. Clair, to all red, to left turn arrow for St. Clair and back to green for St. Clair. There are many quirks in the traffic signal setup.
LikeLiked by 1 person