The reconstruction at Wilson Station that will displace routes from the lower level bus loop to a temporary area in the parking lot has been deferred to the schedule change in mid-November.
The reconstruction of track at Lake Shore and Kipling that would have required diversion of bus services has been deferred with no new date.
StudentMoveTO Moving Post-Secondary Students in the GTHA: Preliminary results from a survey and study on student mobility in the Toronto Region (An invited presentation by Roger Keil of York University and Danya Tugg of Ryerson University)
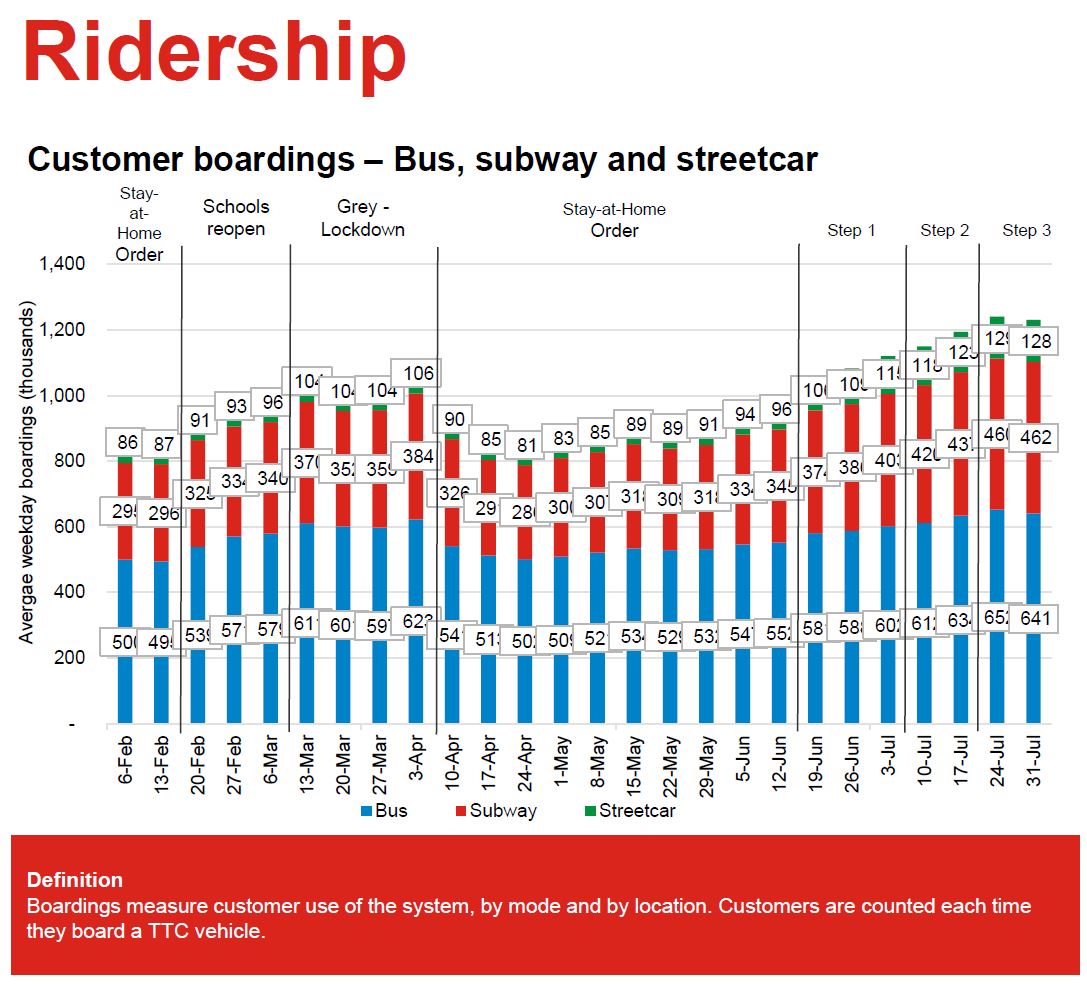
Ridership is growing slowly on the TTC with the largest changes, proportionally speaking, coming on the streetcar and subway systems that serve downtown. These modes are now at 31 and 37 percent respectively of pre-covid levels while the bus system is at 46 per cent as of July 31, 2021.
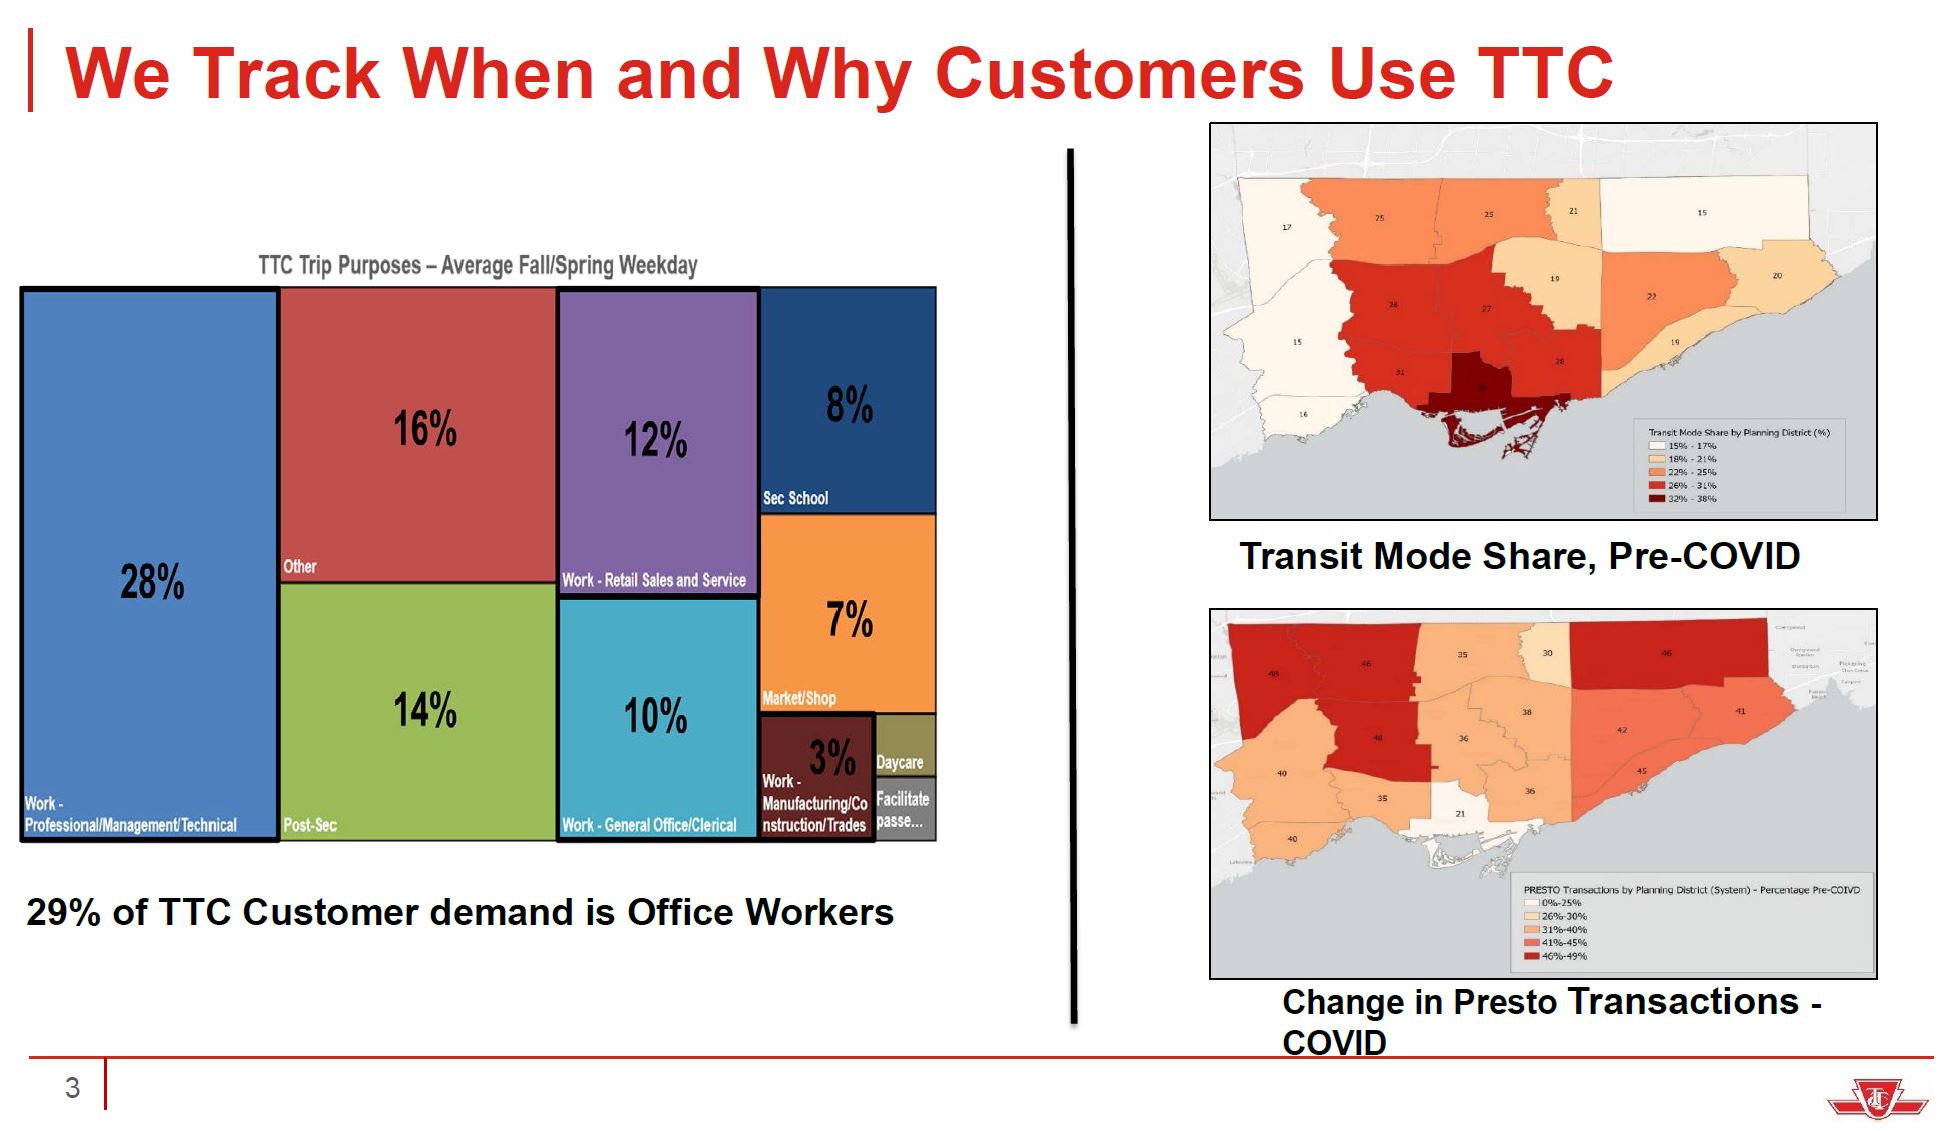
TTC Staff presented an overview of ridership trends and projections looking ahead to 2022 and 2023. An important part of looking ahead is understanding where the TTC was in pre-pandemic times. A great deal of planning and political effort focuses on commuters, especially those headed to the core area, but they are only part of the overall travel demand served by transit.
The chart on the left below shows the purpose of transit trips. Just over half, are work trips with a breakdown of:
28% “professional, managerial, technical” (a group most likely to embrace work-from home),
12% retail sales and service,
10% general office and clerical, and
3% manufacturing and construction.
This breakdown will also reflect the job locations and the relative ease of travel to them by TTC. What is not shown is the mode share for each group, something that would have to be further subdivided geographically. The overall mode share was, to no surprise, concentrated downtown, and it falls off to the outer suburbs.
The map flips when charting the change in Presto usage (a surrogate for trip counts) in the pandemic era. The greatest retention of riders occurs in the locations where overall transit mode share was low showing that these riders have much less choice in whether to travel by transit. By extension, demand in these areas did not fall as much as downtown, and compounded by service cuts, even a reduced demand could produce crowding.
Planned service changes taking effect on Thanksgiving weekend include improvements on many routes and new or restored services on express bus routes. Construction on the 501 Queen route will continue to disrupt service there until year-end.
There are no subway service changes in October because Lines 1 and 2 are operating with a transitional combination of scheduled, gap and extra trains while the TTC determines how strongly ridership returns. See How Much Has Subway Service Improved? (II) for details.
Updated September 24, 2021 at 6:15 pm: Planned construction work at WIlson Station and at Kipling/Lake Shore has been deferred.
Express Bus Changes
Several routes will have new or expanded express service. Where this happens, service on the local branch will be reduced, but the combined express and local services will improve over existing local-only schedules.
The affected routes are:
929 Dufferin Express: Sunday morning and afternoon service added.
943 Kennedy Express: New peak period service between Kennedy Station and Steeles.
Northbound stops: Kennedy Station, Lawrence Avenue East, Ellesmere Road, Progress Avenue, Antrim Crescent, Village Green Square, Sheppard Avenue East, Finch Avenue East, McNicoll Avenue, Steeles Avenue East, Midland Avenue.
Southbound stops: Midland Avenue, McNicoll Avenue, Finch Avenue East, Sheppard Avenue East, Village Green Square, Antrim Crescent, Glamorgan Avenue, Ellesmere Road, Lawrence Avenue East, Kennedy Station.
953 Steeles East Express: Service to Staines Road will be added weekday midday and early evening, and on weekends during the morning and afternoon. Service will run via Yonge and Steeles rather than the route via Bayview used by the PM peak express buses.
960 Steeles West Express: Service to HIghway 27 added on weekend mornings and afternoons.
968 Warden Express: New peak period service between Warden Station and Steeles.
A few routes will have minor changes to improve on-time performance:
900 Airport Express
937 Islington Express
501 Queen Restructuring for Construction
This route will be affected by several new and ongoing construction projects. Working from west to east:
The approach to Long Branch Loop westbound will be rebuilt including a queue jump lane to aid streetcars entering and leaving the loop, revised signalling and improvements for pedestrian safety.
The intersection at Kipling and Lake Shore, as well as Kipling Loop will be rebuilt. This will require a diversion of the 501L Queen and 44/944 Kipling South service with dates and routing details to be announced.Deferred with no new scheduled date.
The King-Queen-Queensway-Roncesvalles project is, as I write this on September 9, stalled due to Toronto Hydro problems. The date for a move to “Phase 2” with through running across Queen and closure of King Street east of the intersection has not been announced. The “Phase 1” routings will continue operation in the meantime.
In October, the west end of the Bay-to-Fennings reconstruction project will begin working east from Fennings (east of Dovercourt). This project includes replacement of the intersection at Shaw Street on dates to be announced.
The central Queen diversion of service via King to Charlotte Loop will continue until year-end rather than having streetcar service revert to McCaul Loop in October. Overhead conversion work is not yet complete for pantograph operation on this portion of the route. In January, streetcar service will return to Queen, but will operate only to Wolseley Loop at Bathurst Street because the KQQR project will not be completed.
Service east of Russell Carhouse (effectively from Greenwood) on Queen to Neville Loop will be converted to bus operation during overhead conversion for pantographs. Initially streetcars will turn back from the carhouse while a 501N Queen bus operates from Neville to Lake Shore Garage (at Commissioners and Leslie) as a replacement service. In November, the TTC expects overhead conversion for pantographs will be complete far enough east that streetcars can operate through to Woodbine Loop, and the 501N will operate west only to Coxwell. This arrangement implies that 501 Queen will convert to pantograph operation.
503 Kingston Road cars will continue to operate using trolley poles as the overhead on Queen will be in hybrid format. The date for pantograph conversion on Kingston Road has not been announced.
301 night service will be provided by buses over the entire route to provide a transfer-free trip.
The nomenclature for various parts of the Queen route will be:
501L to Long Branch westbound
501H to Humber westbound
501B to Broadview eastbound
501N between Commissioners and Neville, later between Coxwell and Neville
Route 69 Warden South
The naming of the two directions of service will change for consistency with other looping routes. Route 69A will operate clockwise while 69B will operate counterclockwise. This is the reverse of the current arrangement.
Route 70B O’Connor Replaced By Full Time 70A Service
The northern branch of 70 O’Connor will operate as 70A to Eglinton during all hours rather than looping at Eglinton Square as 70B on weekday late evenings and Sundays.
Route 95A York Mills Extended
The 95A service that now operates to Kingston Road & Ellesmere will be extended to Sheppard Avenue & Port Union Road.
Revised 121 Esplanade-River Route
Route 121 Fort York-Esplanade will be renamed as Esplanade-River in line with a substantial change to the route.
The route will operate between Bay & Front Streets and Broadview & Gerrard (see map below).
The seasonal service to Ontario Place and 121 service west of Bay Street generally will be discontinued.
The seasonal service to Cherry Beach will end. Service for 2022 will be announced as part of the upcoming Service Plan.
Service will improve noticeably on weekday daytimes because the extended travel time and headways for congestion between Union Station and the Exhibition will no longer be required.
Other Seasonal Changes
Service to the Toronto Zoo will be cut back because of the reduced hours there over the fall and winter.
The 175 Bluffer’s Park bus will end for the season with the last day of service being Thanksgiving Monday, October 11.
Other Construction Changes
The interline between 28 Bayview South and 14 Glencairn will end because the bus loop at Davisville Station will reopen. At the same time, the schedules of the two branches of 97 Yonge will be modified to improve vehicle utilization during some periods.
The lower level of Wilson Station bus loop will close for repairs until some time in 2022. During construction, a temporary bus loop will be used in a corner of the parking lot east of the north end of the station. The following routes will be diverted to that loop: 29 Dufferin, 929 Dufferin Express, 104 Faywood, 160 Bathurst North.This project has been deferred to the November schedule change.
Service Improvements
Weekday service improvements are planned for 14 Glencairn, 24 Victoria Park, 32 Eglinton West, 34 Eglinton East, 43 Kennedy, and 88 South Leaside. Weekend service will improve on 68 Warden.
Adjustments for Reliability
Schedules will be adjusted on several routes to improve reliability. When this program began a few years ago, the typical adjustments involved longer travel times and, in some cases, less frequent service to compensate. Now, the TTC is trimming some travel times in recognition that they are excessive causing extended layovers and unreliable departure times at terminals.
Running times in some periods have been reduced and service improved on:
20 Cliffside
22 Coxwell
23 Dawes
51 Leslie
56 Leaside
113 Danforth
900 Airport Express
937 Islington Express
Running times are increased and service will be less frequent on:
30 High Park
69 Warden South
Other changes:
8 Broadview: Running time has been changed to terminal layover time during most periods, but headways remain at 30′ except late evenings when they will be 20′.
53 Steeles East: This route is affected by changes in the 953 express service, but running times for the local service in some periods have been reduced.
59 Maple Leaf: Running time has been changed to terminal layover time during many periods, but off-peak headways remain at 60 minutes on each branch.
68 Warden: This route is affected by the new 968 express service in peak periods. Running times for the local service in some periods have been reduced.
73 Royal York: PM peak and early evening service rebalanced between La Rose and Albion Road branches.
97 Yonge: Running times and the interline arrangements between branches have been adjusted during some periods. Peak period service will improve, but off peak service remains half-hourly on both branches.
The Details
Details of existing and planned services are in the spreadsheet linked below.
Recently I wrote about the discrepancy between the TTC’s claimed improvement in subway service for September and the information available in various sources. See How Much Has Subway Service Improved?
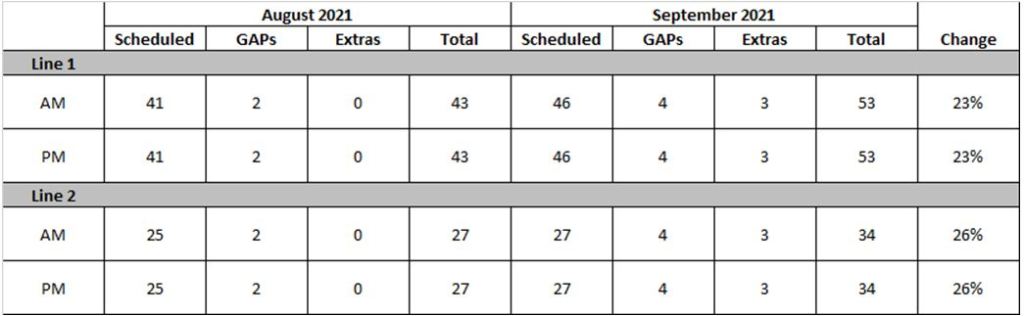
The TTC has provided an update on their service for the next few months as shown in the table below.
Source: Email from Mark Mis, Head of TTC Service Planning, September 9, 2021
The discrepancy between previously available figures and the claimed level of increase arises from various factors:
In addition to scheduled service and “gap trains”, the TTC will operate three extra trains on each of lines 1 and 2.
The City and TTC statements about percentage increase are based on the number of trains, not the capacity of scheduled service.
On Line 1, two of the additional trains are used to extend the scheduled travel times.
On both lines, there are five more unscheduled trains (gap trains and extras) in September than in August.
The TTC advises that this arrangement will last through the September and October schedule periods (which run through mid November) as they determine the level of subway demand and appropriate level of scheduled service.
Extra trains are deployed by operations. This provides the flexibility to adjust the number and time of these trains and crews outside of the normal board period window. The extra trains on the subway are being deployed by operations starting this week on a regular basis to coincide with back to school.
We took this approach for the September + October board periods because we want to see how our estimated demand projection compares to actual demand.
We will be reviewing ridership numbers over September before making a final decision on the number of GAP trains and extra trains on Line 1 and Line 2 for the November board period.
Source: Email from Mark Mis, Head of TTC Service Planning, September 9, 2021
The effect on actual service should appear in stats included in the CEO’s report showing the ratio of actual to scheduled trains/hour at peak points. With 7 unscheduled trains, the actual service operated should be well above the scheduled level, and this metric would show how these trains affect capacity at key locations.
Fact check on a City of Toronto press release: “To accommodate increased demand in September, the TTC is increasing service system-wide to support the expected increase in ridership, including 25 per cent more subway trains on Line 1 and Line 2 at peak times on weekdays…”
2. The actual change in peak services are: Line 1 peaks were every 3’45”, now every 3’30”. Line 2 changes from every 4′ to 3’45” during peak periods. Count of scheduled trains goes up partly due to more gap trains (spares), longer Line 1 travel time, and more frequent service.
3. Change in capacity is about 7%, not 25%. The number of trains changes from 43 to 50 on Line 1 (+16%), and from 27 to 31 on Line 2 (15%). Capacity is driven by trains/hour past a point, not by total train count.
4. The press release overstates the actual change in subway capacity during peak periods.
5. Early evening service is improving substantially. Line 1 from every 5′ to 3’30” (43%), Line 2 from 7’15” to 6′ (21%). Late evening Line 1 from 7′ to 5′ (40%), same change as early evening on Line 2.
6/6 Why are the City and TTC overstating the peak improvements?
TTC’s Stuart Green replied somewhat later in the day:
Oh, Steve. Looks like I have to interrupt my vacation to correct you. Ten trains more. 43 in August 53 in Sept. (some additional trains added last minute based on demand expectations). 23.25 per cent. We rounded to 25 based on commonly accepted rounding practices.
The problem is that available TTC information, on which I based my claims, says nothing about those extra trains, but matches what I have published here and written on Twitter.
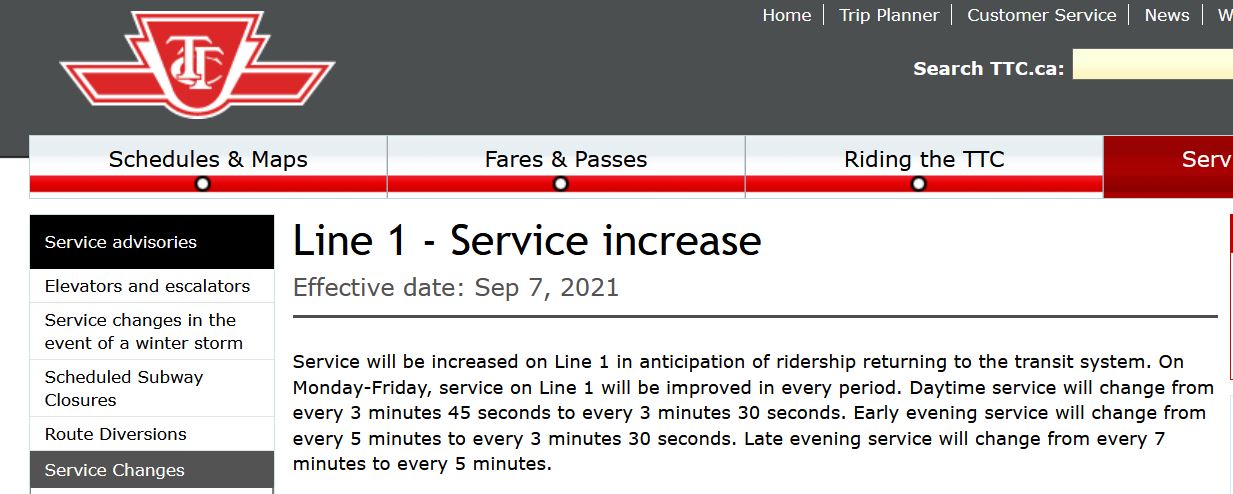
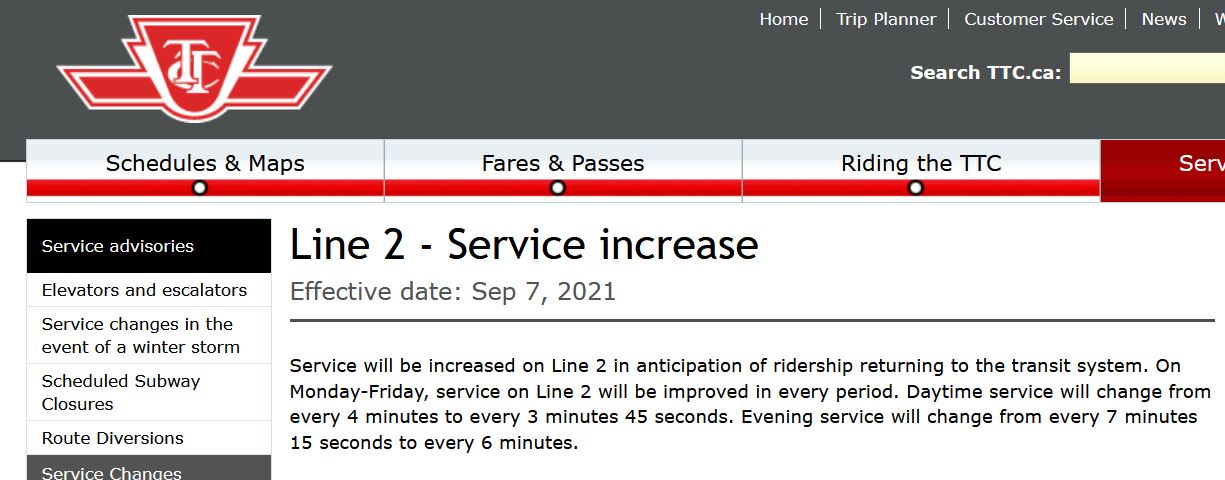
Source: TTC Website copied September 7, 2021Source: TTC Website copied September 7, 2021
Another source of scheduled service information is the electronic version of schedules that are published on the City of Toronto’s Open Data site by the TTC. Without going into the mechanics of reading these, they clearly show the 3’30” and 3’45” headways advertised above for Lines 1 and 2 respectively.
This information also corresponds to what is stated in the Board Period Memo issued by Service Planning on August 13 (this memo is the basis for my regular previews of service changes).
Service will be restored on Line 1 in anticipation of ridership returning to the transit system. On Monday-Friday, service on Line 1 will be restored to January 2021 service levels, with two additional gap trains for demand responsive service (increasing to four gap trains).
…
Service will be restored on Line 2 in anticipation of ridership returning to the transit system. On Monday-Friday, service on Line 2 will be restored to January 2021 service levels, with two additional gap trains for demand responsive service (increasing to four gap trains).
TTC Board Period Memo issued August 13, 2021
Note that restoration is to January 2021, not 2020 or pre-pandemic levels.
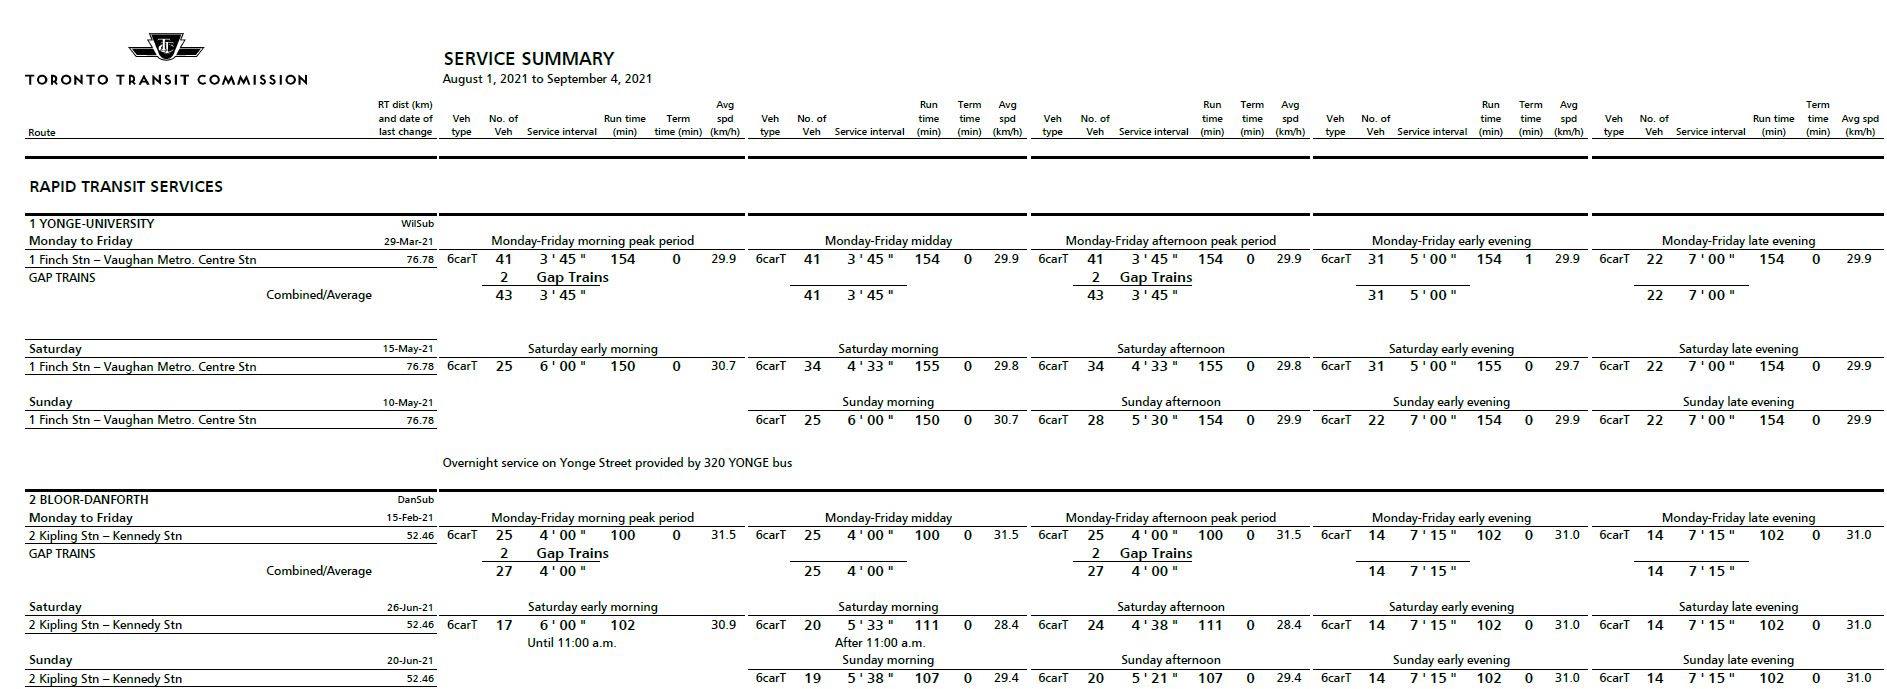
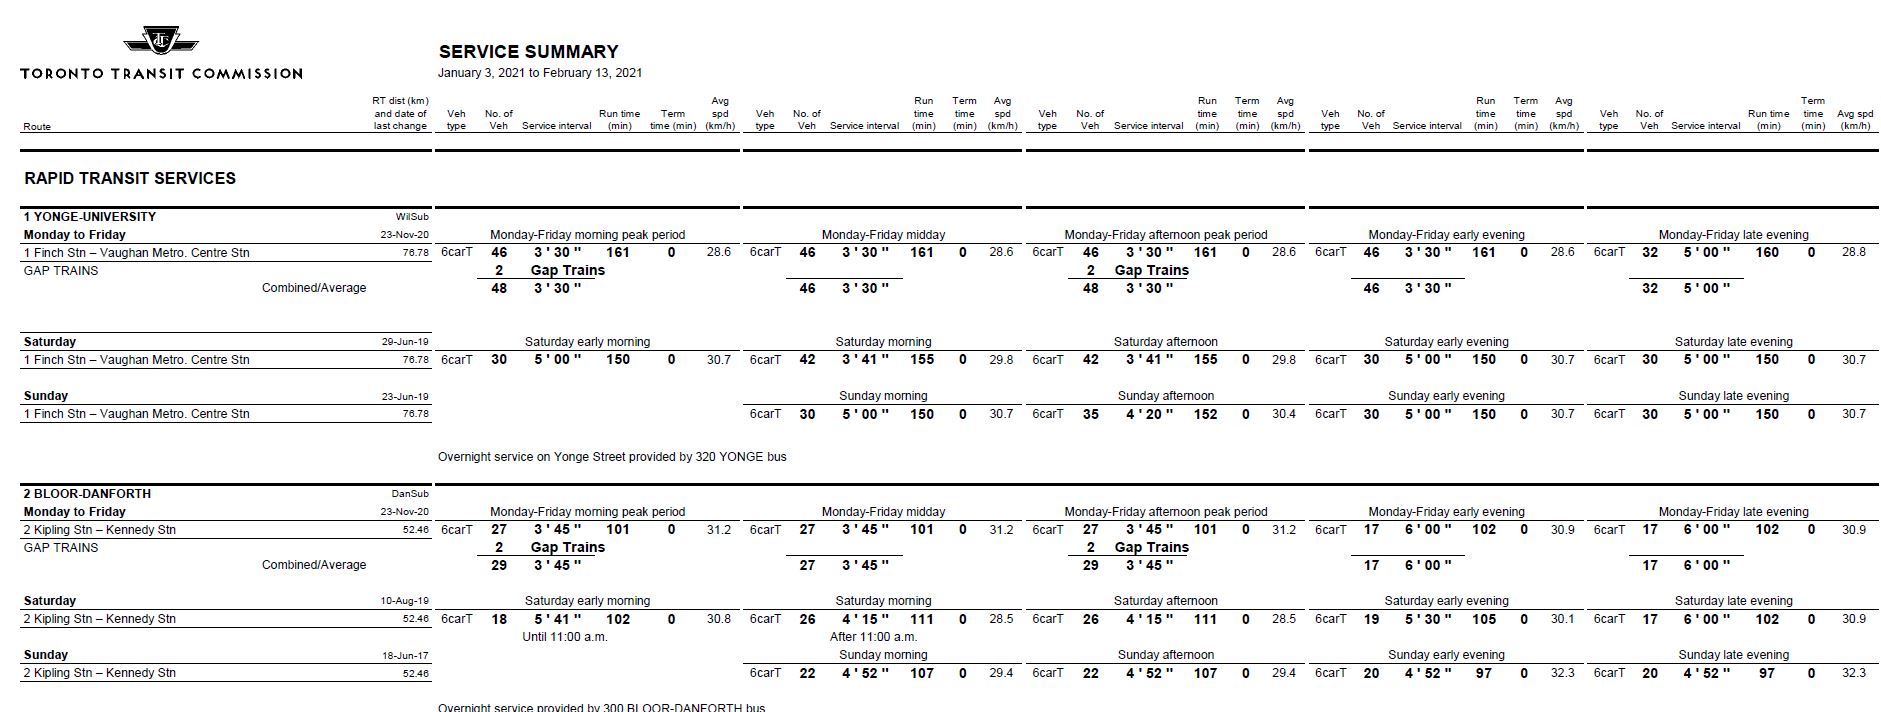
Below are excerpts from the TTC’s Scheduled Service Summaries for August and January 2021. Note that the round trip time for Line 1 is 161 minutes in January, but only 154 minutes in August. Some of the “restored” trains simply go to extending the trip time, not to providing more capacity. On Line 2, the round trip times are almost identical (101 vs 100 minutes).
Every source I have for info on how much service is running says that there is a smaller percentage increase than the press release claims.
Moreover, the press release uses the change in train count as an implication of a capacity increase greater than is actually provided.
This distortion arises from various factors:
Of the seven trains added to the Line 1 schedule, 2 are gap trains that are inserted where needed on the line. They may or may not add to the total service provided depending on where and when they are used.
Changing the scheduled headway from 3’45” (225 seconds) to 3’30” (210 seconds) would require 3 additional trains if the travel time were not changed. Providing extra travel time requires two more trains.
The TTC says that they have added three more trains above the scheduled level (49 versus 46 regular trains). If these are integrated into the schedule, the headway would fall to 3’17” rather than 3’30”. This is still only a 14% increase in capacity versus the August schedule of 3’45”.
The rounding used by the TTC from 23.25 to 25% is equivalent to almost an entire train. This is not a trivial rounding error.
A 25% increase in the number of trains does not translate to a 25% increase in service capacity because four of the additional trains are added as gap fillers or to stretch the scheduled travel time.
The press release states that this is applicable to both Lines 1 and 2. If extra trains above the scheduled level on Line 2 were also added, the TTC has been silent on the details as I write this.
Between extra trains the TTC has added and counting trains in service rather than trains/hour past a point, the press release claim of 25% more trains is correct on its own terms. However, it gives the impression of a greater increase in service capacity than what is actually provided.
This is a subtle but important difference. Tempered by accepting that the TTC has added three more trains to Line 1 service than shown in previously published information, I stand by my statement that the City’s press release exaggerates the degree of service improvement.
From time to time, someone will tweet a complaint to @TTCHelps about a very long wait for a bus and copy me into the thread. This can set off an exchange which, to be diplomatic, can involve varying claims about what is actually happening.
For as long as anyone can remember, the TTC has a standard response to such complaints: that traffic congestion or some other transient event beyond their control is responsible. More recently a few new lines have been added to their repertoire including:
Due to inadequacies in the schedule, buses cannot stay on time, but this will all be fixed in a coming revision.
There are “run as directed” buses which are used to fill gaps in service and respond to problems of overcrowding. These buses are far less numerous than some at the TTC have claimed, and they are completely invisible to service tracking apps.
Riders concerned about crowding can refer to transit monitoring apps to see if an uncrowded bus is coming down the route. Of course if you’re on a streetcar, they don’t have passenger counters and there is no online crowding info for them, in spite of ads for this service up and down Spadina Avenue.
On top of this, the TTC produces monthly on time performance stats that purport to show that, overall, things are not too bad. They have “service standards” about what constitutes an appropriate quality of service, and they hit them to some degree some of the time, on average.
This is a long-standing response of “not our problem”, backed up by “we will fix the schedule eventually”, “we are meeting our standards most of the time”, and “riders can find uncrowded buses, so what’s the problem anyhow”.
This is cold comfort to riders waiting for service.
Problems of irregular service and crowding on the TTC predate the pandemic, and were starting to attract attention by the politicians who claim to set policy and could not square complaints from riders and constituents with management reports. Then the world changed.
But the world is trying to change back, and with it the desire for transit service to actually attract riders. The time is overdue for attention to quality of service as a basic marketing tool. A shop window does not attract customers with a photos of products that might arrive soon, maybe.
Bathurst Bus Scheduled Service
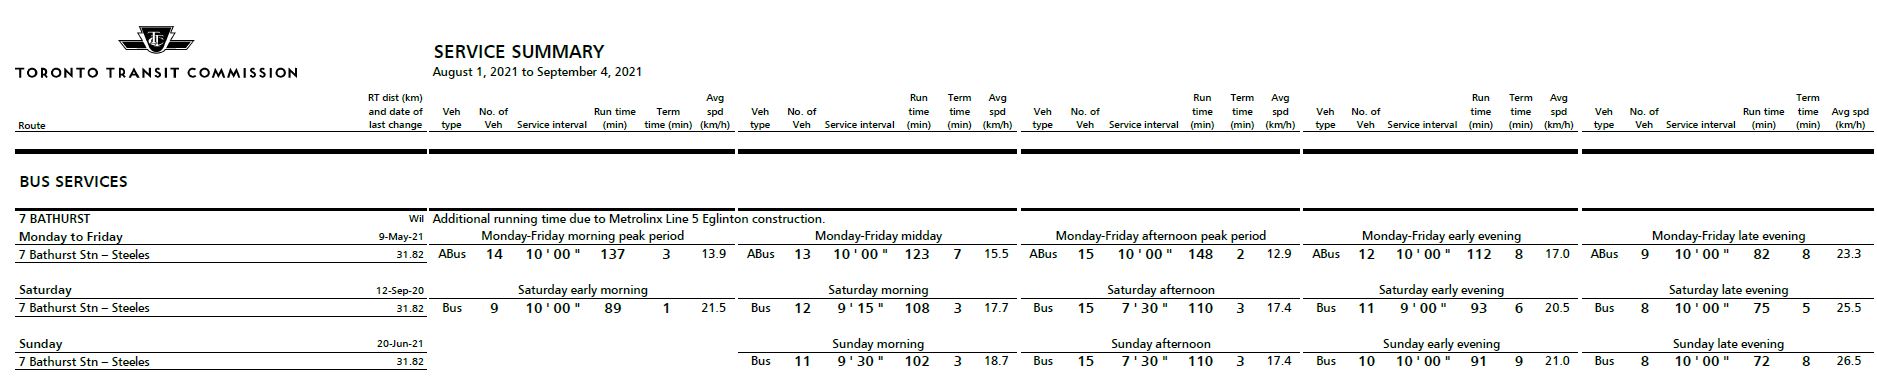
In January 2021, weekday service on 7 Bathurst changed from regular-sized to articulated buses (12m to 18m), and the January 2019 schedule was restored. As we will see later, there are still several 12m buses running on Bathurst, but on schedules that assume 18m capacity.
In May 2021, peak period service was trimmed in response to actual demand, and the service in effect until Friday, September 3, was to operate every 10 minutes throughout the day (see table below). Note that the schedule includes an allowance for construction of Forest Hill Station on Line 5, but actual operating data charted later in this article shows that this is no longer a source of delay.
The January schedule with slightly more frequent service will return on Tuesday, September 7 as part of the TTC’s overall restoration of service.
On Friday afternoon, September 3, 2021, a tweet popped up asking the perennial question “where’s my bus” from a rider waiting at Glencairn and Bathurst. The 7 Bathurst is a notoriously unreliable service even though, irony of ironies, it serves the TTC’s Hillcrest complex.
This article completes my analysis of corridors where RapidTO “red lanes” have been installed or proposed to speed bus operations. Previous articles in the series are:
This article reviews travel times and headway reliability (the intervals between buses) primarily through the pandemic era to July 2021 with April 2018 data as a pre-pandemic reference.
The High Points
The reduction in travel times on Lawrence East from mid-March onward was smaller than on some other routes, and this was confined to certain areas and directions. This implies that red lanes would not offer much change during many periods over the route from Don Mills to Starspray as proposed.
A further problem lies in the infrequent service particularly east of the 54B Orton Park scheduled turnback beyond which only half of the scheduled service (plus peak-only express buses) operates. A fully reserved lane is hard to justify if it will not substantially affect travel times and if only a few buses per hour actually use it.
The segment west of Victoria Park includes the DVP interchange where integration of red lanes would be difficult. The time saving from March 2020 onward is small or nil for most of the day.
By far the worst problem on the 54/954 Lawrence East service is headway reliability, and unpredictable gaps in service can contribute far more to journey times than any saving that might arise from reserved lanes. Service leaving Lawrence East Station both ways is very erratic even though this would be a logical place to space service.
The route is subject to congestion and construction delays along Eglinton from Leslie to Yonge, although the schedule is supposed to include extra time to compensate.
Headways inbound from eastern Scarborough are disorganized both at the very outer end, and west of the point where the 54B service merges in. The express service operates on wide-ranging headways to the extent that waiting for the next one to show up could add more to a trip than the time saved by “express” operation.
Average headways on a daily and weekly basis generally follow scheduled values indicating that most or all service is present, and the wide gaps cannot be explained by missing or untracked vehicles.
Updated August 26, 2021 at 3:00 pm: The TTC has advised that the planned implementation of the 128 Stanley Greene bus has been deferred, contrary to information in the CEO’s Report. See the discussion under the 2021 Service Plan heading for more information.
Although there is no TTC Board meeting in August, the monthly CEO’s Report provides an update on TTC operations. Here are some points of interest and clarifications from the TTC on questions I sent about the report.
This article looks at ridership trends, the 2021 Service Plan status, service reliability and vehicle reliability.
Ridership, Revenue and Crowding
As Toronto reopens, ridership has started to grow, and as of the start of July had surpassed the level of early April when the stay-at-home order choked off the last attempted restart. The system as a whole reached 35 per cent of pre-covid levels. Buses still have the most boardings (44 per cent of pre-covid), but growth is stronger on the subway and streetcar networks in recent weeks. The TTC expects that this trend will continue through the summer and fall as in-person participation in school, office and other activities picks up.
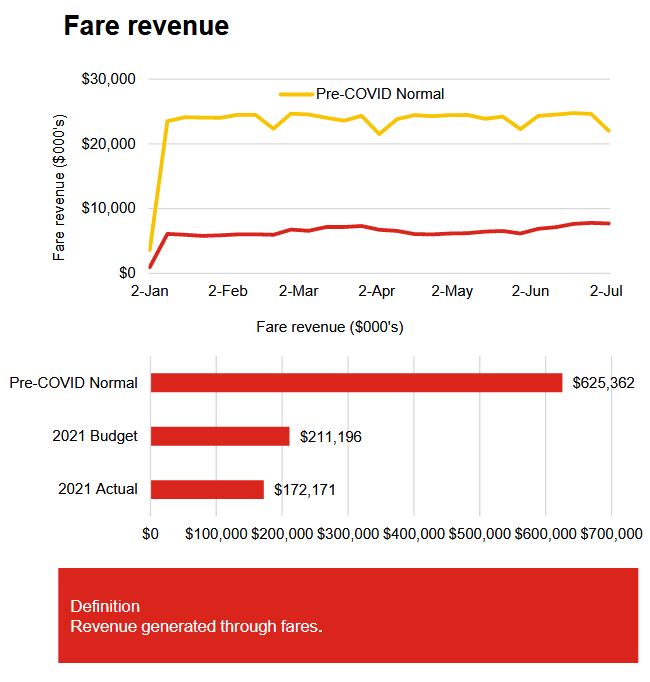
Fare revenue is running well below historical levels thanks to the low ridership, and is also below the budgeted level because a stronger recovery was forecast in late 2020 when the budget projections were struck. The shortfall is part of the overall budgetary gap that the City faces in 2021 with pandemic-related costs.
As ridership picks up, so will bus crowding although the effect varies by route, location and time-of-day. The TTC does not break out this information in detail, but the data below show a clear trend into early July. An important consideration here is that the TTC’s recovery plan allows for greater crowding once the overall level of ridership crests 50 percent of historic values.
There simply are not enough buses and streetcars to accommodate twice the current riding level (i.e. a return to about 70 per cent overall) at current crowding levels. That said, the TTC’s fleet is substantially larger than its day-to-day requirement including provision for service and maintenance spares. There is room for growth in the total service operated provided that a way is found to pay for it. This will be an important issue going into the 2022 budget discussions.
In the chart below it is important to remember that these are all-day, all-system numbers. Many trips that are counter-peak, or offpeak, or on routes that tend not to accumulate large numbers of riders, are included in the total. A figure of 7 percent may not look like much, but the value is diluted by counting many trips that would never be crowded anyhow.
The issue, which the TTC does not report, is the proportion of trips on busy routes and times that are crowded. This results in a disconnect between rider complaints and reported average crowding levels. A basic aspect of transit is that when loads are not even, more people are riding on crowded buses than those that are nearly empty. The perceived level of crowding will always be higher than the average, but riders cannot board an “average” bus trip especially if that trip occurs on a route or at a time when they do not travel. Such is the inherent problem of reporting average values.
This article continues my analysis of corridors where RapidTO “red lanes” have been installed or proposed to speed bus operations. Previous articles in the series are:
This article reviews travel times and headway reliability (the intervals between buses) primarily through the pandemic era to July 2021 with April 2018 data as a pre-pandemic reference.
The High Points
Finch Avenue East is a corridor with a considerable amount of service through the combination of several express and local branches. Service will improve on weekends starting in September with the reintroduction of express service, but that is beyond the scope of this analysis.
As on many routes, travel times fell in March 2020 with the onset of the pandemic shutdown, the drop in road traffic and a big drop in transit demand. Through March, the travel time pattern changed from a pre-pandemic character with traditional peaks to an almost flat travel time value all day long. This drop, corresponding to a condition with little interference from traffic, probably represents a “best case” of the improvement that a transit priority lane can bring to Finch Avenue East.
This effect was primarily on weekdays on Finch with a smaller drop on weekends. The AM peak completely disappeared, and the PM peak has only re-emerged in recent months.
Travel times are climbing through 2021 and are in some cases back to pre-pandemic values, although not during peak periods.
Speed profiles for the local and express services based on the second and third weeks of July 2021 differ somewhat, but not as much as on other routes. However, a speed profile indicates how fast buses are moving when they are moving, and a stopped bus only counts as a “zero” once regardless of how long it sits serving passengers or waiting for a traffic signal.
Average speeds for buses at some times and locations on Finch exceed the posted 50 kph speed limit. This is no surprise to anyone familiar with suburban traffic patterns. Whether this will persist as traffic volumes build remains to be seen.
As in many of these route analyses, the weak point is headway reliability. All the speed in the world is of little benefit if a bus does not show up reliably and regularly. This can be compounded by vehicle crowding when buses are running in packs rather than on an even spacing.
The article includes charts of headways (the time between buses) in the first week of July 2021, a period when conditions were about as favourable as we will see for weather and the level of demand. At several points on the route, both the local and express service headways can vary quite widely with large gaps and groups of buses travelling together.
The average headways are close to the scheduled values indicating that all of the scheduled trips were operated. The problem simply was that they were not reliably spaced. This problem exists during all operating periods and on weekends, not just weekdays.
In response to complaints about unreliable service and crowding, the TTC routinely talks about buses that are on standby ready to fill in for overcrowded routes and emergencies. It is common to hear statements such as:
… we have 120 -140 buses each day to adjust service where and when possible to increase ridership levels …
This statement is not true.
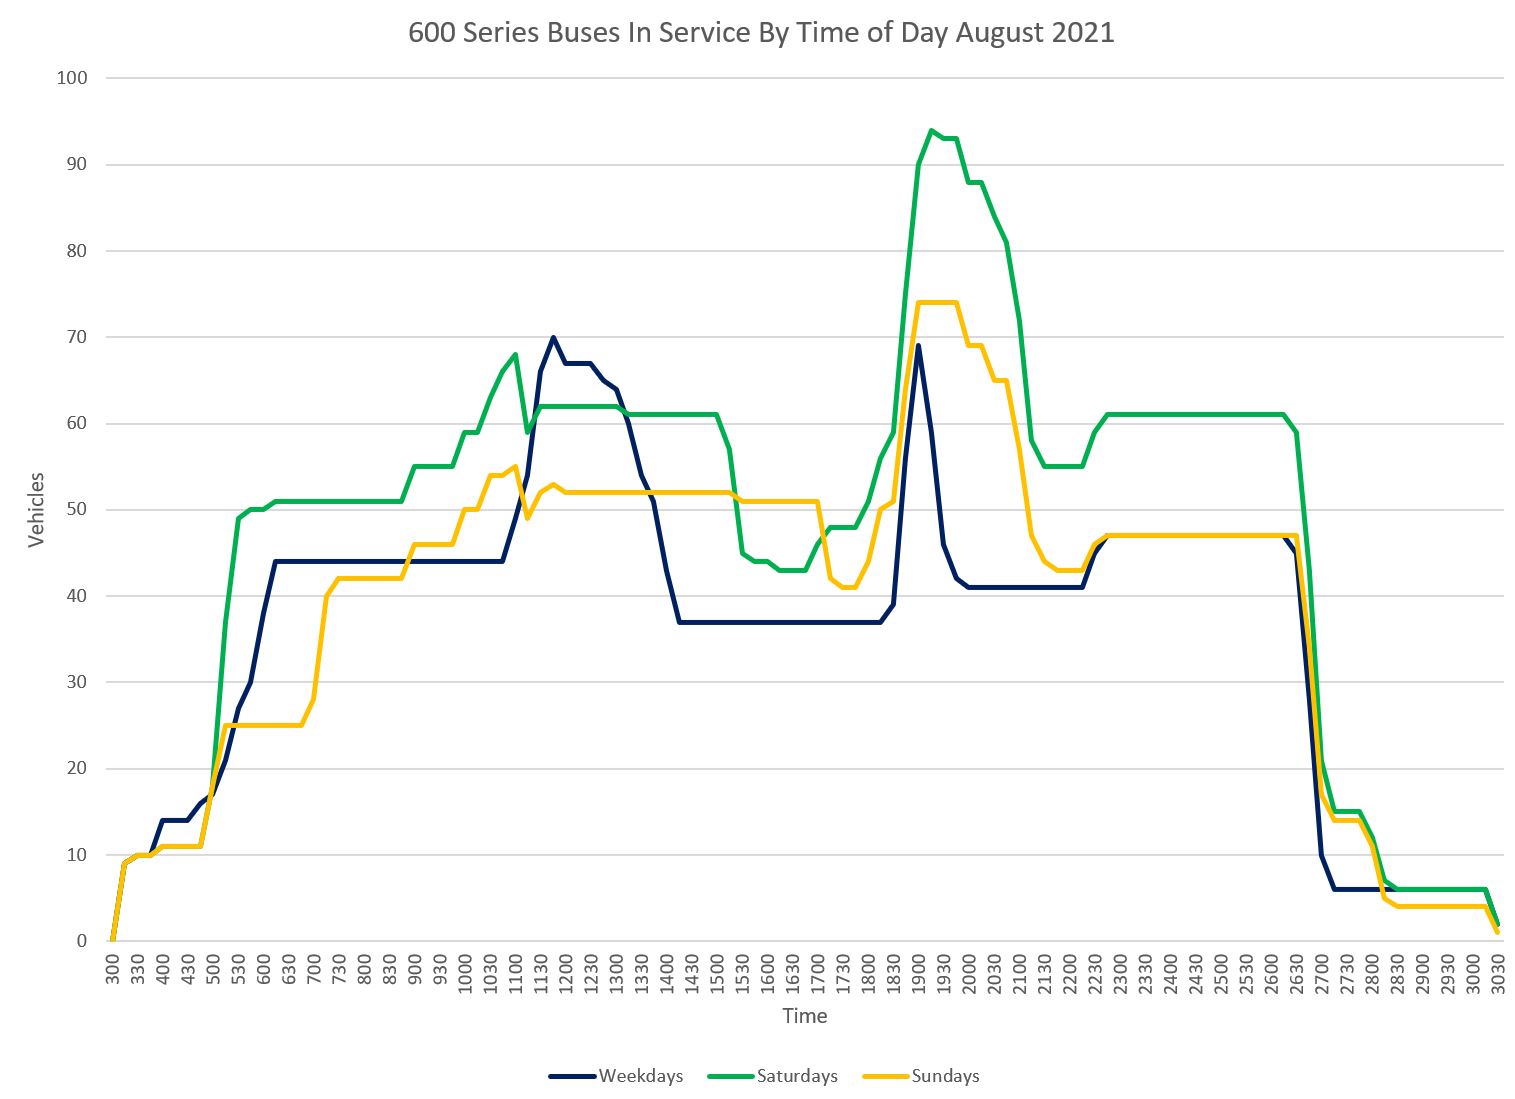
What the TTC does have is 120-140 crews for standby buses, but these are not all in service at the same time. They are spread broadly across three shifts as the chart below shows. (The actual counts for August 2021 are 128 crews on weekdays, 155 on Saturdays and 124 on Sundays.)
[Chart methodology: The source data are in the TTC’s run guides for the August schedule period. These show the start and end times for each bus. For charting, the day is divided into quarter-hours, and a crew is counted if it overlaps an interval, even if it is only just starting or ending. For example, a crew from 8:10 am to 4:10 pm counts in the quarter hours from 8:00 to 4:00. Most crews are 8 hours long, but some on weekends are 10 hours long, and there is one oddball that is 8.5 hours.]
The peaks in the chart are caused by overlaps between shifts so that there is no gap while one shift of buses returns to their garages and another enters service.
The first crews report just after 3 am, and the last ones come back after 6 am the following day (times after midnight are shows as hours 24 to 30 in the chart legend). The build-up is a bit slower on Sunday reflecting the later start of service on many routes.
Realistically, the maximum number of “Run As Directed” (aka “RAD”) buses, also known by their internal route number “600”, is represented by the horizontal segments of the chart. For the weekday AM peak period, this means that there are 44 buses waiting for the call to action, not 140.
This is an important distinction on a network where the peak number of buses in service is about 1,500. The RADs provide a buffer of about 3 per cent. This buffer is proportionately larger off peak and on weekends because there is less scheduled service (about 1,000 buses on Saturday and 900 on Sunday).
On weekends and some late evening periods, these buses fulfill the original mandate of “route 600” as subway shuttles. They were originally set up to ensure that there would be staff pre-assigned to work on those shuttles rather than depending entirely on voluntary overtime where operator availability is strongly influenced by the weather. However, if they are running as replacement service for the subway, they are not available to fill gaps on other routes.
The actual usage of the RAD buses is very difficult to determine. They are not tracked by apps such as NextBus and Rocketman because they do not appear in the TTC data feed. Even if they did, they might not be “signed on” to the route they are serving, and there is no schedule against which their operation can be predicted. (NextBus depends on a bus having a schedule in order to make its arrival predictions. The NextBus feed is used by many other apps.)
I have attempted to extract the RAD buses from “full dump” samples of TTC tracking data (rather than route-based extracts), and they are hard to find. Some of them spend much time not going anywhere as one might expect from a bus on standby.
The TTC does not report on the actual usage of the RAD buses, but routinely invokes their existence to explain it is “doing something” about crowding. Some riders might disagree.