
The TTC Board met on September 15 and, among other things, considered a report and two presentations that touch on ridership:
- CEO’s Report for September 2021
- Ridership Today….and Tomorrow (Staff Presentation)
- StudentMoveTO Moving Post-Secondary Students in the GTHA: Preliminary results from a survey and study on student mobility in the Toronto Region (An invited presentation by Roger Keil of York University and Danya Tugg of Ryerson University)
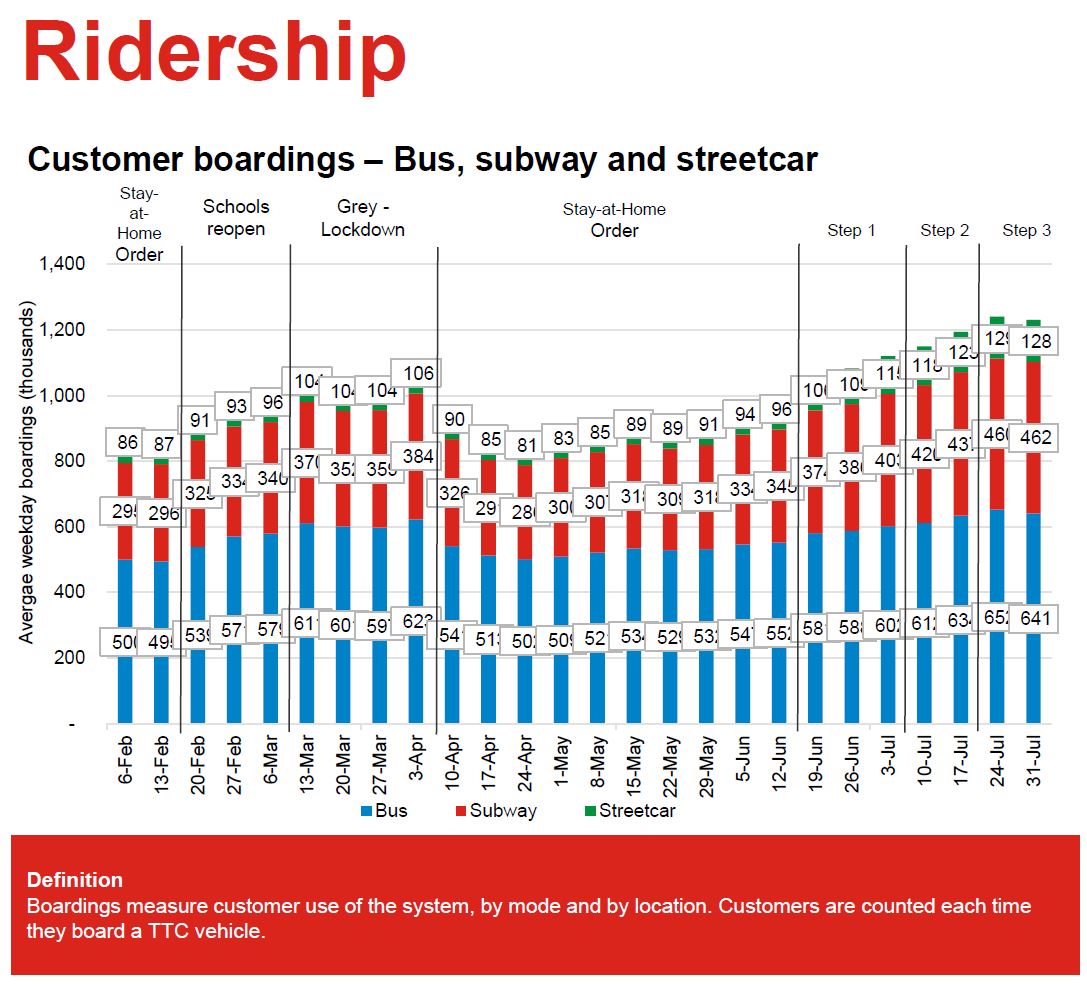
Ridership is growing slowly on the TTC with the largest changes, proportionally speaking, coming on the streetcar and subway systems that serve downtown. These modes are now at 31 and 37 percent respectively of pre-covid levels while the bus system is at 46 per cent as of July 31, 2021.
TTC Staff presented an overview of ridership trends and projections looking ahead to 2022 and 2023. An important part of looking ahead is understanding where the TTC was in pre-pandemic times. A great deal of planning and political effort focuses on commuters, especially those headed to the core area, but they are only part of the overall travel demand served by transit.
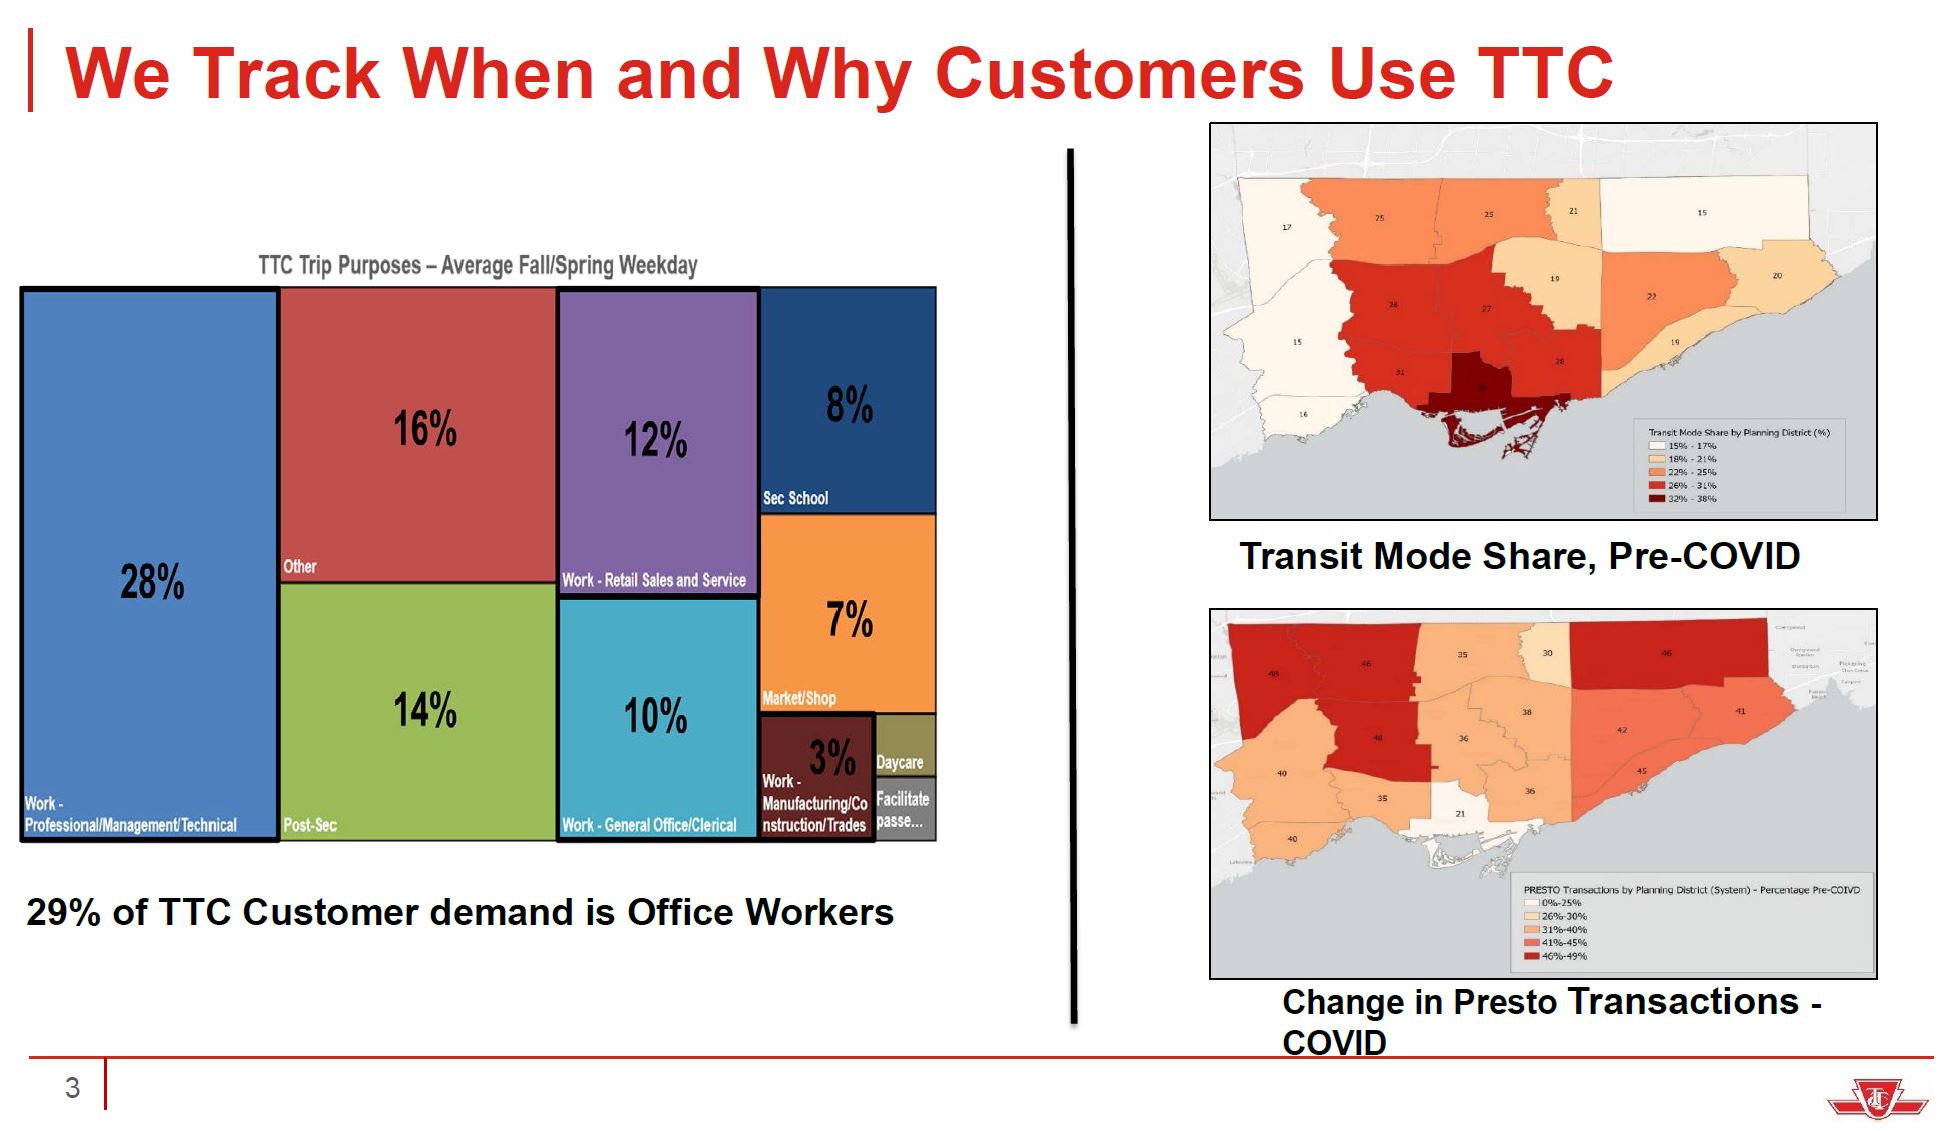
The chart on the left below shows the purpose of transit trips. Just over half, are work trips with a breakdown of:
- 28% “professional, managerial, technical” (a group most likely to embrace work-from home),
- 12% retail sales and service,
- 10% general office and clerical, and
- 3% manufacturing and construction.
This breakdown will also reflect the job locations and the relative ease of travel to them by TTC. What is not shown is the mode share for each group, something that would have to be further subdivided geographically. The overall mode share was, to no surprise, concentrated downtown, and it falls off to the outer suburbs.
The map flips when charting the change in Presto usage (a surrogate for trip counts) in the pandemic era. The greatest retention of riders occurs in the locations where overall transit mode share was low showing that these riders have much less choice in whether to travel by transit. By extension, demand in these areas did not fall as much as downtown, and compounded by service cuts, even a reduced demand could produce crowding.
The TTC estimates that its reduced demand comes from several effects as illustrated in the “waterfall chart” below. The single largest drop comes from reduced office commuting that sliced 25% off of demand, and a further 10% came from a decline of in-person post-secondary instruction. Loss of transit mode share accounted for a further 10% with other factors contributing smaller amounts.

These two charts illustrate that ridership recovery, although dependent for a large chunk on a return of office workers and post-secondary students, will be affected by other factors. Moreover, these returns will not be uniform across the city and areas where transit is less attractive could have a harder time winning back their riders.
On a broad basis, here is how the TTC foresees its recovery.

Another way of looking at this is a chart of possible future demand. In this chart, the blue upper line is an optimistic view where most recovery is complete by the end of 2022 followed by slow growth in 2023. The green lower line is a more pessimistic view with recovery taking until the end of 2023 and, worst case, only getting back to 81% of former levels even then.
The yellow band shows a common area for the two projections, and this is where TTC hopes and expects demand will fall. That band is up to 10% wide, and considering that the TTC agonizes over single digit percentage changes in fare revenue at budget time, the future is uncertain. In particular, the TTC will not be able to predict ridership at a fine-grained level in fall 2021 for a budget stretching through 2022, and they will be in the same situation a year out for 2023.

The work-from-home issue affects both total demand projections and the return, or not, of “peak” conditions on the system. There are big advantages of a smaller peak in that staff and equipment can be used more effectively when the system is uniformly busy, but some facilities, notably the subway, have large fixed costs that are not avoided even if ridership drops.
TTC surveyed employers and in both pre- and post-pandemic conditions, they estimated that 43% of employees would work from home with “some frequency”. This number is not subdivided by job type or location. From the 2016 Transportation Tomorrow Survey, the average numbers of days/week of work-from-home pre-pandemic was 0.35, or putting it another way, about one day every three weeks. By contrast, employers collectively expect employees would be allowed to work from home 3.3 days per week, a huge shift.
Whether the uptake would actually be at this level is quite another matter. After a flurry of “commuting is dead” stories in the media, it is now common to see businesses and their staff yearning for in-person work for personal contact, the cross-pollination of casual conversations, and an escape from home life. What is clear, however, is that there will be fewer workers at job locations simultaneously, and this will affect transit demand.
The situation is actually more grim for transit providers like Metrolinx who are much more dependent on one segment of the market, a segment whose riding has dropped like a stone. Traffic congestion and reduced worry about train crowding could improve Metrolinx’ lot, but if the jobs those commuters are going to no longer exist in downtown office buildings full time if at all, then the underlying demand will not return.
The TTC divides possible responses into two groups: what they are (or could be) doing, and what others might do:
What we are doing now to attract Customers to TTC
• Marketing campaigns
• Fare Pricing
• Increasing service
• Real-time crowding information
• Service integration with neighbouring transit agencies
• Partnerships with events
• Reallocation of road space
What others could do to attract new Customers to TTC:
• Road Tolls/fees
• Incentives to reduce car ownership
• Parking pricing
• Active transportation campaigns
• Enhanced transit stop amenities
Notable by its absence from either list is “improving service reliability”. This is an ongoing issue not just among articles on this blog, but among riders who complain bitterly that buses and streetcars run in packs with wide gaps, and that crowding is unpredictable. The TTC simply refuses to acknowledge that good service is an essential part of attracting riders back to the system, or of constructing reporting metrics that would reflect what riders actually experience.
A basic tenet of transit planning and operations is that the cheapest capacity is that which is provided simply by operating reliable service where demand is fairly evenly distributed between vehicles. Adding more buses to a route is pointless if they will arrive in threes rather then only two at a time.
Even worse, telling riders that they can “avoid” crowding by using predictive apps makes huge assumptions that (a) riders have such devices, (b) that the information provided is accurate, and (c) that the uncrowded bus just down the road will still be an attractive ride by the time it arrives. It is not riders’ fault that TTC refuses to plan for, manage and operate reliable service.
There is little sense that the TTC has any sense of the “own goals” it scores repeatedly on the credibility and attractiveness of its service.
StudentMoveTO
In October of 2020, I reported on a study of post-secondary student travel. This came out at a time when the TTC and its Board were pre-occupied with the evaporation of transit demand and how they would simply keep the lights on. Indeed, it was odd to hear management react to this presentation as if they had not seen the study before.
I will only touch on a few points here because interested readers can look at last year’s article.
Student travel is not well-studied, nor is it commonly cited as an important part of overall transit demand and planning. From the TTC chart above, we know that pre-pandemic trips by secondary and post-secondary students accounted for 8 and 14 per cent respectively of total riding. These are not trivial markets, although given the reduced fares available to many students, they are a smaller proportion of total revenue than their numbers might imply.
The StudentMoveTO survey obtained 18,500 responses, a 5.8% response rate which is high for surveys of any kind. Of these, 13,130 students attended a campus in Toronto and therefore represent a demand on the TTC. (There would also be “out-commuting” by some students to campuses beyond the city.)
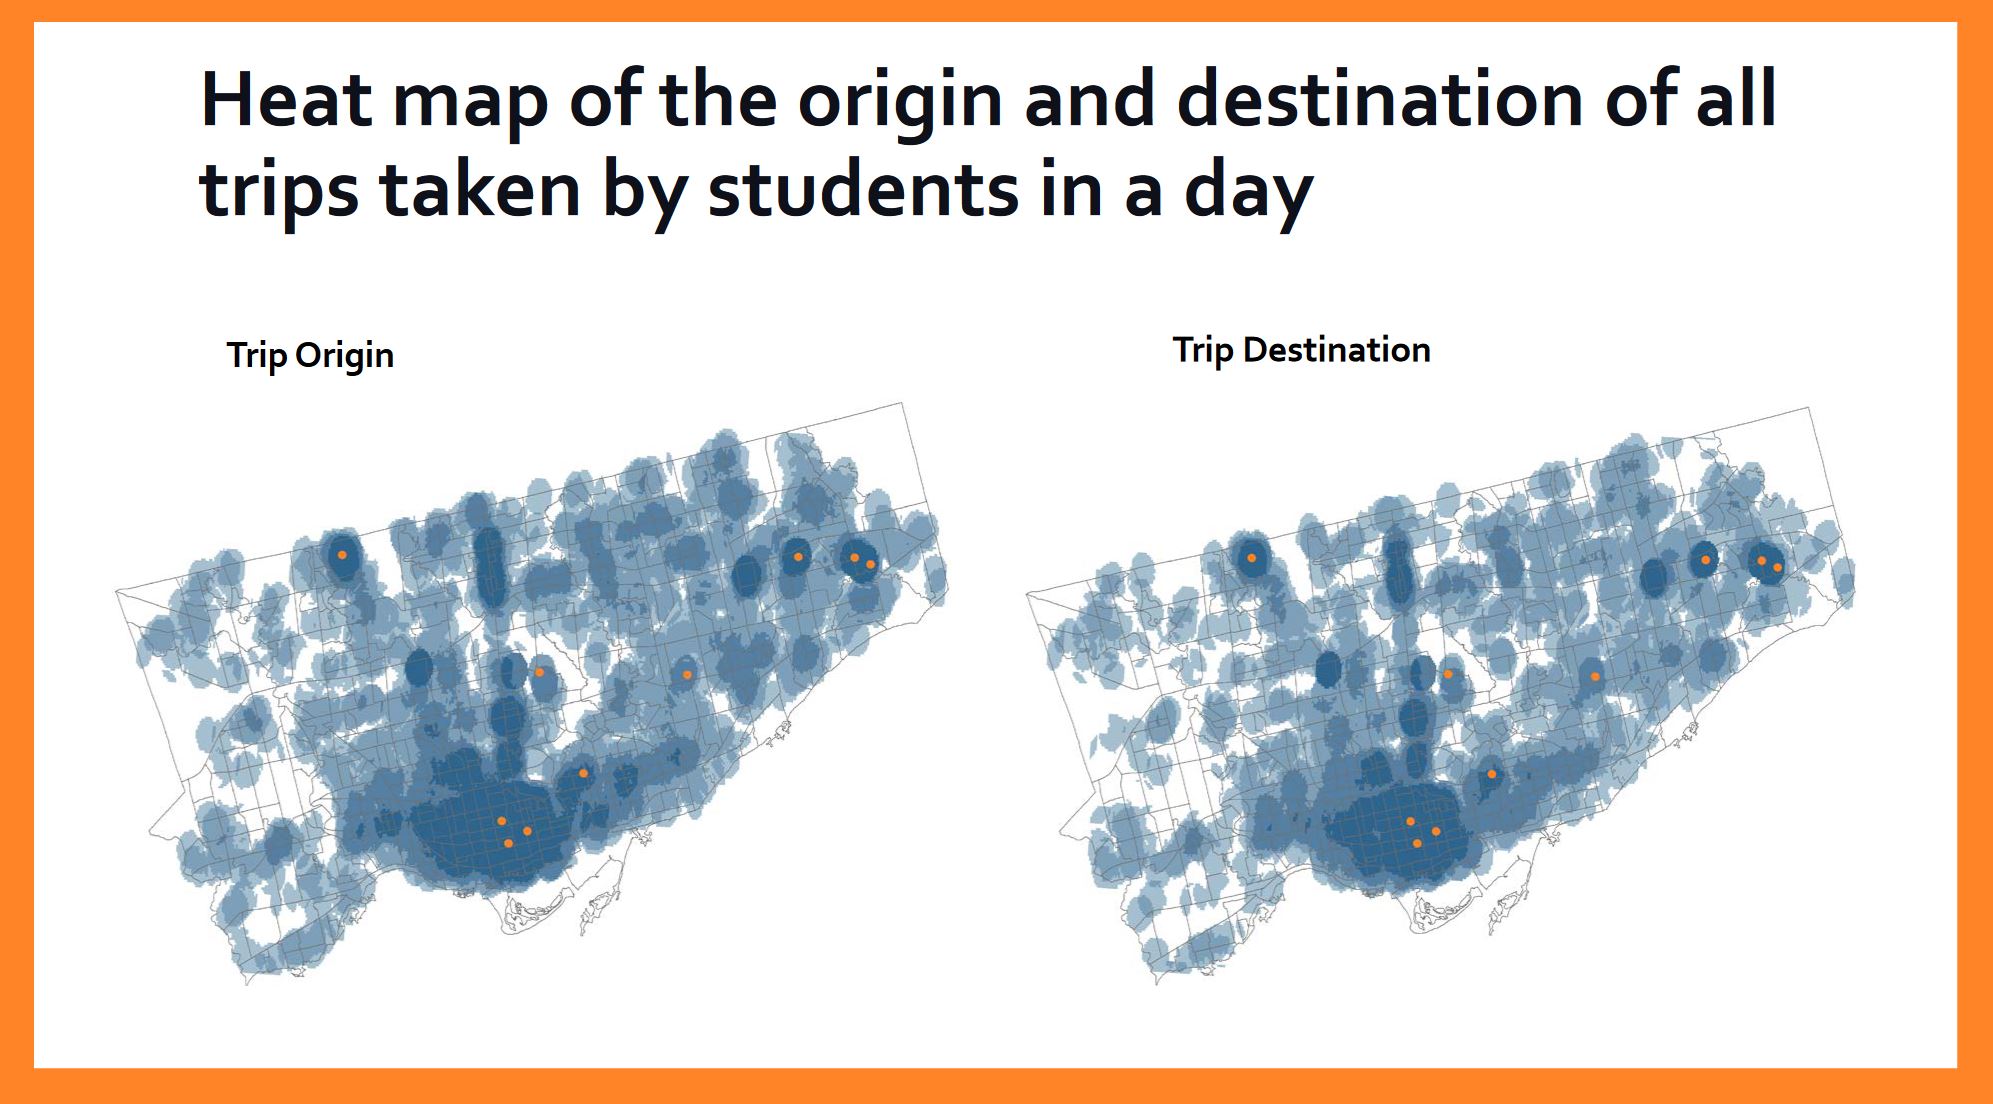
The distribution of home locations covers the GTHA.

Travel destinations are even more scattered, and they are not confined to the campus locations (red dots above) because school is not the only purpose of student travel. Only 36 per cent of trips are to or from school, and the next largest group at 18 per cent are for work.
Although there are “peaks” in this demand, they are not the same as regular work trips. Home-to-campus trips peak between 8 and 9 am, but the return journeys peak between 6 and 7 pm. The peaks are more spread out than for work trips, and many campuses are in locations that do not correspond to conventional commuting patterns.
Collecting student riders from a wide variety locations to bring them to various campuses is a greater challenge than moving tens of thousands to King & Bay Streets.
The proportion of students who reach their campus by TTC varies roughly from 40 to 60 per cent.
An intriguing statistic cited was that the proportion of students who reached York University’s Steeles Campus by subway rose from 24 to 38 percent between 2015 (pre-subway extension) and 2019. But the important figure was that total transit mode share at the Steeles Campus is 68 percent. 30 percent of students arrive on a bus, not on the subway, and of course even the subway trips are often dependent on a bus service to reach the line.
Transit network and service planning must take more than the conventional commutes to downtown into account. This is the big challenge not just for ridership recovery, but for achieving any environmental goals for moving travel from private autos onto transit. We could have a fleet of 2,000 electric buses, but if they do not run where people want to travel on a reliable, frequent basis, transit and the environment will be worse off.

Public transit demand will not return to pre covid levels as work from home will stay plus people will not accept the congestion that results with public transit.
All transit expansion projects should be put on hold for a couple of years until ridership projections are better known. Furthermore service cuts must be implemented now. Fare box revenues must be looked at also as many riders are traveling for free.
LikeLike
Similarly with roads, right? No Gardiner rebuild or GTA West freeway until travel projections are better known.
Steve: After the early 1990s recession, it was not until a decade later that TTC ridership recovered to the level of late 1980s in part because of austerity measures brought in by Mike Harris and only mnimally reversed by Dalton McGuinty. Service cuts are easy to make, but harder to restore when any new service drives up the deficit.
LikeLiked by 1 person
I don’t care what your projections are.
What I care about is that ridership has increased tenfold and there is 0 social distancing POSSIBILITIES train and bus wise!!!
What I have to do to protect myself is wait for 5 to 8 trains 2 pass till I feel safe enough to board!!! That is unacceptable!!!
What I can tell you is that the service has been HORRIBLE the past few weeks, the trains sound like rail road trains from 200 years ago!!!
Horrible horrifying trips to and from work raising my blood pressure because of the horrible TTC “service”
SHAME ON YOU TTC!!!
LikeLike
Hi Steve,
Could you do a route analysis of the new 960/60 Steeles please? It’s common on weekends to have 60 buses running -10 to -30. Seems also like a few vehicles were removed and so was a lot of running time. Would be interesting to see the results of the 60/960 overlap.
Steve: Coming soon!
LikeLike
It’s interesting that this discussion seems to assume that future ridership depends entirely on demand as defined by trip purpose and is not affected by people’s reluctance to travel on transit due to a perception that it is unsafe. That assumption may be missing the elephant in the room.
Steve: This is a big reason I have spent so much time documenting and writing about service reliability and the quality of what riders experience as a key tool in attracting the hesitant riders back to the TTC. I think it does not get discussed in official circles because this would mean acknowledging that the TTC has severe internal problems and the challenges are not all somebody else’s fault. They have reached the point of, in effect, blaming riders for not avoiding crowded buses. This is compounded by a poisoned labour relations situation that will make any negotiations about improved operating conditions very difficult.
LikeLike
There are a few streetcars emblazoned with a wrap that says “this streetcar has been sanitized …”, or something to that effect, implying that all the others have not! If you can’t wrap them all, then you should be saying “all streetcars have been sanitized …”
LikeLiked by 1 person
For a bit of international ‘return to ridership’ comparison for your readers – London is up to about 75% pre-pandemic ridership on buses and 50% Tube at peak weekend times (the new busiest time!), and NYC is at about 50% for both buses and subway.
LikeLike
With white collar workers being able to work from home and, based on all reports, the fact that some work from home will be continuing for many in future, do you think we’ll see a change in travel patterns? Office workers commuting to downtown would be fewer but service workers, manufacturing, etc, will still have to travel to work and many of those workers do not have a car. Those workers, whether caregivers, cleaners, warehouse staff, retail workers, etc, don’t have the clear 9-5-ish M-F pattern that office workers do. Are we going to see the peaks flatten but ridership levels rise in other times?
Steve: I am not sure we can say definitively at this point. Businesses that occupy a lot of prime office space are talking about downsizing so that there would be fewer workers simultaneously trying to commute, but in time this will be offset by other companies picking up the discarded space. The real question is not just for downtown, but for office areas that might not be as competitive if usage of existing built stock soaks up new demand. Another way of looking at this is that demand models usually assume a standard ratio between floor space and workers. This ratio could actually change as more “hotelling” spaces are created and the density of workers goes up within existing buildings. It’s important to distinguish between the behaviour of individuals and their collective travel patterns and locations on the transit network.
As for peaks flattening, maybe, but again I can’t help thinking that it’s too soon to tell. Traffic patterns on some corridors, especially outside of the core, have returned to at least pre-pandemic levels if not higher and show the traditional peaking pattern. (Have a look at some of my analyses of bus travel times for examples of affected areas.) This is not uniform across the city.
A lot of transit demand is not for conventional downtown work commutes, and this will return at different rates.
What bothers me the most is that some commentators/advocates have seized on what could be a temporary shift in travel patterns to justify long-term changes to plans for additional transit capacity. Before the pandemic, it was widely acknowledged that Toronto was years, if not decades, behind on building transit to match demand growth. Do we just give up and condemn our future city to the already auto-heavy orientation of suburban travel capacity?
LikeLike
Economists think that prime downtown office real estate won’t stay empty especially if rental prices will go down as a result of existing tenants downsizing. Some of the non-downtown office space may be repurposed/rezoned for residential uses since there will be less requirements for office space outside of downtown and outside of spaces directly at subway/GO stations.
LikeLike