The TTC Board met on September 15 and, among other things, considered a report and two presentations that touch on ridership:
- CEO’s Report for September 2021
- Ridership Today….and Tomorrow (Staff Presentation)
- StudentMoveTO Moving Post-Secondary Students in the GTHA: Preliminary results from a survey and study on student mobility in the Toronto Region (An invited presentation by Roger Keil of York University and Danya Tugg of Ryerson University)
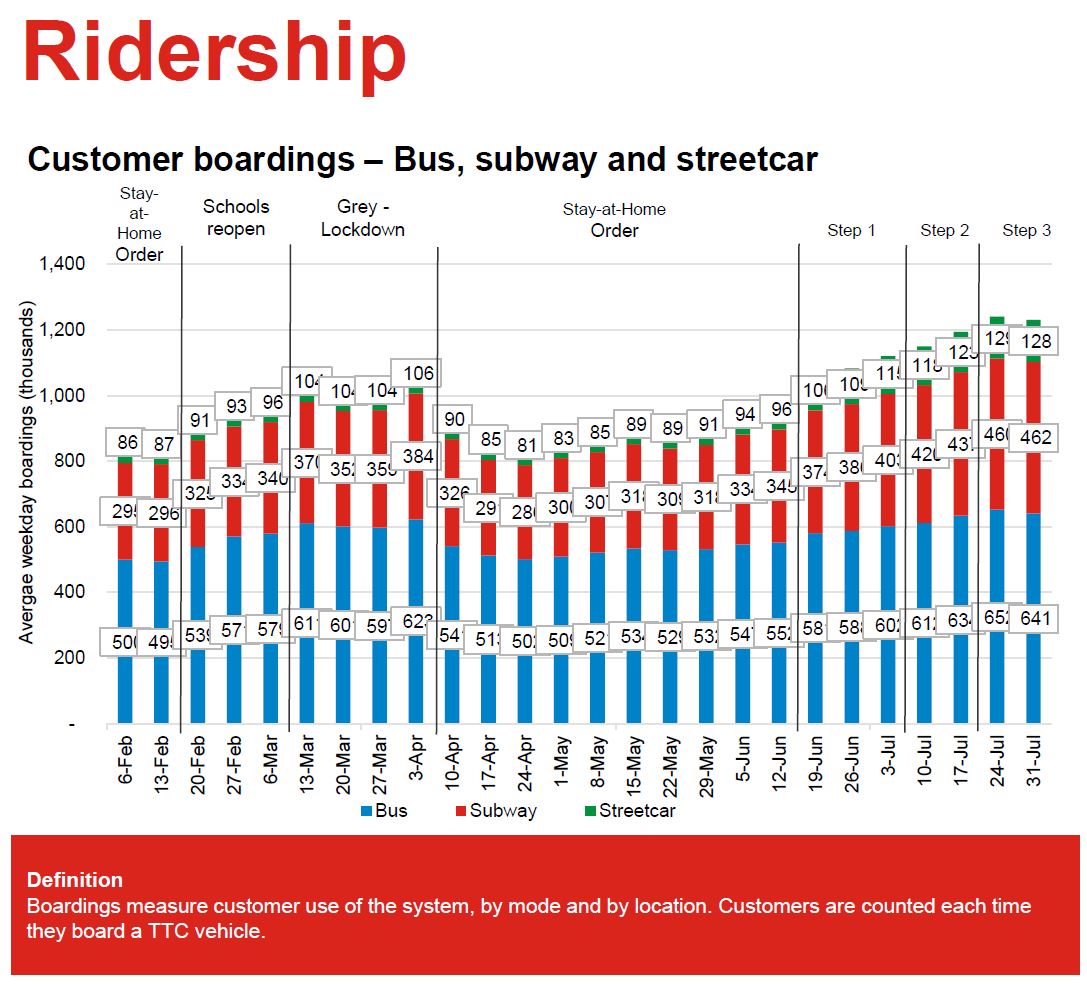
Ridership is growing slowly on the TTC with the largest changes, proportionally speaking, coming on the streetcar and subway systems that serve downtown. These modes are now at 31 and 37 percent respectively of pre-covid levels while the bus system is at 46 per cent as of July 31, 2021.
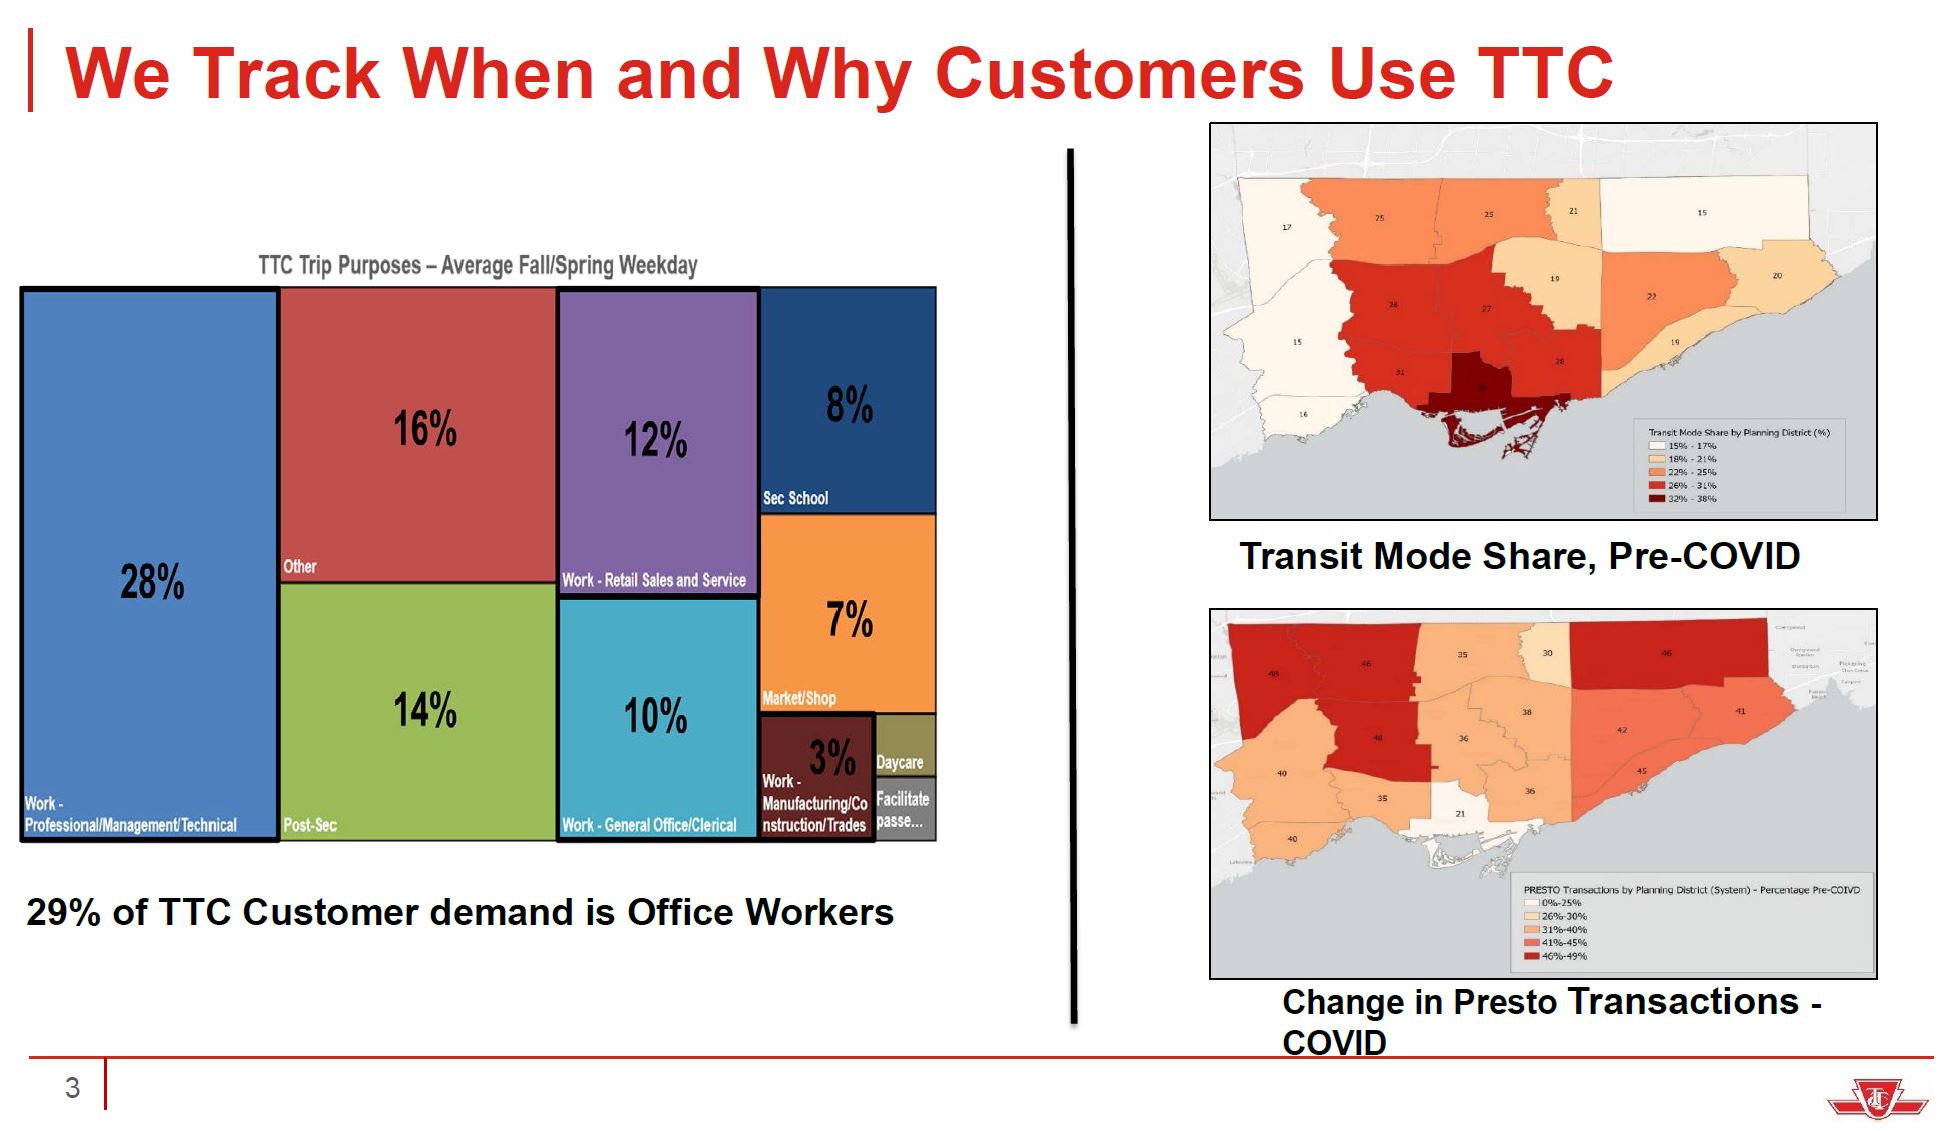
TTC Staff presented an overview of ridership trends and projections looking ahead to 2022 and 2023. An important part of looking ahead is understanding where the TTC was in pre-pandemic times. A great deal of planning and political effort focuses on commuters, especially those headed to the core area, but they are only part of the overall travel demand served by transit.
The chart on the left below shows the purpose of transit trips. Just over half, are work trips with a breakdown of:
- 28% “professional, managerial, technical” (a group most likely to embrace work-from home),
- 12% retail sales and service,
- 10% general office and clerical, and
- 3% manufacturing and construction.
This breakdown will also reflect the job locations and the relative ease of travel to them by TTC. What is not shown is the mode share for each group, something that would have to be further subdivided geographically. The overall mode share was, to no surprise, concentrated downtown, and it falls off to the outer suburbs.
The map flips when charting the change in Presto usage (a surrogate for trip counts) in the pandemic era. The greatest retention of riders occurs in the locations where overall transit mode share was low showing that these riders have much less choice in whether to travel by transit. By extension, demand in these areas did not fall as much as downtown, and compounded by service cuts, even a reduced demand could produce crowding.