September 2021 will see expansion of TTC service in anticipation of returning demand including in-person learning at schools and universities. Many express bus routes will be improved or enhanced.
In a reversal of past practice, schedule adjustments for “on time performance” will actually reduce rather than add to travel times in recognition that buses do not need so long to get from “A” to “B”, and that they can provide better service running more often on their routes than sitting at terminals.
Full details of the schedule changes are in the spreadsheet linked below.
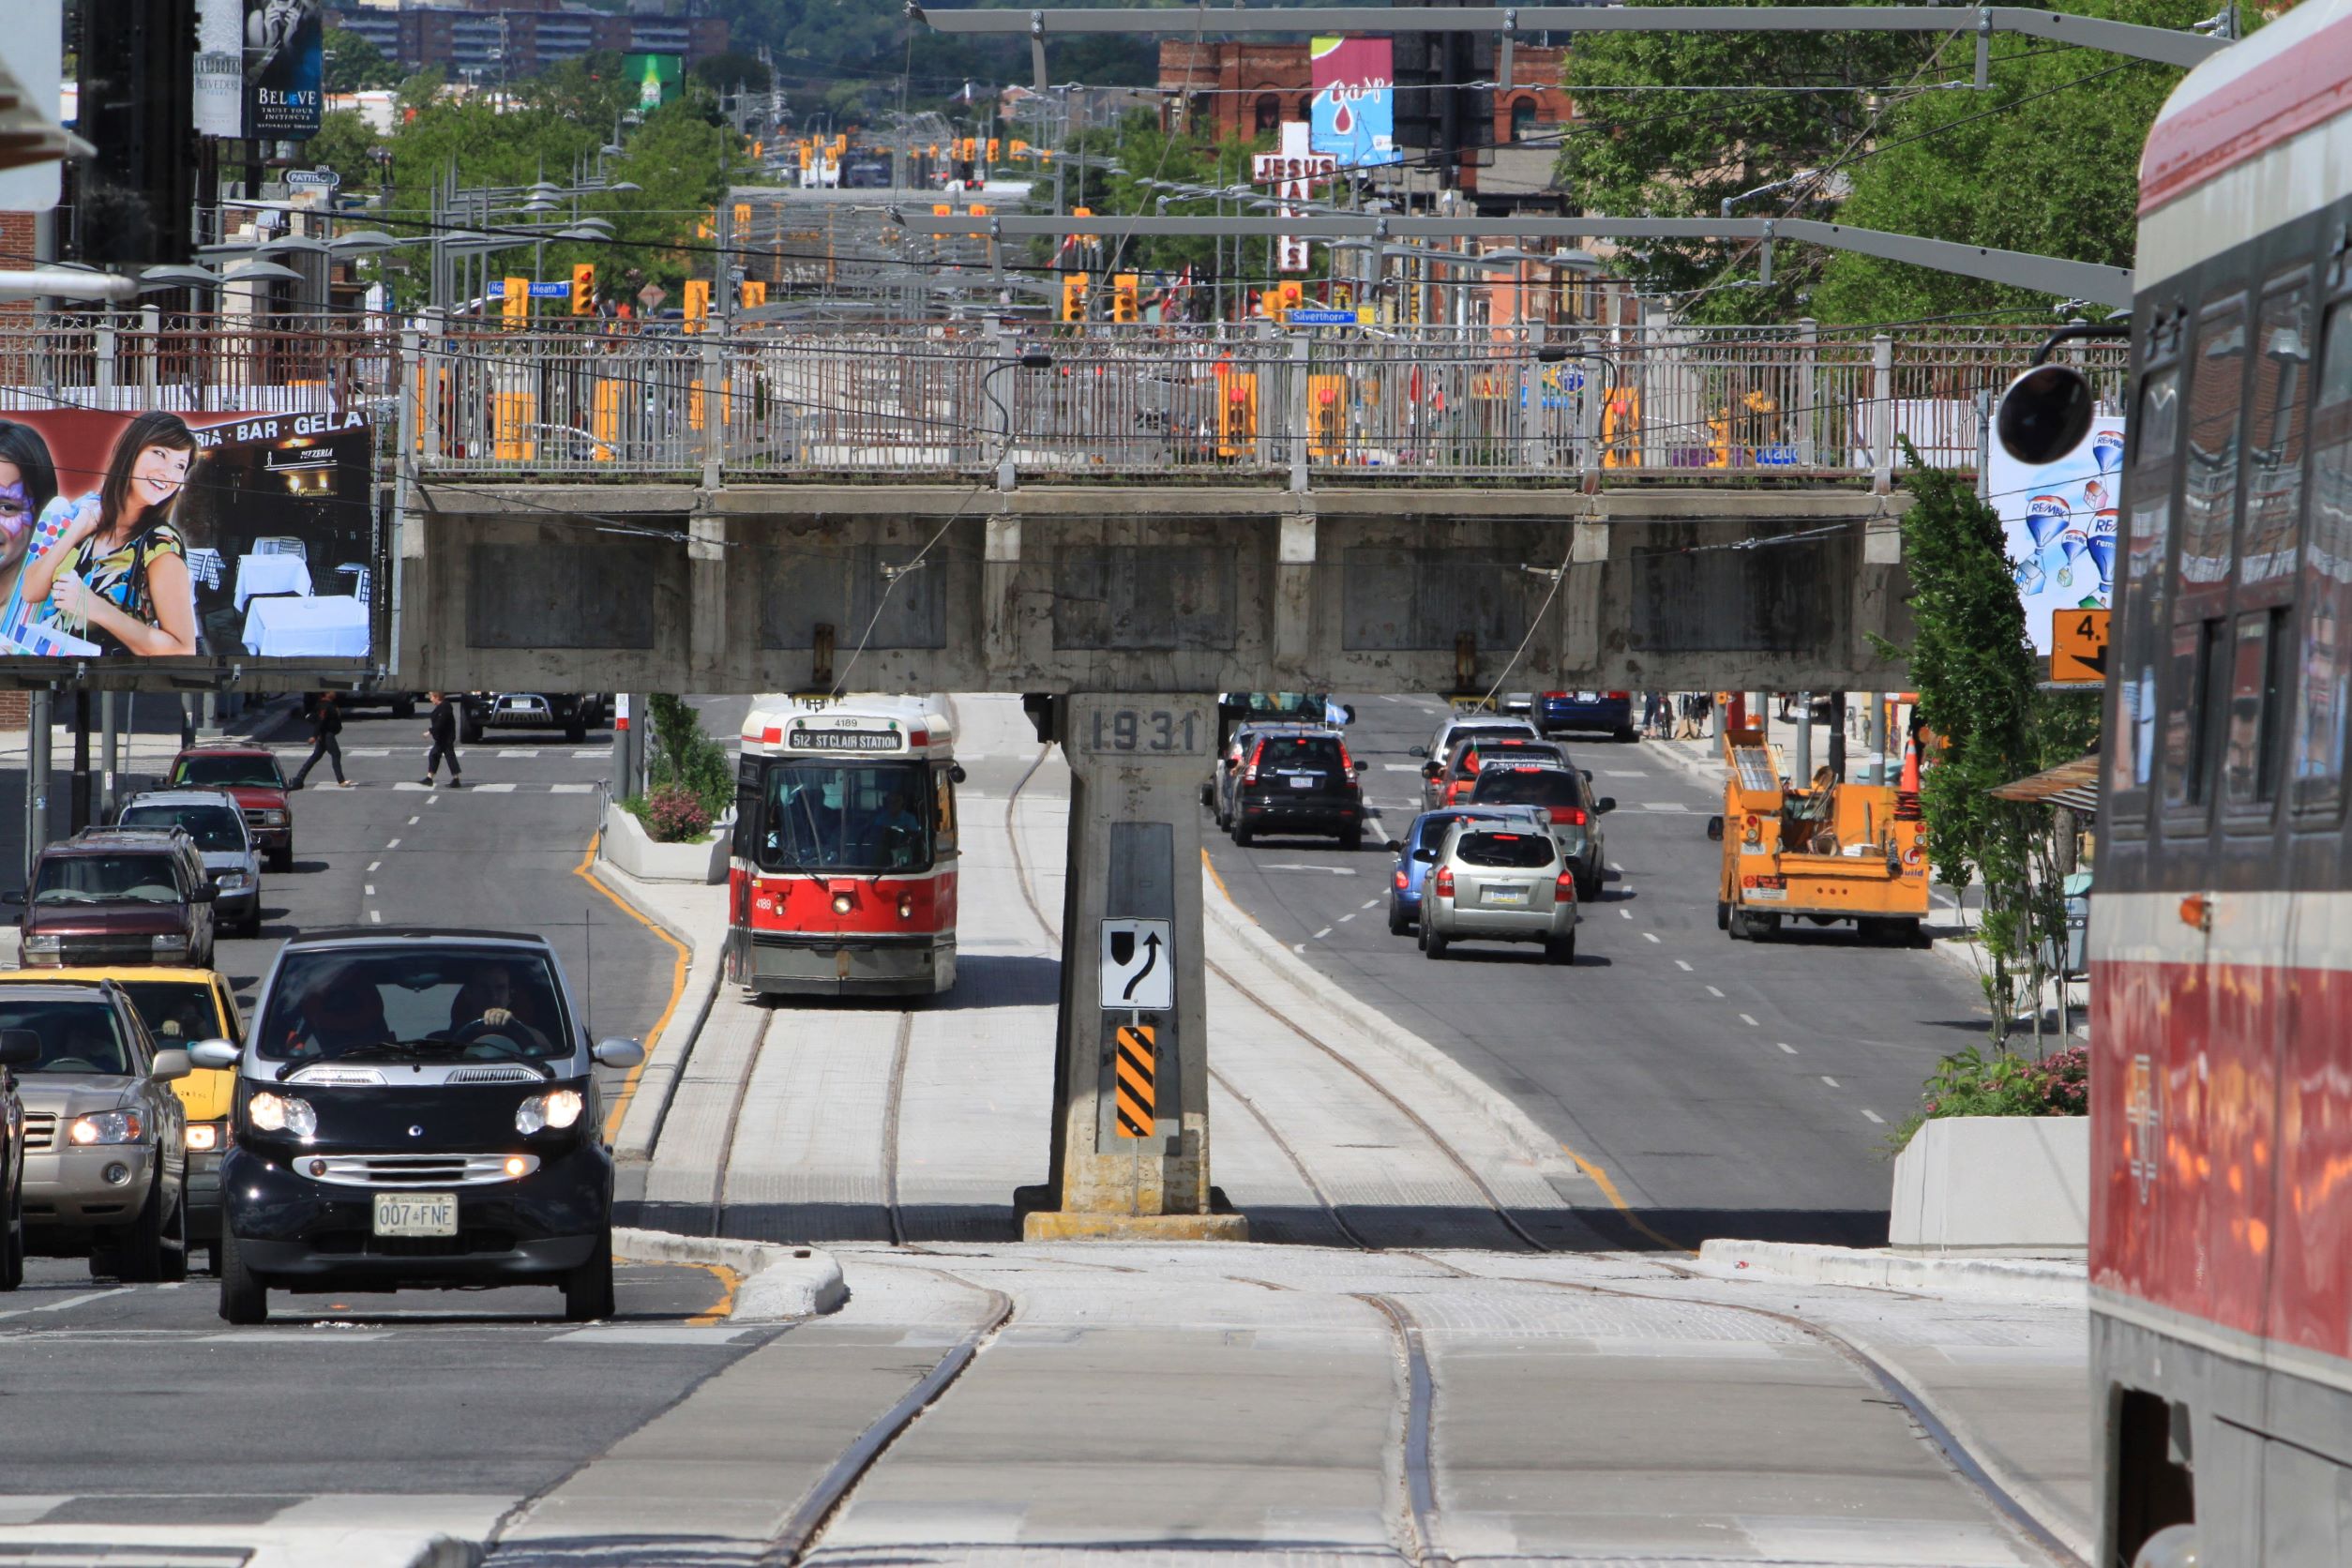
Like the Spadina route, St. Clair operates in a reserved lane with many farside stops. The route has also been through the transition from CLRVs to Flexitys, and is subject to many of the same operational rules as the Spadina car. However, there are a few significant differences: St. Clair has fewer intersections (special track work) where slow orders apply, and the transit priority signalling is supposed to be active except at major intersections where cross-street capacity takes precedence.
The charts here are in the same format as those shown in the previous Spadina article for ease of comparison.
Looking west on St. Clair from Caledonia, June 30, 2010. Photo by Steve Munro.Continue reading →
A recent exchange on Twitter piqued my curiosity with the question “Is the Spadina car slower than it used to be”. A quick review of my archived tracking data for this route gave a simple answer “yes”, but there is more going on that just the speed of vehicles.
A related question dates back to a 2005 Globe article by Stephen Wickens comparing travel times on the 511 Bathurst streetcar which operates in mixed traffic to times for 510 Spadina which operates with “transit priority”. The Bathurst car won, much to the TTC’s displeasure.
Spadina looking south to College, September 2018. Photo by Steve Munro.Continue reading →
In recent weeks, I have been working through the RapidTO bus priority corridors, existing and proposed, looking mainly at travel times and the effect of the pandemic era traffic reductions. (Still to come are the Finch East and Lawrence East corridors.)
An important part of any transit priority scheme is not just to move buses faster, but to improve service. An important outcome of the King Street Pilot was that although, on average, streetcars did not move blindingly fast across downtown compared to the pre-pilot era, the time they took was much more reliable. This led to better service because riders came to expect regular arrivals of streetcars and predictable travel times.
Much attention is lavished on priority schemes as “the solution” to transit problems when this does not address basic issues with service quality. At the current rate, we will see half a dozen RapidTO projects over an equal number of years, and much of the system will be untouched.
Shortening travel times does not, in itself, make for more reliable service.
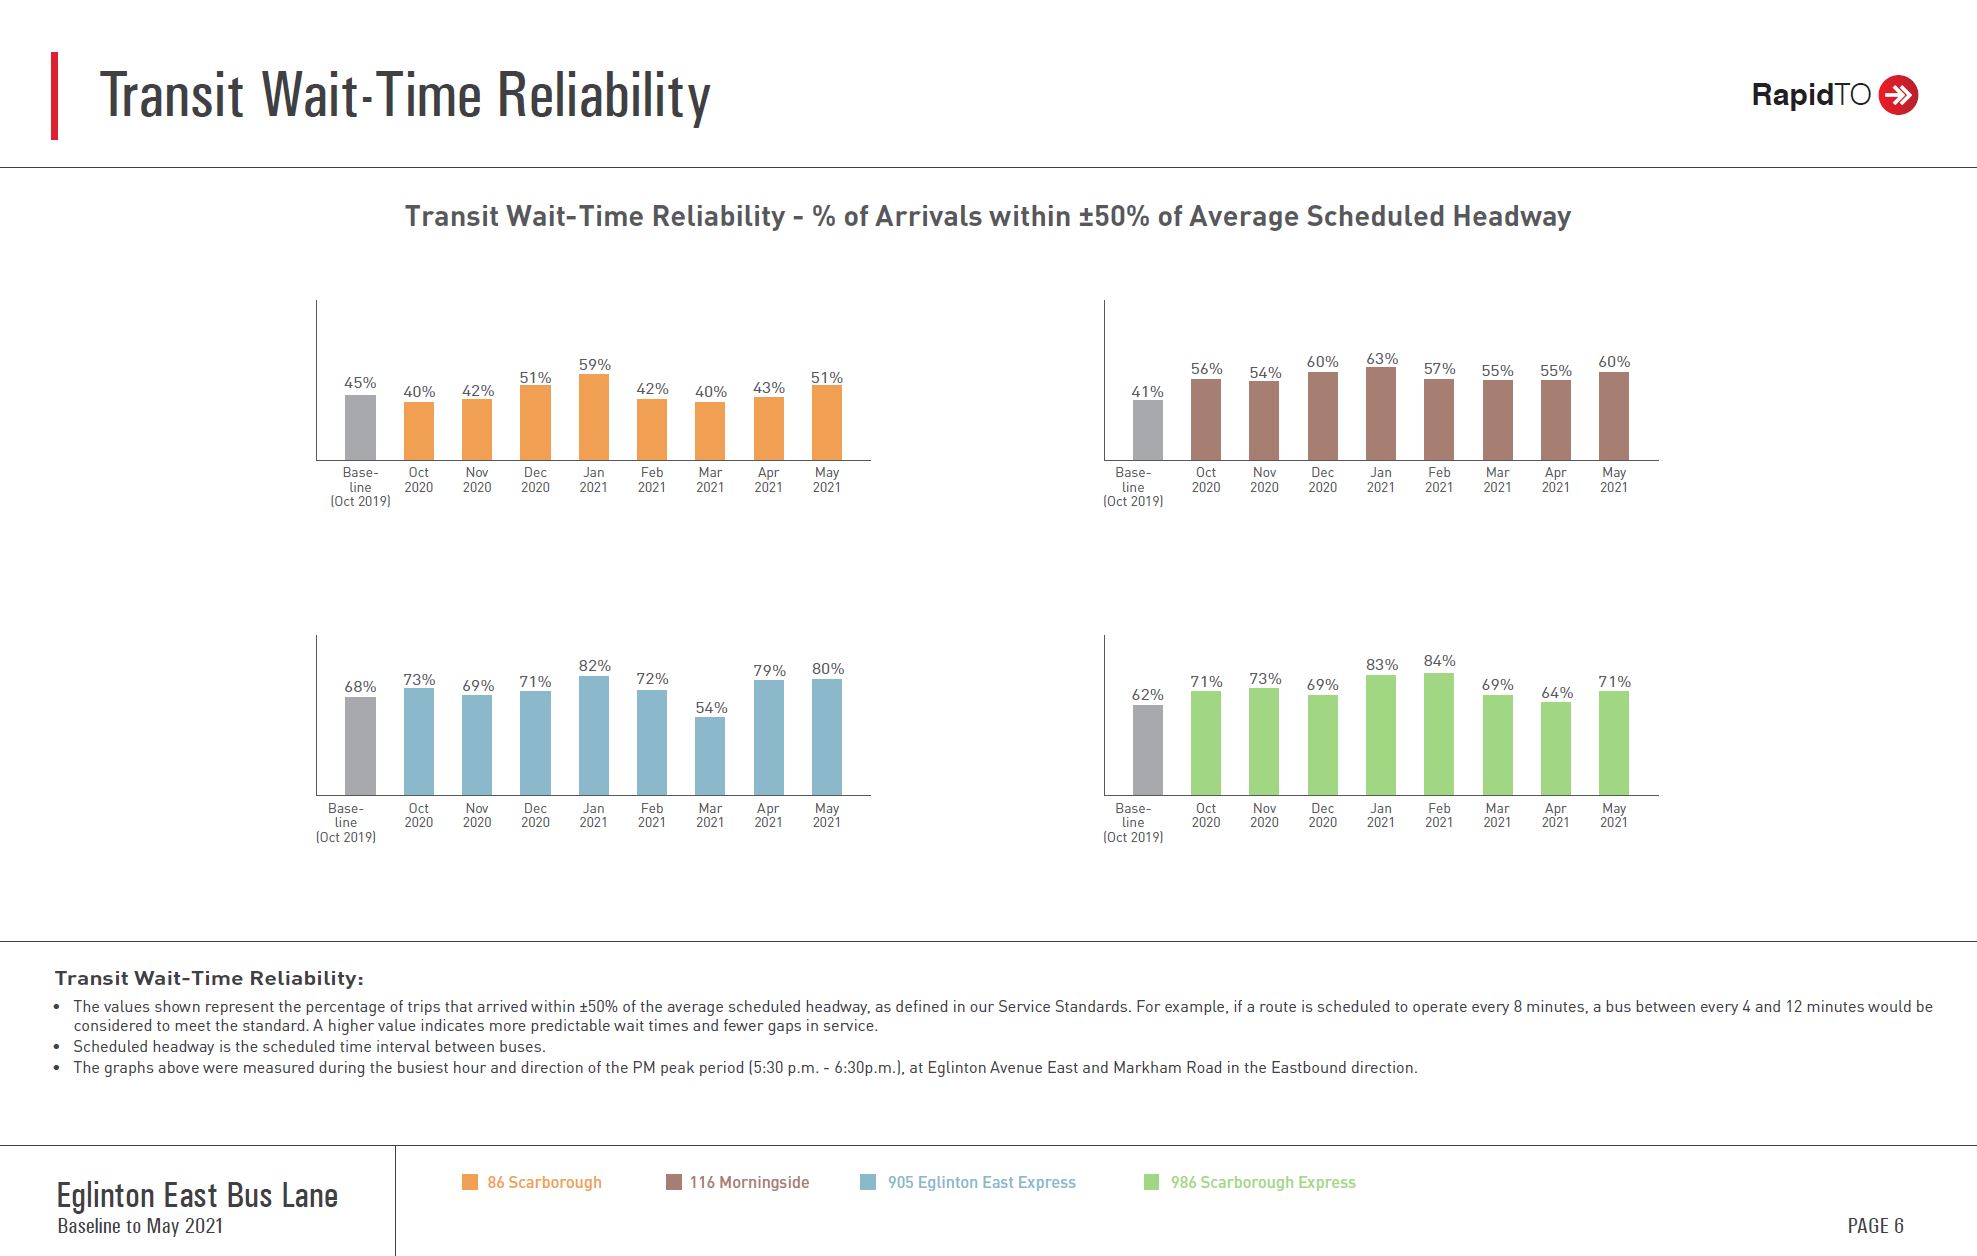
Reliabilty is one aspect of the recent City/TTC Dashboard that was created to provide ongoing updates on the effects of the Eglinton-Kingston-Morningside red lanes. See: A Dashboard for Scarborough Red Lanes
As a starting point, here is the chart from that dashboard:
Leaving aside that some of those percentages are not very impressive, there is the general question of just how the reliability metrics in the TTC Service Standards are calculated and what they mean (see 3.3 Service Reliability starting on page 15 of the pdf). There are several components to the Standards.
Service should depart from terminals no more than one minute early and no more than five minutes late. The overall goal is that 90 per cent of service hits this target.
Service should arrive at terminals no more than one minute early and no more than five minutes late. The overall goal is that 60 per cent of service hits this target.
Where headways (the interval between vehicles) is greater than 10 minutes, the +1/-5 standard above should be achieved 60 per cent of the time. It is unstated whether this applies to terminals or mid-route locations.
Where headways lie at or below 10 minutes, service is measured on how close headways are to scheduled values because timetables mean little to riders. The allowable range depends on the scheduled service:
Headways between 5 and 10 minutes have a 50 per cent marginal allowance. At least 60 percent of service should hit this target.
Headways under 5 minutes have a 75 percent marginal allowance. At least 60 percent of service should hit this target.
This all sounds quite methodical, but there are problems lurking in what might appear to be a “reasonable” formula.
(Note that the TTC has never reported on the terminal arrival time metric. This target conflicts with actual operating practice where many schedules have extra running time to deal with varying conditions. If operators drove to worst case conditions so that they did not arrive at terminals early, riders would be much displeased. In practice streetcars tend to dawdle, and buses tend to race across their routes with generous layovers at terminals.)
The TTC usually measures achievement of its targets on an all-day basis. The chart above is unusual in that it considers only the peak hour and a mid-route point, not a terminal. In that sense it is much closer to what riders actually experience than the usual TTC stats where periods of poor service are averaged in with periods of good (or at least better) reliability. Measurements at terminals tend to be “best case” numbers because there is some hope for managed departures, but reliability quickly deteriorates as buses move along their routes.
For very short headways, there will always be problems with bunching because (a) it is easy for a following bus to catch up to its leader and (b) traffic signals tend to “marshall” buses into packs based on their cycle time.
This shows up in some of my headway charts where the values lie in bands corresponding to multiples of a cycle. Buses head off at the start of a green cycle and cross the invisible screenline in the middle of the intersecting road. This does not occur at locations with farside stops where buses can depart whenever they are ready.
A 50 per cent allowance on moderate headways means that, for example, buses that are supposed to arrive every 6 minutes can be as close together as 3 minutes and as far apart as 9 minutes while still being acceptably within standards. The problem with this is that a bus on a 3 minute headway is likely to be much less crowded than one on a 9 minute headway.
The 60 per cent target, if measured on an all-day basis for a route with reasonably good off-peak service means that in practice some periods of operation could have very poor headway reliability and yet the route overall would be considered as meeting the standard. This is nonsense.
For example, on 60 Steeles West, between Finch and Pioneer Village Stations, the buses per hour (June 2021) are shown in the table below. This is a rough estimate as the hours for each period of service will vary, but the basic premise holds. 40 percent of trips would be 76 of the 189 total. Much of the peak service (81 trips) might operate completely outside of the standard while the overall stats indicated that service was acceptable. Alternately, the evening service (48 trips) could be atrocious, but this would be smoothed out in an all-day average.
Period
Hours
Buses/Hour
Total Buses
AM peak
3
15
45
Midday
6
10
60
PM peak
3
12
36
Early evening
3
10
30
Late evening
3
6
18
Total
18
189
When the headway goes beyond 10 minutes, a completely different standard based on the schedule applies, although this is only measured at terminals. One problem the standards do not address is how to measure branching routes where the combined service runs every 10 minutes or better, but the branches do not. Which standard should apply?
More generally, where branches of routes converge, it is pure luck whether there is a properly blended headway, and no standard measures how well this is achieved.
This can also apply to unscheduled short turns where the absence of management of vehicle re-entry to a route can lead to bunching rather than gap filling. If a bus or streetcar re-enters based on its scheduled time, this might not actually split a gap in service coming from the terminal. Indeed an inbound gap car or bus could continue carrying the load with a short turn pulling in immediately behind.
The -1/+5 minute rule for longer headways brings its own problems. A six-minute window for being on time may look good, but it can produce very ragged service. Consider services like those shown below. In each case, alternate buses arrive five minutes late and one minute early. The resulting minimum and maximum headways are a long way off from the service riders might expect, and yet they fall within the Service Standards.
Headway
Scheduled Times
Actual Times
Min
Max
12
0 12 24 36 48 60 …
5 11 29 35 53 59 …
6
18
15
0 15 30 45 60 …
5 14 35 44 65 …
9
21
20
0 20 40 60 …
5 19 45 59
14
26
Again this is nonsense. It should not be possible for headways to vary by a factor of 3 (6 vs 18 minutes) and be considered as “reliable” service. When headways are uneven, the shorter headway at a terminal (where the standard is monitored) quickly becomes even shorter along the route and the gaps become wider to the point where pairs of buses travel together on double the scheduled headway.
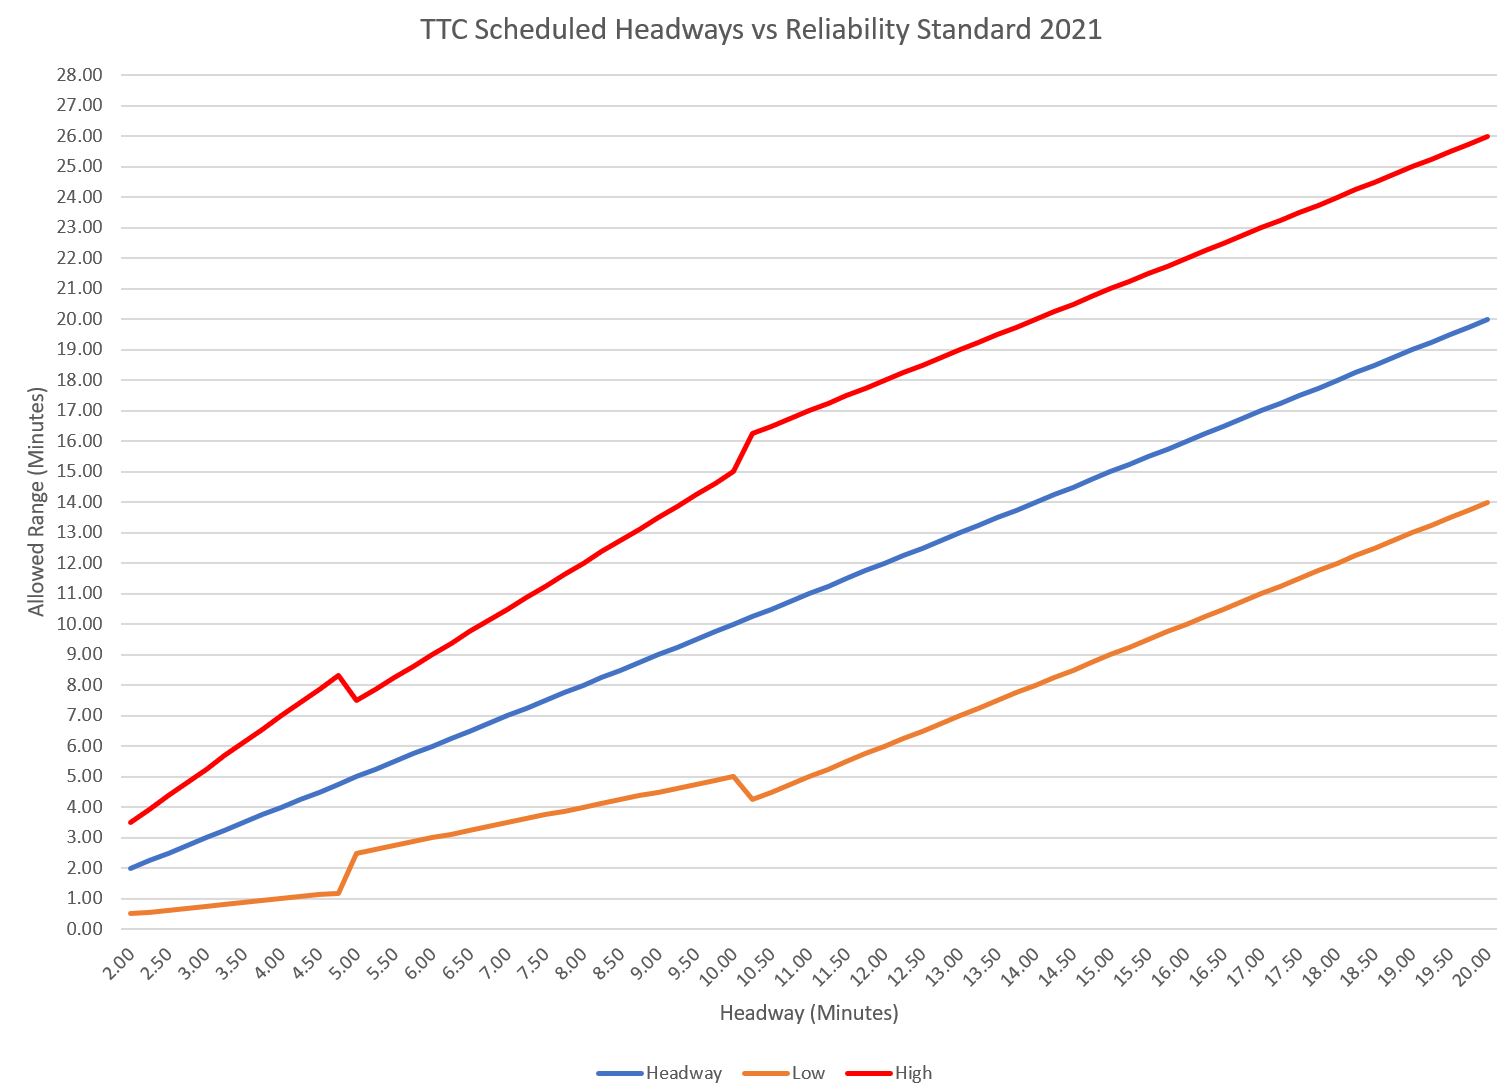
The effect of the standards on what is considered “reliable” are summarized in the chart below.
The blue line is the scheduled headway and it rises smoothly from one side of the chart to the other.
The red line is the maximum possible headway that is within the standard.
The orange line is the minimum possible headway that is within the standard.
There are notches in the red and orange boundary lines corresponding to transitions between the TTC Standards for short, medium and long headways. The common point, however, is that the standards allow a wide range of headway values compared to what is advertised. They can claim to be providing “reliable” service within those standards while riders experience nothing of the sort.
A further problem is that once a headway is outside of the allowed bounds, it could be very long or very short, but nothing in the standards flags this particular problem.
I have no delusions that this problem will be fixed overnight. Holding TTC operations to a better level of headway management will not guarantee instant results especially on routes where laissez faire management leaves the bus opeators to fend for themselves.
However, if the standard is too lax, there is no indication of what needs improvement. The numbers might fall below targets with a tighter standard, but at least they would show where problems exist. Management should not get gold stars for hitting targets that leave riders wondering if their bus will ever arrive.
These standards are at times referred to as “Board approved” with the clear implication that they were carefully considered and understood. In fact, technical standards like this fly through Board meetings almost untouched because the actual implications of what they contain are not understood. The Board assumes that management knows what it is doing. They might debate buying boxes of widgets at the best possible price for hours, but Service Standards that affect every rider’s experience get only a brief nod.
At a minimum, the following changes are needed:
Actual headway behaviour should be reported on an hour-by-hour basis through the day rather than all-day averages so that problem periods can be identified.
Reports should look not just at terminals but at key points along a route (this change is likely to be proposed as part of the 2022 Standards).
An upper bound should be set on the actual gap between vehicles that does not allow headways to vary by a large factor. A six minute maximum, akin to the +1/-5 on time standard, should apply.
Large gaps and bunches (such as headways below 2 minutes) should be reported separately so that these are flagged separately from trips outside of the headway standard.
Service on Steeles operates from Finch Station north on Yonge and West on Steeles with three branches:
60A local service to Pioneer Village Station
Local service (via Pioneer Village Station both ways)
60D to Highway 27 (daytime, Monday-Saturday)
60B to Martin Grove (evenings and Sundays)
960 express service to Pioneer Village Station (peak periods only)
The 960 Steeles West Express bus was originally known as the 60E, later the 960. It was discontinued in Spring 2020, and resumed operation in January 2021.
Weekend 60 Steeles West service was reduced on June 20, 2021.
This article deals with:
The change in travel times for the service between Steeles & Yonge and Pioneer Village Station (the portion of the route proposed for Rapid TO) from pre-pandemic traffic conditions and their evolution through the low point of demand and congestion in 2020 through to June 2021.
Travel times for service west of Pioneer Village Station.
The speed difference between local and express services.
The reliability of service.
The High Points
As on other routes in Toronto, there was a drop in travel times across much of the route concurrent with the pandemic and lockdowns in mid-2020. However, unlike other routes, this effect was short-lived on Steeles and particularly on the section west of Pioneer Village Station.
Extremely severe congestion affects this route as of June 2021, although the degree varies from day to day with wide differences in travel times on some segments. I plan to follow-up this situation with data through July and August in a future article.
For the most part, scheduled travel times on Steeles provide generous layovers at terminals, and most congestion effects can be absorbed by them (whether the excess is officially called “recovery time” or not).
Headway reliability on the 60/960 Steeles West service is spotty. For the local buses, bunching and gaps are common, and this occurred even during mid-2020 when traffic conditions were much less of an issue. Express buses are infrequent enough that they do not run as pairs, but there is still a wide range of headways compared to the scheduled service.
The situation west of Pioneer Village Station where schedules service is less frequent is particularly bad.
It is quite clear that if there is any active attempt to manage headways on Steeles West, it is largely ineffectual and riders suffer as a result. Uneven headways lead to uneven loads and the perception that most buses are crowded even when average demand might not bear this out.
There is a RapidTO proposal for the segment of Steeles West between Yonge and Pioneer Village Station. Although Yonge Street itself between Finch and Steeles is also a source of congestion, there is unlikely to be much improvement for transit priority here because of the planned subway extension and construction disruption. This will make a bad situation even worse, and the subway project should be designed to minimize loss of road capacity and/or to prioritize transit within whatever remains.
Recently, I published an article about the evolution of travel times and service quality on the Eglinton-Kingston-Morningside corridor since the installation of the transit priority “red lanes”, a project which has been branded RapidTO by the City. See: Red Lanes, Express Buses and Service Reliability in Scarborough
For clarity, although I have done work for City Planning as part of the King Street Priority project, I was not involved in the City/TTC Scarborough project. Analysis presented in my previous articles is my own work separate from the official reports.
One of the challenges of presenting this material is that there is a lot of data between transit vehicle tracking, ride counting and general traffic monitoring. In my articles, I only deal with the transit tracking component and even that is a lot. The City and TTC have boiled down the data further to present the major issues.
The City’s project page contains an overview and links to various resources including the TTC’s RapidTO page. The heart of reporting on the project is in the Project Dashboard which summarizes data showing effects on transit and general road user travel times as well as service reliability.
The High Points
The RapidTO lanes in Scarborough were the low-hanging fruit of potential transit priority projects. Much of their length already had peak period diamond lanes. The streets were not dependent on parking to serve commercial properties along the route, and they were mostly wide enough to leave two traffic lanes in each direction even after dedication of the curb lanes for transit.
Travel time changes were modest, and the savings cannot all be ascribed to the red lanes because other changes were made concurrently or after implementation, notably the elimination or relocation of stops.
Traffic and ridership volumes have not yet returned to pre-pandemic conditions and so we are not yet seeing either the roads or transit service stressed to previously-normal levels. Whether the red lanes will limit transit times from rising back to or above 2019 levels will probably not be known until sometime in 2022.
Service reliability continues to be the bugbear of TTC operations, and we are finally seeing figures to support this in a report from the TTC. When only half of service can achieve a rather generous target range of headways (time between buses), the service is not very reliable.
Update: Of particular note is the high reliability factor shown for the express routes, particularly 905 Eglinton East. The metric is defined as ±50 percent of scheduled headway, and the express routes have much larger headways than the 86 and 116 local Scarborough and Morningside services. Therefore, service on the 905 can be much more erratic because there is a wider acceptable window of values using the 50 percent rule. This is not necessarily better service, only a side-effect of a poorly-chosen metric.
The City and TTC present this metric as an “improvement” relative to October 2019, but the change is only a slight improvement on appallingly bad service. If this were a report card, it would generously have changed from an “F” grade to “E”.
External, physical changes to the route environment such as reserved lanes and stop consolidation will not, by themselves, produce reliable service, and the TTC has yet to address headway reliability management as a core function.
This article continues a series reviewing the behaviour of service on routes that are either part of the RapidTO bus lane network or have been proposed for inclusion in future stages of its rollout.
The 35 Jane and 935 Jane Express buses operate between Jane and Pioneer Village Stations and follow identical routes except for a peak-only 35B Jane branch that operates via Hullmar between York Gate and Steeles.
This article deals with:
The change in travel times for the local 35 Jane service between Eglinton and Steeles (the portion of the route proposed for Rapid TO) from pre-pandemic traffic conditions and their evolution through the low point of demand and congestion in 2020 through to June 2021.
The difference between local and express services.
The reliability of service.
The effect of construction of the 6 Finch West LRT.
The High Points
Although much of Toronto’s traffic congestion and transit riding have not returned to pre-pandemic levels, the travel times on the Jane bus are now as high as or greater than values in November 2019, particularly in the PM peak. Southbound travel times were historically longer than northbound, and this pattern continues today.
Construction at Finch produced substantial congestion on the approaches in both directions during the latter weeks of June 2021. However, this was not the only location where traffic congestion, as measured by slower travel speeds, rose later in June.
Headways (the time between buses) are less reliable in the afternoons and evenings on both the local and express services, and this worsened in late June with the combined effect of construction delays and schedule changes. Waits for express buses can be so long that they outweigh the benefit of an “express” trip.
Service can be irregular even on weekends when conditions that disrupt weekday operations are either absent or at a much lower level. This shows a need to better manage service so that disruptions, when they occur, are clearly the product of external conditions, not of laissez-faire operations.
Updated July 20, 2021 at 11:00 am: An explanation from the TTC for the routing choice for the 504C King West shuttle has been added at the end of this article.
The schedule changes for August 2021 primarily bring adjustments to running times and headways on several route. Continuing a recent pattern, the TTC has started to trim back extra travel time that buses do not require. This results in a combination of effects including:
Identical service is provided by fewer vehicles
Better service is provided by the same or fewer vehicles
On only a few occasions are headways widened
The affected routes are:
28 Bayview South
30 High Park
37 Islington
50 Burnhamthorpe
52 Lawrence West
55 Warren Park
60 Steeles West
64 Main
65 Parliament
95 York Mills
120 Calvington
952 Lawrence West Express
953 Steeles East Express
For details, refer to the spreadsheet linked at the end of this article.
Royal York Station Construction
Remedial work is needed at Royal York Station left over from the Easier Access Program. For the period of the August schedules, bus routes will not loop through the station, and service south and north of Bloor Street will be interlined. The hookups are the same as during the previous construction work: 15/48 Evans/Rathburn and 73/76 Royal York North/South.
One Person Train Operation Trial on Line 1
On a trial basis, trains on Line 1 will operate between Vaughan Metropolitan Centre and St. George Station with one person crews on Sundays.
Track and Watermain Construction on Queen
As previously announced, the track on Queen will be rebuilt between Bay and Fennings (near Dovercourt). Work will be done in stages with complete shutdowns of the street including auto access and curb lane CafeTO installations. For ongoing details, please refer to the City of Toronto’s page for this project, and pop open the “Construction Phases and Details” tab.
The TTC has been upgrading the overhead wiring on Queen for pantograph operation from Parliament Street westward, and it is reasonable to hope that once the track project passes McCaul Street, the 501 streetcars can return to Queen from their current diversion via Parliament and King. There is no announced date for this.
Watermain Construction on Broadview Avenue
For those who might have been wondering about the lack of activity on Broadview, the problem was a widespread shortage of materials and this deferred the start of the watermain replacement. Work began recently working north from Hogarth toward Danforth. The southern part of this project, to Gerrard, will follow.
The TTC plans to replace the track on Broadview between Gerrard and Danforth in 2022. In the previous round, a little over two decades ago, the street was rebuilt to modern standards with a full concrete base and steel ties. Only the top layer of concrete will have to be removed, and the rails will be installed onto the existing ties and foundation. The same type of work is now underway on Queen.
The cycle time for track replacement is measured in decades, and we have now reached the point where most of the tangent (straight) rails are laid on a modern foundation. Intersections started later, and so there is still some special work where more extensive reconstruction is needed. Renewal projects on modern track are simpler because the street does not have to be excavated to the depth of a new foundation.
King-Queen-Queensway-Roncesvalles Project
The changeover to the Phase 2 configuration was originally anticipated for Wednesday, July 21, but the project is running late and this has been deferred.
When the area is ready, the replacement bus services on King and Queen will be reconfigured as shown in the map below, and track work will shift to the King Street leg of the intersection.
Service on the 501/301 Queen bus will run through east-west on Queen on the normal route rather than diverting via Dufferin and King.
The 504C King shuttle will amalgamate the existing Roncesvalles and King West shuttles into one route between Dundas West Station and Princes’ Gates Loop. 504C buses will run westbound via Queen, eastbound via Triller and King.
Updated July 20, 2021 at 11:00 am: A reader asked in the comments why a street further west was not used for the westbound trips to shift north from King to Queen so that bidirectional service could be provided on more of King Street. The TTC replied:
Wilson Park and Beatty were not acceptable for use by buses for the following reasons:
• Both Wilson Park and Beatty are narrow one-way roads. There is on-street parking on the west side of both roads which severely limits clearances for buses on these roads and leaves little room for error which is a safety concern.
• TTC’s Policy On Traffic Calming And Speed Humps opposes transit service on roads with speed bumps. Similar to many side streets west of Dufferin that were considered for potential use, Wilson Park and Beatty were eliminated as options since both roads have speed bumps.
In addition to Wilson Park and Beatty, TTC evaluated every road west of Dufferin as a potential turnaround option. Unfortunately, it was determined that none of the roads were suitable for a safe bus operations as similar clearance issues were present on each of these roads. As a result, we determined the only suitable option for northbound bus operations was Dufferin Street.
Email from Stuart Green, TTC Media Relations, July 20, 2021
Four routes in Scarborough benefit from the introduction of reserved lanes on Eglinton Avenue East, Kingston Road and Morningside Avenue.
86 Scarborough
186 Scarborough Express
116 Morningside
905 Eglinton East Express
In previous articles, I looked at the change in travel times with the onset of covid-era drops in traffic levels beginning in Spring 2020, and the effect of the “red lane” implementation in mid-October 2020. This is an update to bring the review to the end of June 2021.
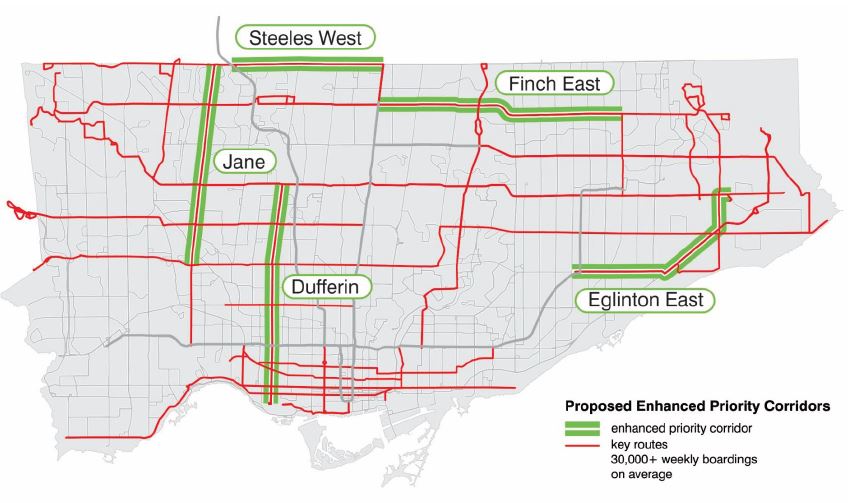
On five other corridors (Jane, Dufferin, Finch East, Steeles West, Lawrence East), there are plans for reserved lanes, although the proposals have not met with universal acclaim. In future articles I will bring the review of their routes’ behaviour up to date. The map below shows the affected routes as proposed in the Service Plan. Lawrence Avenue East was added to this list by the TTC Board.
My underlying premise is that pre-pandemic conditions are a reference point for travel times. Across the entire transit network, traffic congestion and boarding delays fell with the onset of covid. This has been building back gradually, but the effect varies from route to route. There are also external events such as the LRT construction on Finch Avenue West that affect intersecting streets. Finally, the transit red lanes were introduced concurrently with two other changes: the removal of some local stops and the restoration of express service.
This makes identification of the actual cause of shorter travel times more difficult to isolate, and the answer is probably “all of the above”. Each street and route is different, and the benefits, such as they are, of the red lanes should not be assumed to apply on every route segment in the city.
A concurrent issue for transit riders is the dependability of service. It may well be that five minutes is shaved off of their journey with a reserved lane, but if the service is erratic and the wait time for a bus is unpredictable, this benefit can be sabotaged. The situation is further complicated by a mix of local and express buses. If an express can serve a rider’s planned trip, it might save time thanks both to the red lanes and to the fewer stops enroute. However, if the likely wait for an express bus exceeds the time saving (and desire for certainty), a local bus could prove “faster” if it shows up first.
The TTC forever talks about optimization of service and schedule adjustments to make things work better. Problems should be “solved” with schemes like reserved lanes and express buses, so they say. However, headways (the time between buses) continue to be irregular leading to rider frustration and complaints, some of which are due to overcrowding caused by irregular service.
The TTC is good at getting the City to make changes to roads to “improve” service, but not so good at managing the service it has.
The short version of this article is that the red lanes on Eglinton/Kingston/Morningside improved travel times somewhat although we have not yet seen the real test of whether they prevent a return to pre-pandemic, pre-red lane conditions. The benefit varies from route to route, time of day, and day of the week. In spite of the claims that transit priority would lead to more reliable service, gapping and bunching remains a problem on most of the route using the red lane corridor.
This is a key issue for expanding the program: transit priority on its own does not guarantee regularly spaced and, by extension, evenly loaded vehicles.
A Note About Data
Since the idea of the red lanes first appeared, I began to collect data on the proposed routes. This was complicated by a few factors:
The red lanes, aka RapidTO, were proposed in the Service Plan issued in December 2019, before the pandemic. In anticipation of studying their benefit, I began collecting vehicle tracking data for the affected routes in 2020.
In some cases, because I was already tracking major routes, I had data from April 2018, but there is a big gap until late 2019 because this was the conversion period from the old CIS tracking system to the new Vision system. Data extracts were not available from Vision until late 2019. Therefore, I have very little pre-2020 data that is recent enough to be used for comparison.
With the effects of the pandemic on traffic and riding levels in 2020, the travel times are no longer representative of worst case conditions. A silver lining is that for the period when traffic was very light, this gives a best case situation for transit travel, in effect setting a bound on the improvement we could expect if we could just make the traffic disappear.
Almost all 900-series Express routes were dropped in Spring 2020, and they have only slowly been returning (more are planned later in 2021 or early 2022 including a few new routes). Therefore an express-vs-local comparison is not available on all corridors.
Before the Express network existed, express trips (typically the “E” branch of a route) ran with the same route number and their data are mixed together with the local trips. It was not practical to attempt to fish the express trips out of the tracking data in part because local and express runs did not always make their trips as scheduled, and this varied from day to day. Some buses alternated between making express and local trips. Therefore, data from 2018 represent a mix of times for local and express trips. This understates the time needed for local trips and overstates the value for express trips.
I will not burden the reader with a discussion of the methodology for converting CIS and Vision data to the format used in my analyses. There are two articles on this:
The TTC Board met on July 7 with an agenda that did not attract much debate. The two big items were the CEO’s Report which is usually a jumping off point for general questions about the state of the system, and a presentation on the Osgoode Station “near miss” incident.