
This article completes my analysis of corridors where RapidTO “red lanes” have been installed or proposed to speed bus operations. Previous articles in the series are:
- Red Lanes, Express Buses and Service Reliability in Scarborough
- A Dashboard for Scarborough Red Lanes
- Service Reliability on 35/935 Jane
- Service Reliability of 29/929 Dufferin
- Service Reliability of 60/960 Steeles West
- Service Reliability of 39/939 Finch East
This article reviews travel times and headway reliability (the intervals between buses) primarily through the pandemic era to July 2021 with April 2018 data as a pre-pandemic reference.
The High Points
The reduction in travel times on Lawrence East from mid-March onward was smaller than on some other routes, and this was confined to certain areas and directions. This implies that red lanes would not offer much change during many periods over the route from Don Mills to Starspray as proposed.
A further problem lies in the infrequent service particularly east of the 54B Orton Park scheduled turnback beyond which only half of the scheduled service (plus peak-only express buses) operates. A fully reserved lane is hard to justify if it will not substantially affect travel times and if only a few buses per hour actually use it.
The segment west of Victoria Park includes the DVP interchange where integration of red lanes would be difficult. The time saving from March 2020 onward is small or nil for most of the day.
By far the worst problem on the 54/954 Lawrence East service is headway reliability, and unpredictable gaps in service can contribute far more to journey times than any saving that might arise from reserved lanes. Service leaving Lawrence East Station both ways is very erratic even though this would be a logical place to space service.
The route is subject to congestion and construction delays along Eglinton from Leslie to Yonge, although the schedule is supposed to include extra time to compensate.
Headways inbound from eastern Scarborough are disorganized both at the very outer end, and west of the point where the 54B service merges in. The express service operates on wide-ranging headways to the extent that waiting for the next one to show up could add more to a trip than the time saved by “express” operation.
Average headways on a daily and weekly basis generally follow scheduled values indicating that most or all service is present, and the wide gaps cannot be explained by missing or untracked vehicles.
Existing and Future Service
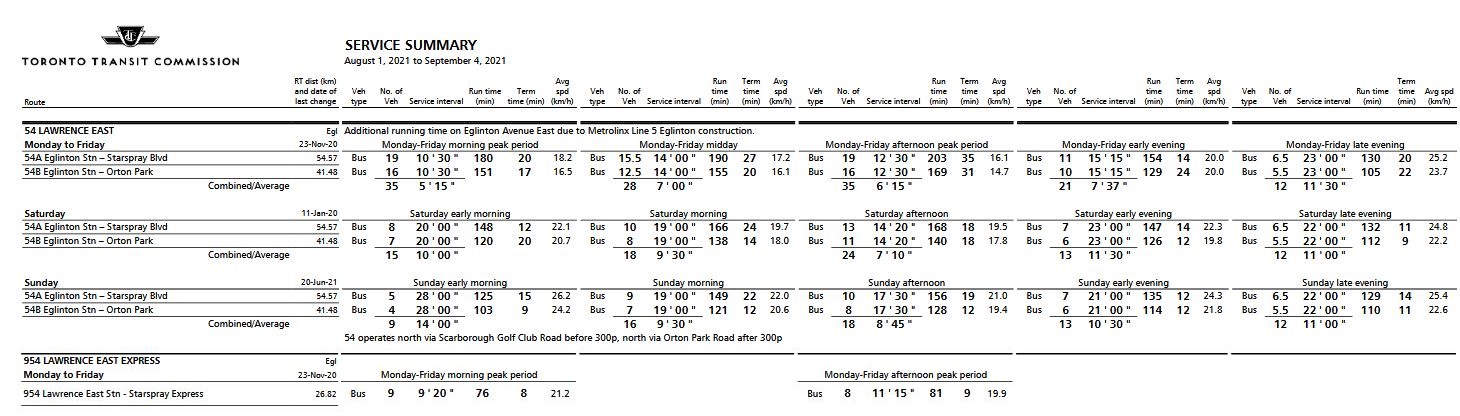
54/954 Lawrence East includes three services:
- 54A local service from Eglinton Station to Starspray Loop at the eastern edge of the city. This is one of the longest routes on the TTC network.
- 54B local service from Eglinton Station to a large loop via Scarborough Golf Club Road, Brimorton Drive and Orton Park Road. The direction of this loop reverses after 3:00 pm.
- 954 express service during peak periods only from Lawrence East Station to Starspray Loop.
The scheduled service for August 2021 is shown in the table below.
As part of the TTC’s 2021 Service Plan, the 54B Orton Park service will be extended to Morningside Avenue, while a new 178 Brimorton route will take over much of the existing Orton Park loop. There is no announced date for this change, and the final route configuration might change from the map below.
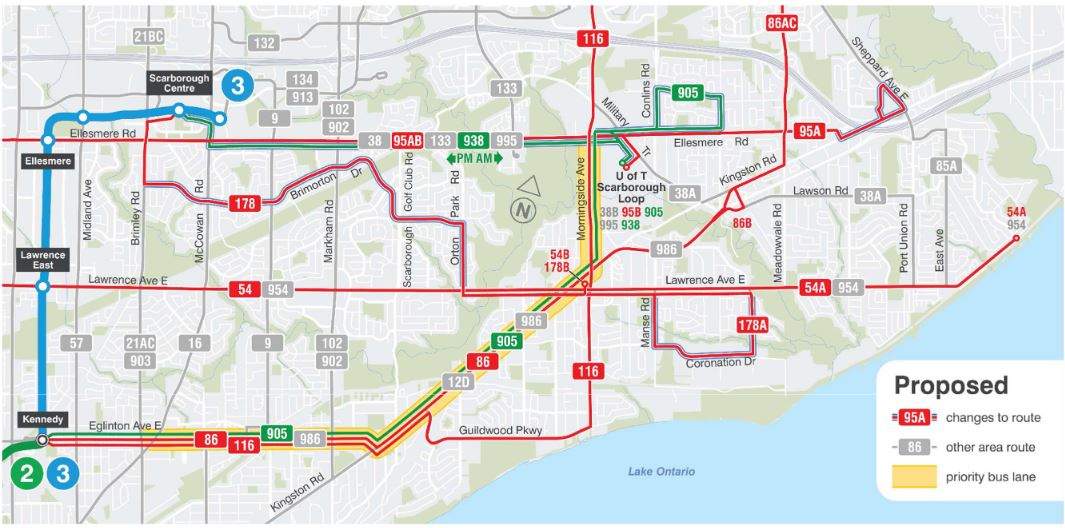
Major changes are proposed as part of the route reorganization for Line 5 Eglinton Crosstown’s opening in 2022 with service on both the 54 and 954 routes originating from Science Centre Station at Don Mills & Eglinton rather than at Eglinton Station.
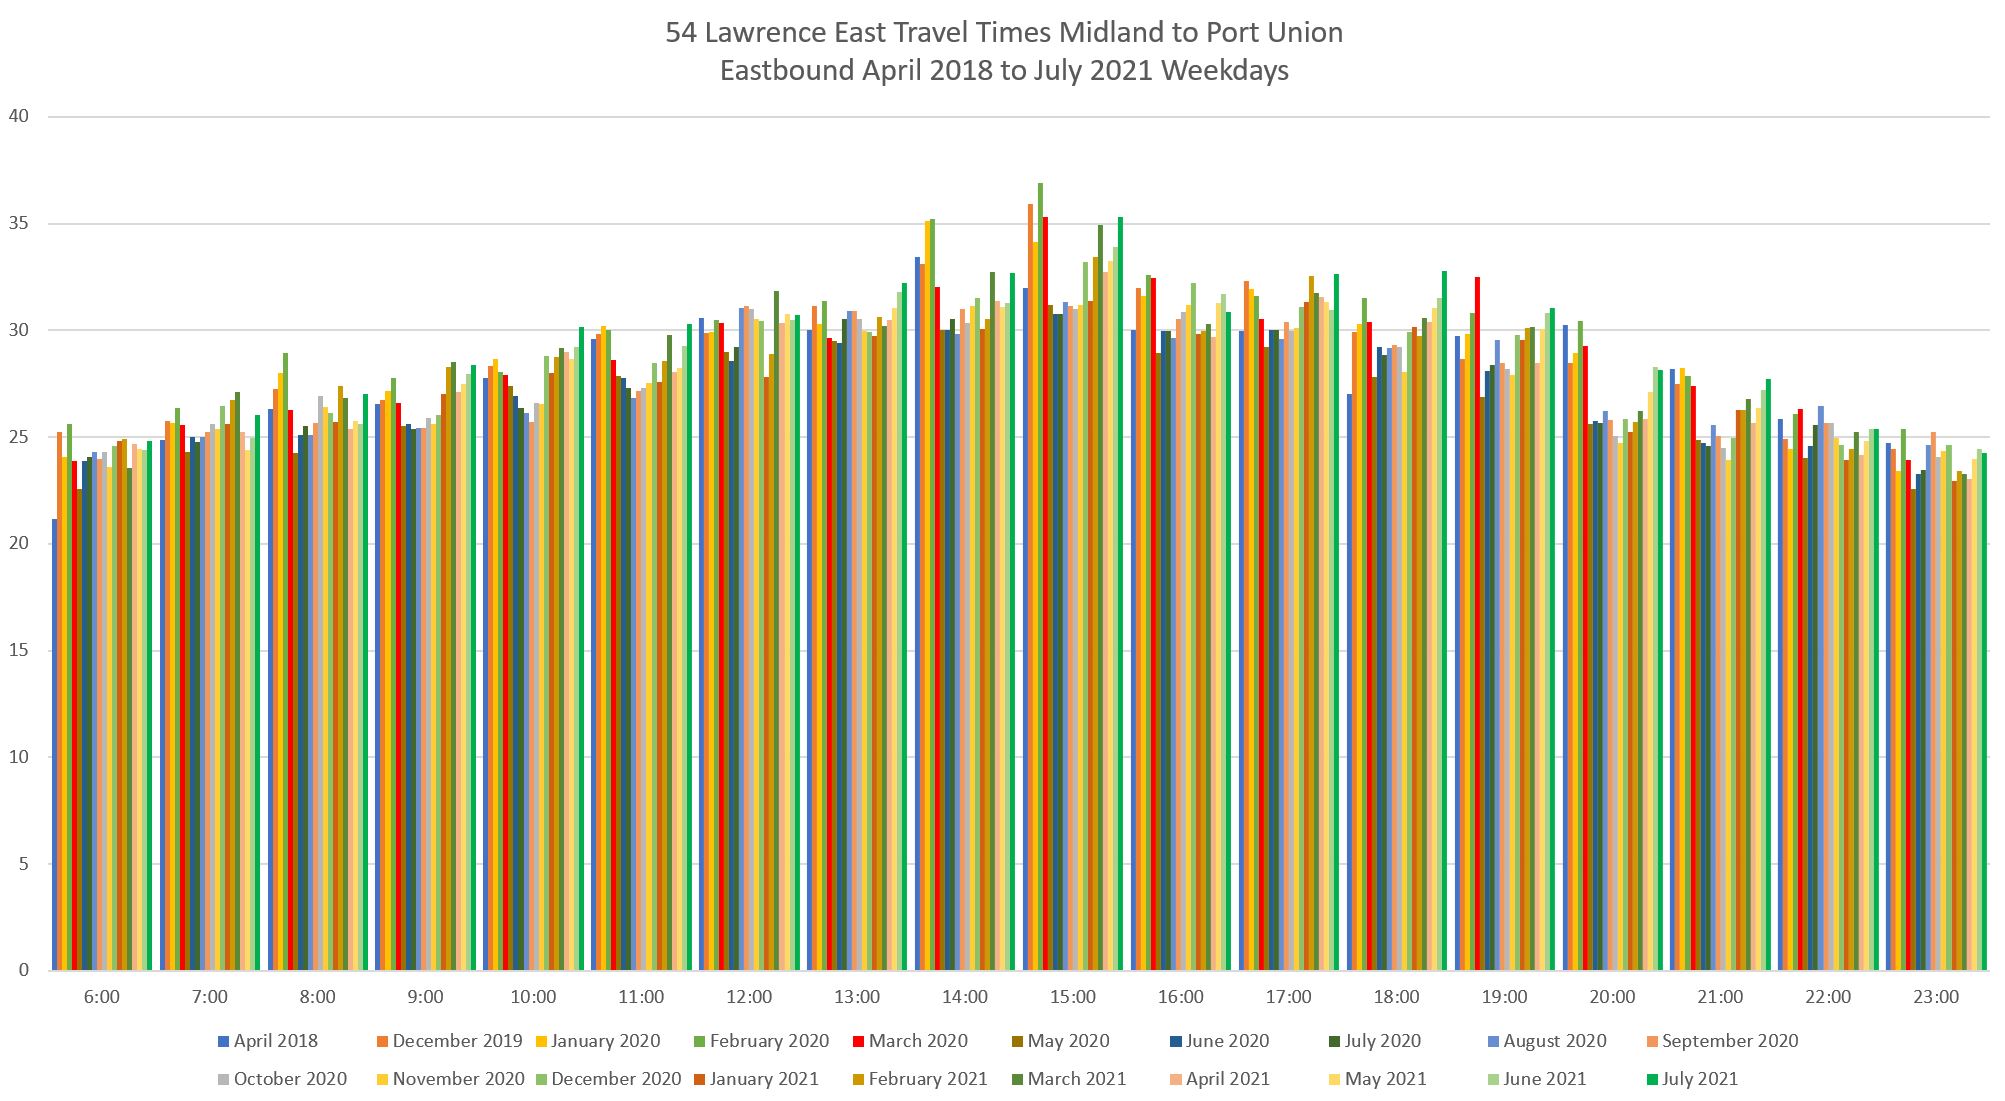
Evolution of Travel Times Between Midland and Port Union
For the eastern part of the route, I have used screenlines at Midland, just east of Lawrence East Station, and at Port Union. Although buses are scheduled travel to Starspray, the location where they take layovers varies considerably and a screenline at that loop does not provide reliable travel times.
March 2020 saw the onset of the pandemic shutdown and decline in ridership. Travel times for weeks 1 and 2 were at historical levels, but they fell through the month to week 5. Express service was canceled after week 3. Note that the change in travel times was only modest, and as later charts will show, this saving was not long-lived.
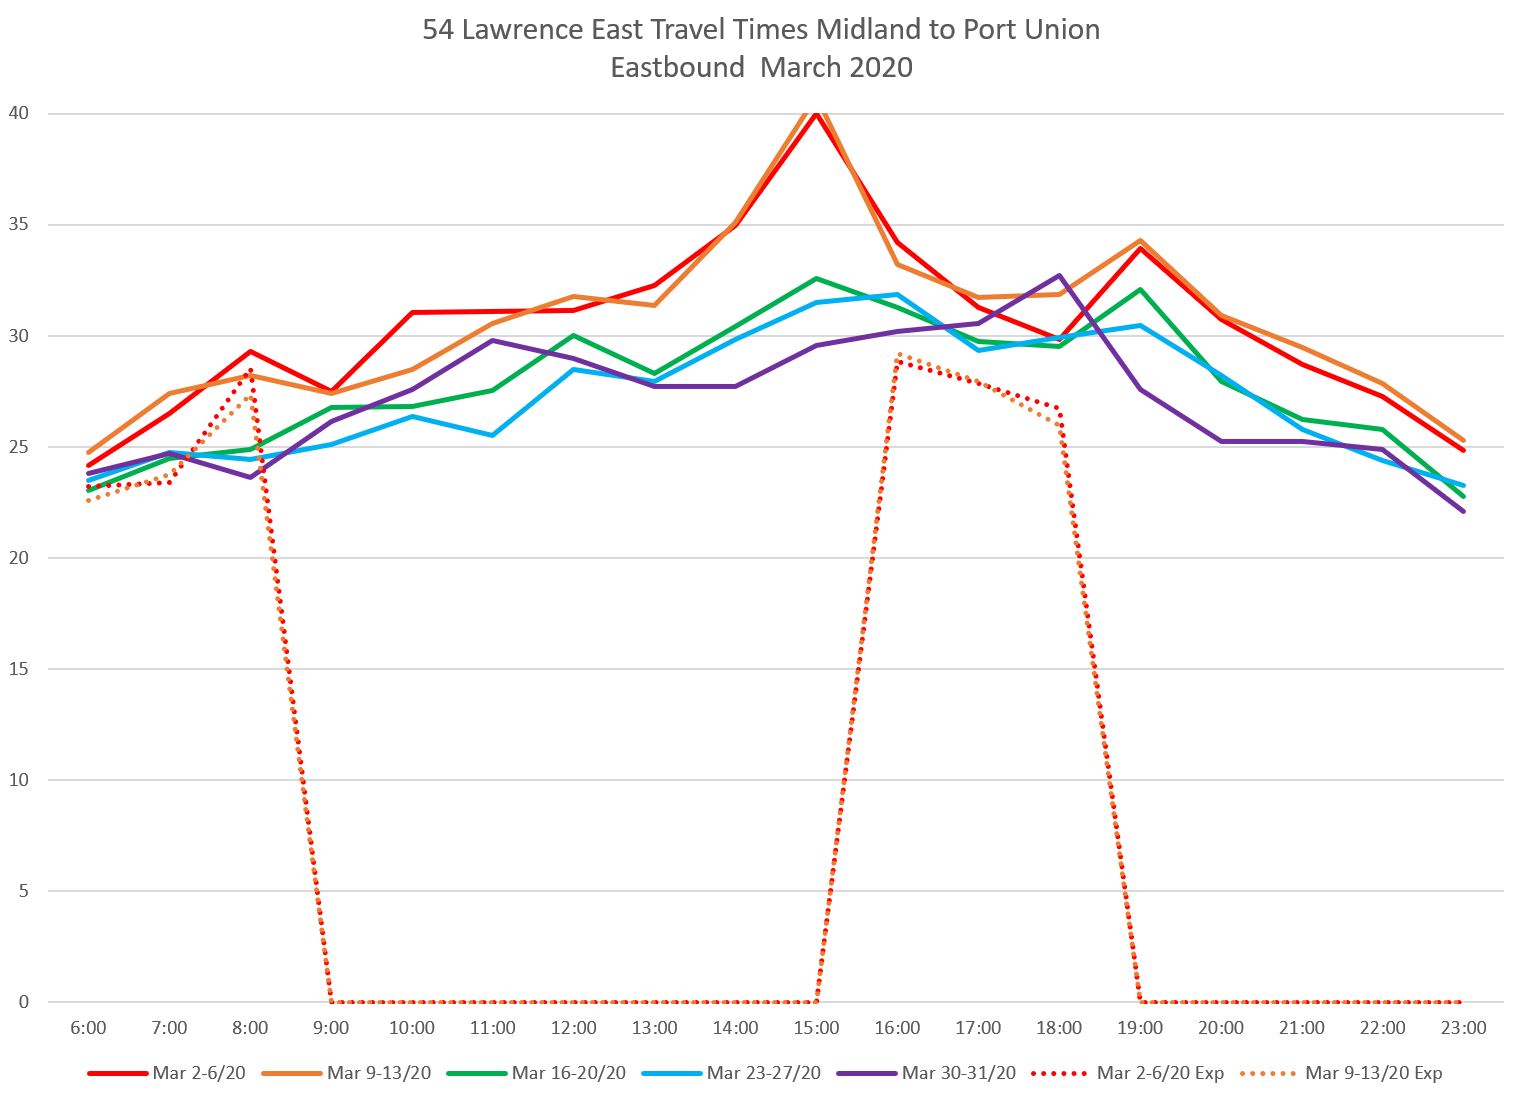
In the pre-pandemic data, there is a clear “afternoon peak” which is not echoed in the morning, especially eastbound.
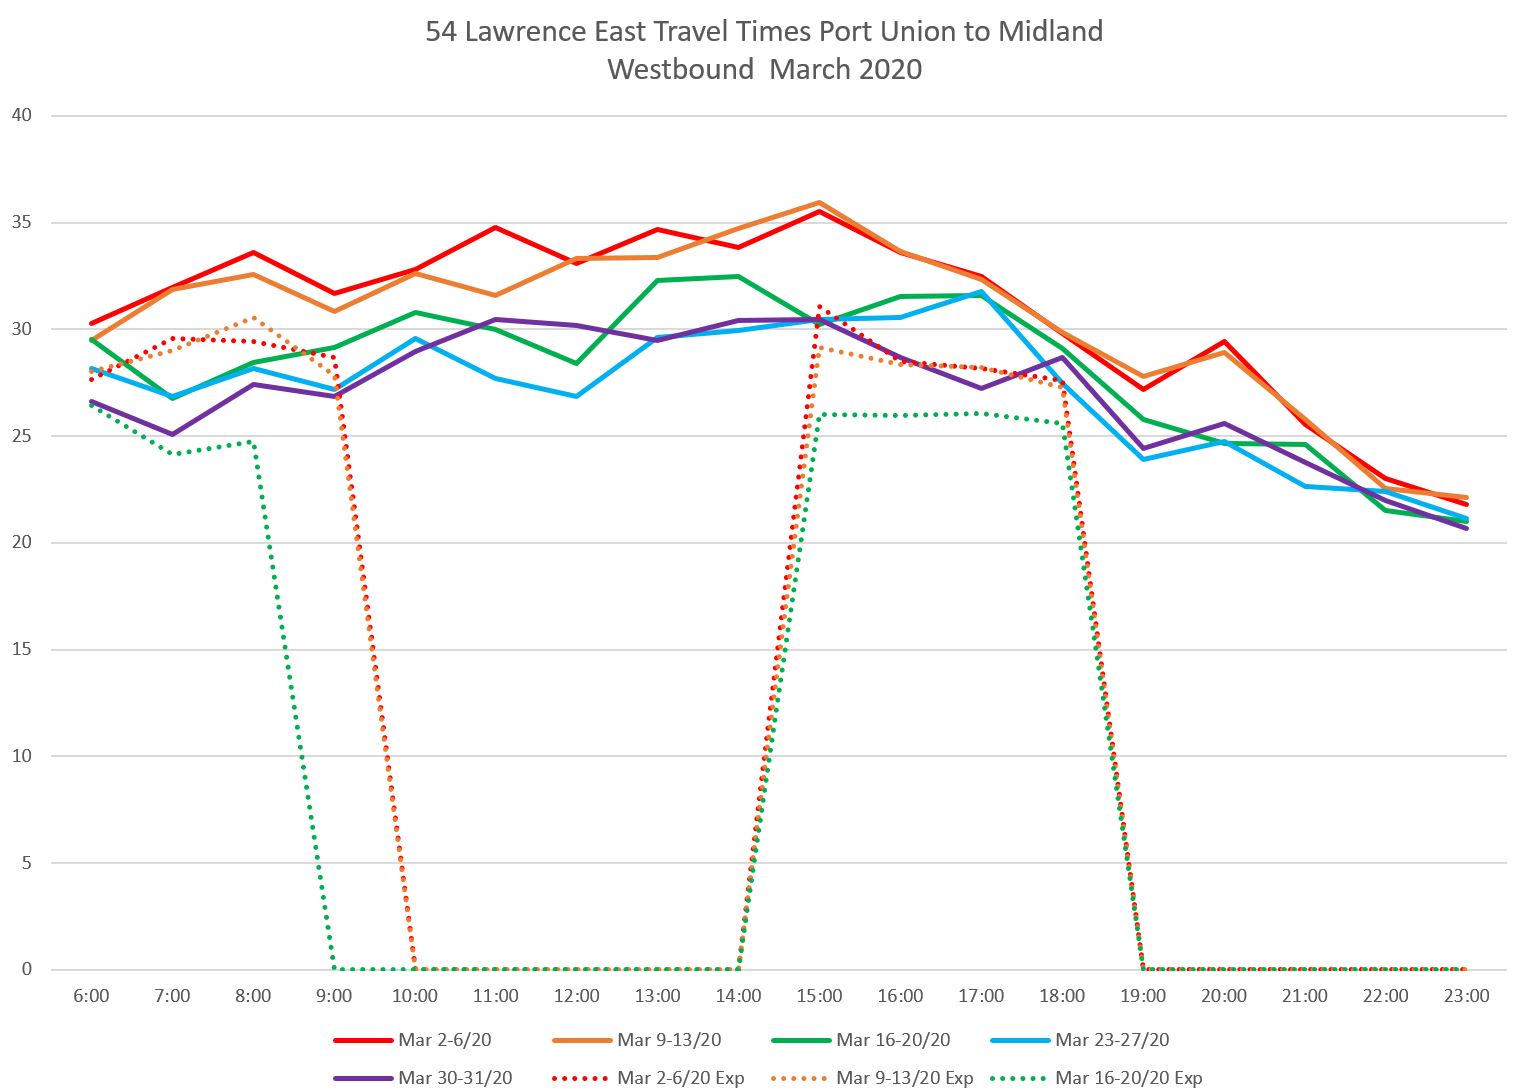
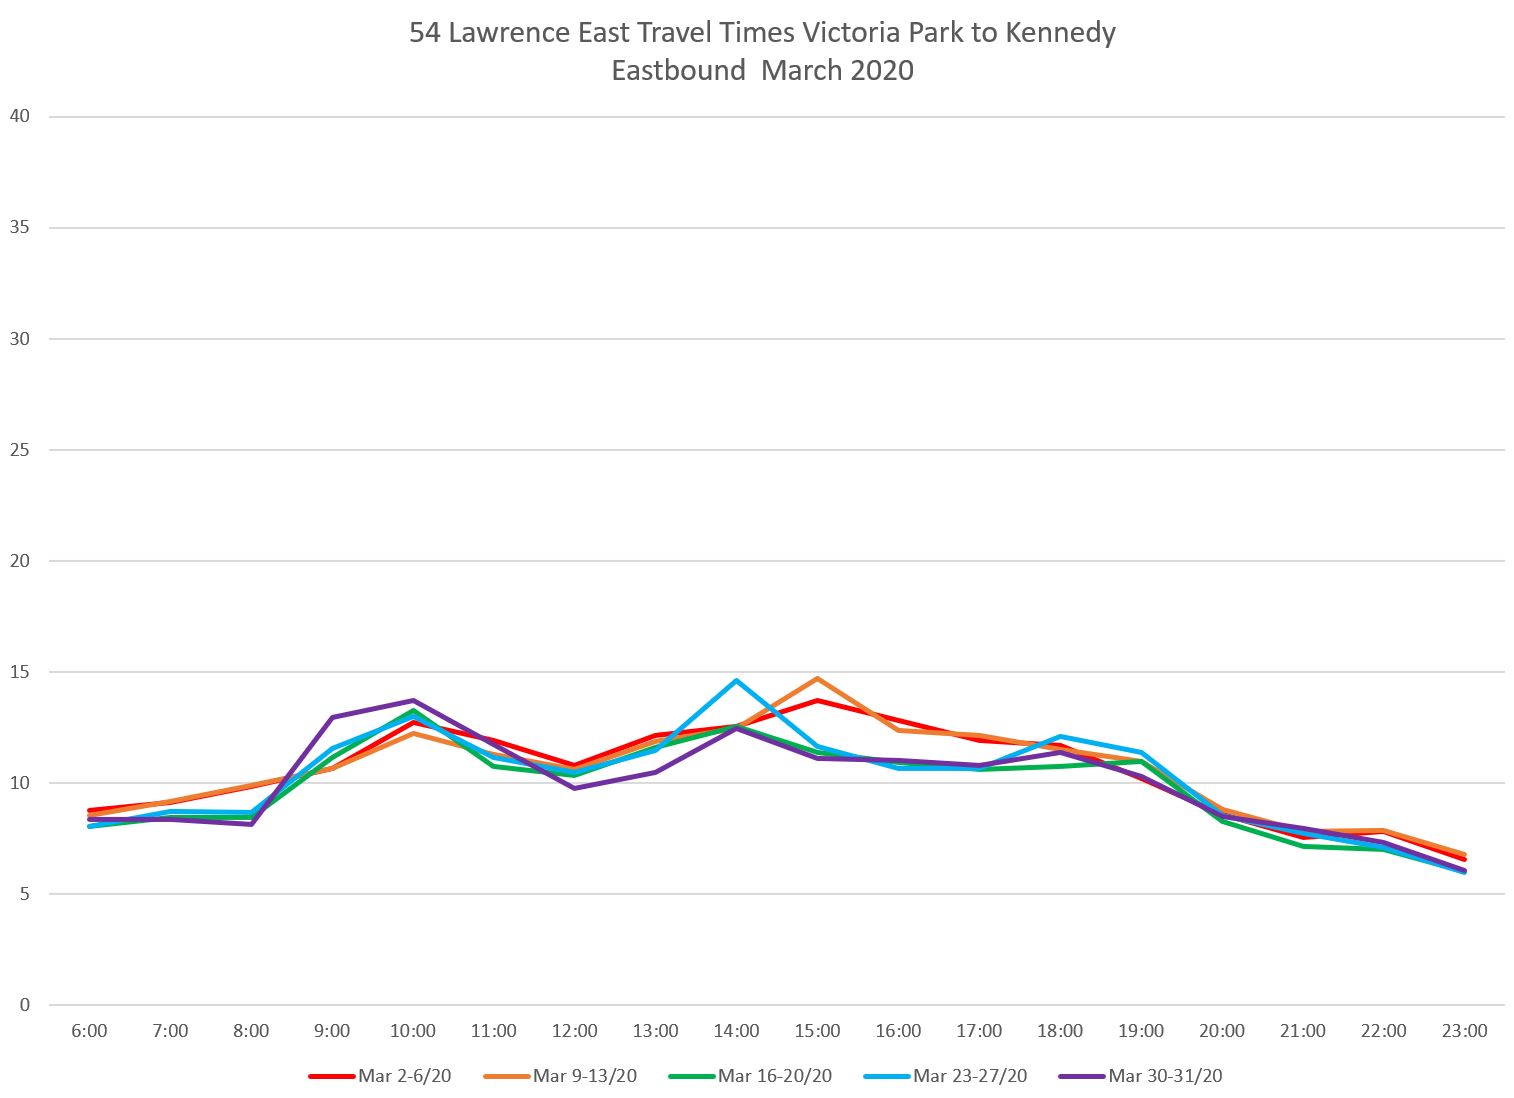
In the following charts, March 2020 is shown in red to mark the point where traffic conditions changed. This would only have a part month of the effect, and the full change can be seen in April’s data. During some periods of the day, the travel times have grown back to pre-pandemic levels.
For eastbound travel, the biggest drop occurs in the period from 2-5 pm which is earlier than the traditional PM peak showing that Lawrence is more affected by traffic conditions in the shoulder peak period. The pre-pandemic afternoon peak was shaved off but is making a re-appearance.
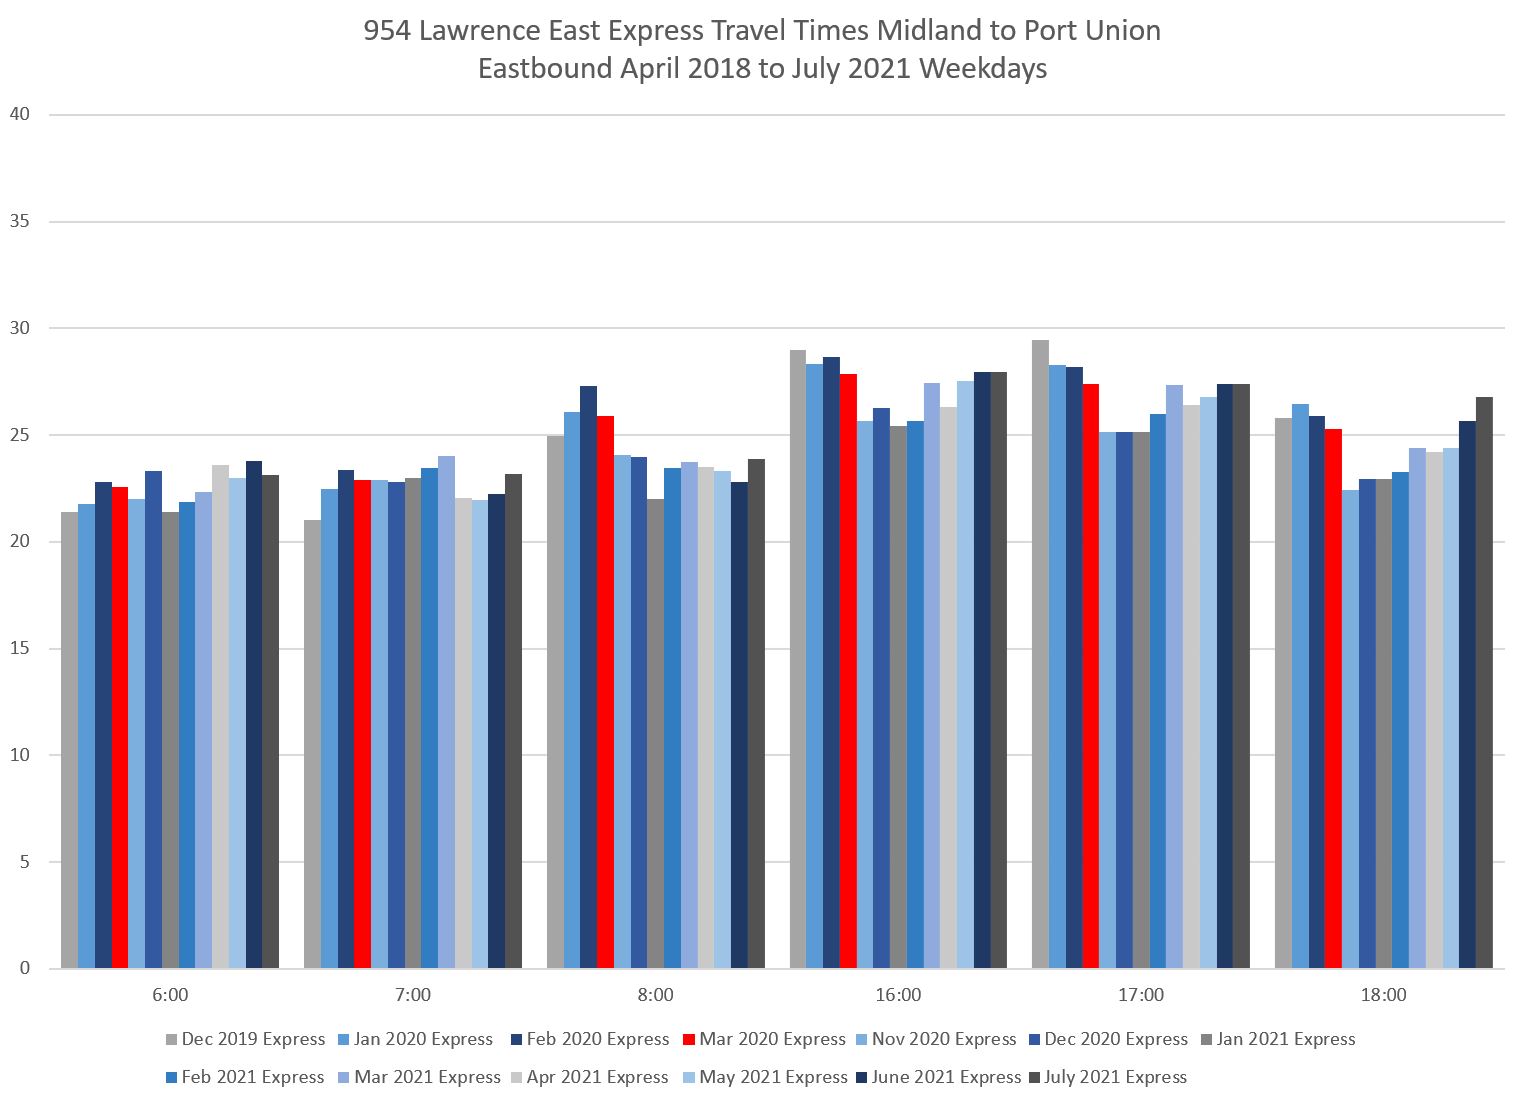
Note that these charts include travel times only for buses operating as 54 local service. The 954 express times are charted separately.
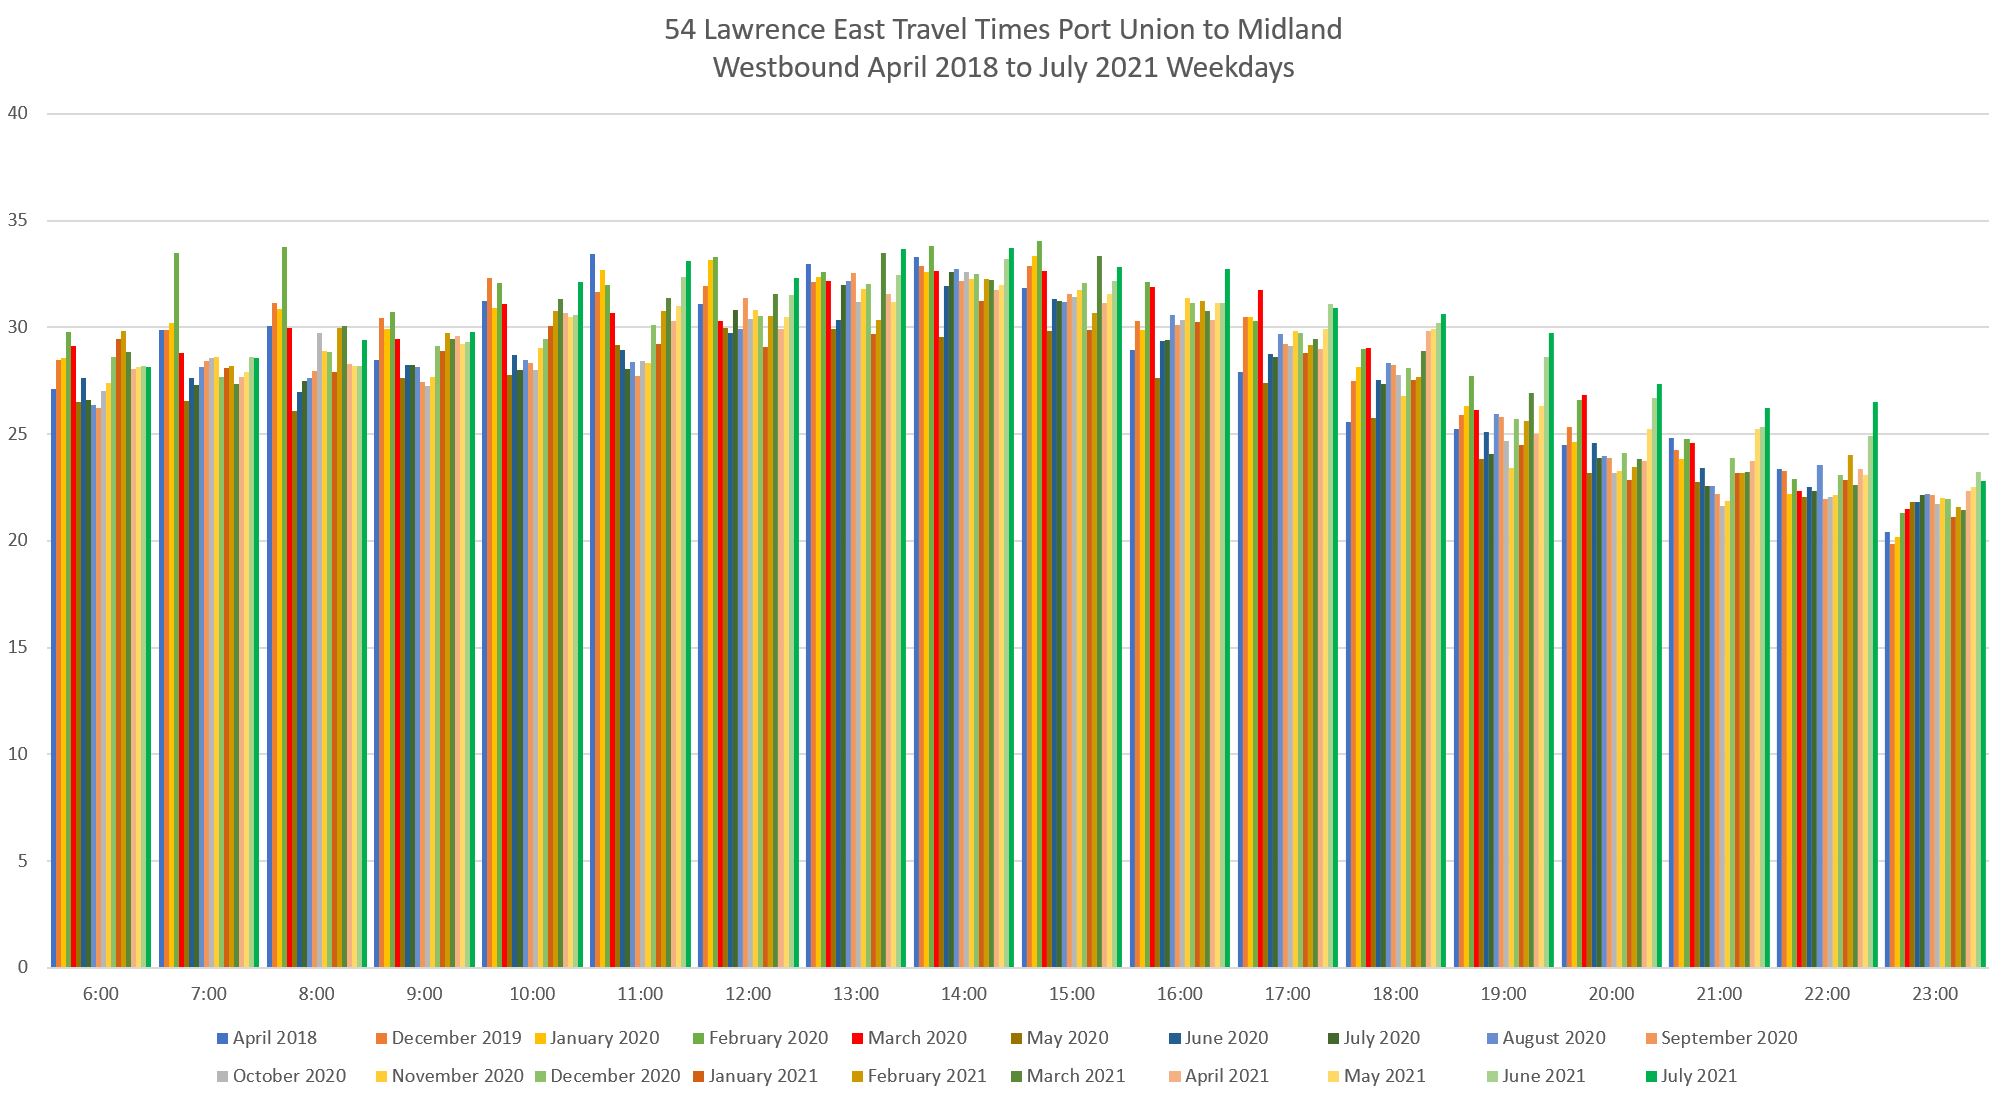
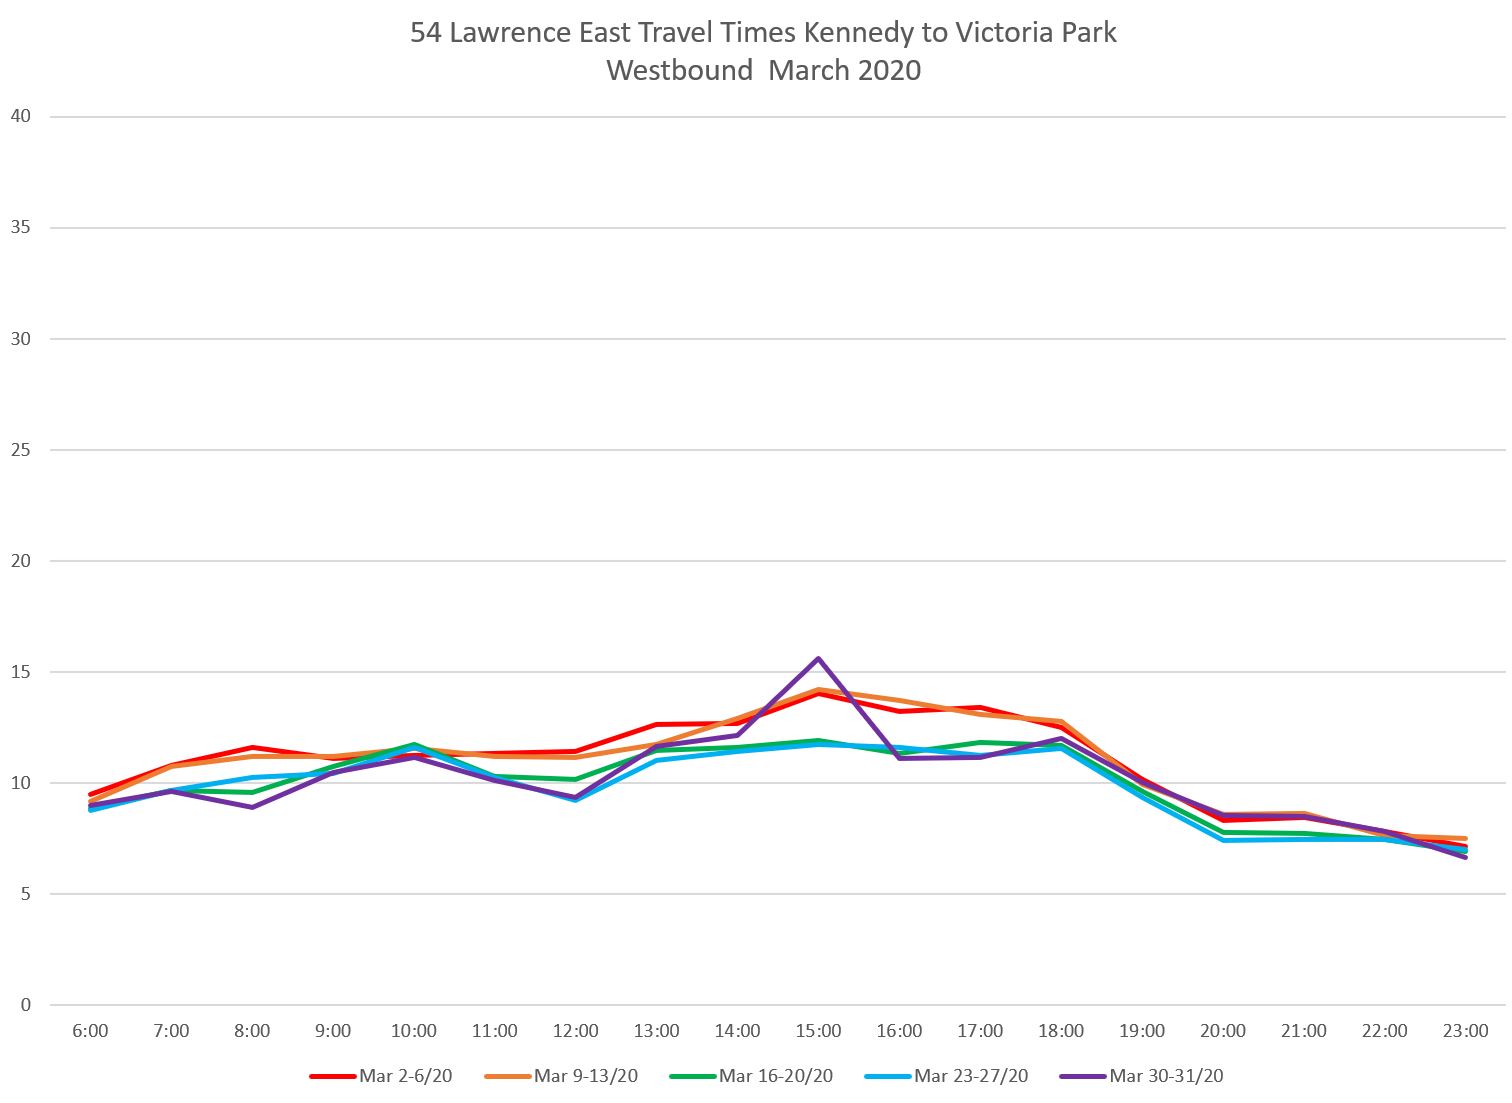
Westbound travel times show their largest drop from 7-9 am, more in line with a tradition AM peak, although it is small by comparison with some other routes. In recent months, travel times are consistently back to or above pre-pandemic levels.
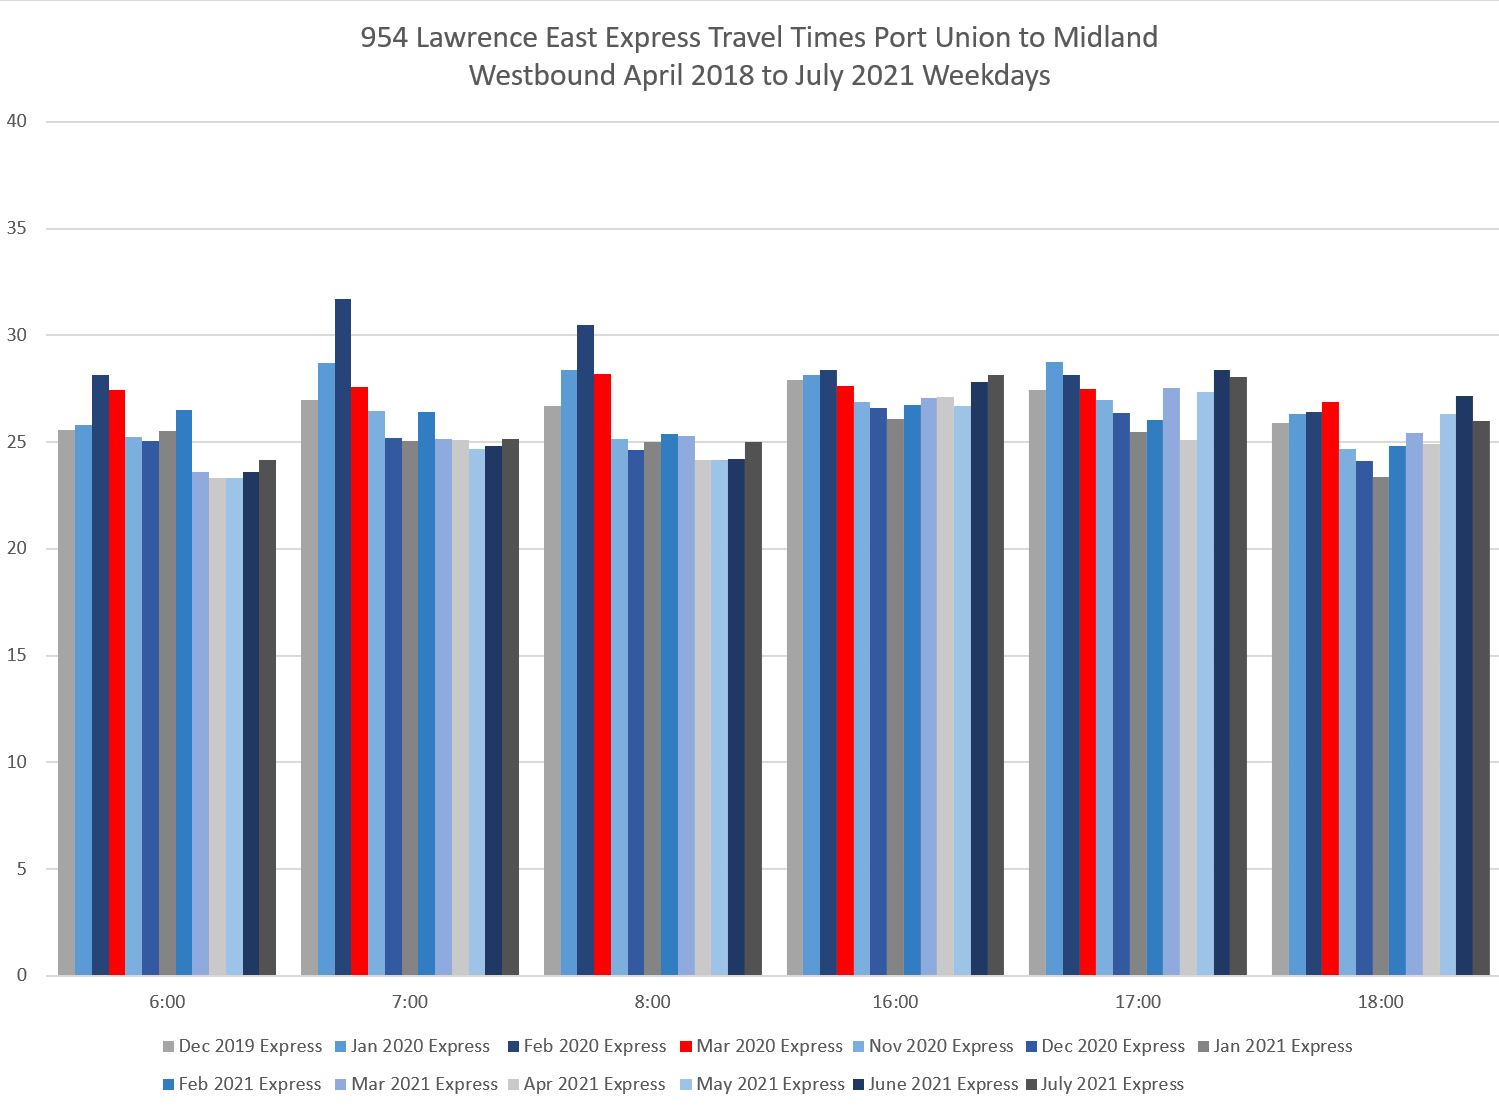
Express service ceased operation in mid-March 2020 and did not resume until November. In the PM peak, travel times are back to pre-pandemic levels, but in the AM peak they remain lower.
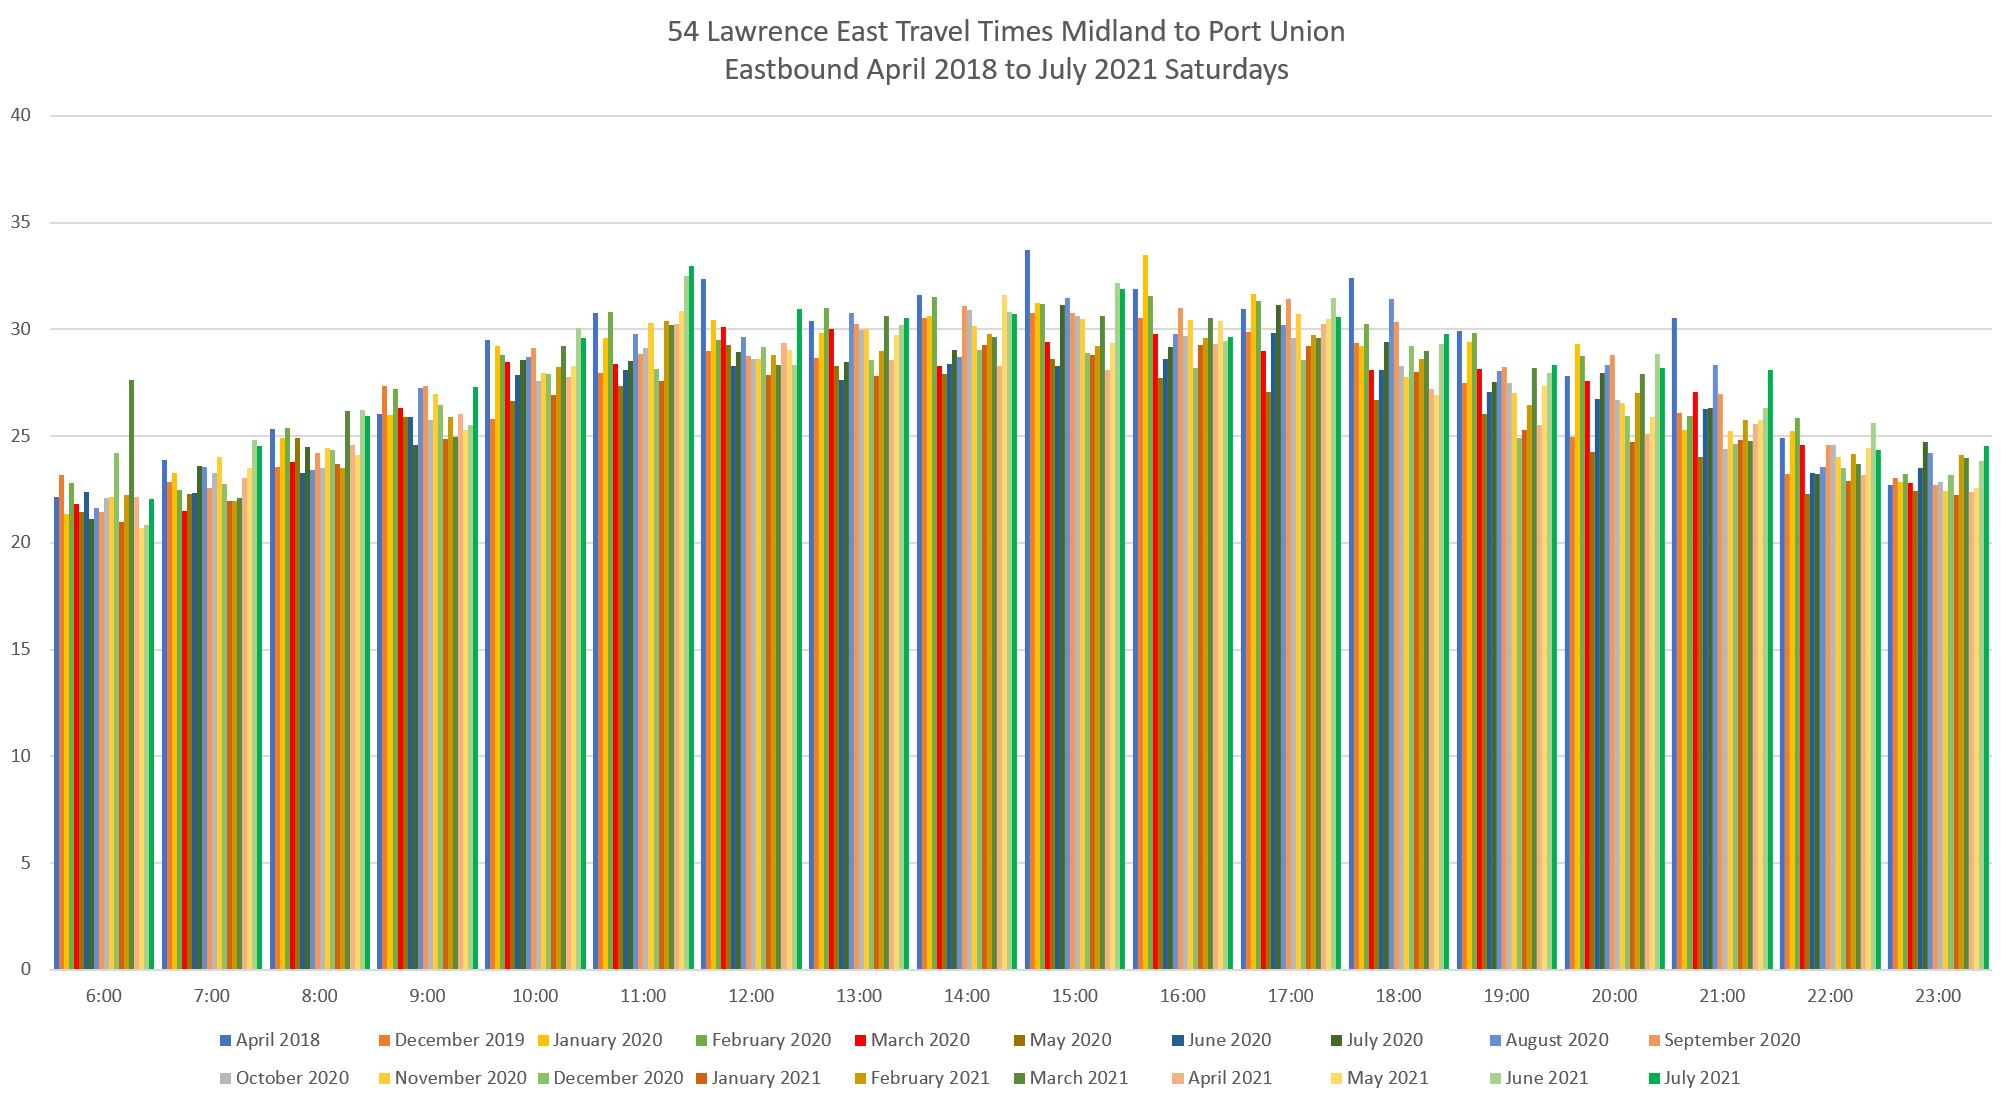
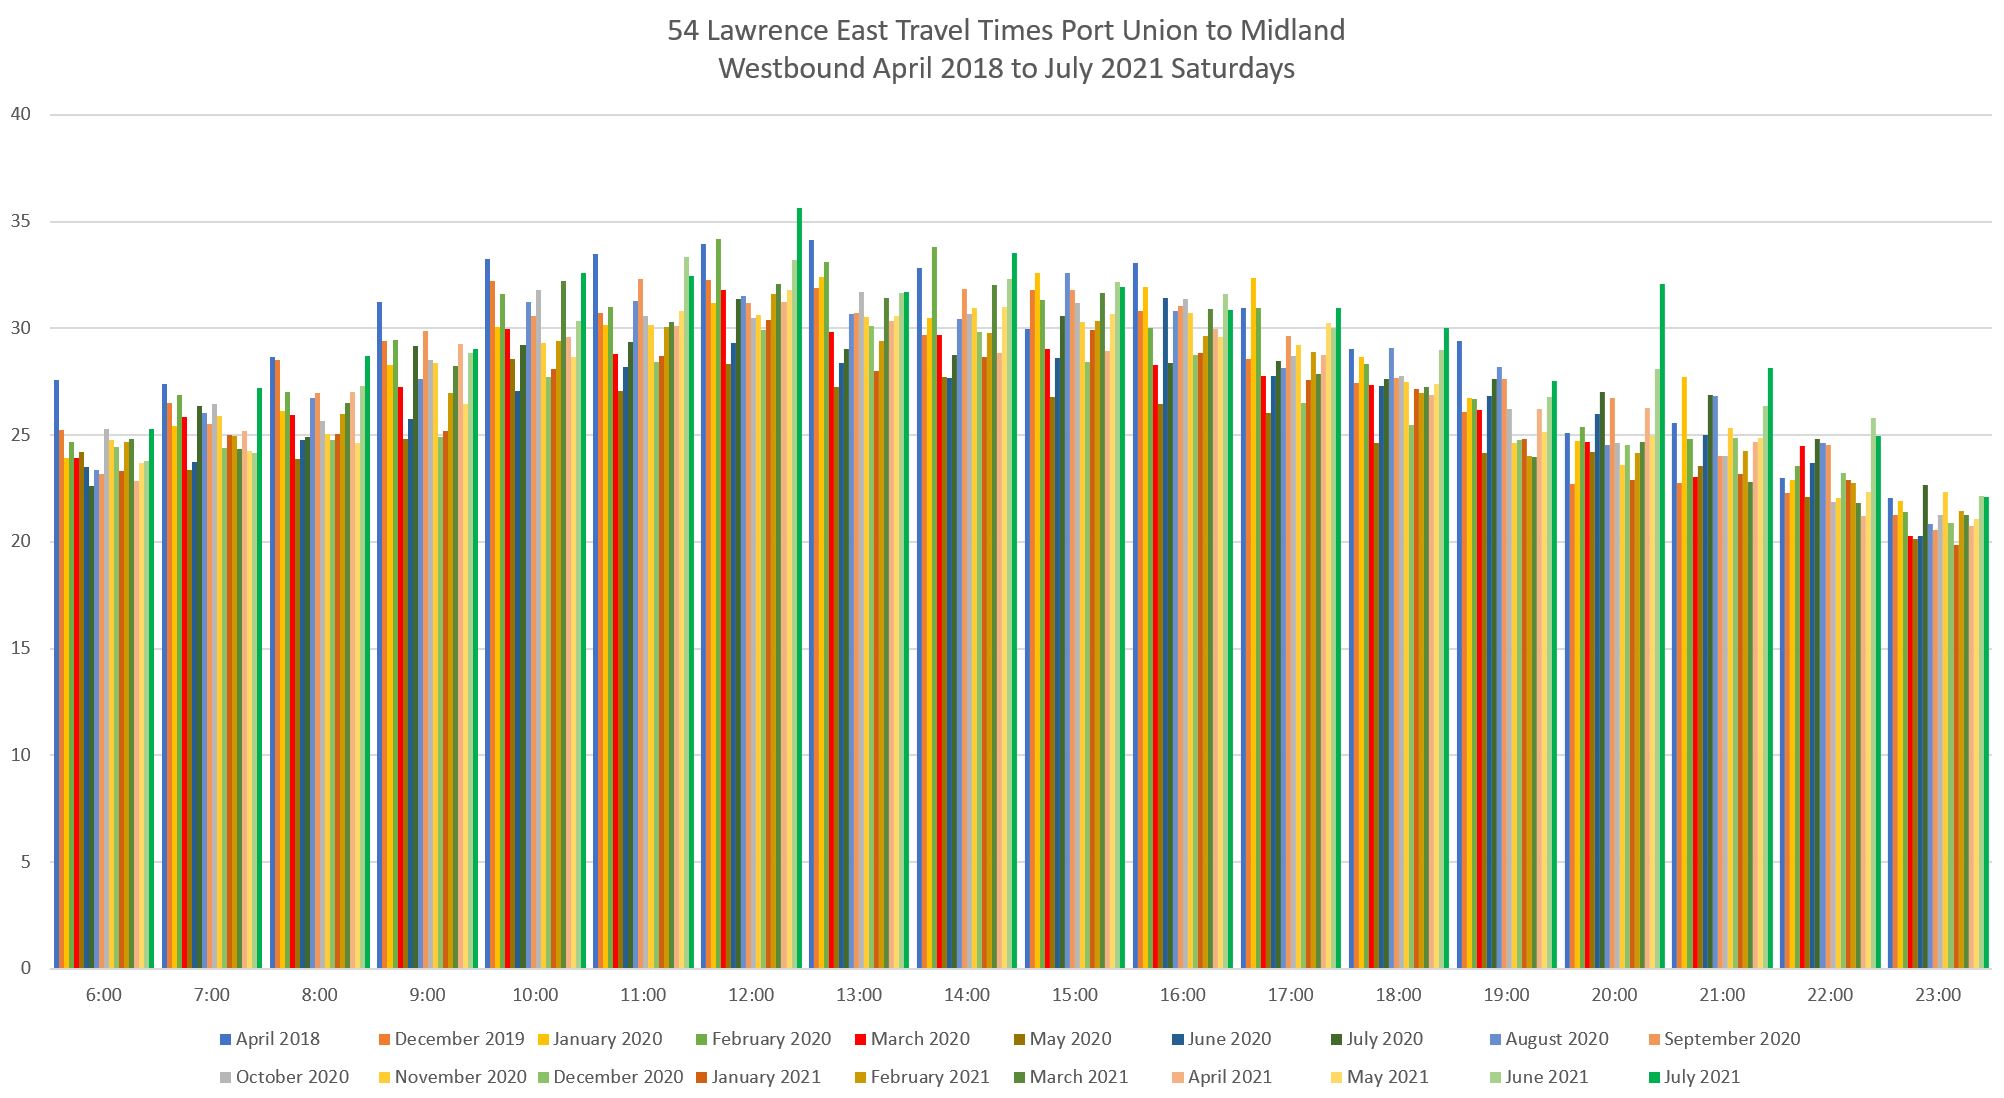
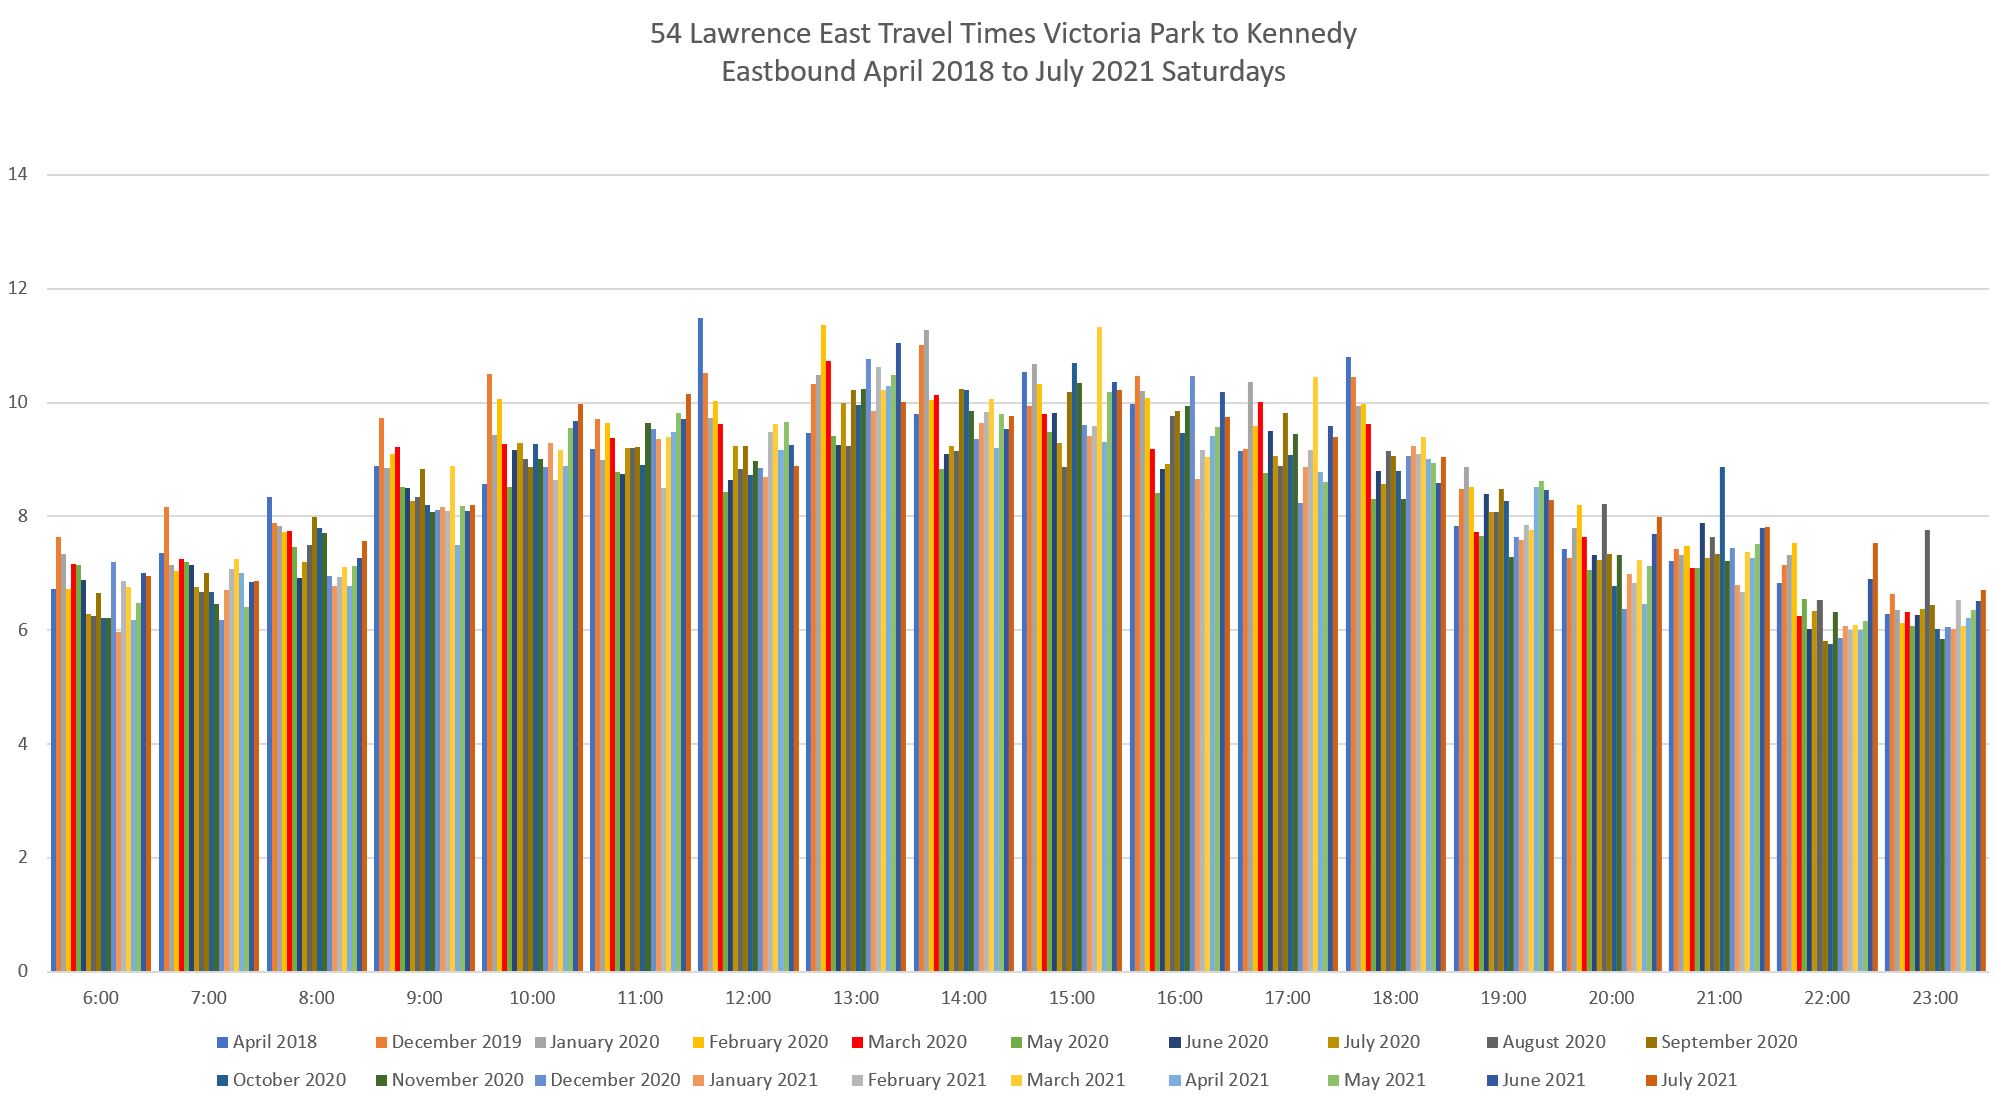
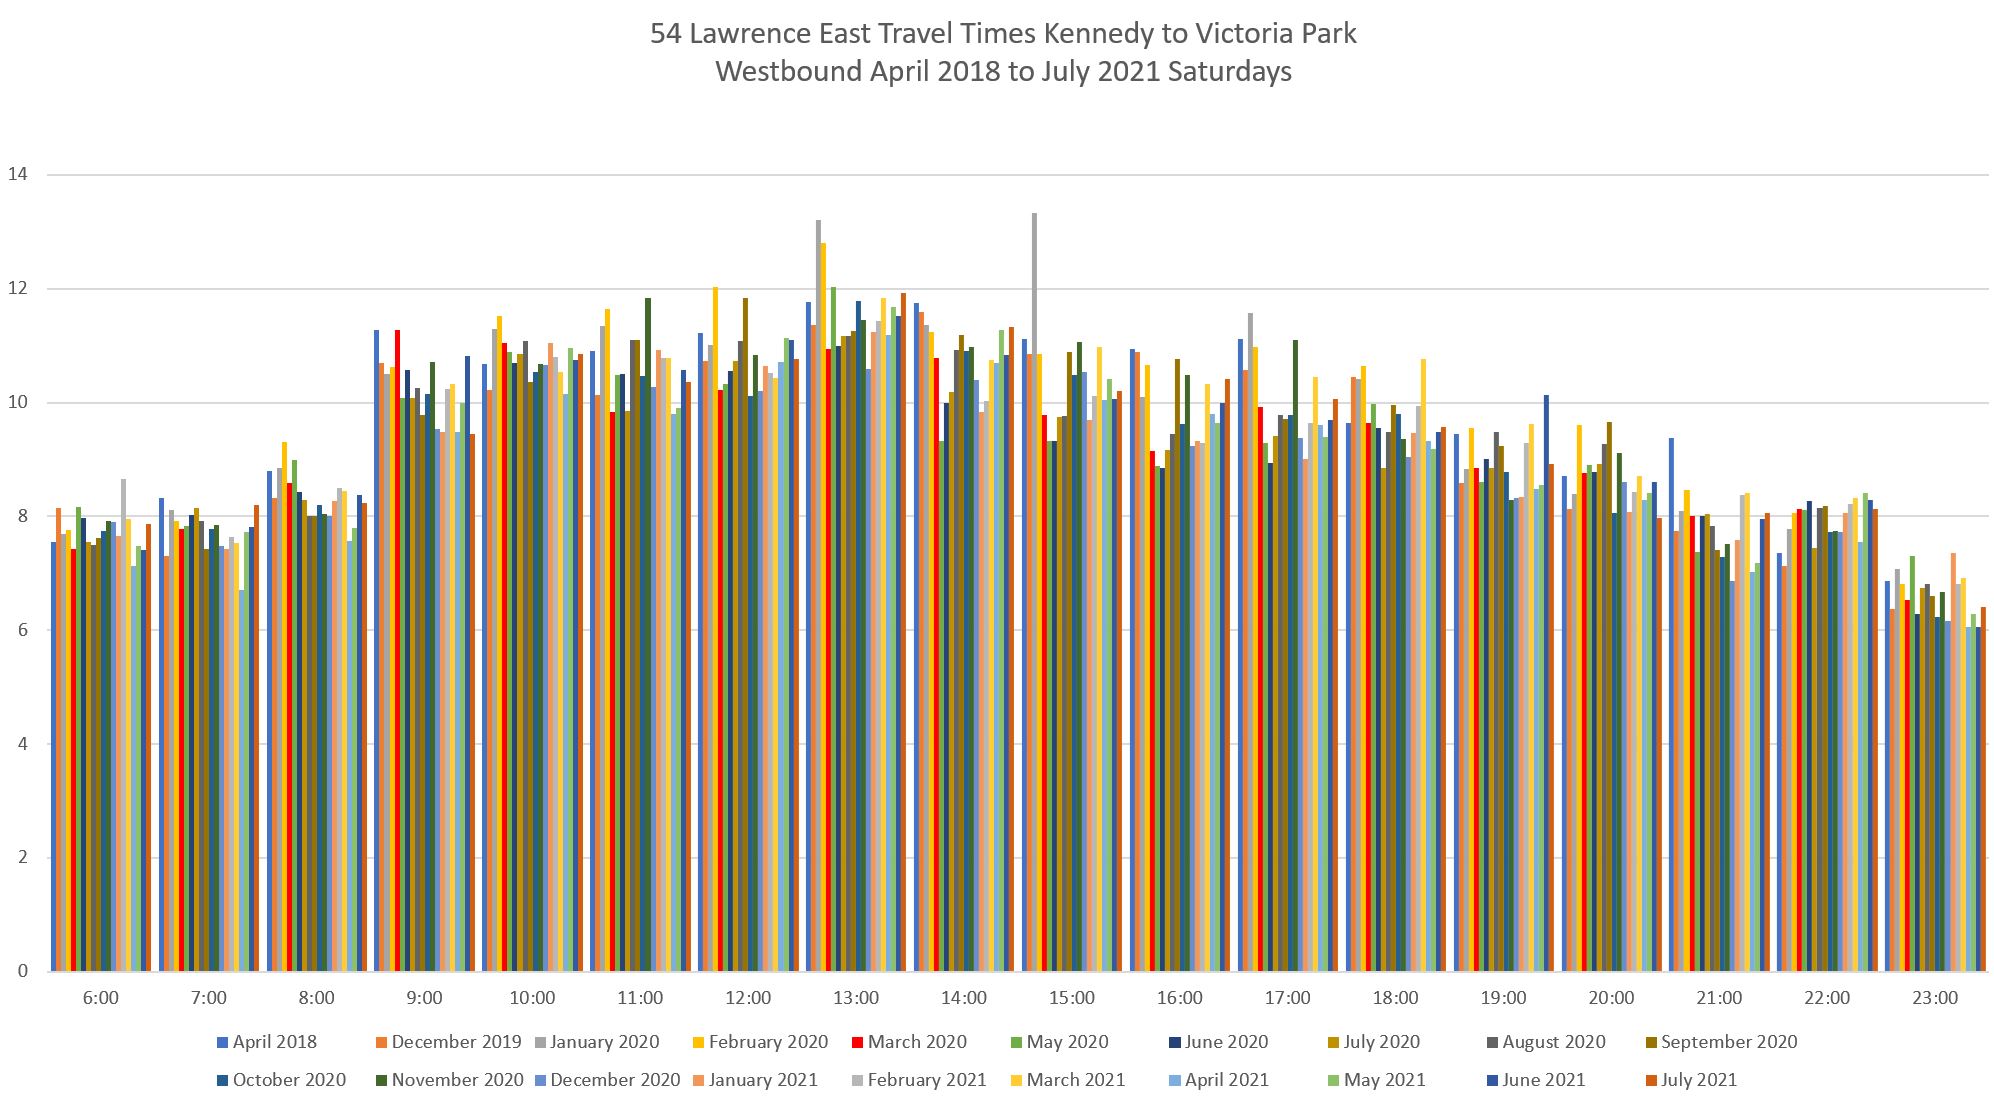
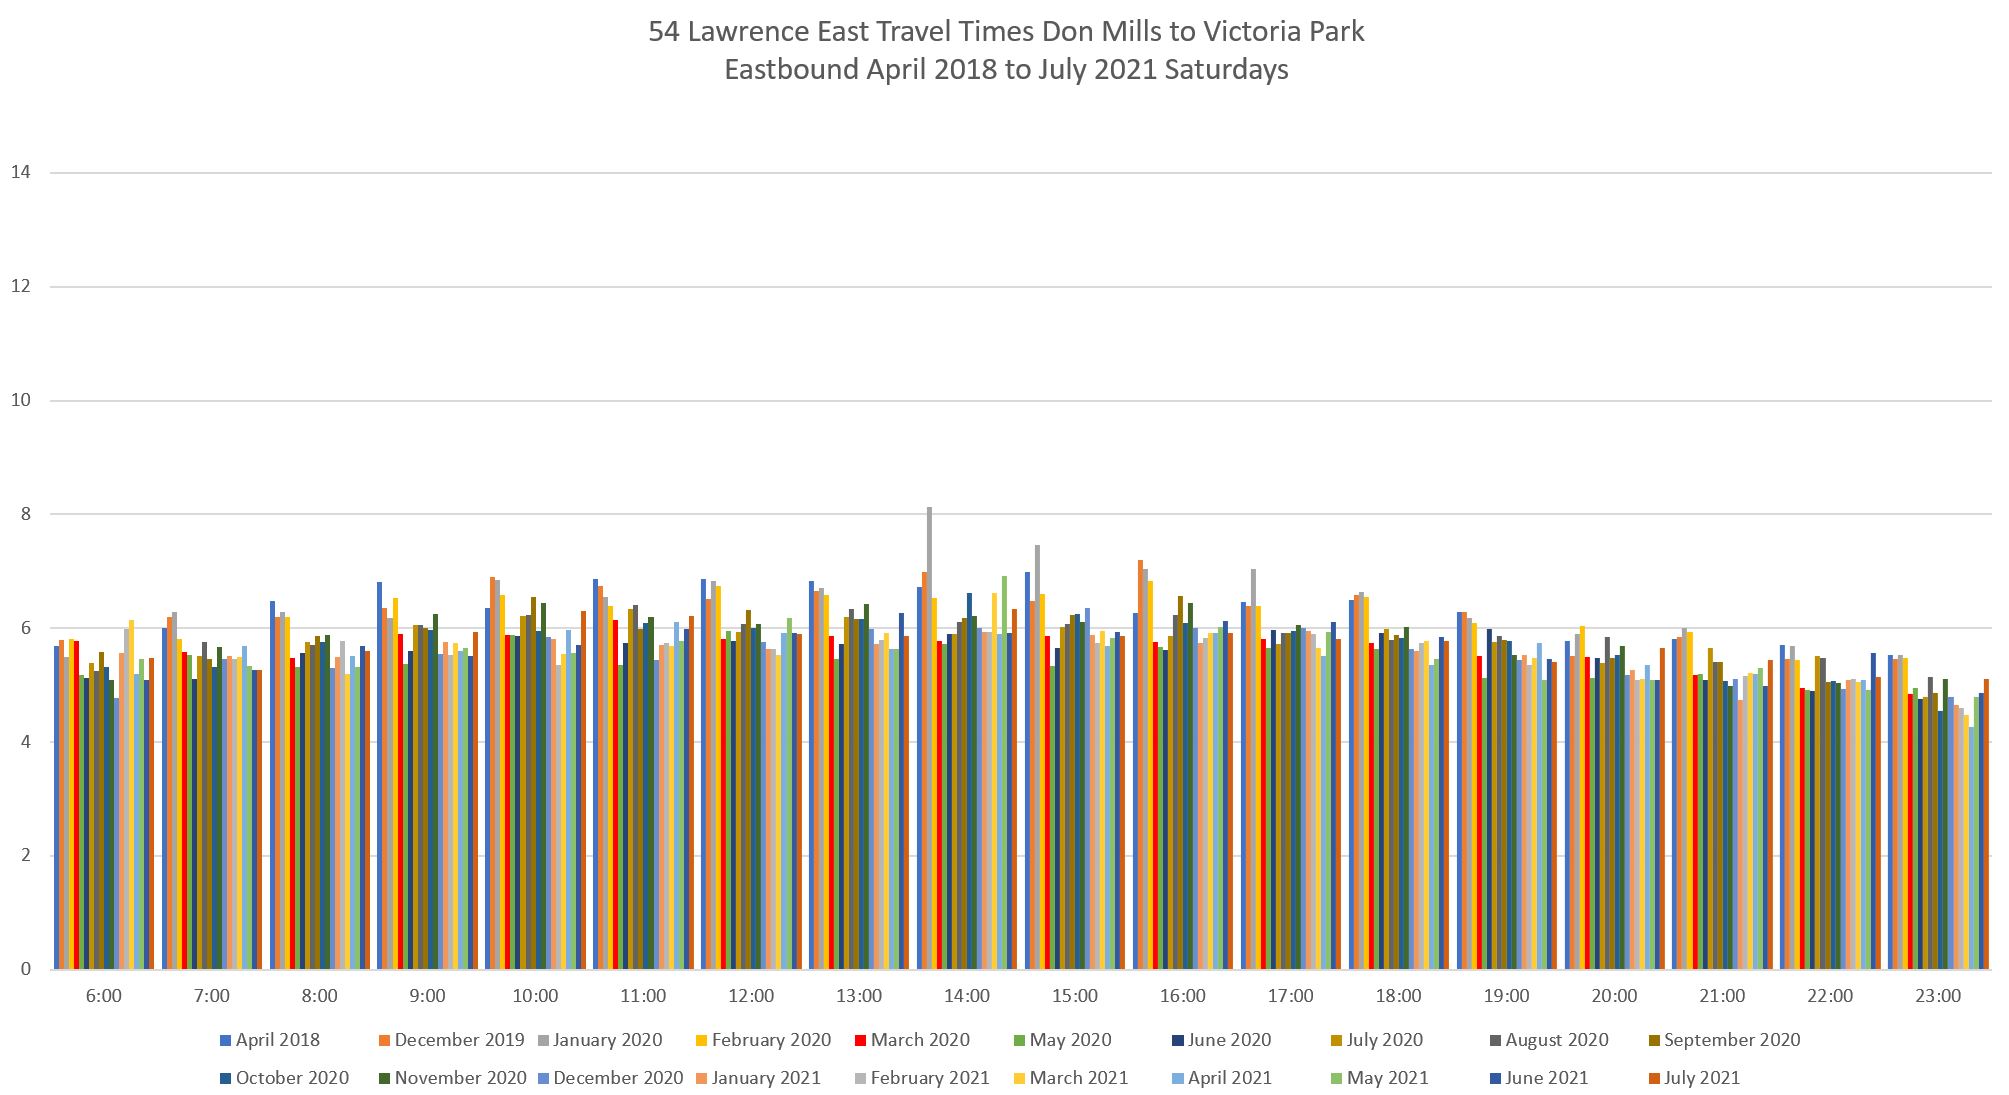
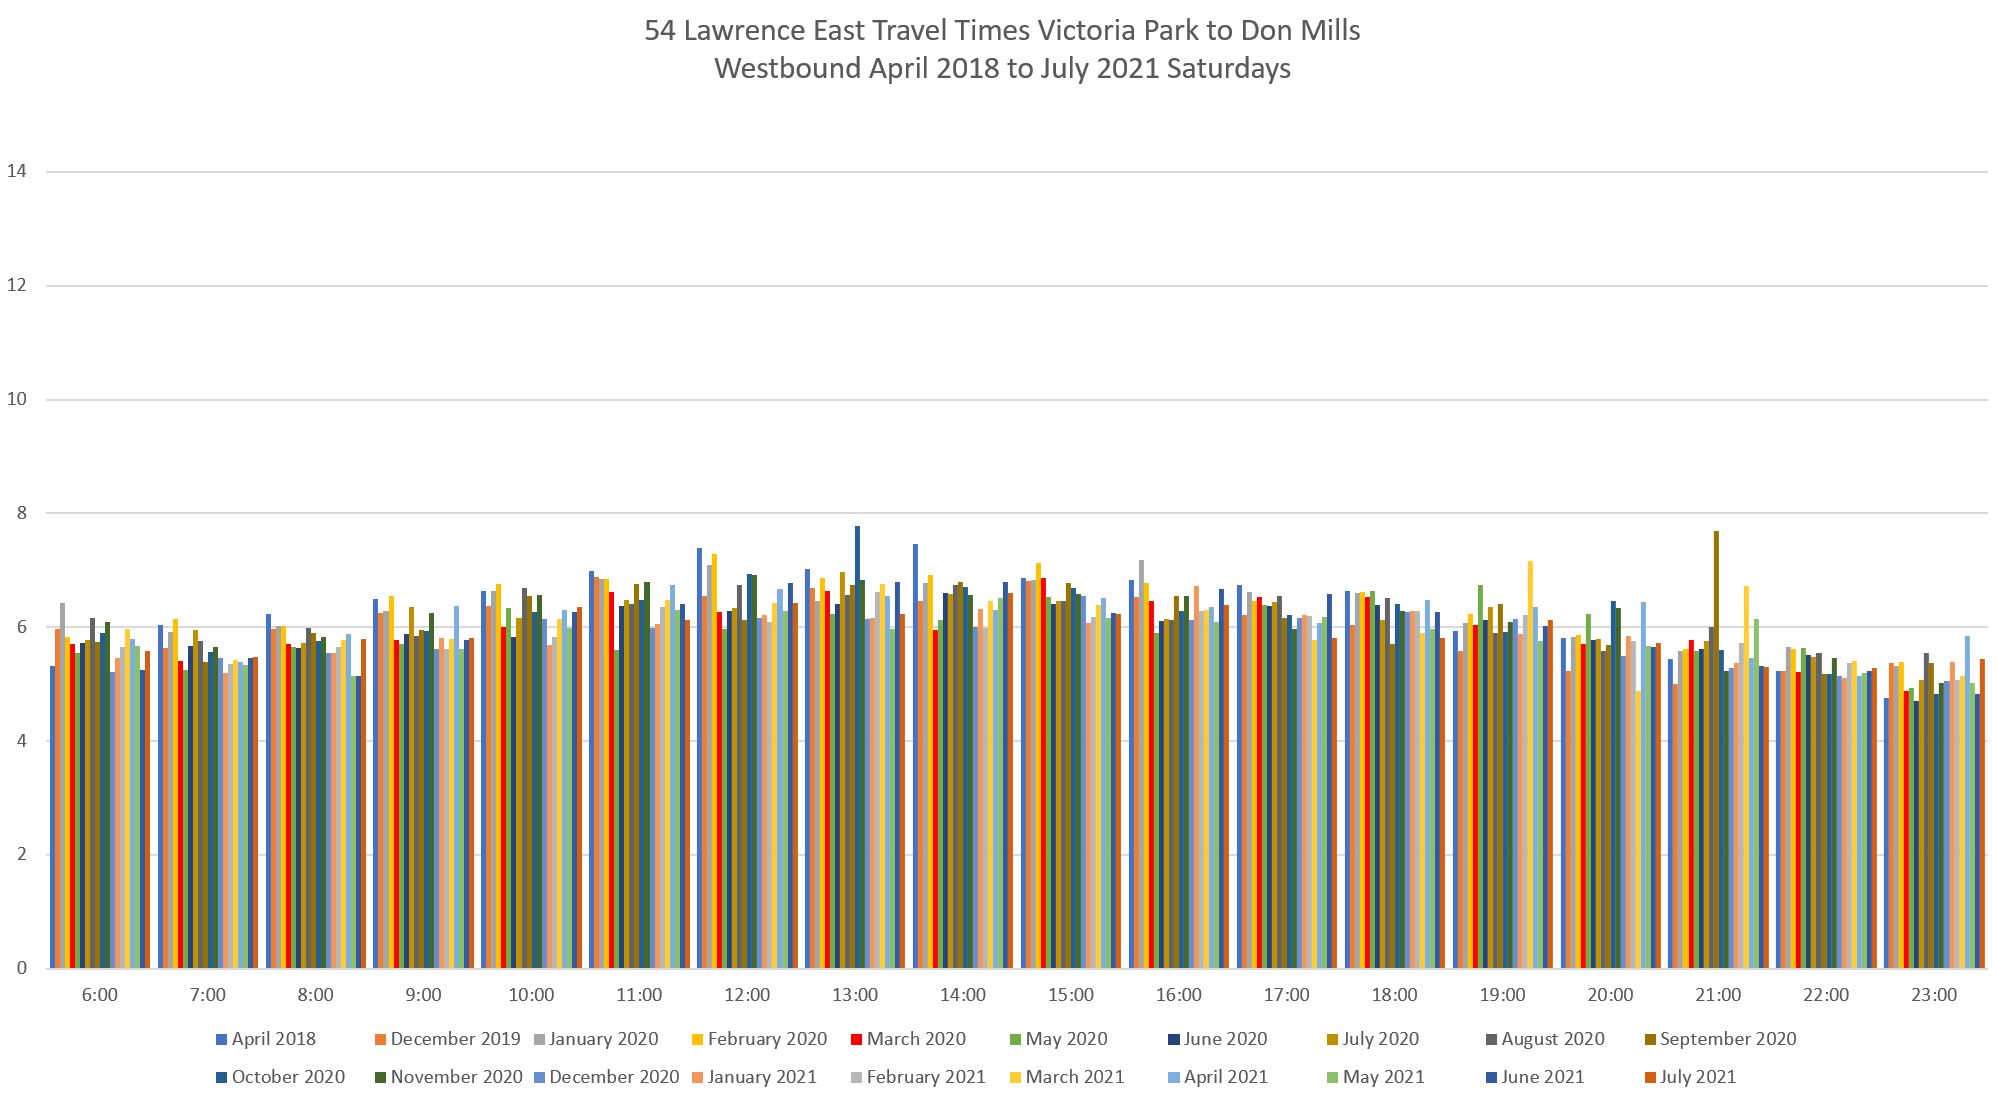
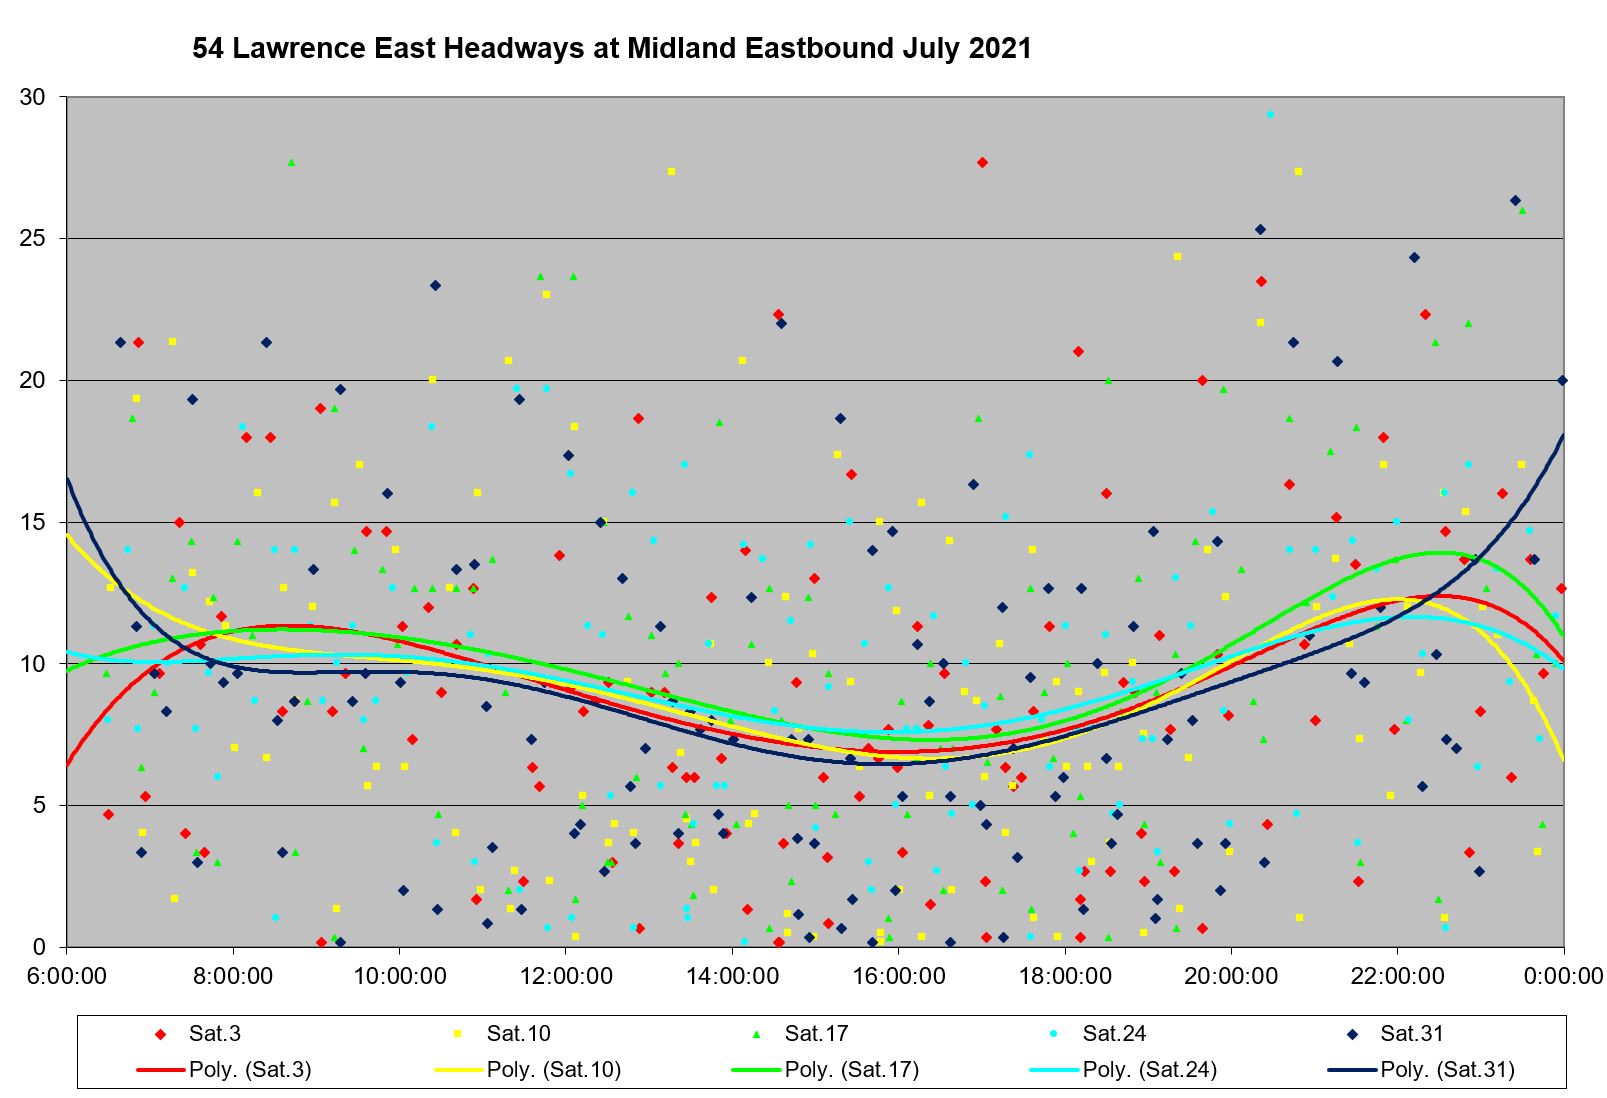
Saturdays show a brief drop in travel times after March 2020, but values have since rebounded to or above pre-pandemic levels particularly in recent months.
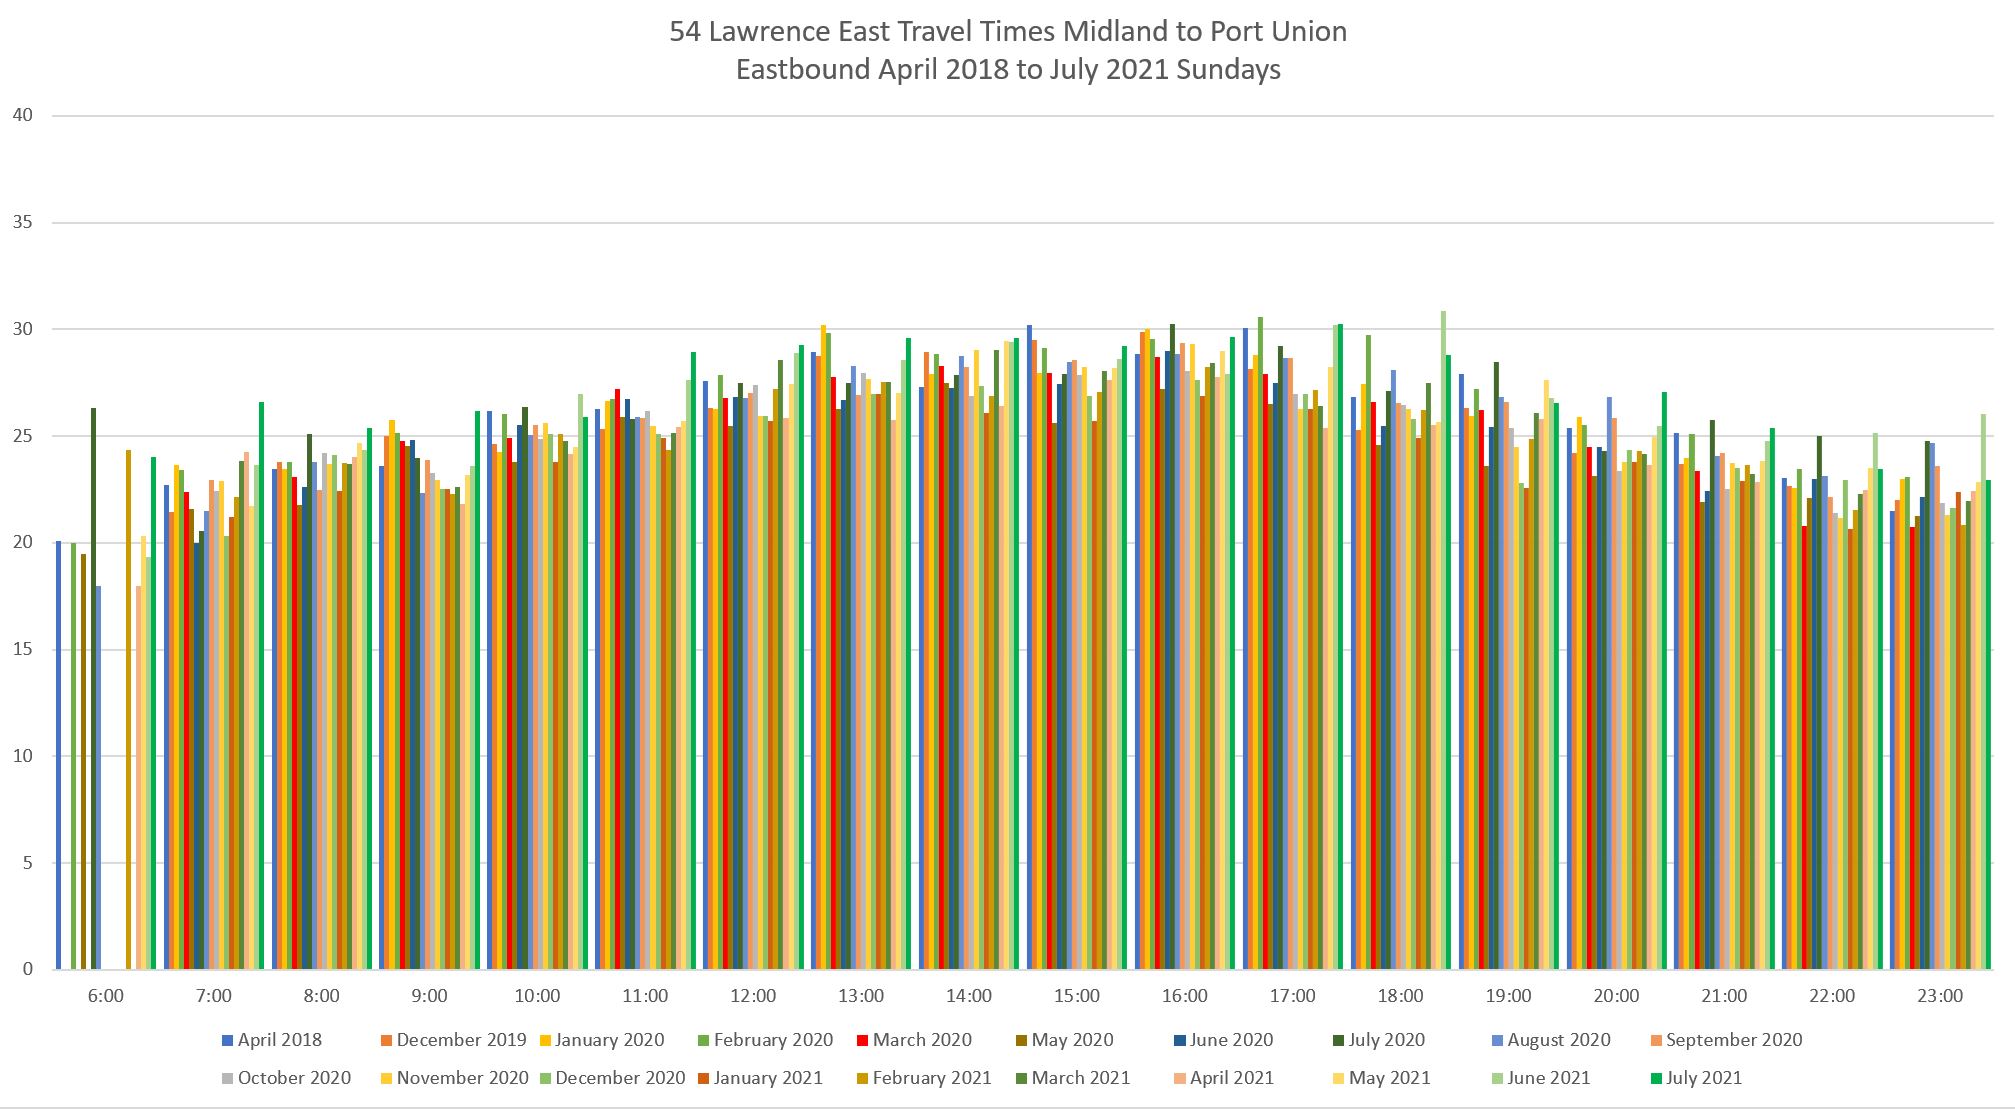
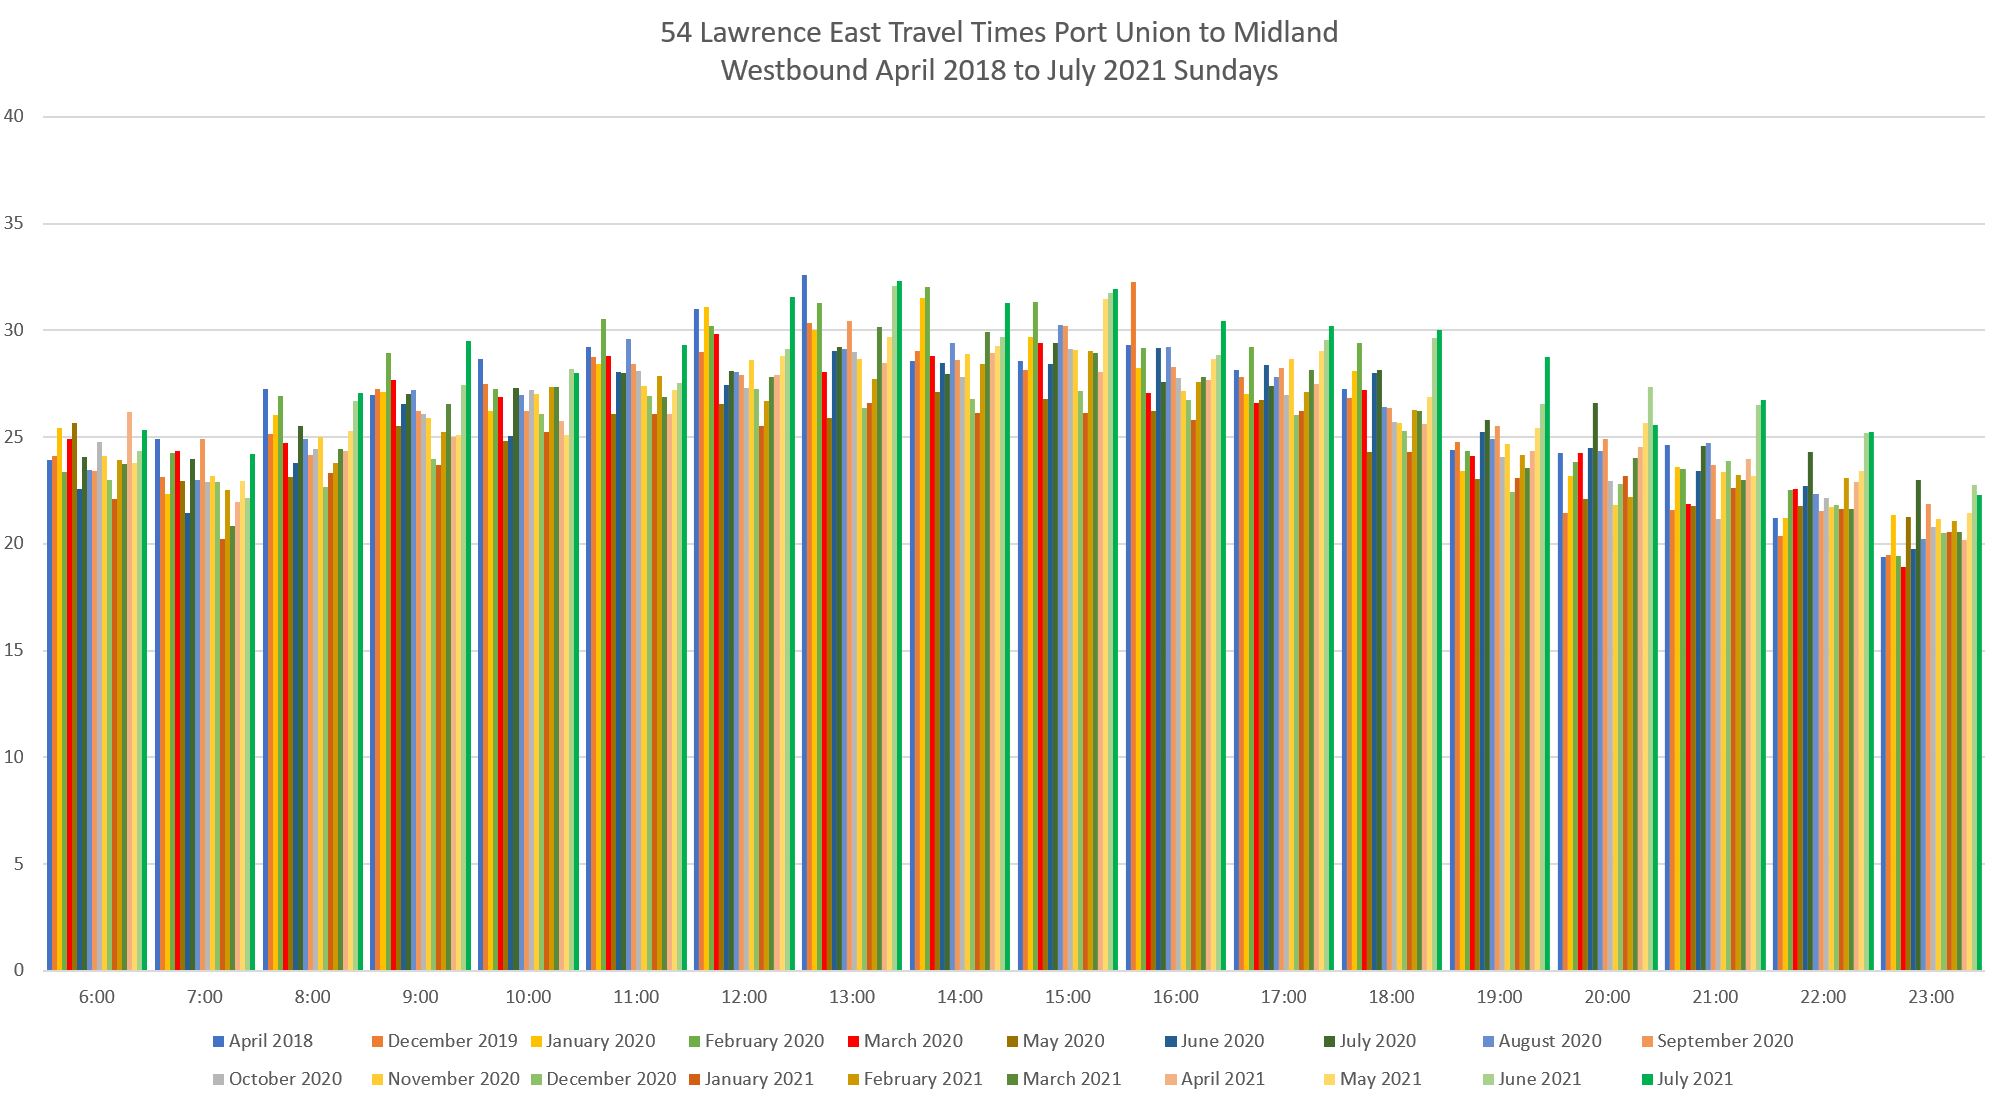
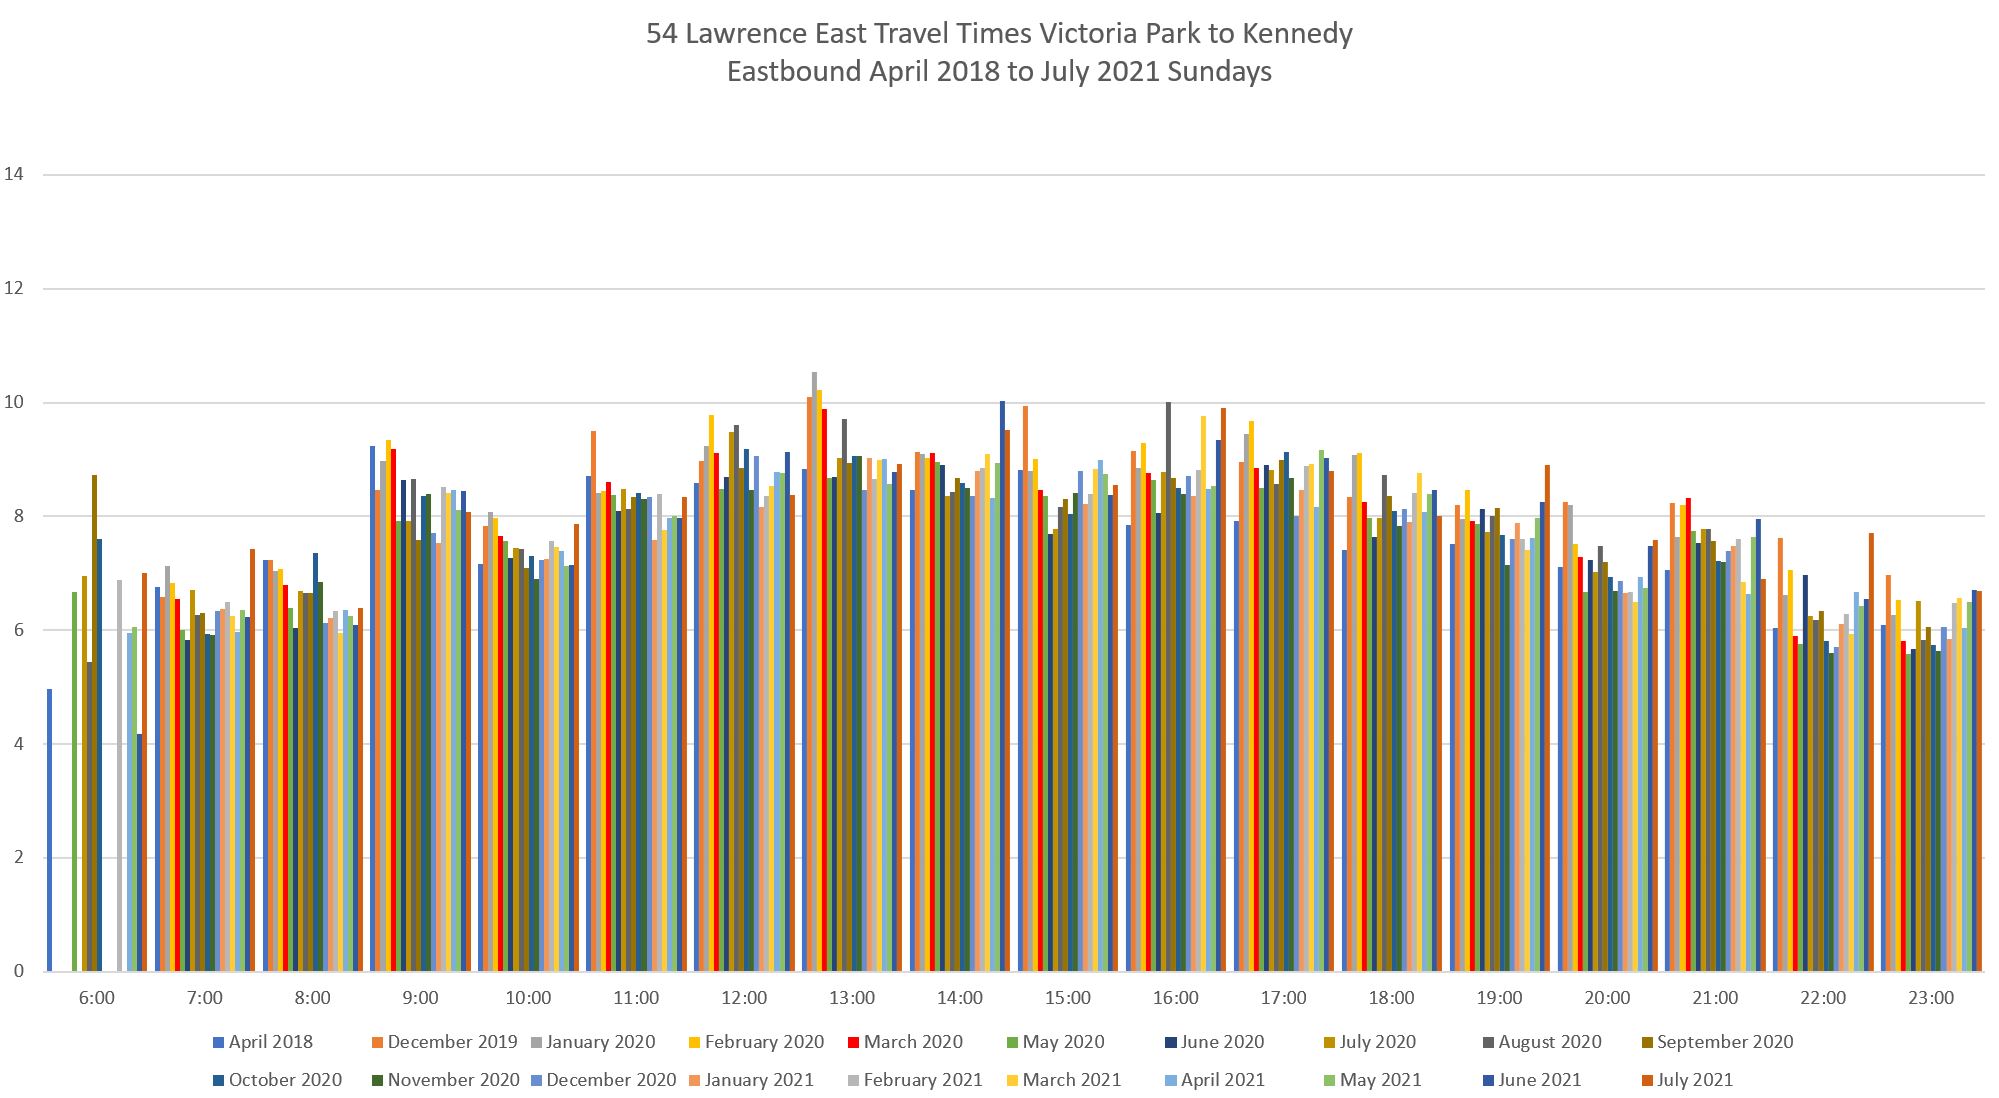
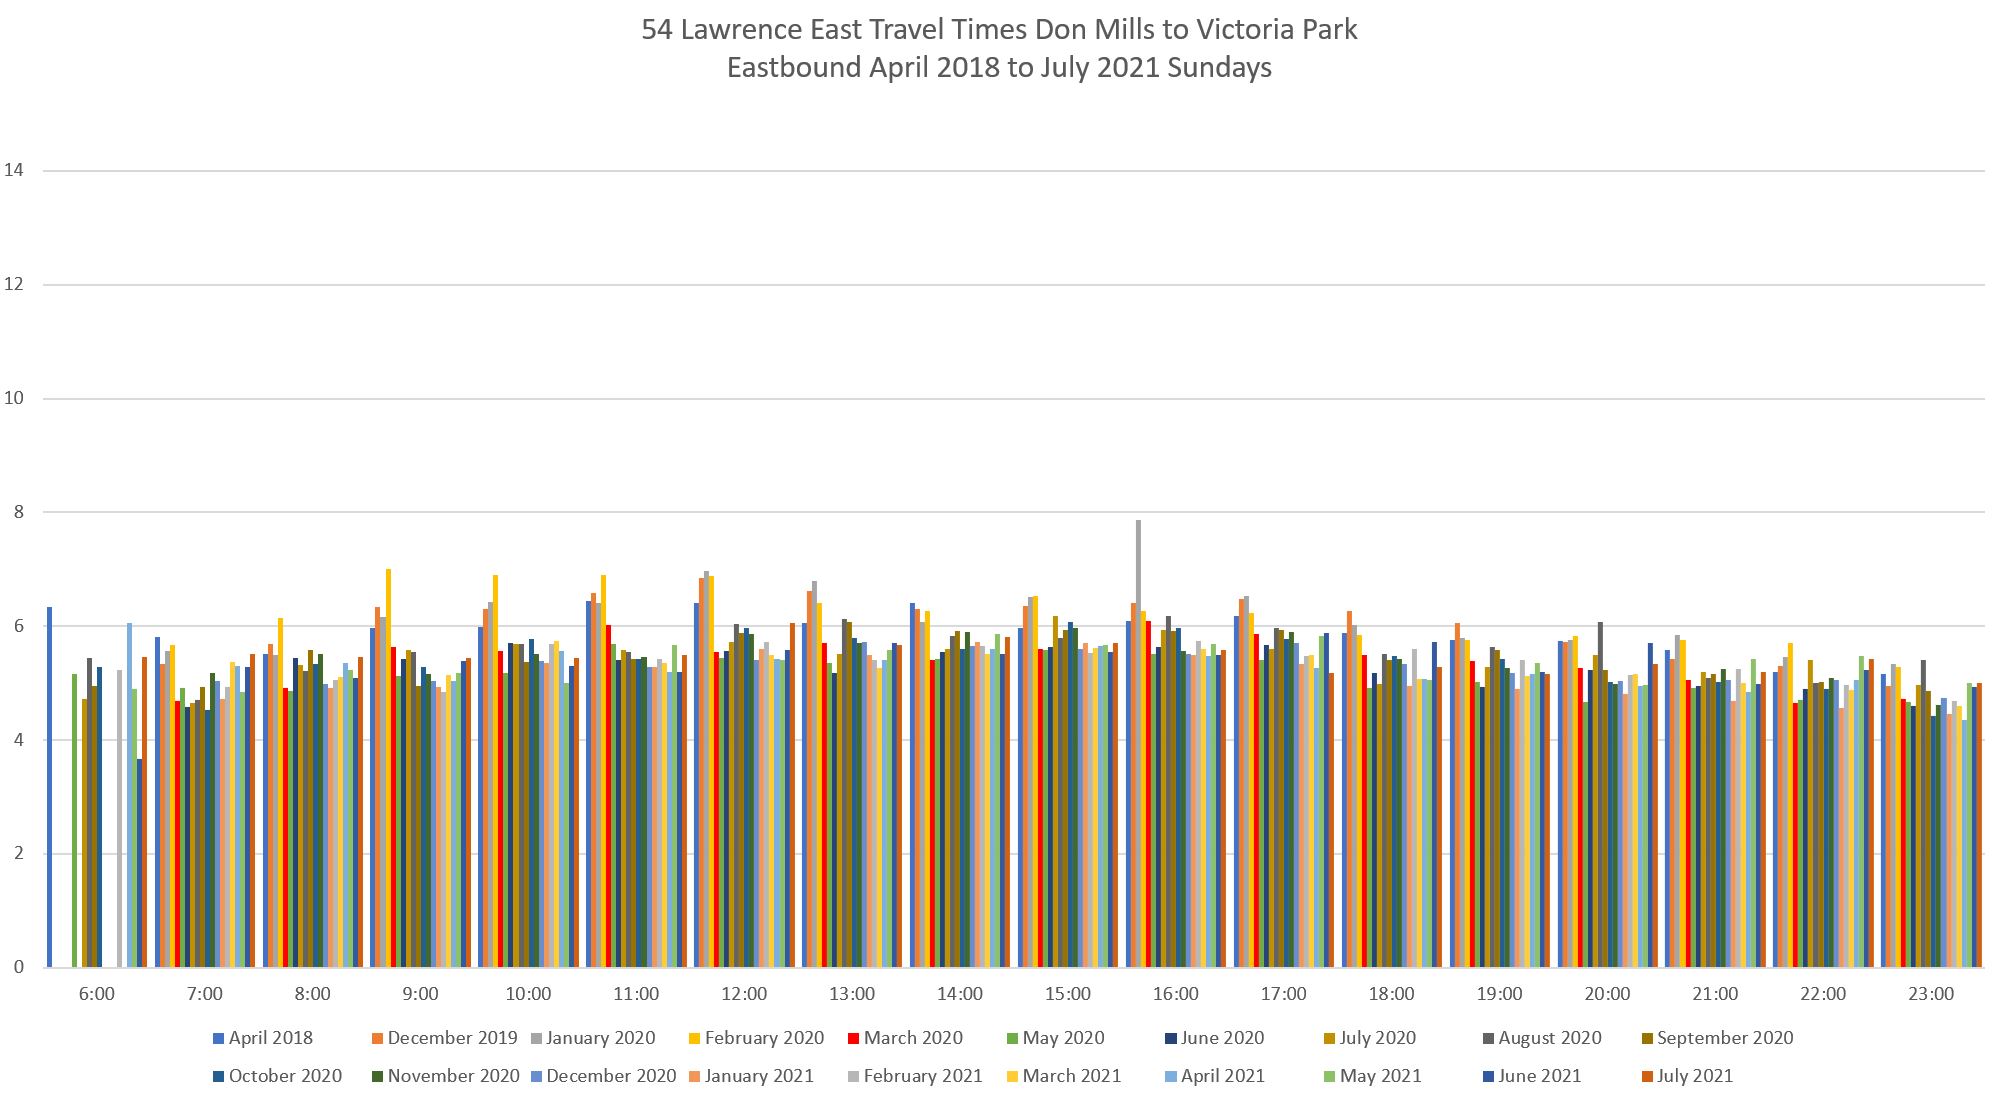
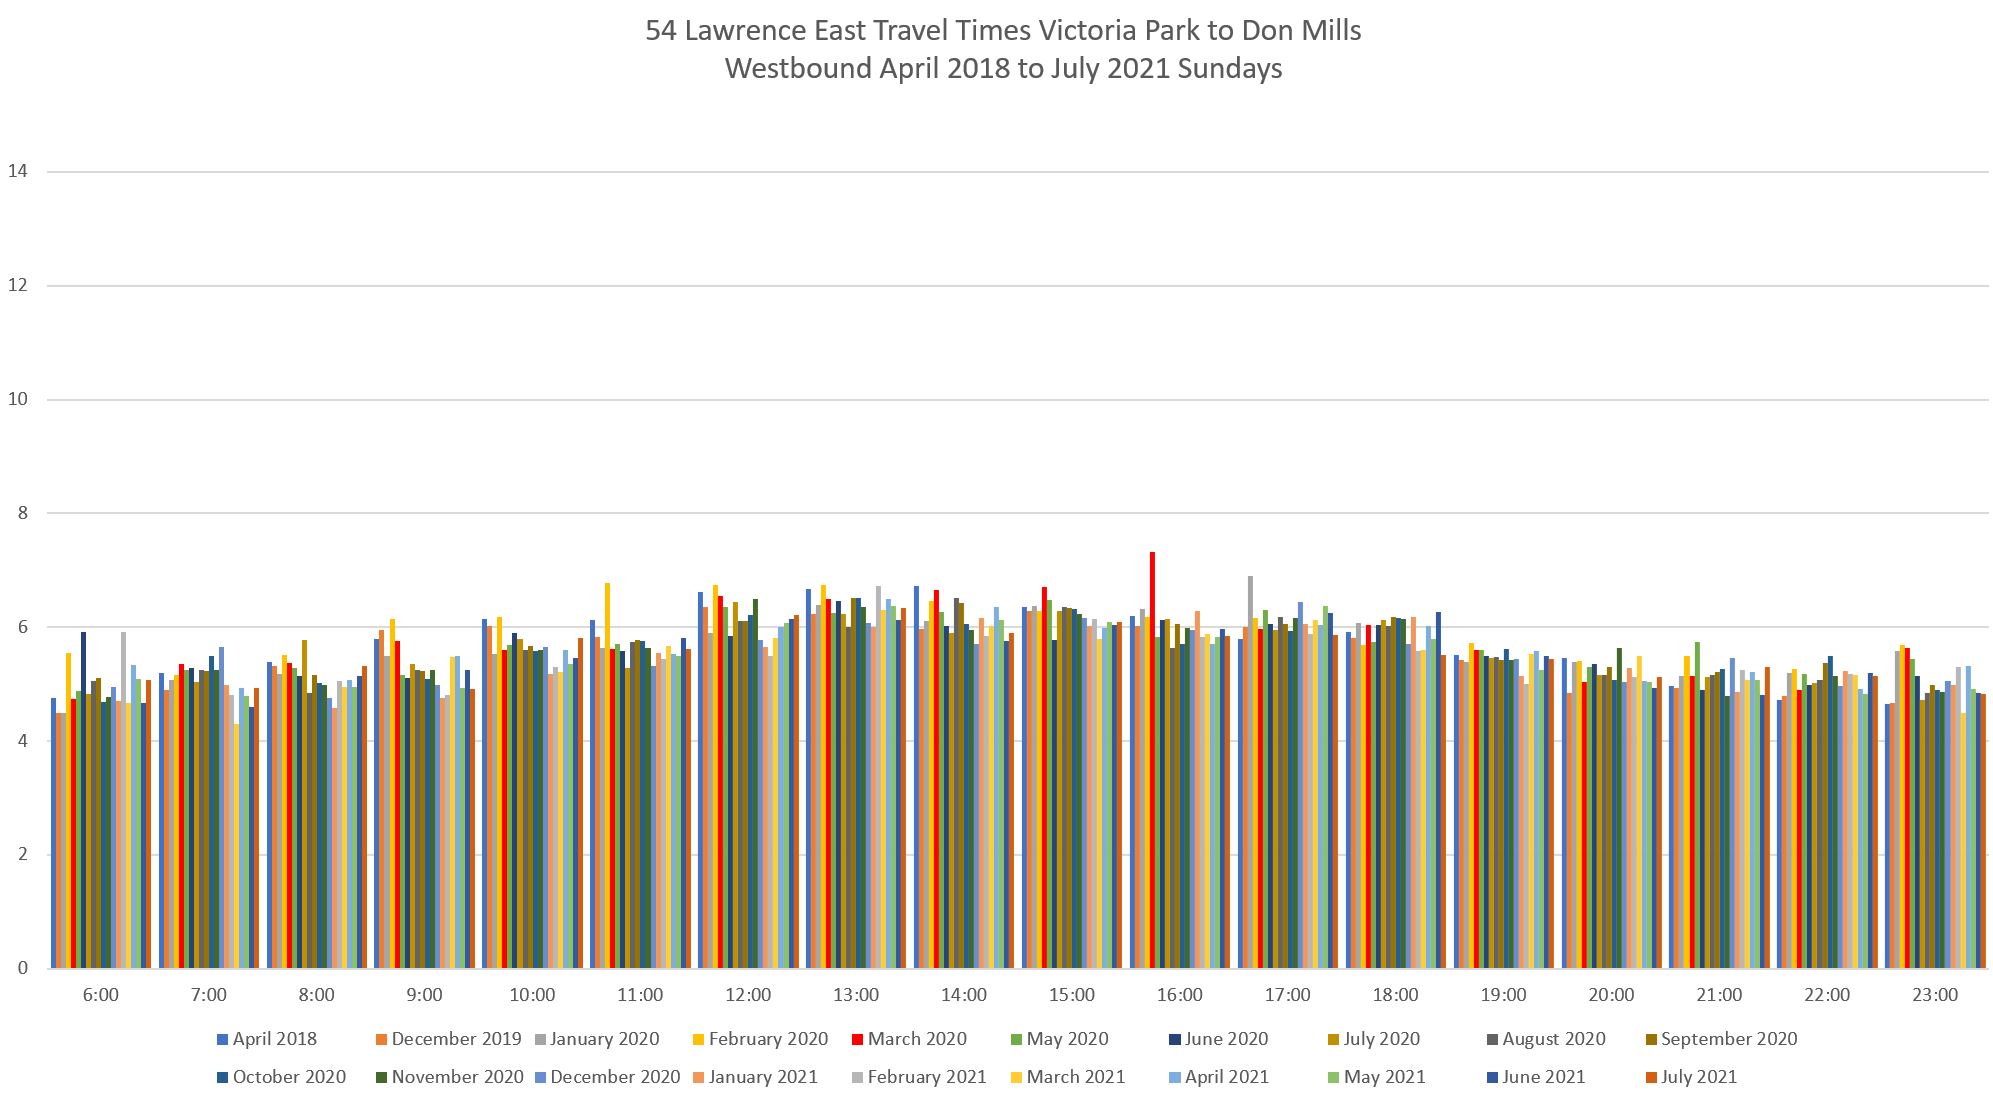
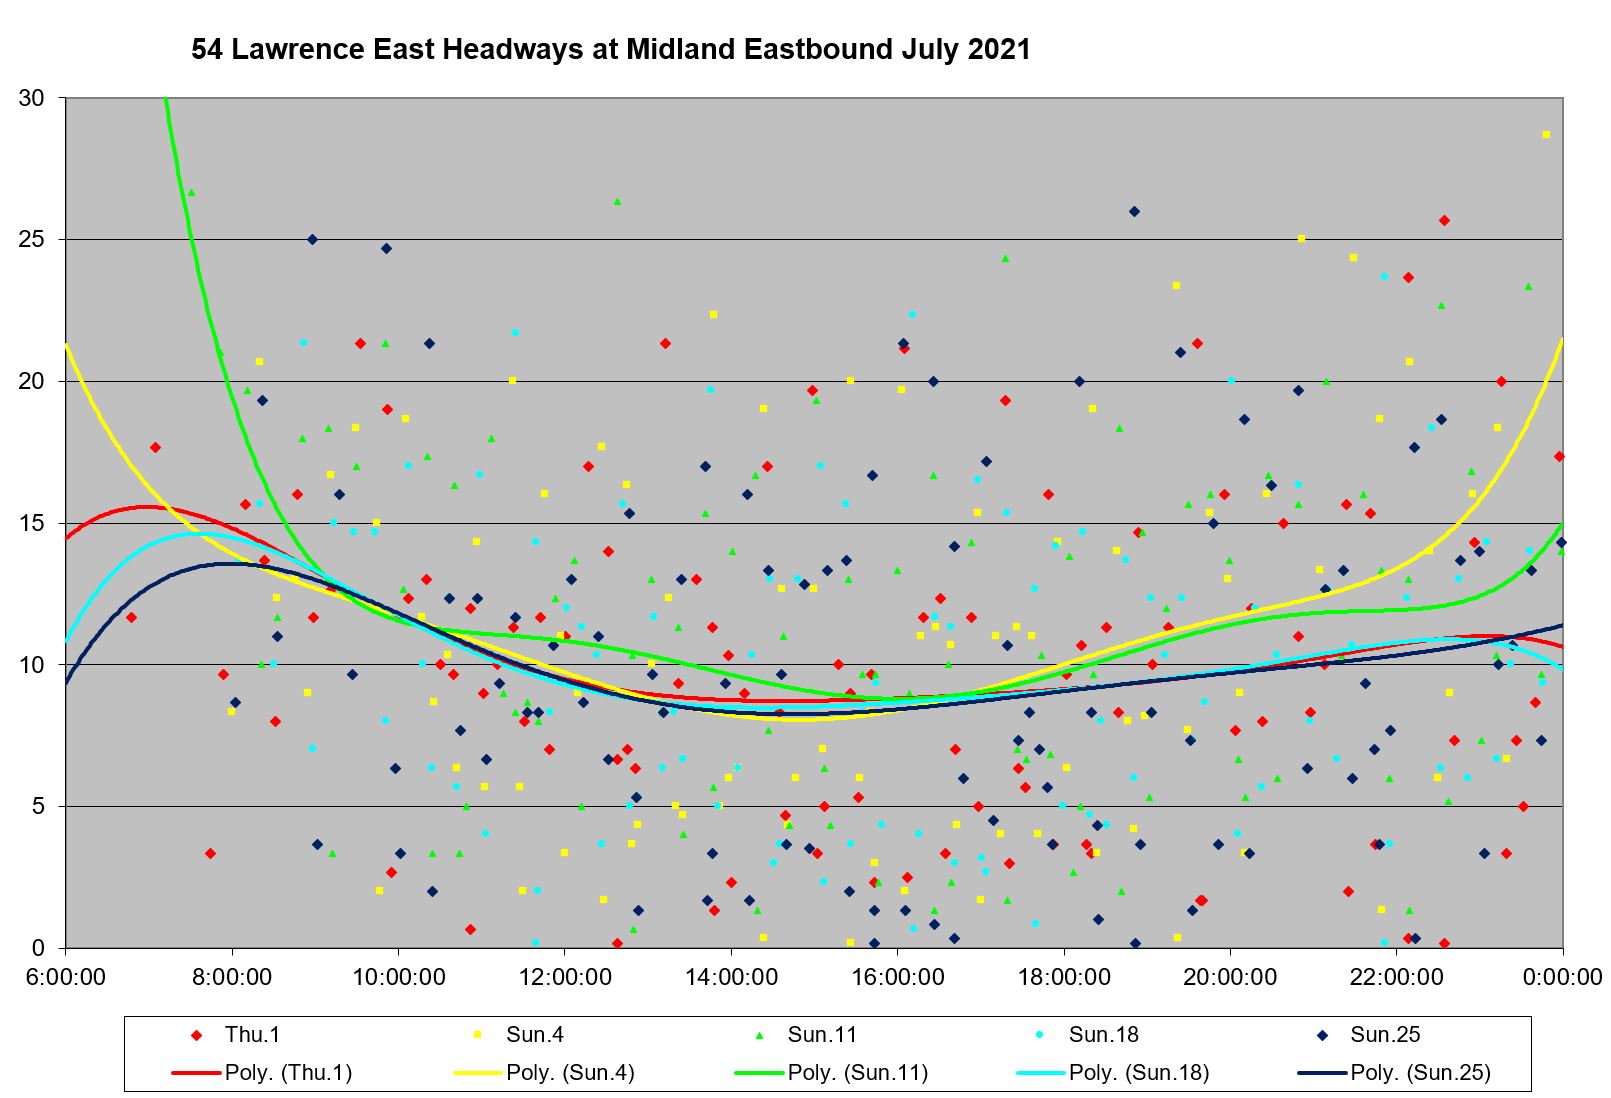
Sundays have slightly shorter (faster) travel times than Saturdays, but show the same pattern of a small, brief drop after March 2020 followed by an increase back to or above pre-pandemic levels.
Evolution of Travel Times Between Kennedy and Victoria Park
For the section west of Lawrence East Station, I have broken the analysis into two segments at Victoria Park because the Councillor for the ward west of Victoria Park has been skeptical about the value of reserved lanes on his ward’s portion of Lawrence Avenue.
March 2020 data show a modest in the PM peak eastbound, and a somewhat more sustained, but small drop in westbound travel times.
Note also that eastbound data show an AM peak that remains even after the mid-March lockdown implying that even with reduced traffic in this area there was still congestion.
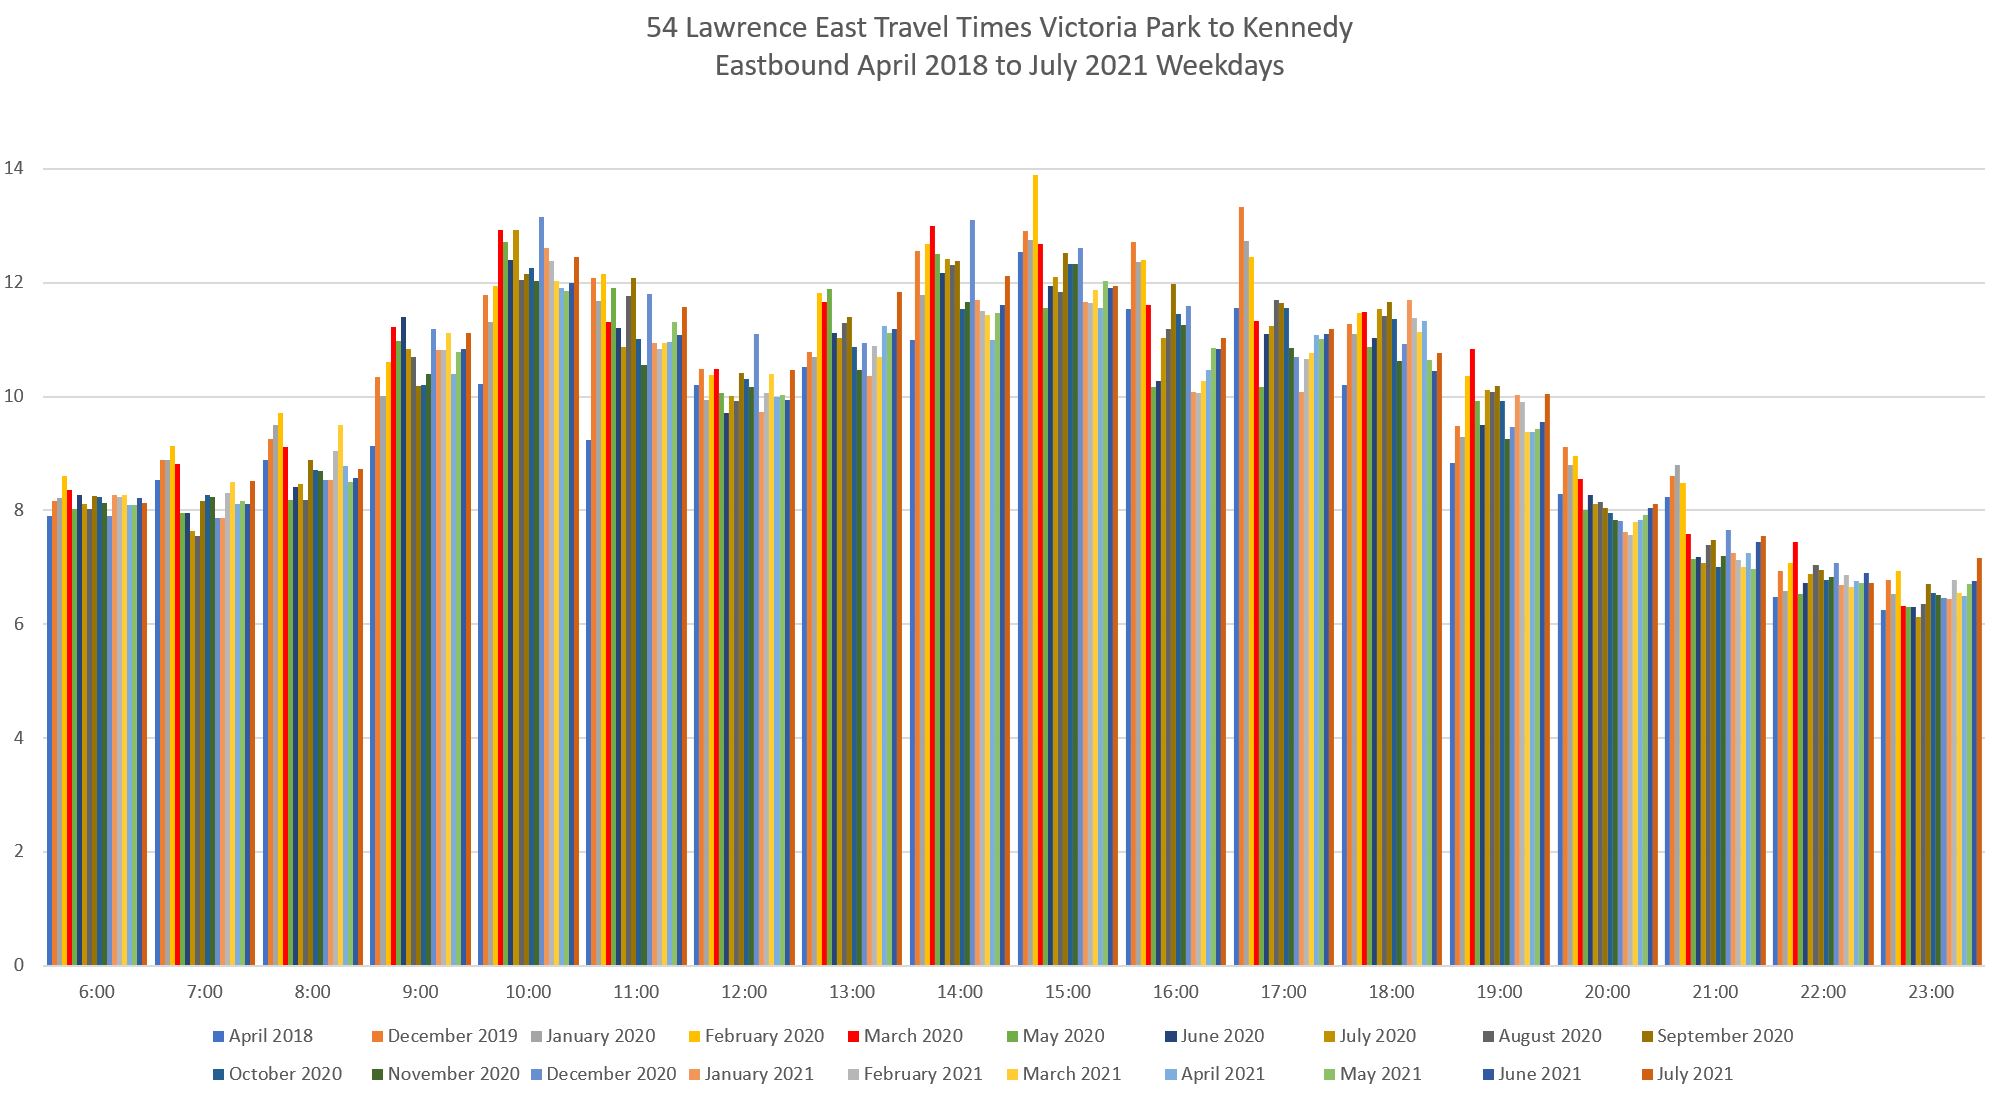
Weekdays over the course of many months two factors are clear in the eastbound data: the strong AM peak, and the extended nature of the PM peak which actually begins at about 1 pm. The change in travel times after March 2020 was small and short-lived in some cases.
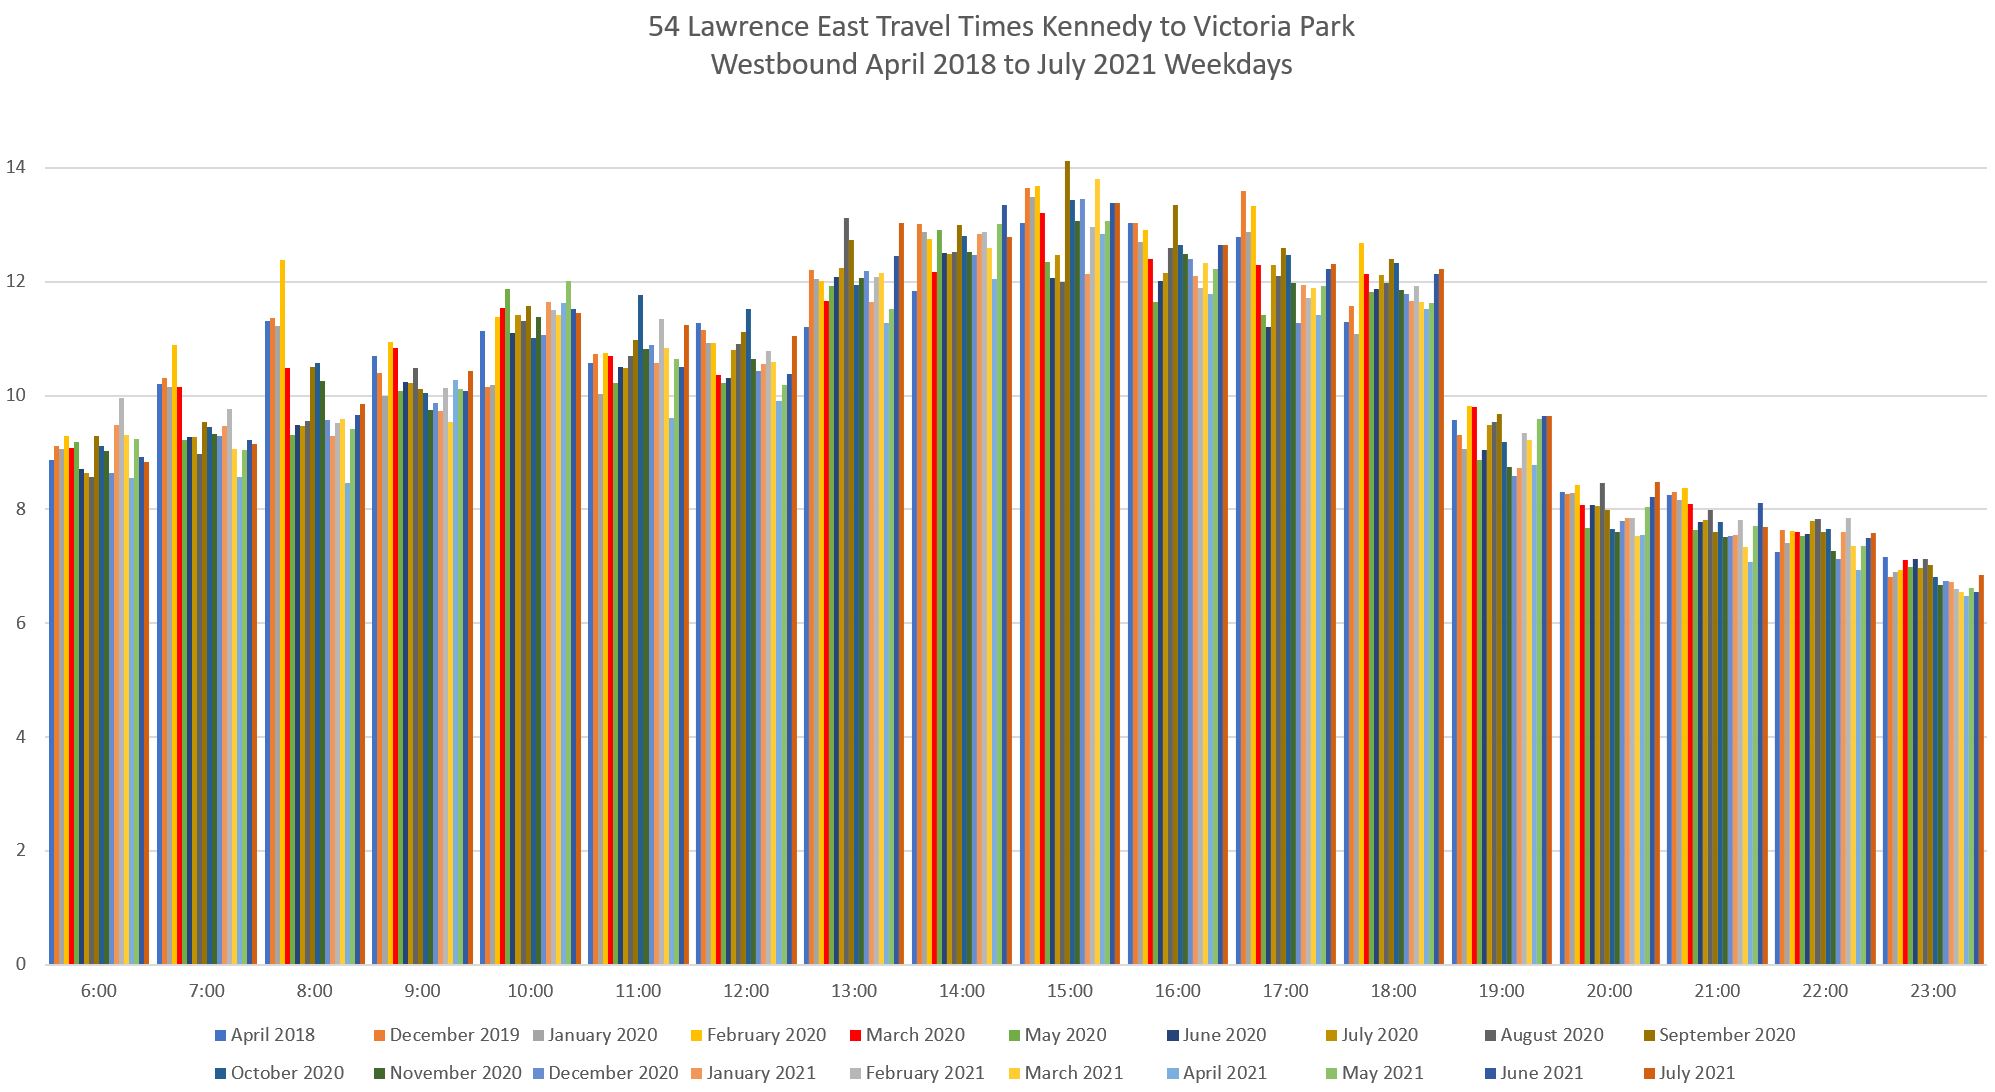
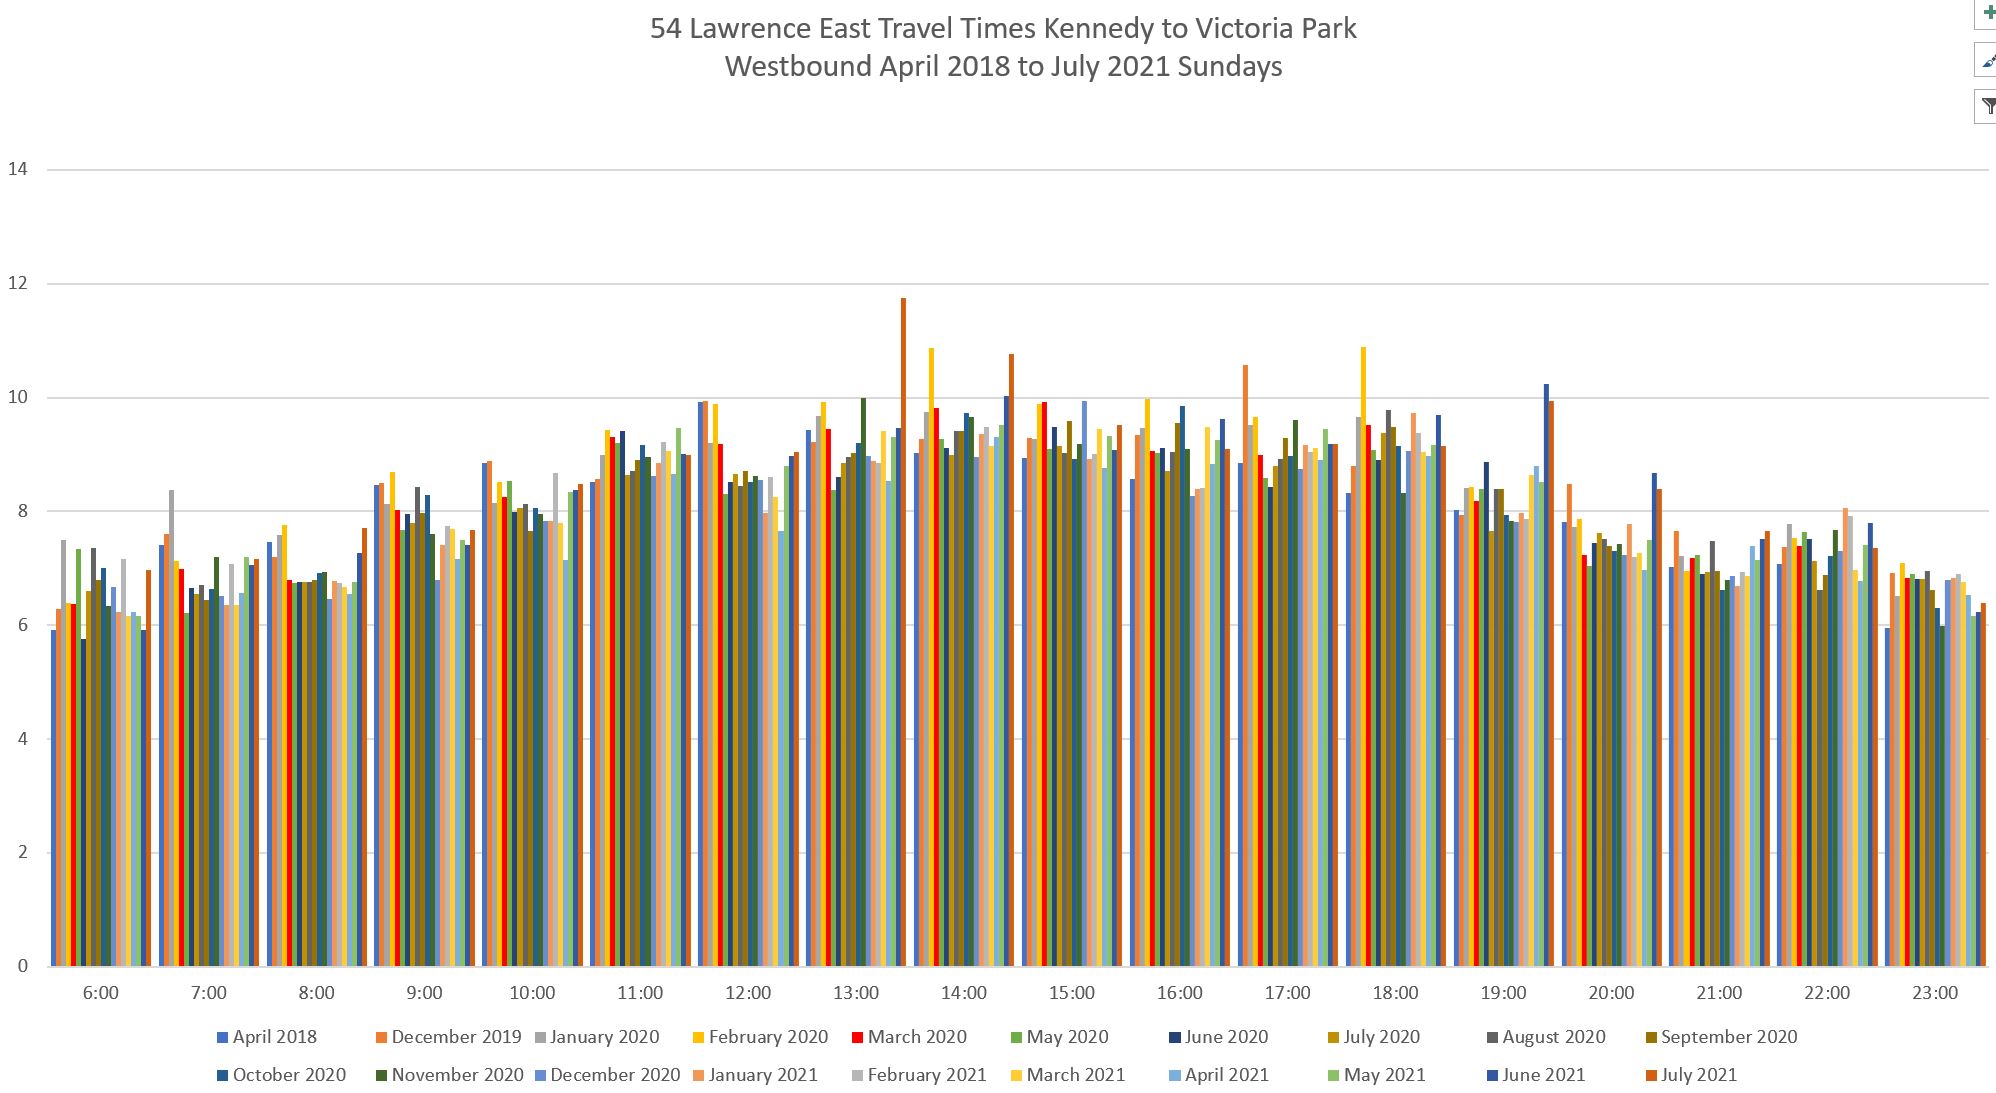
Westbound data show the same extended PM peak between about 1 and 7 pm.
Saturdays and Sundays generally show a pattern of reduced travel times after March 2020, but growth back to pre-pandemic levels has occurred during some periods, although not to the degree of weekday data above.
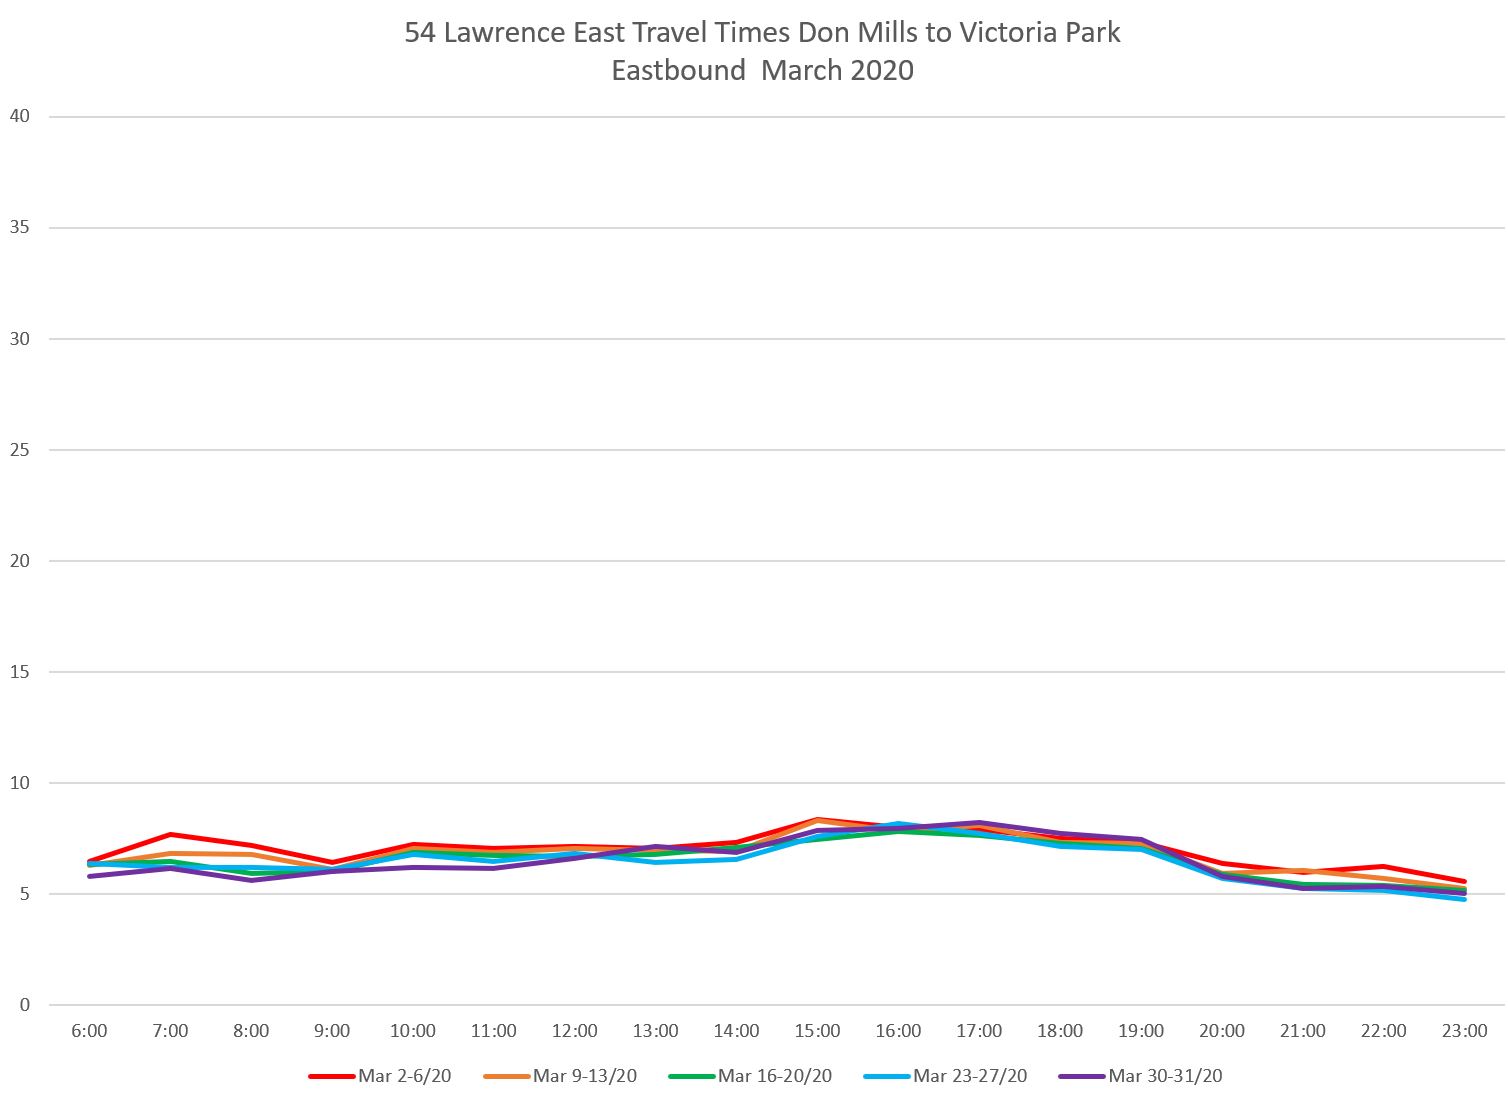
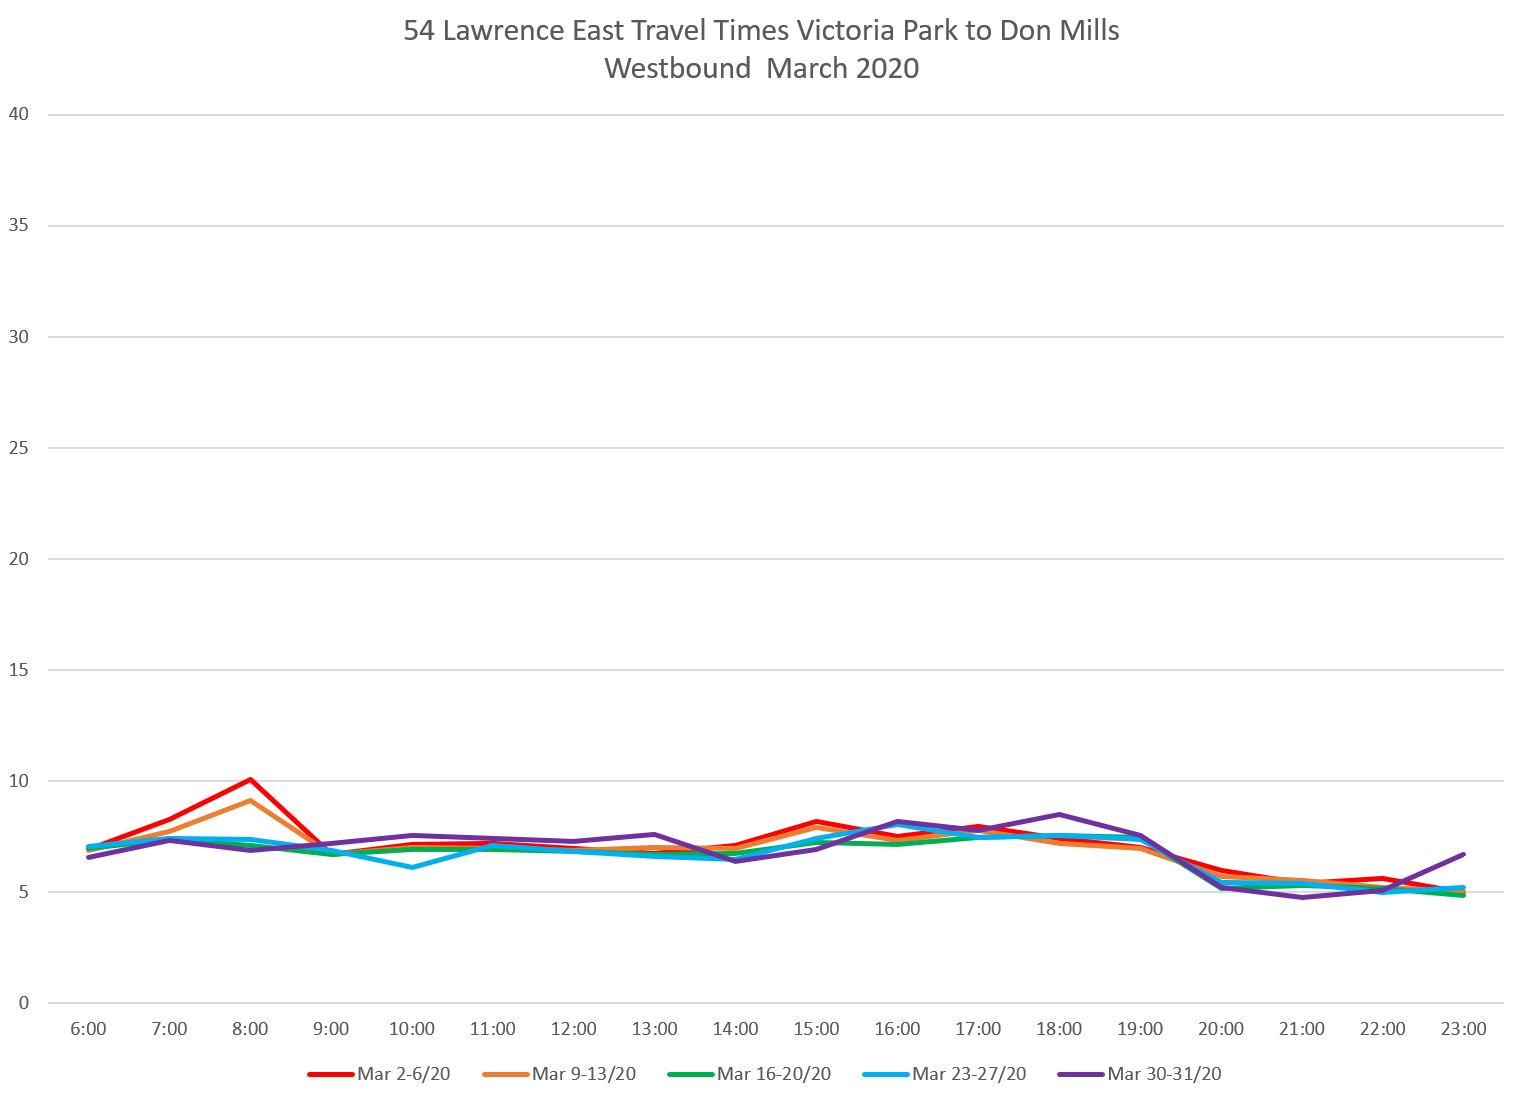
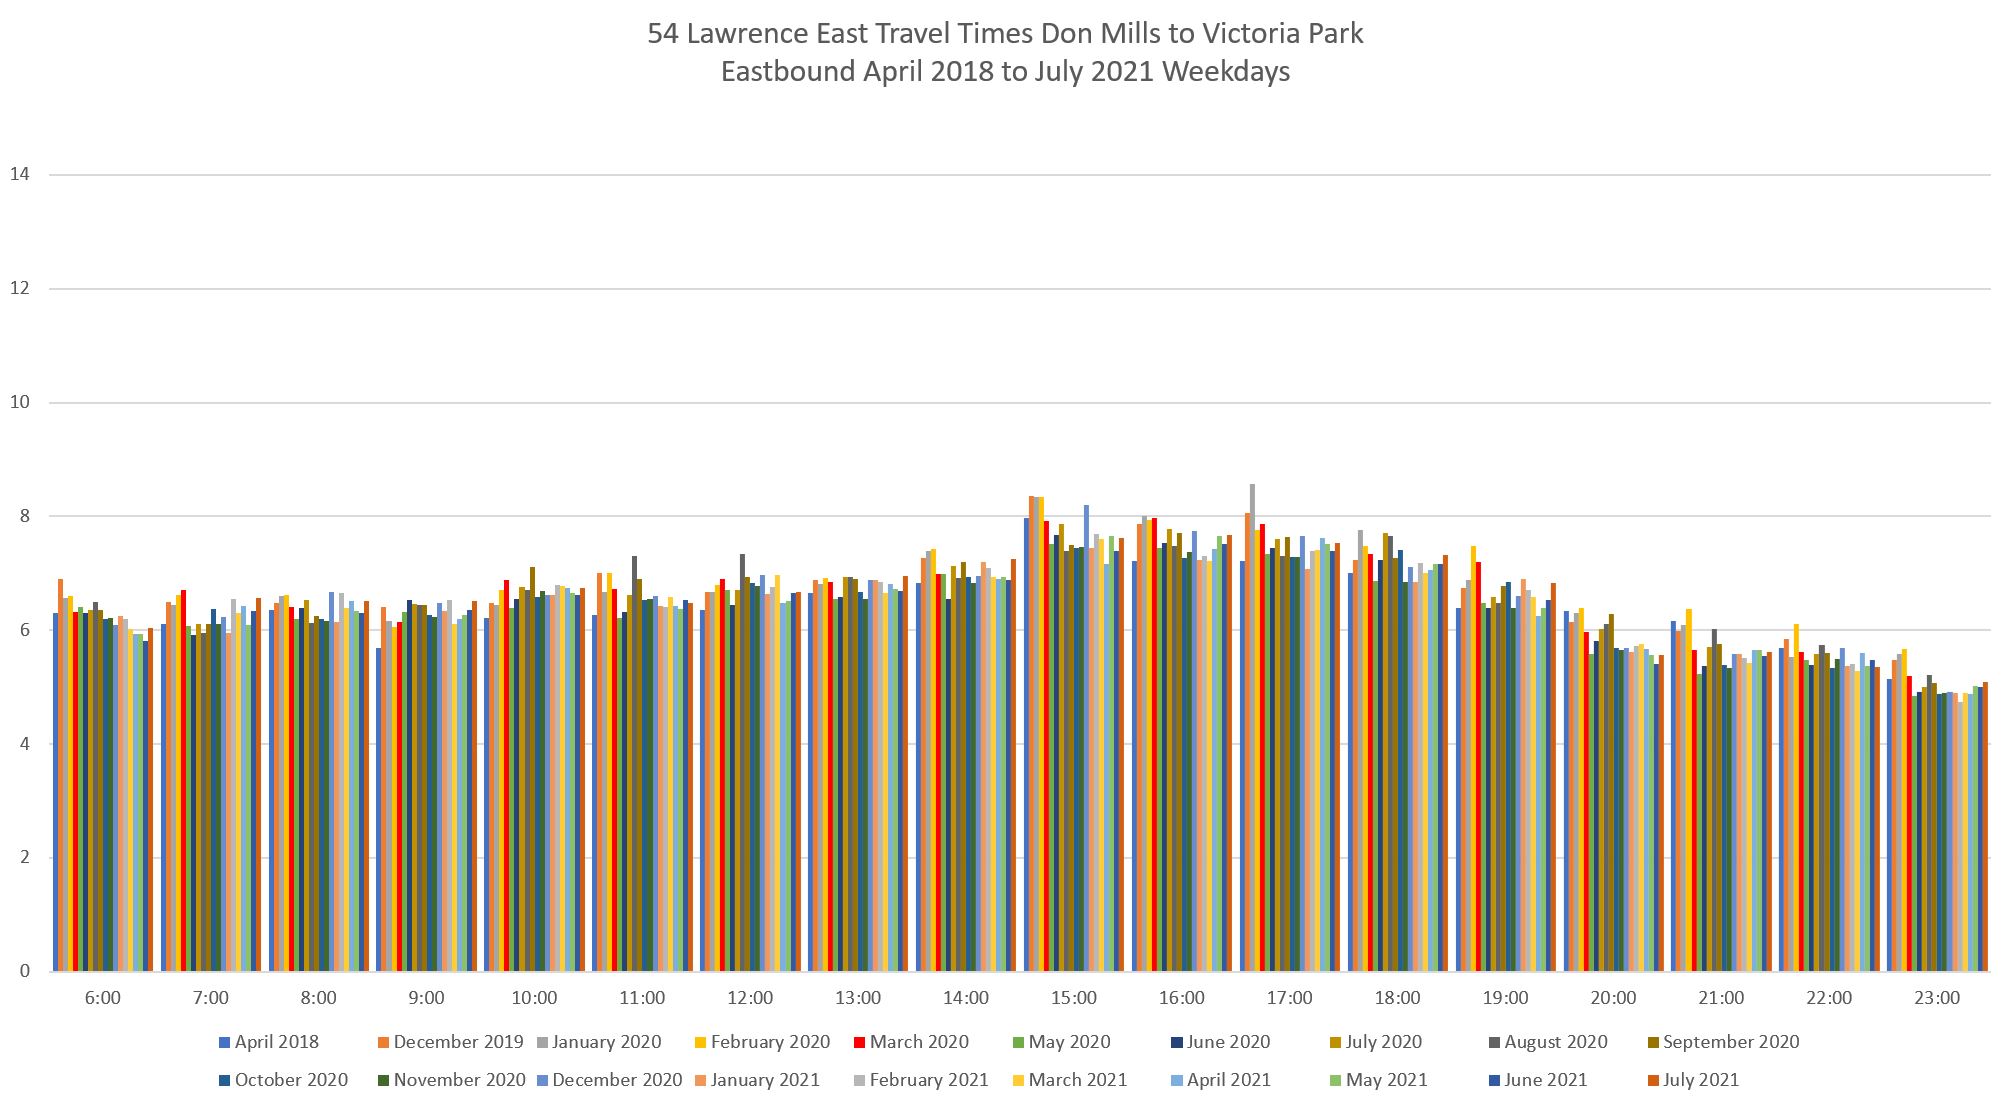
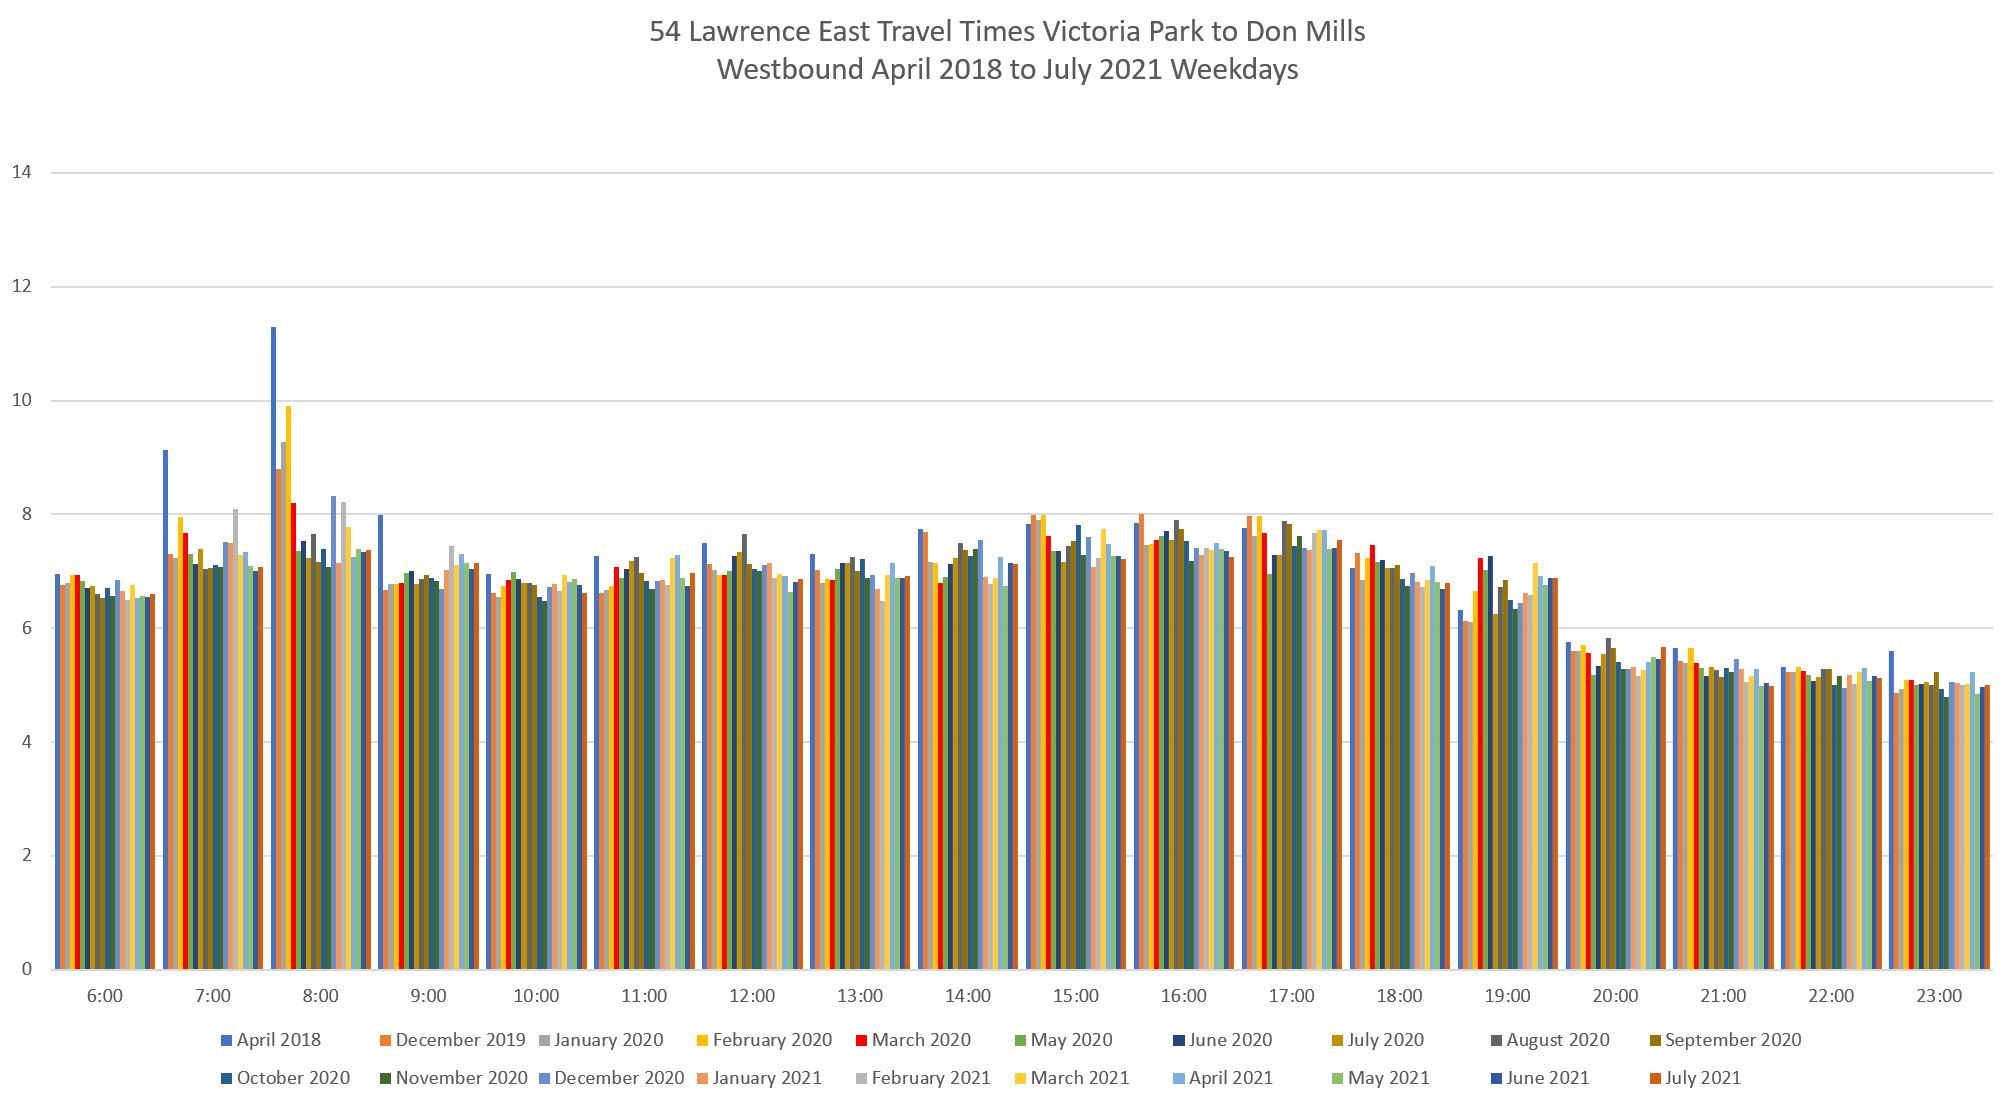
Evolution of Travel Times Between Victoria Park and Don Mills
This segment has very consistent travel times (and higher than average speeds) because it includes the interchange with the DVP and fewer stops than on other route segments.
March 2020 data show a small pre-pandemic westbound AM peak that disappears in later months. While there is some time saving, it is small in most operating periods.
Weekdays
Saturdays
Sundays
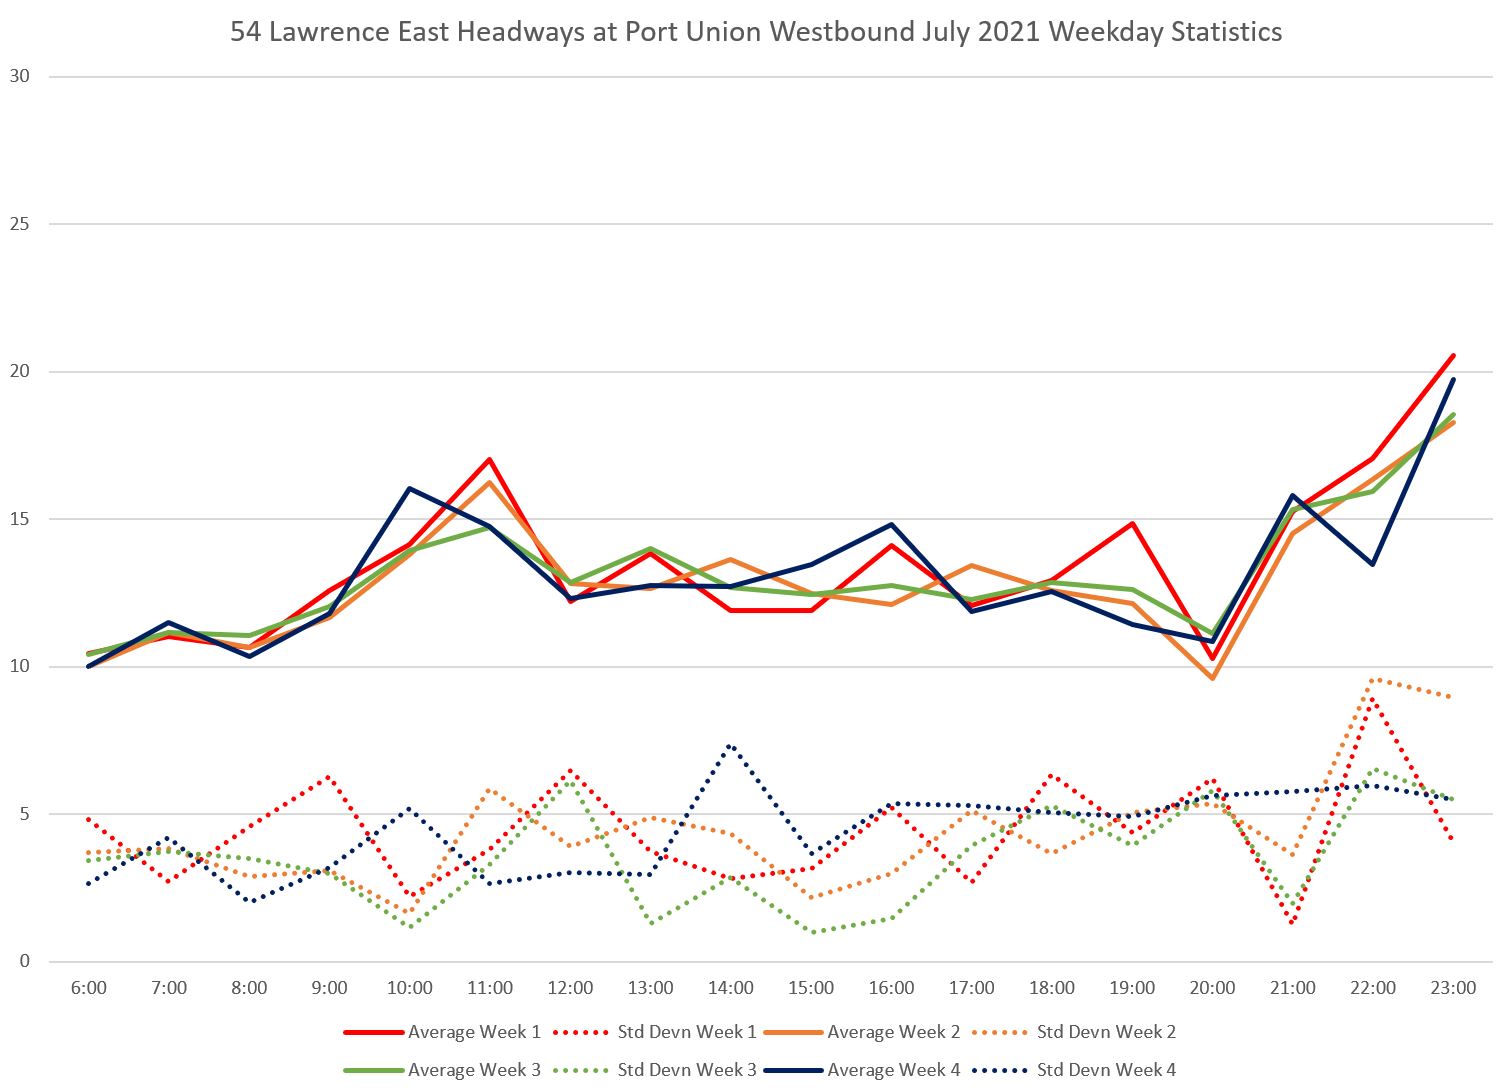
Headway Reliability at Port Union Road Westbound
As noted earlier in this article, inbound headways are measured at Port Union Road because of inconsistent layover locations for buses at the east end of the route, Starspray Loop. Service at Port Union is representative of the headways that proceed west across the route.
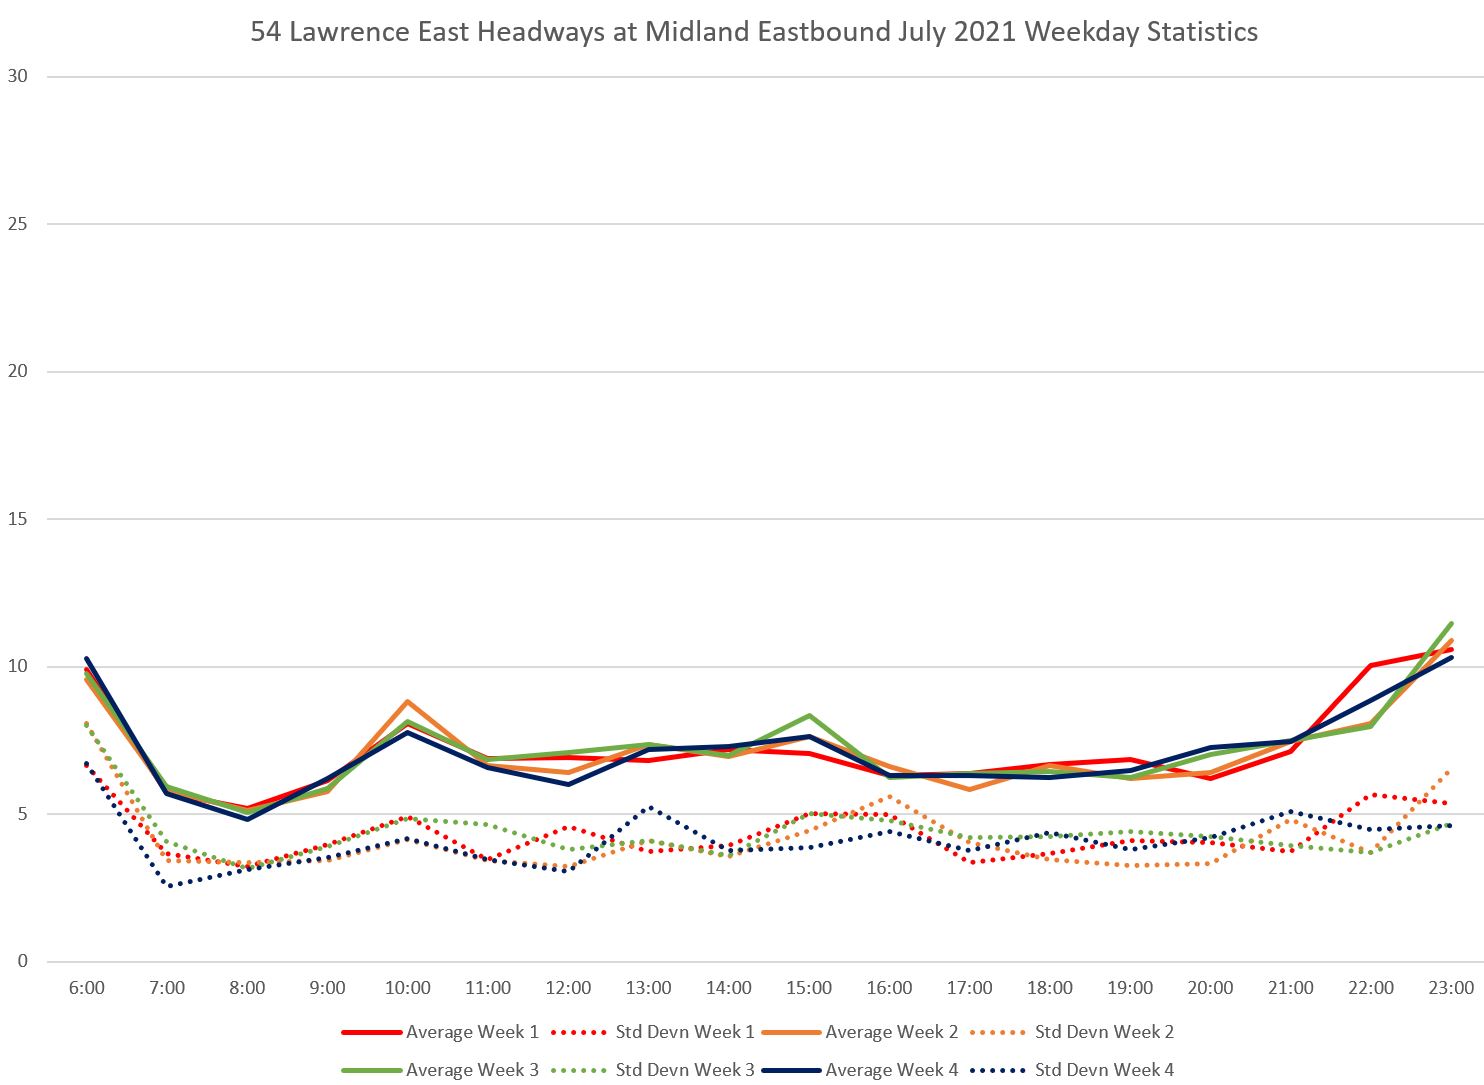
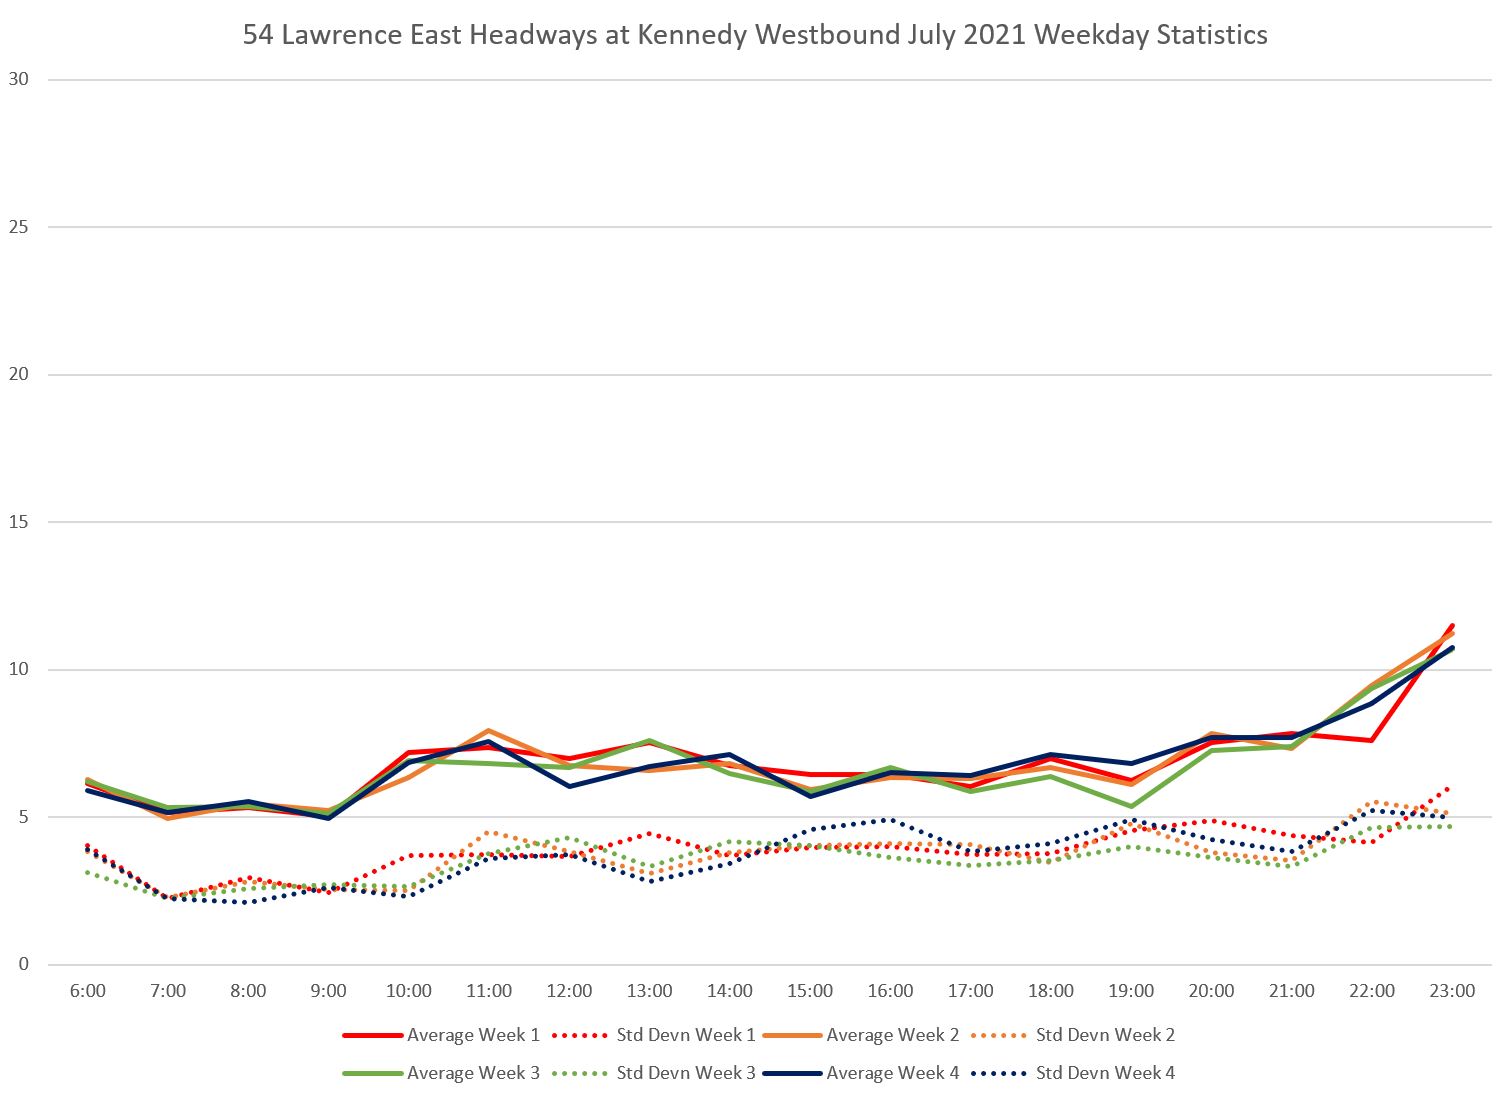
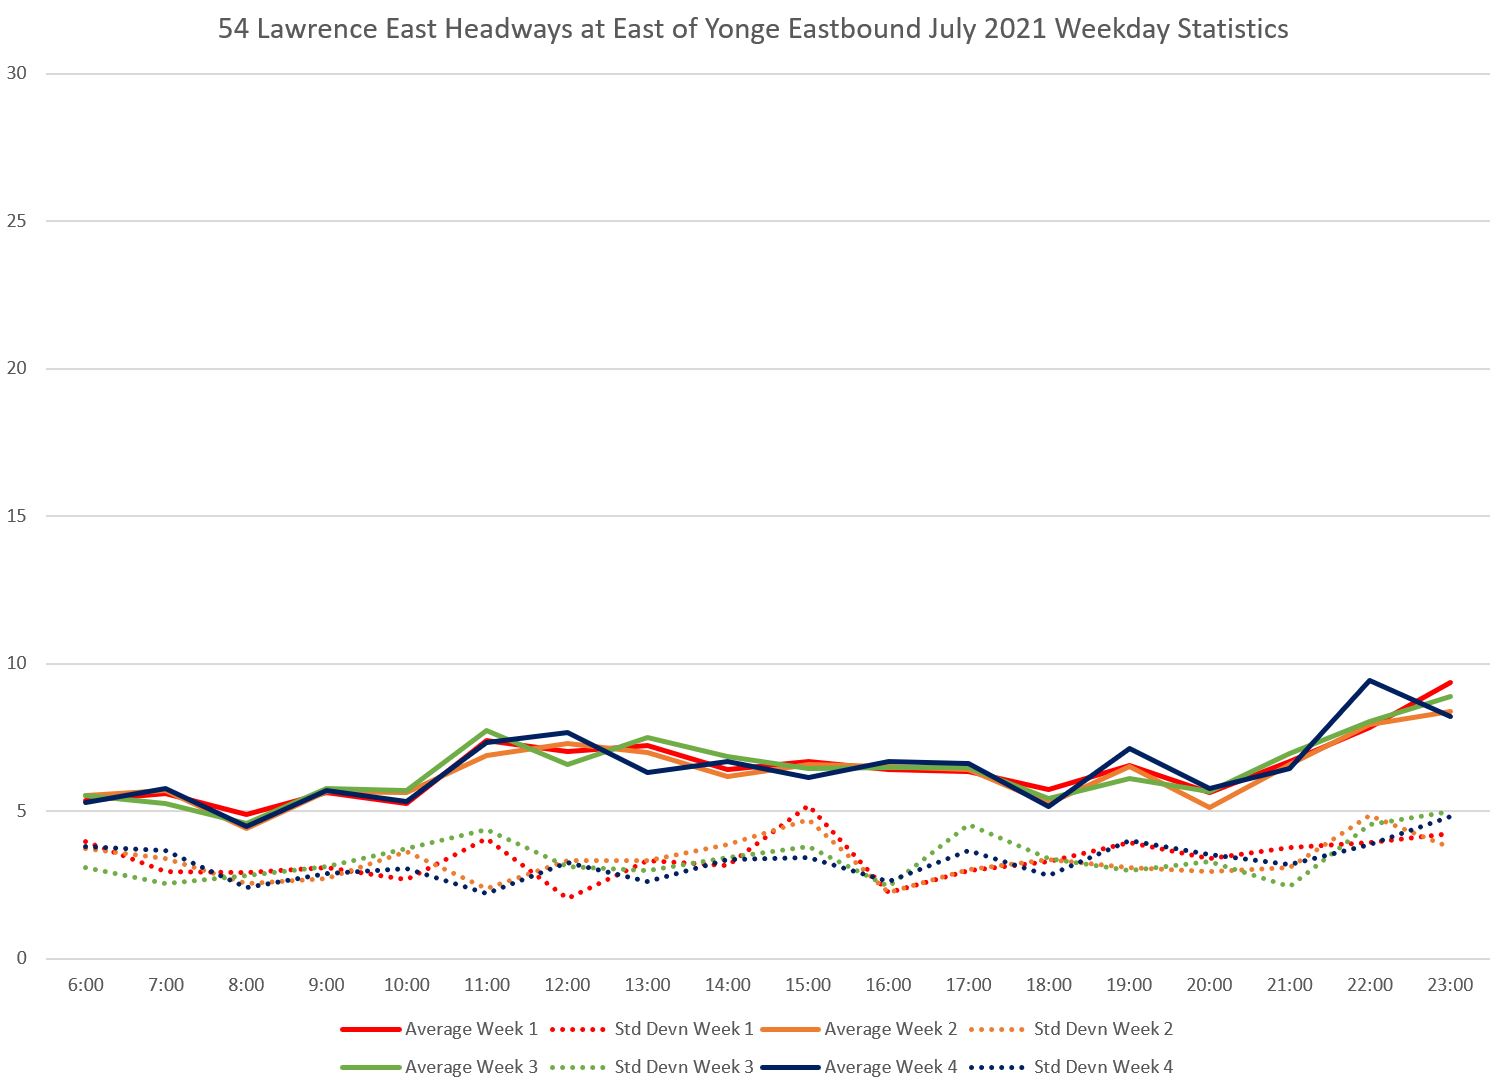
Within the weekly averages, note that the standard deviations (dotted) are high and they bounce around a lot. This indicates a wide swing in actual headway values.
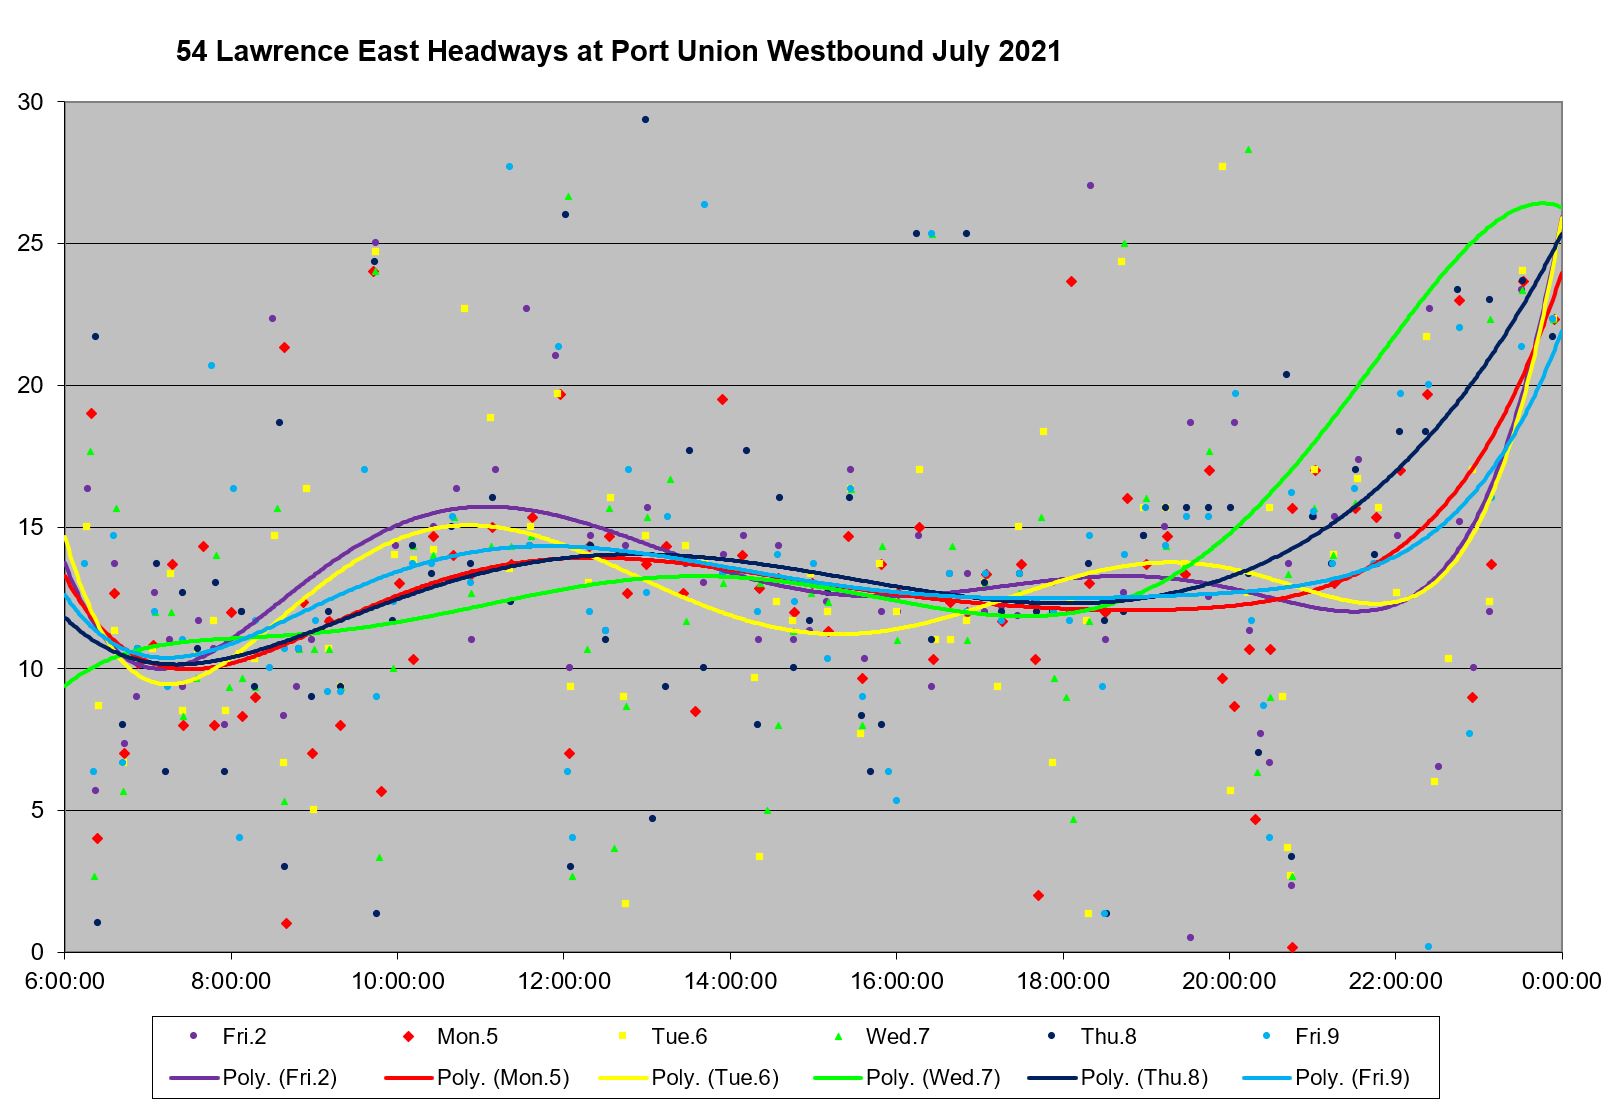
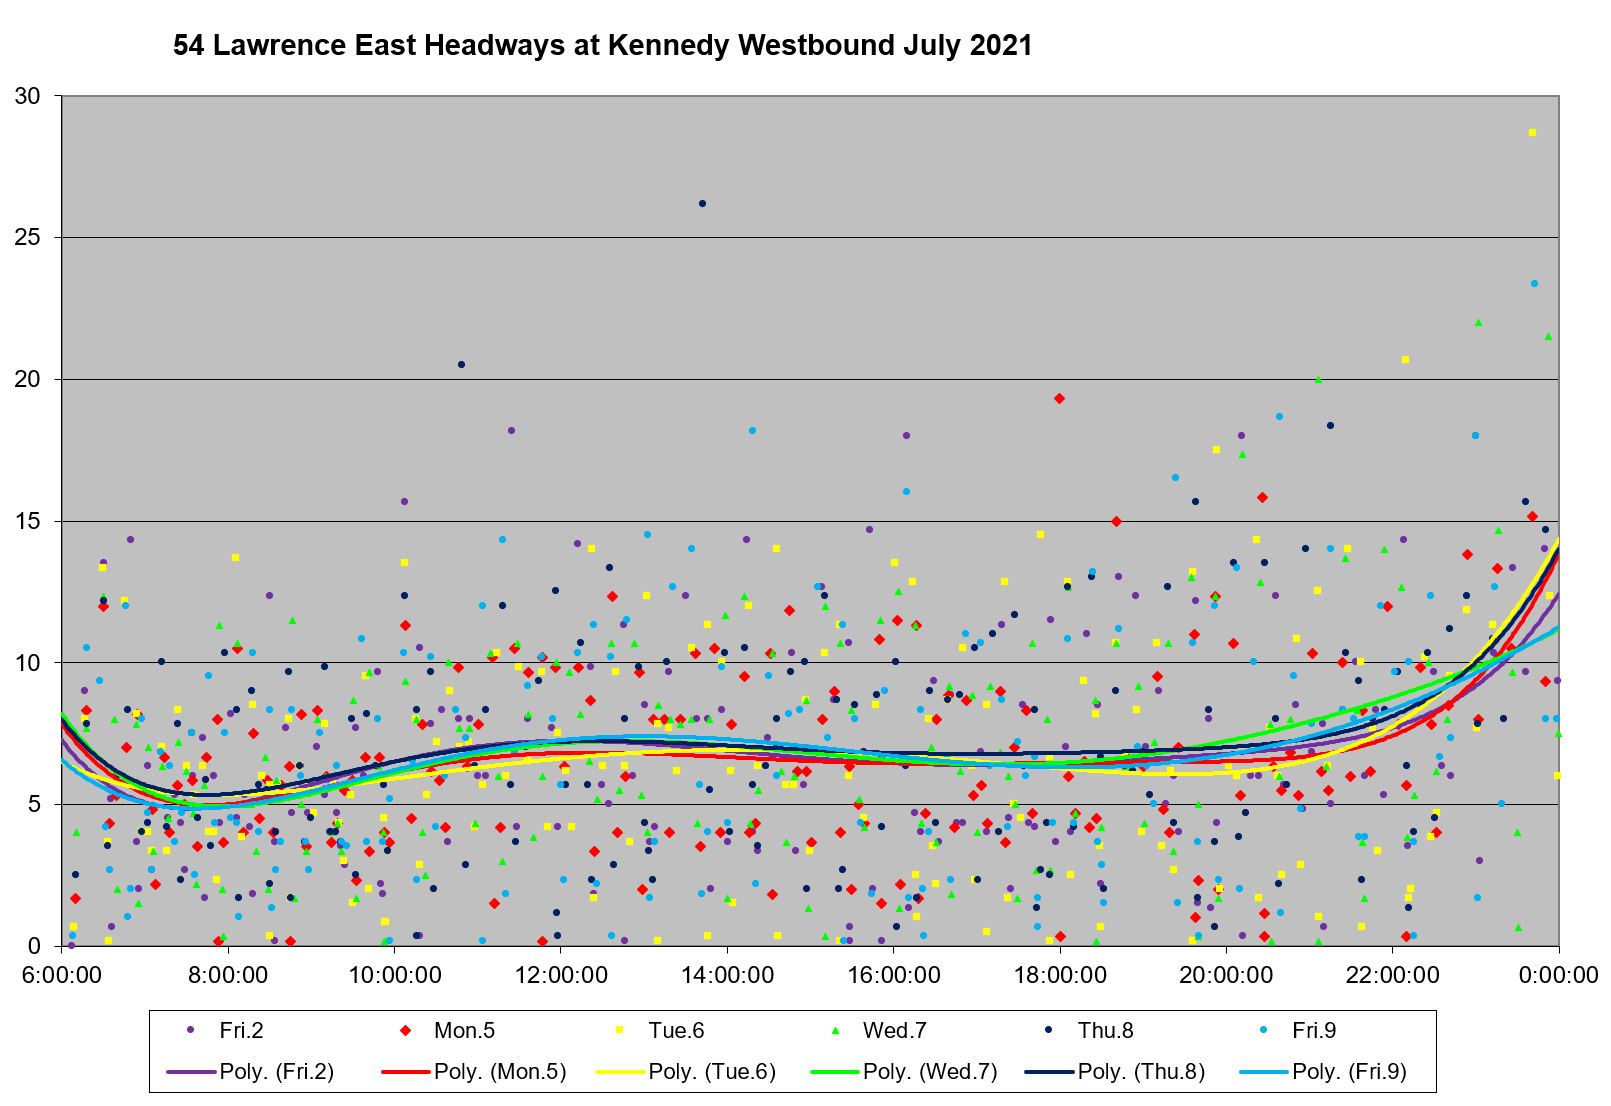
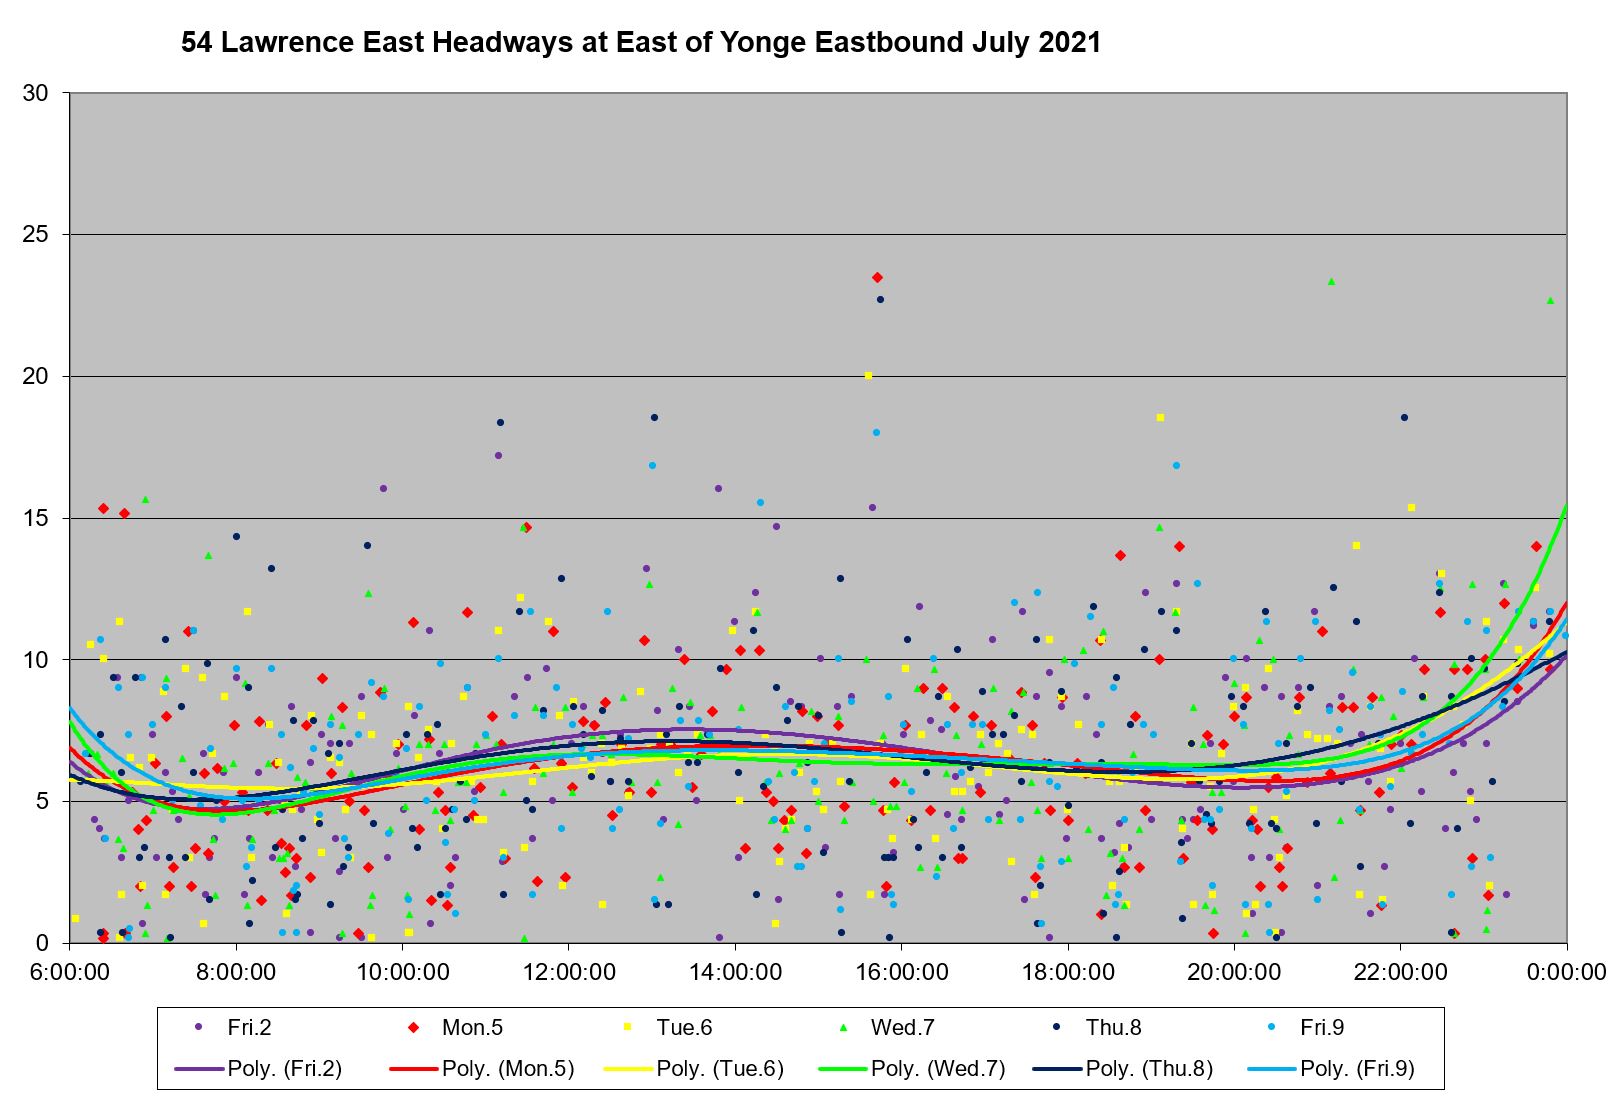
Here are the data for weekdays from Friday July 2 to Friday July 9. Although many are clustered around the trend line values (roughly speaking, the averages), there are many buses on very shot and very long headways.
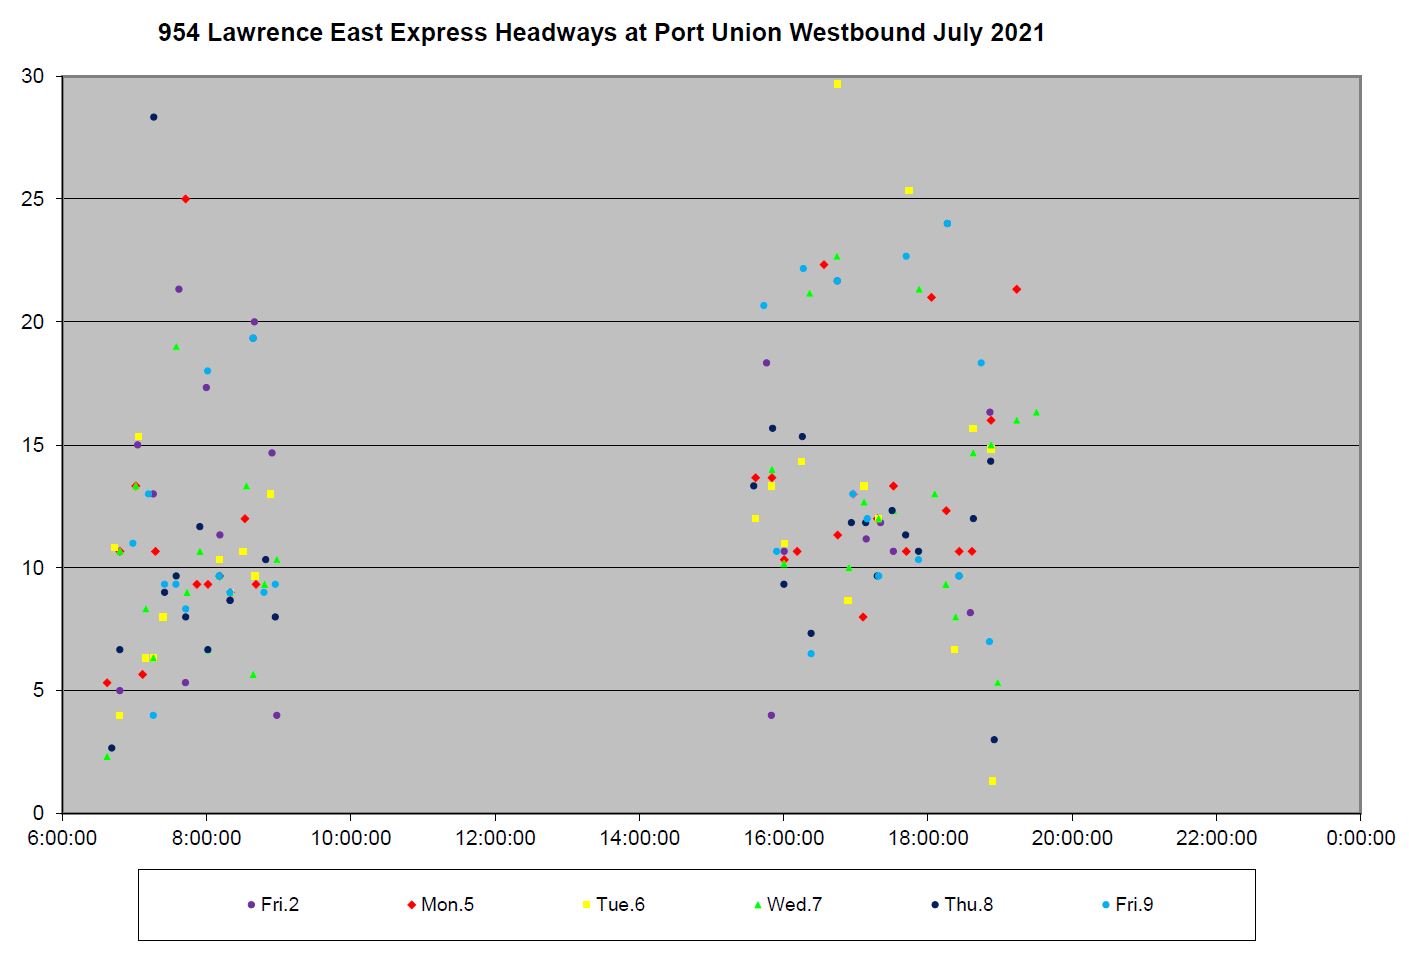
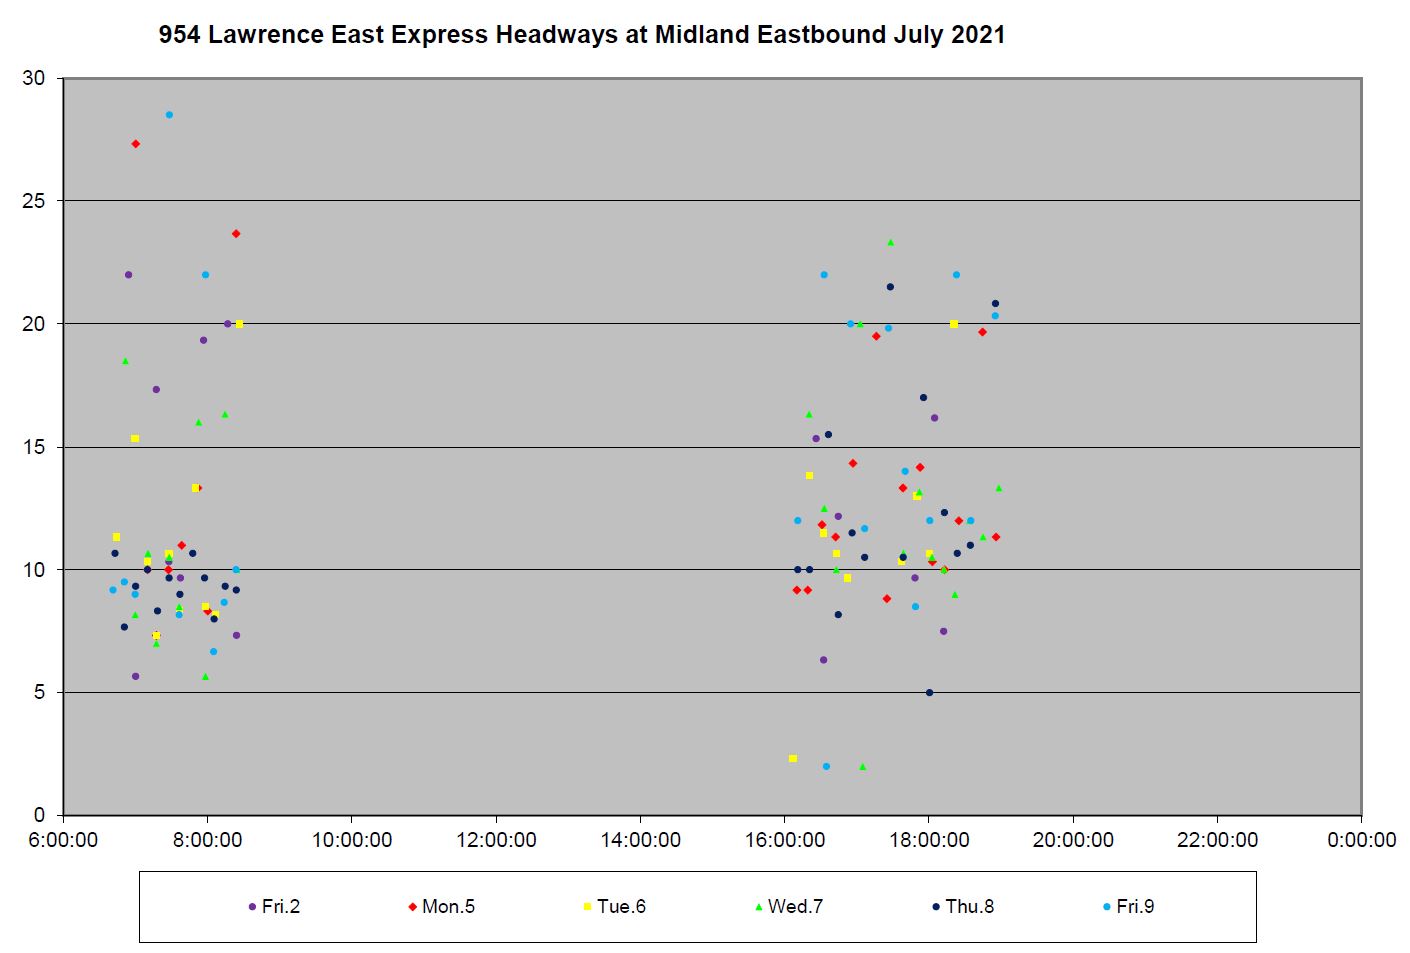
The express service, in spite of operating only on the portion of the Lawrence route not affected by construction, has extremely erratic headways. Here are the data for July 2-9 westbound at Port Union. The values are so badly scattered that any time saving possible with an express bus will easily be negated by the unpredictable wait time for one to appear.
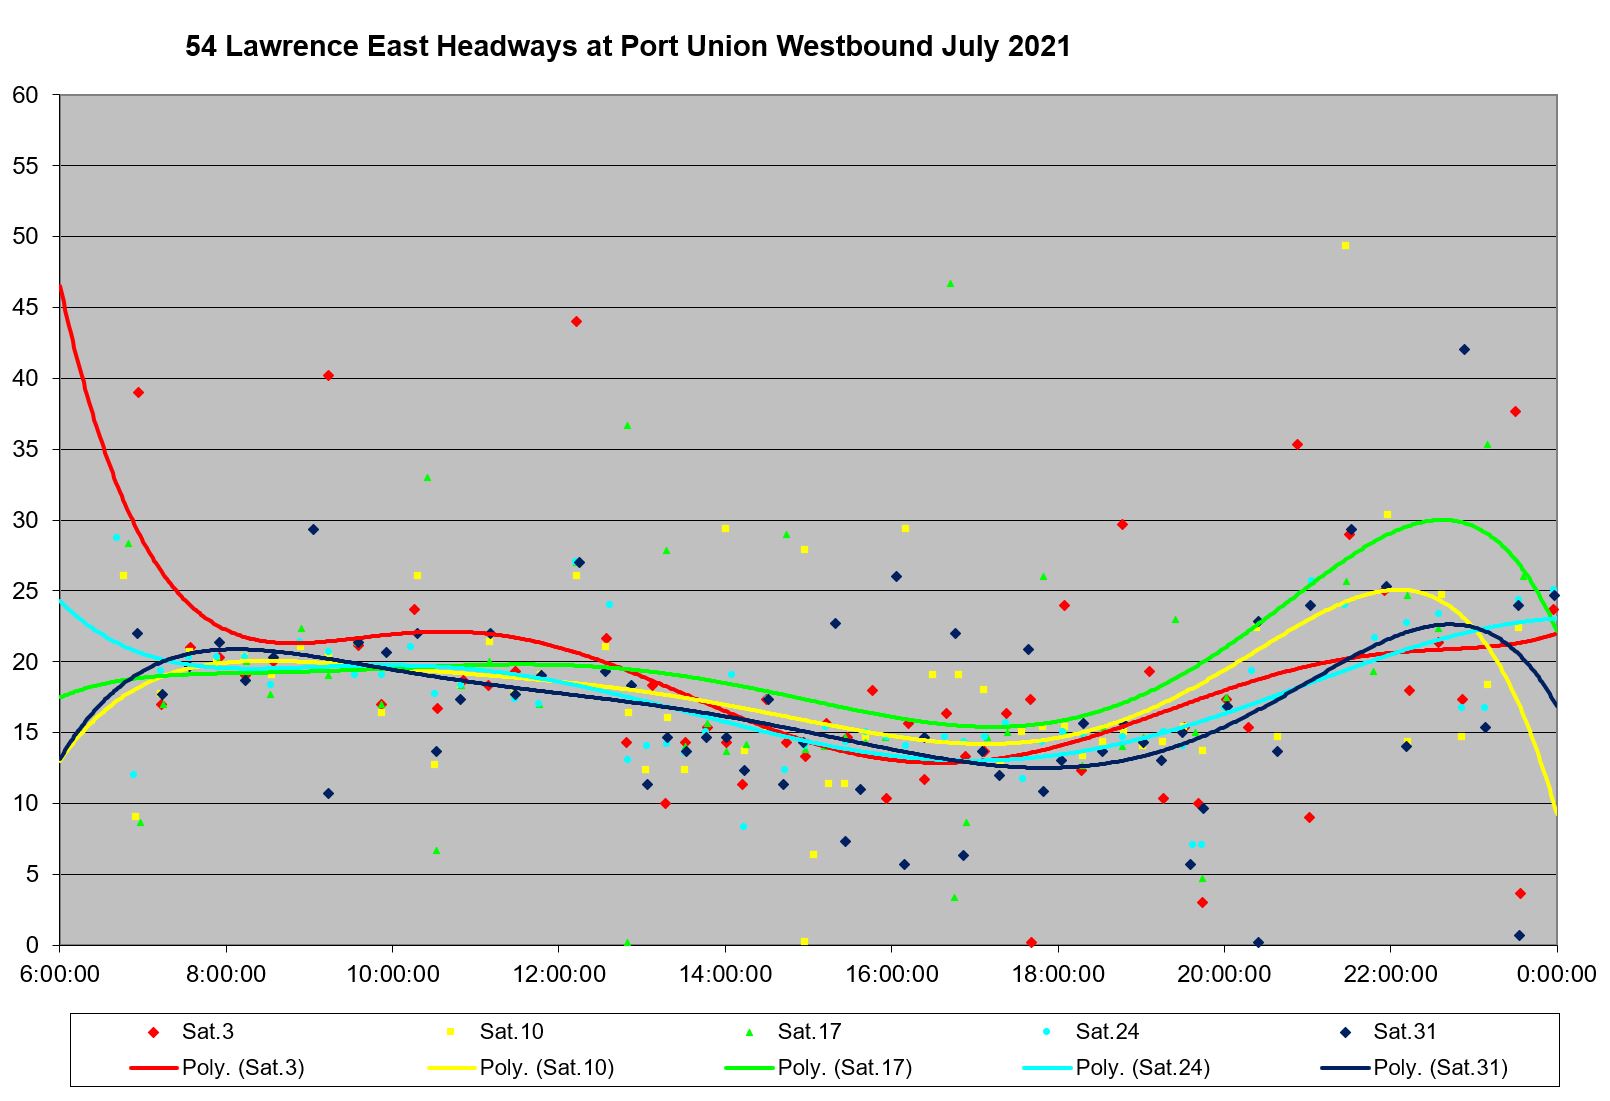
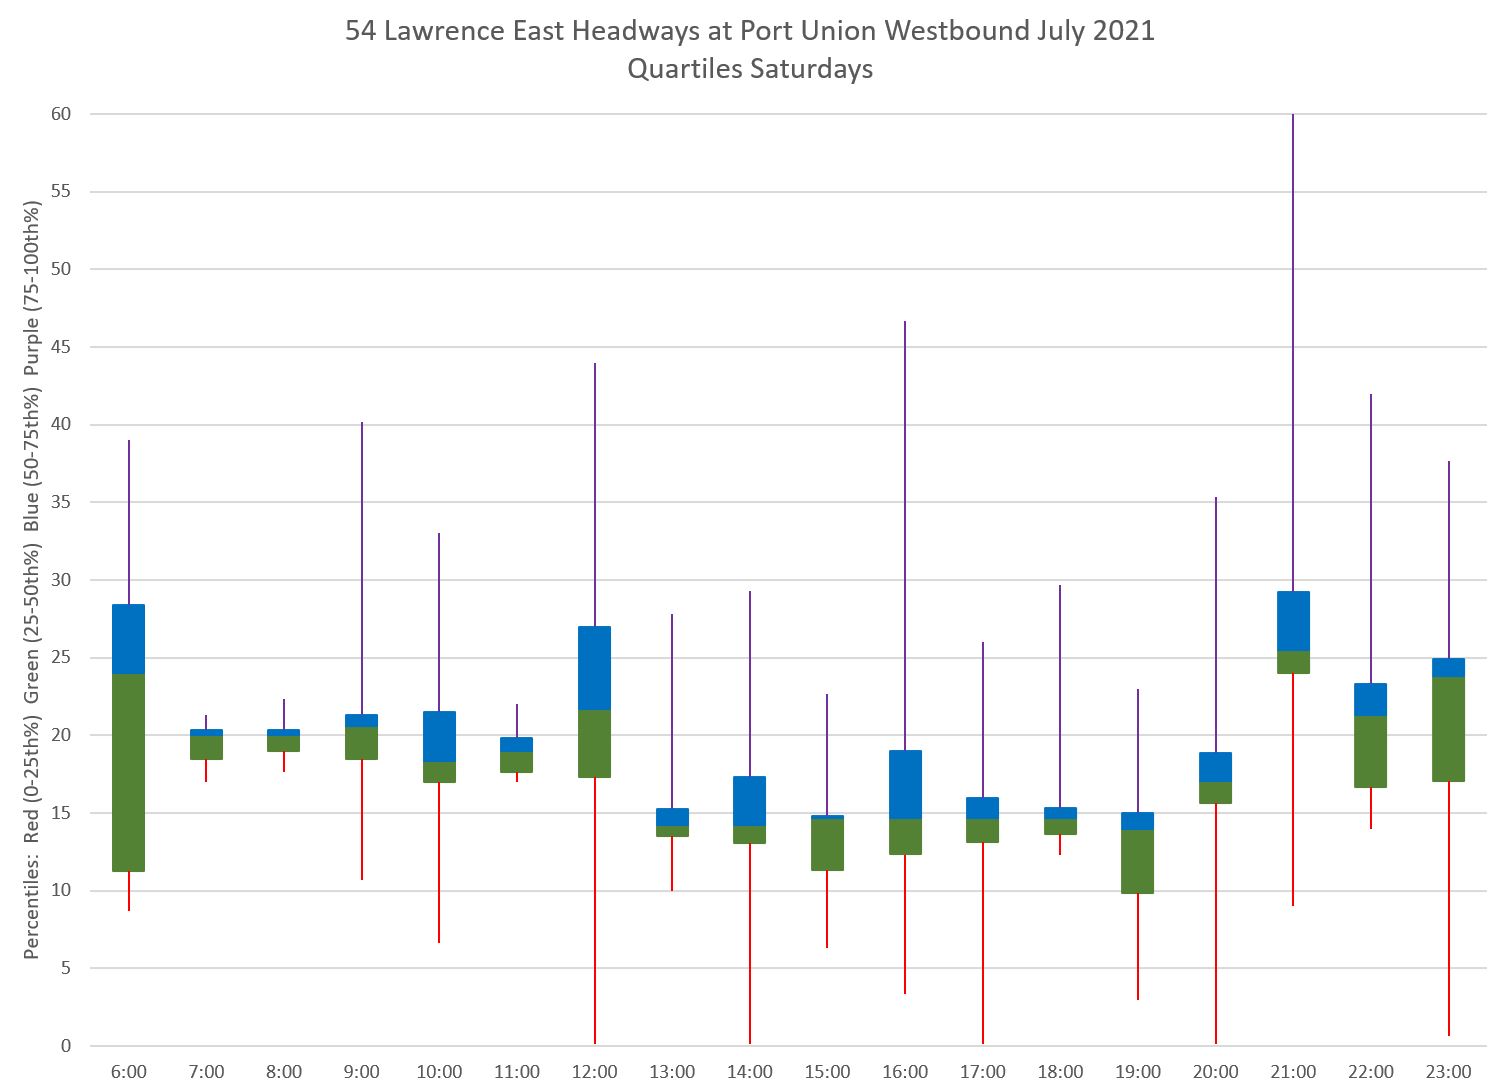
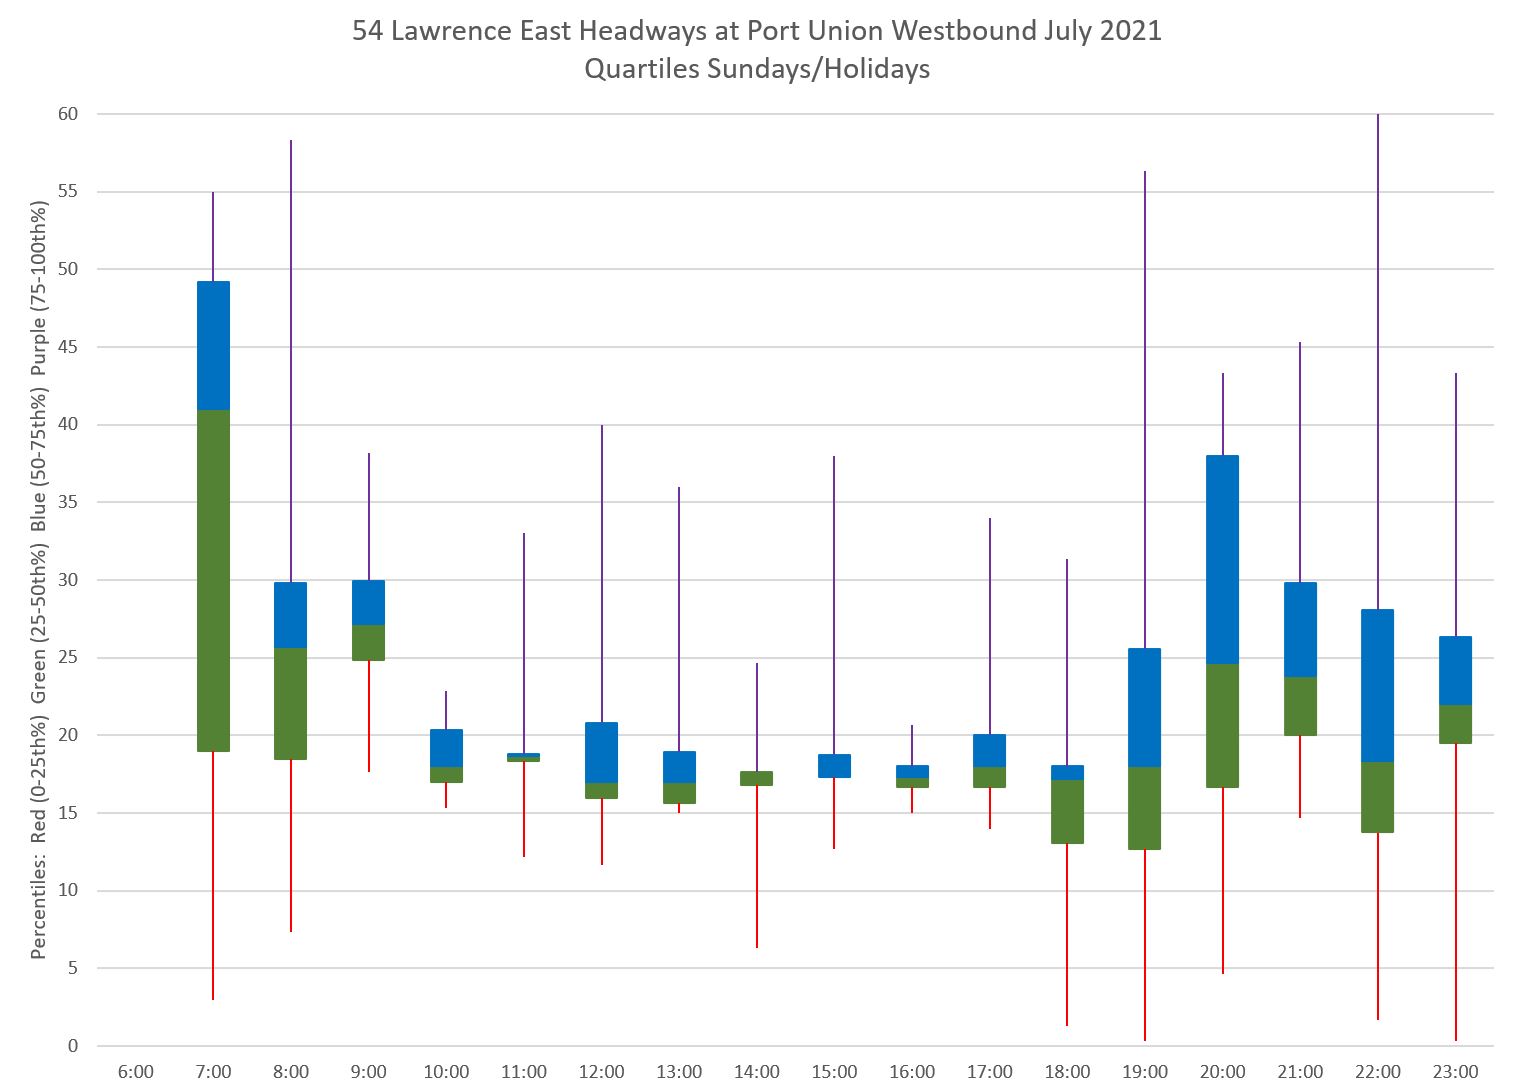
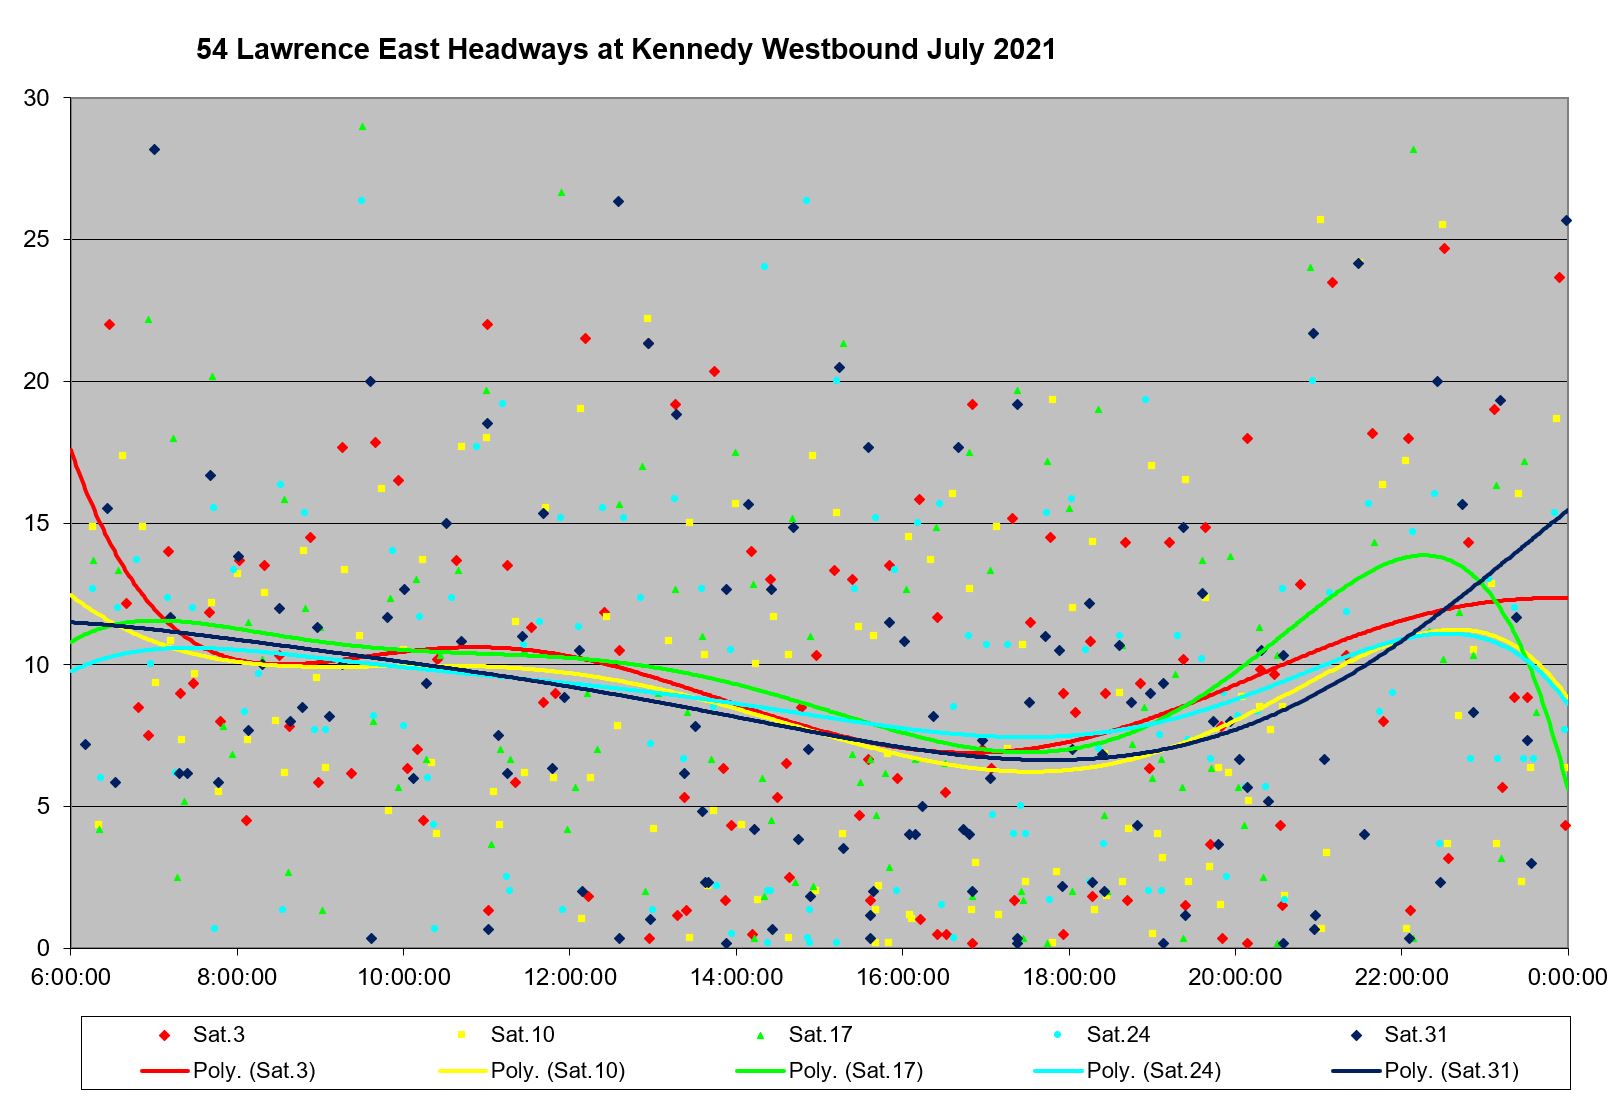
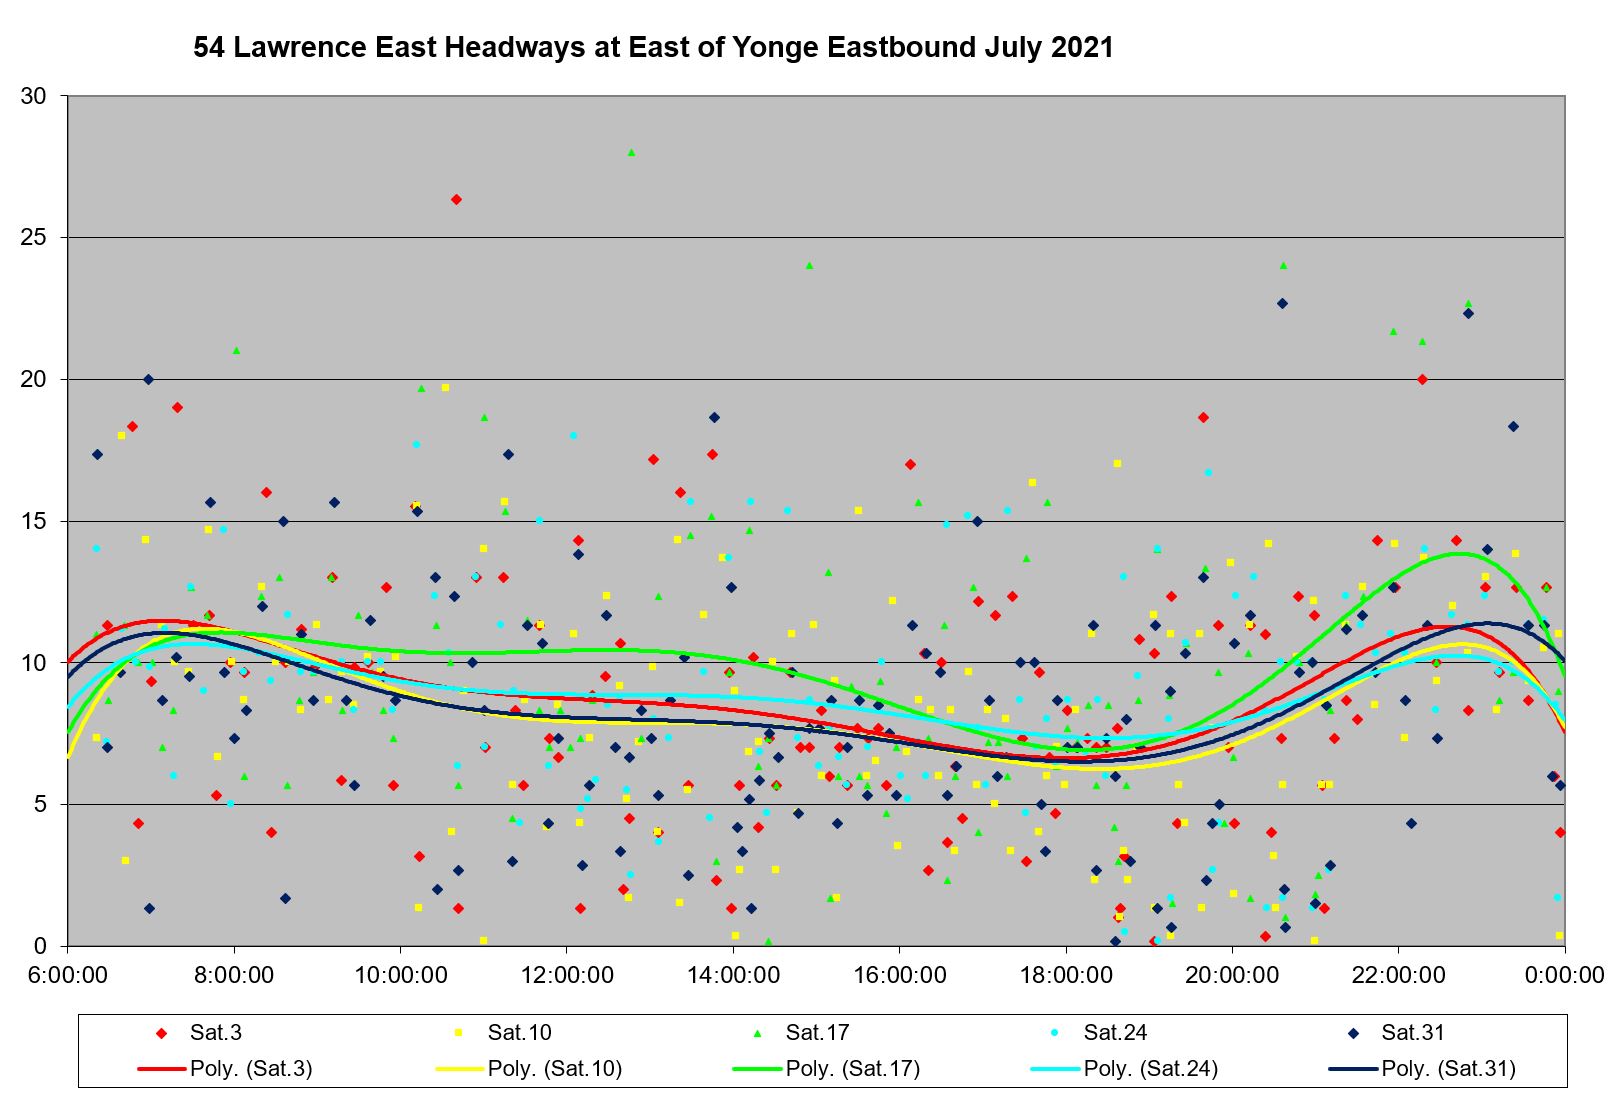
Saturday and Sunday service included enough very wide gaps that they are plotted with a y-axis up to 60 minutes rather than the 30 minutes used for other charts in this section. This is a clear example of service that lies well outside any conceivable target either for “on time performance” or reliable headways.
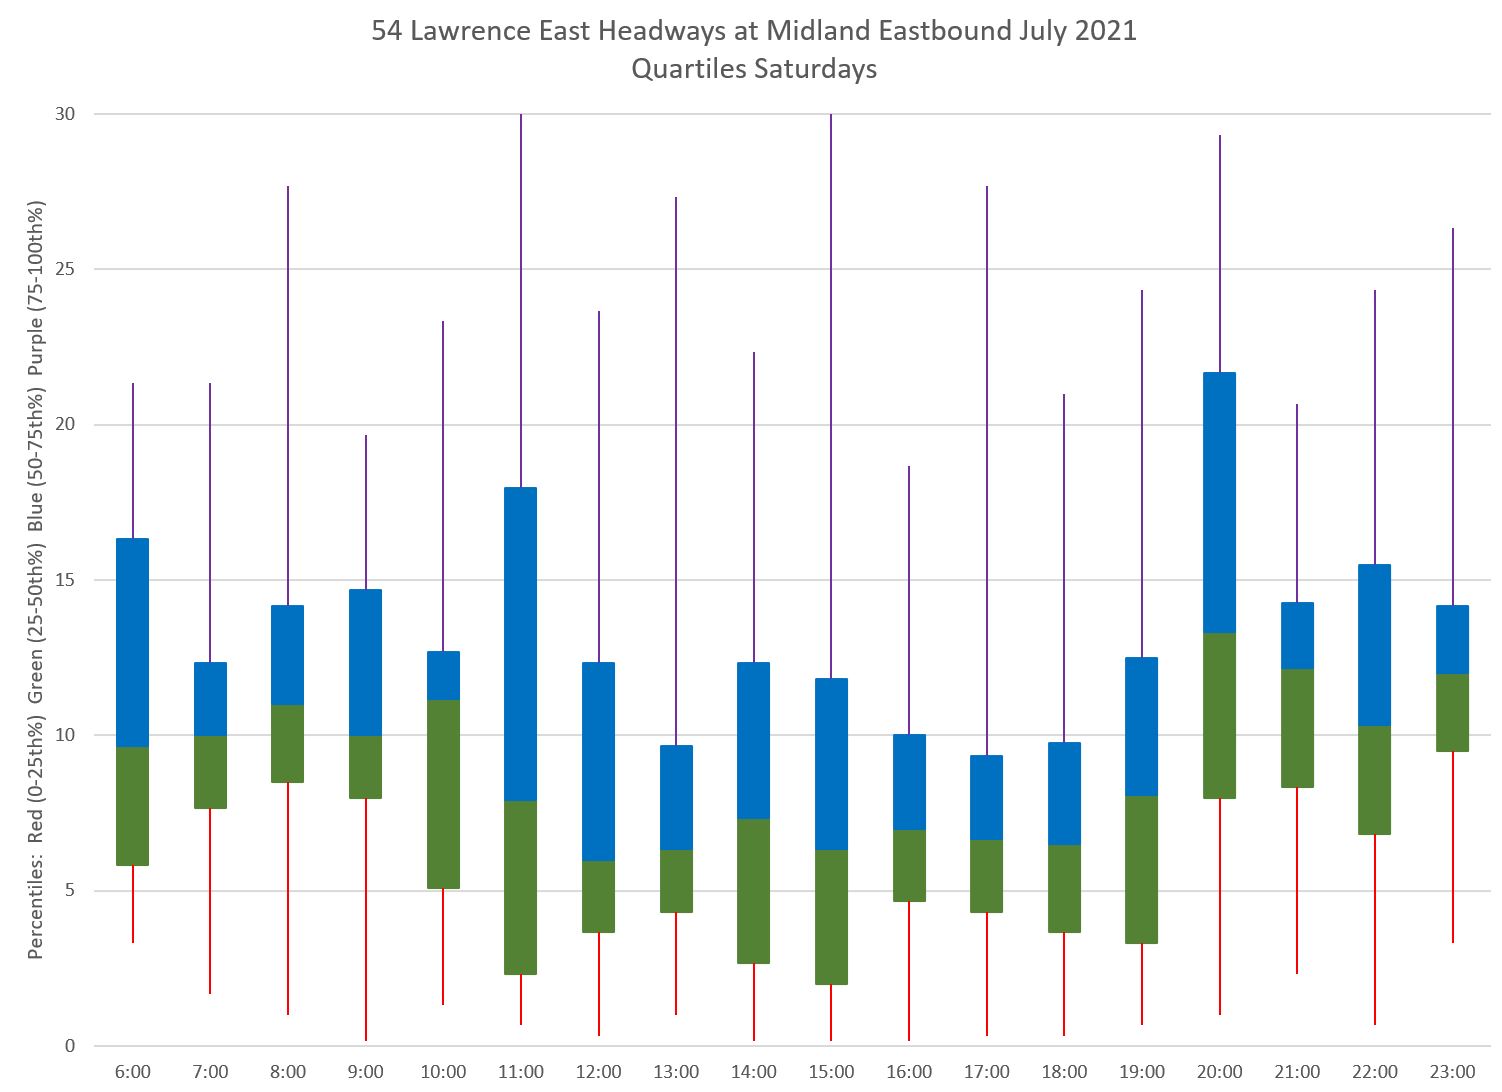
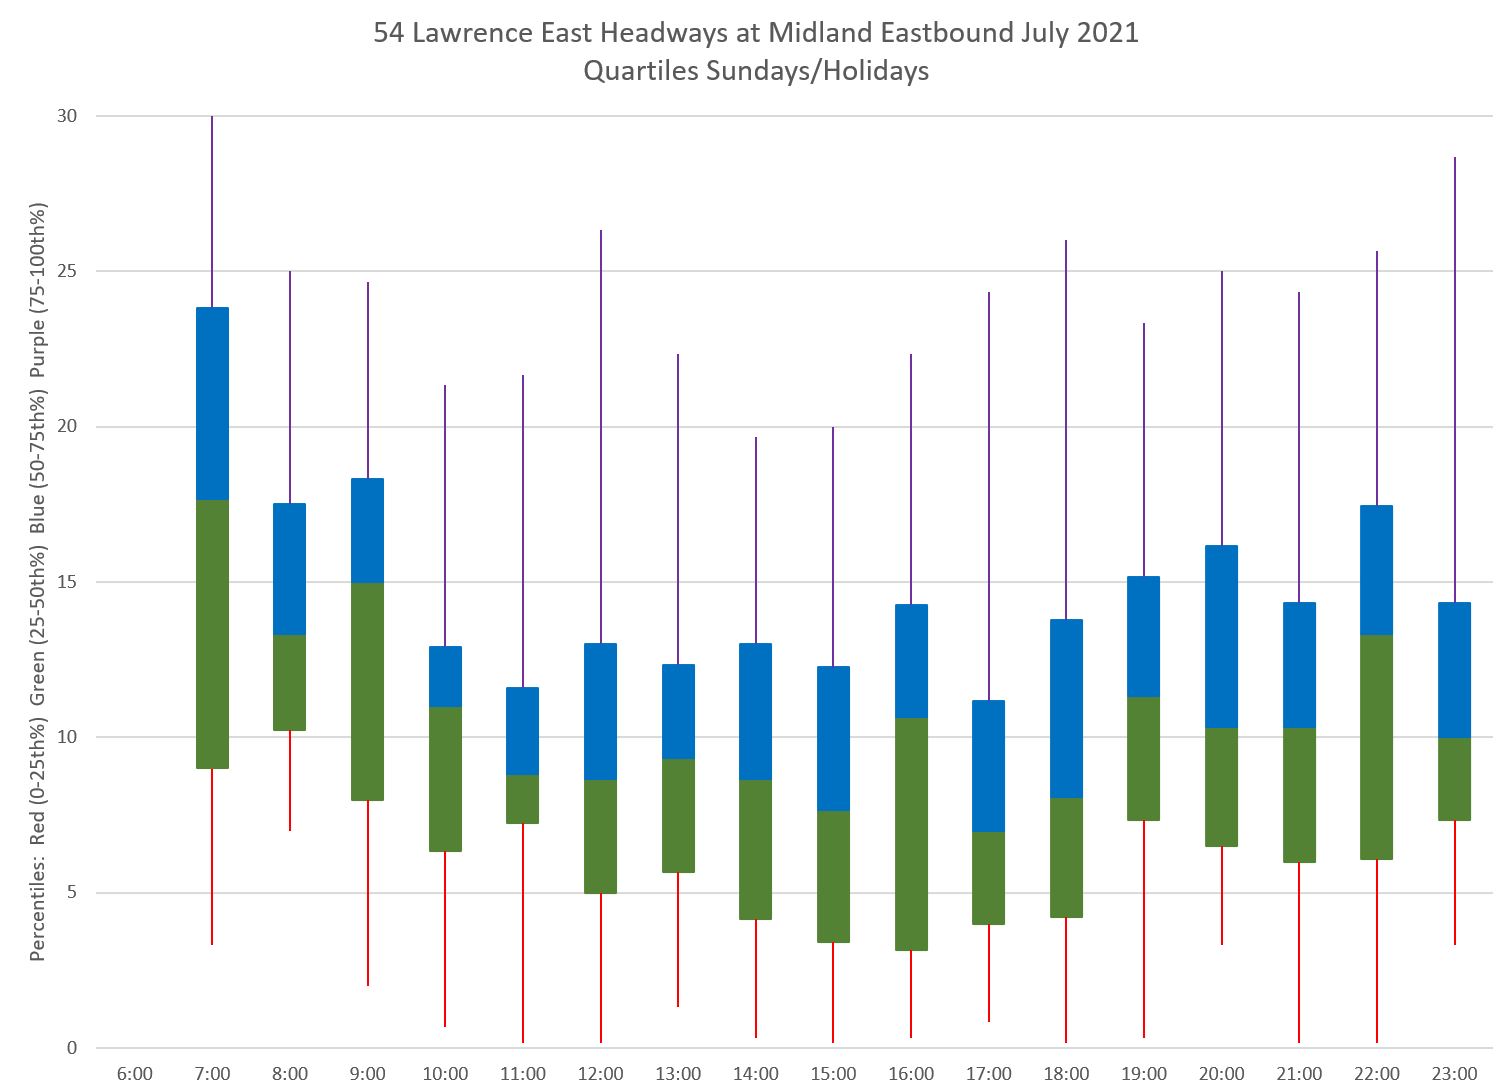
Another way to look at the data is by quartiles. The blue and green boxes contain the middle 50 percent of headways, while the red and purple tails contain the outlying values. Ideally one wants to see most values concentrated in the box, and for that box to be relatively small with short tails such as at 7, 8 and 11 am in the chart below. Long tails are a sign that half of the service (the 1st and 4th quartiles) are spread over a wide range of values. This can occur even when the central quartiles are in a small range.

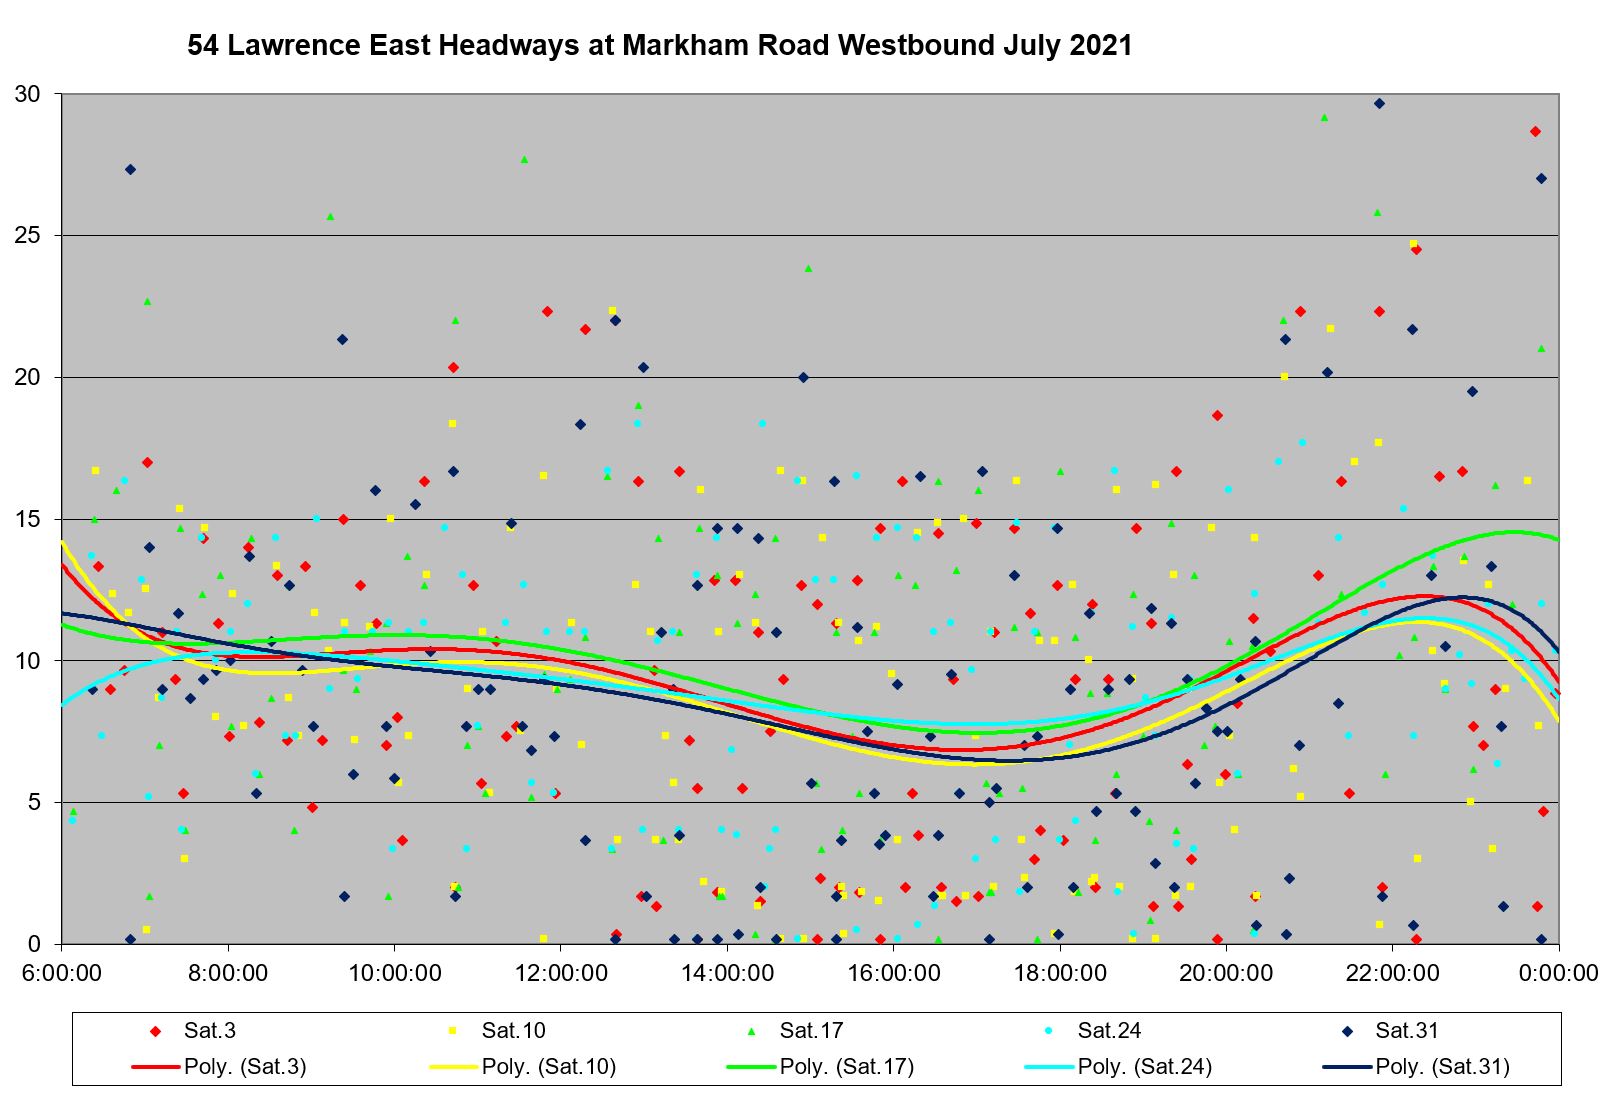
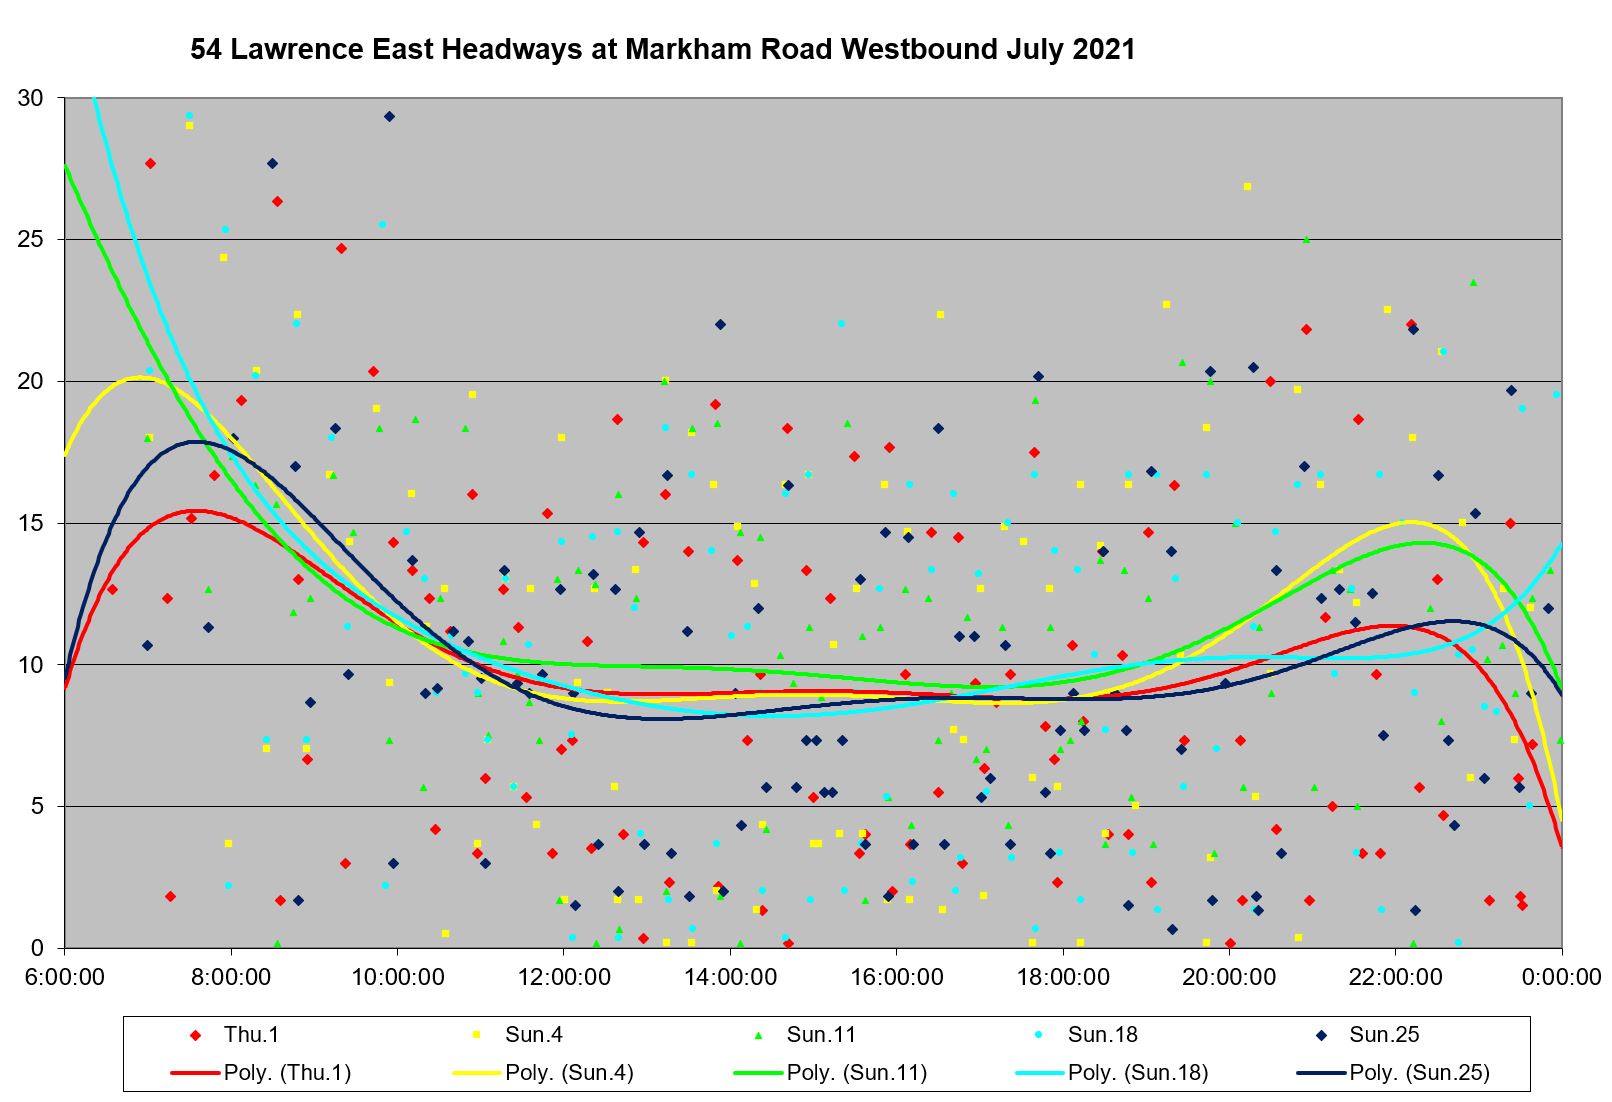
Headway Reliability at Markham Road Westbound
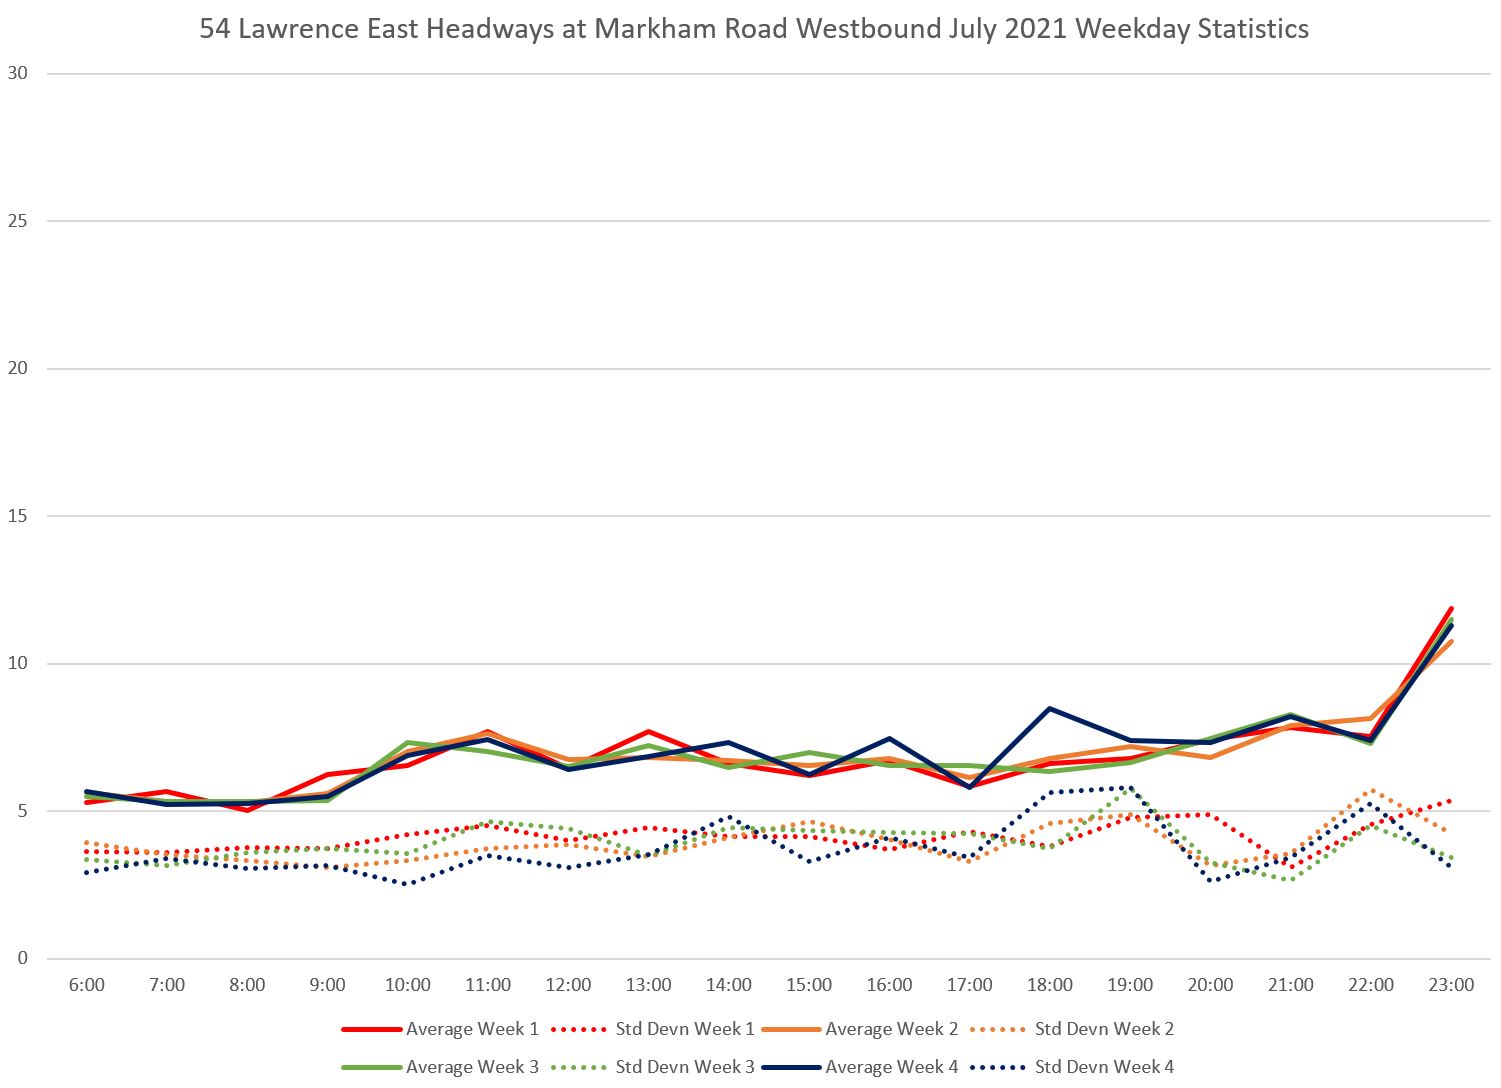
The 54B Orton Park service merges in east of Markham Road either at Scarborough Golf Club or Orton Park depending on the time of day (the direction of the loop reverses). Branching services can create bunching unless there is strong headway discipline, but that is not present here.
In the weekly average chart below, note that the standard deviation values lie close to the average headways indicating that there is a lot of bunching.
Looking at the period from July 2 to 9, one can see the combined effect of erratic service inbound from Starspray with the added departures from the Orton Park loop. The trend lines are very well-behaved, but they are surrounded by a cloud of data points ranging over a band from 0 to 15 minutes all day long.
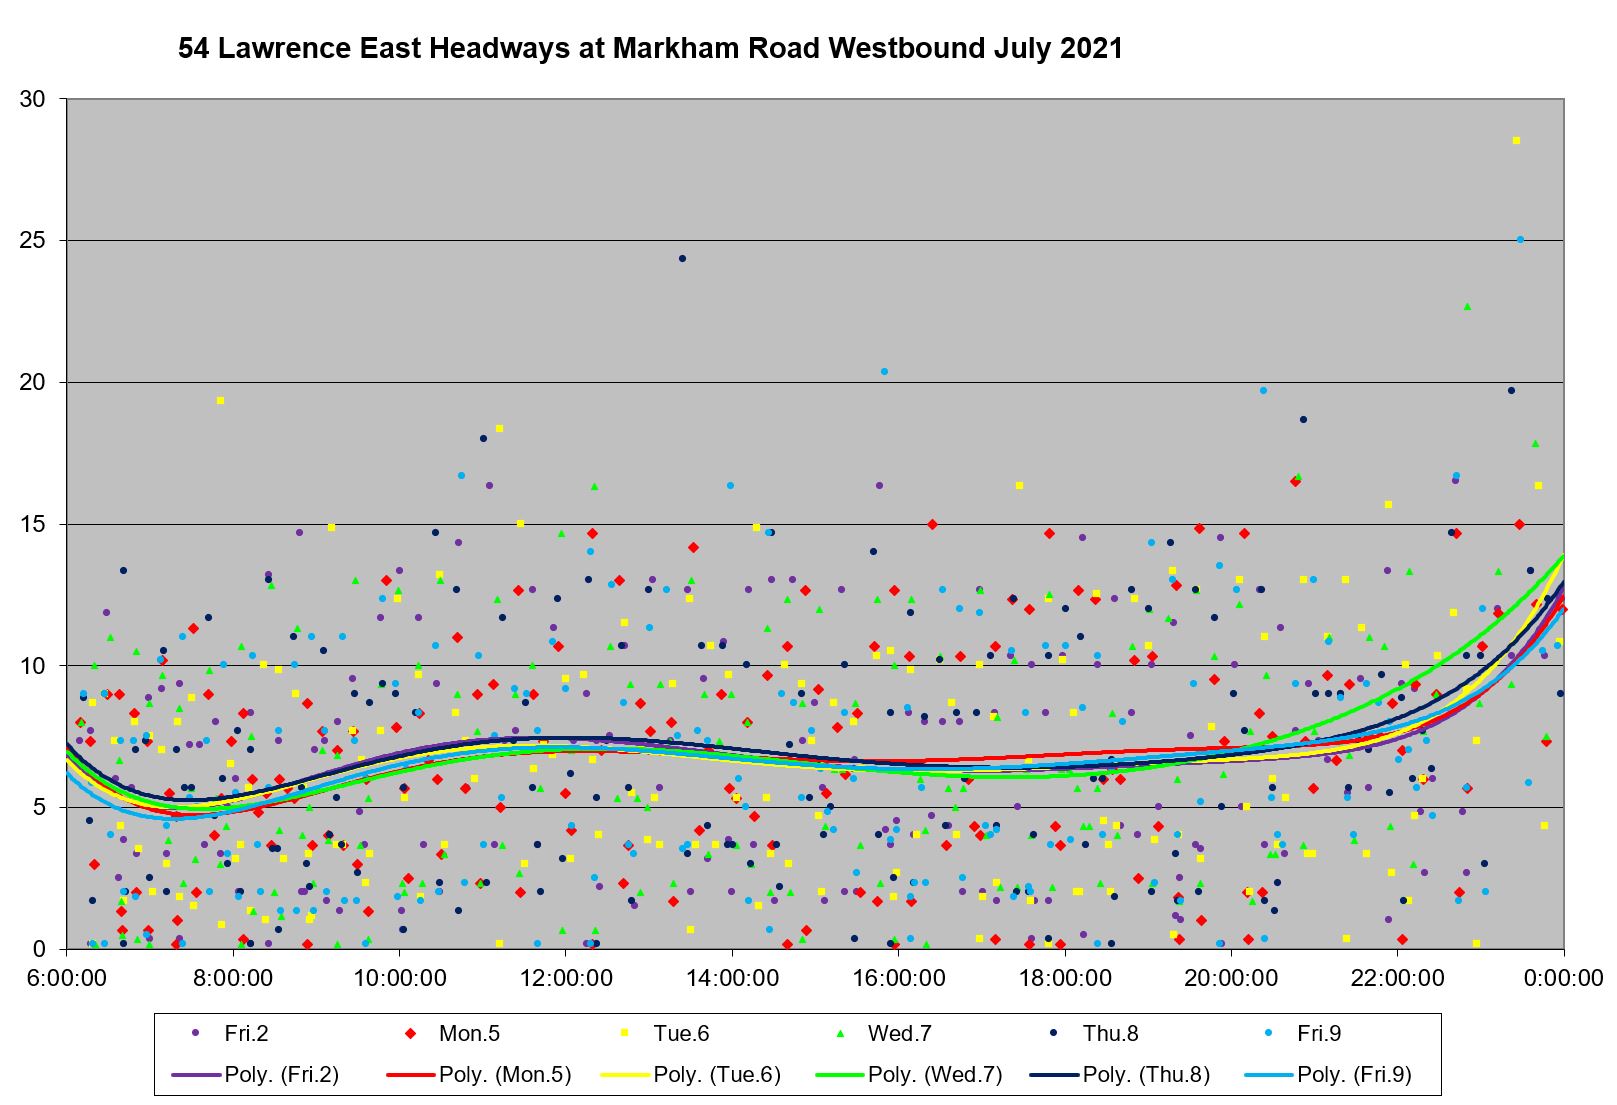
That cloud expands on weekends when scheduled service is less frequent, and it pushes out to 20 minutes and beyond.
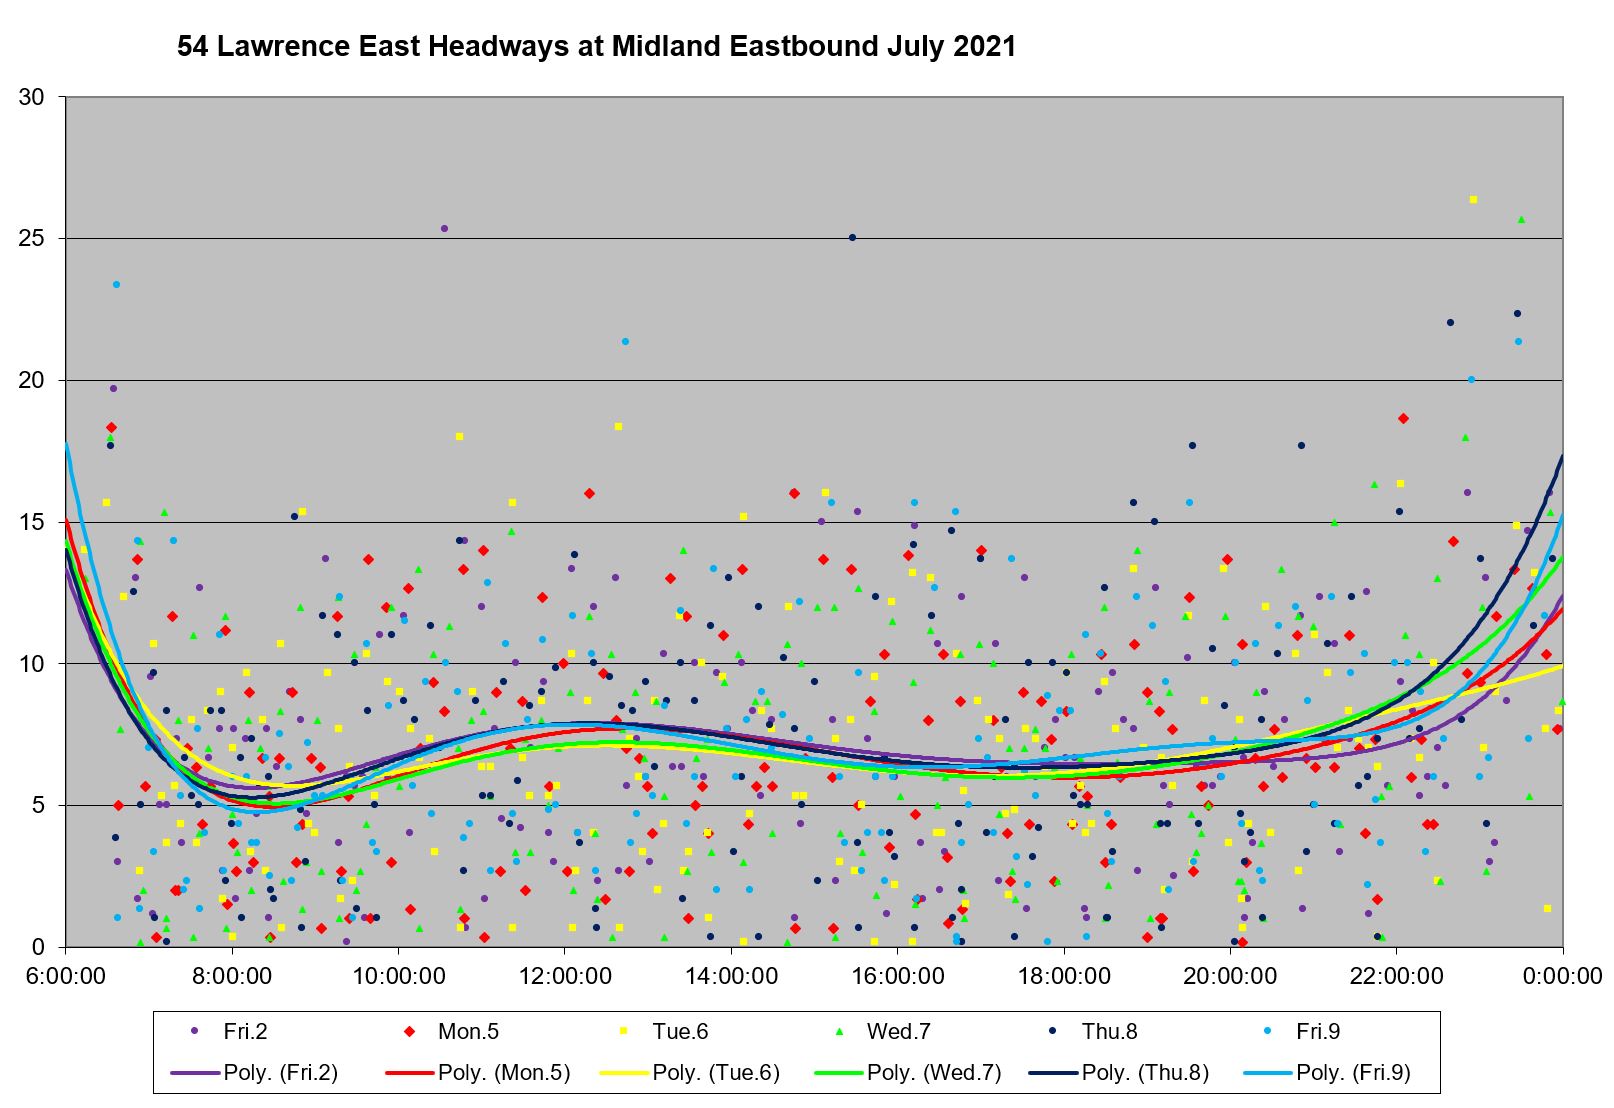
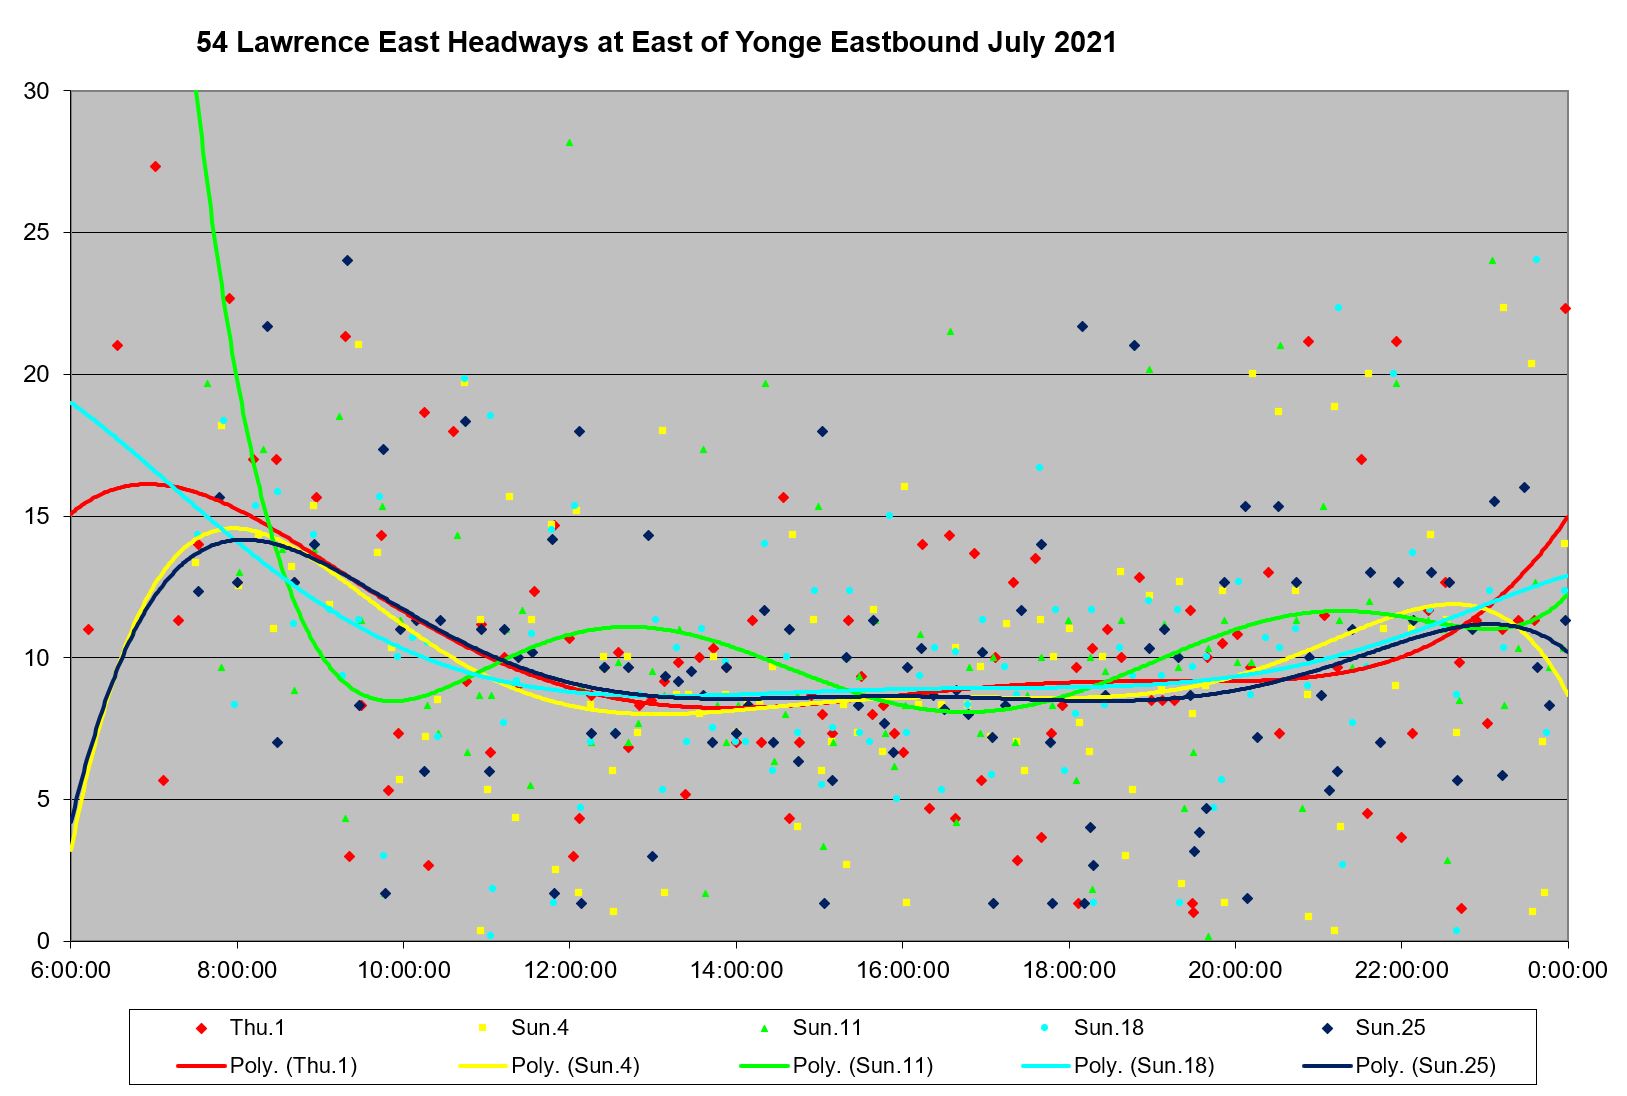
Headway Reliability at Lawrence East Station Eastbound
Lawrence East Station has an off-street loop where one might hope buses could be dispatched on a regular headway. In fact this does not occur.
For these charts, the screenlines are eastbound at Midland and westbound at Kennedy so that any peculiarities in vehicle movements within the station (e.g. looping back and layovers) does not produce a false “departure” in the stats.
Eastbound at Midland, the standard deviation values lie at 4-to-5 minutes, fairly close to the average headway indicating a fair amount of bunching.
The actual data for July 2-9 show headways over a 15-minute range throughout the day.
The express service headways are spread over a wide range as with the westbound service.
Weekends have an even rider range of headways than weekdays.
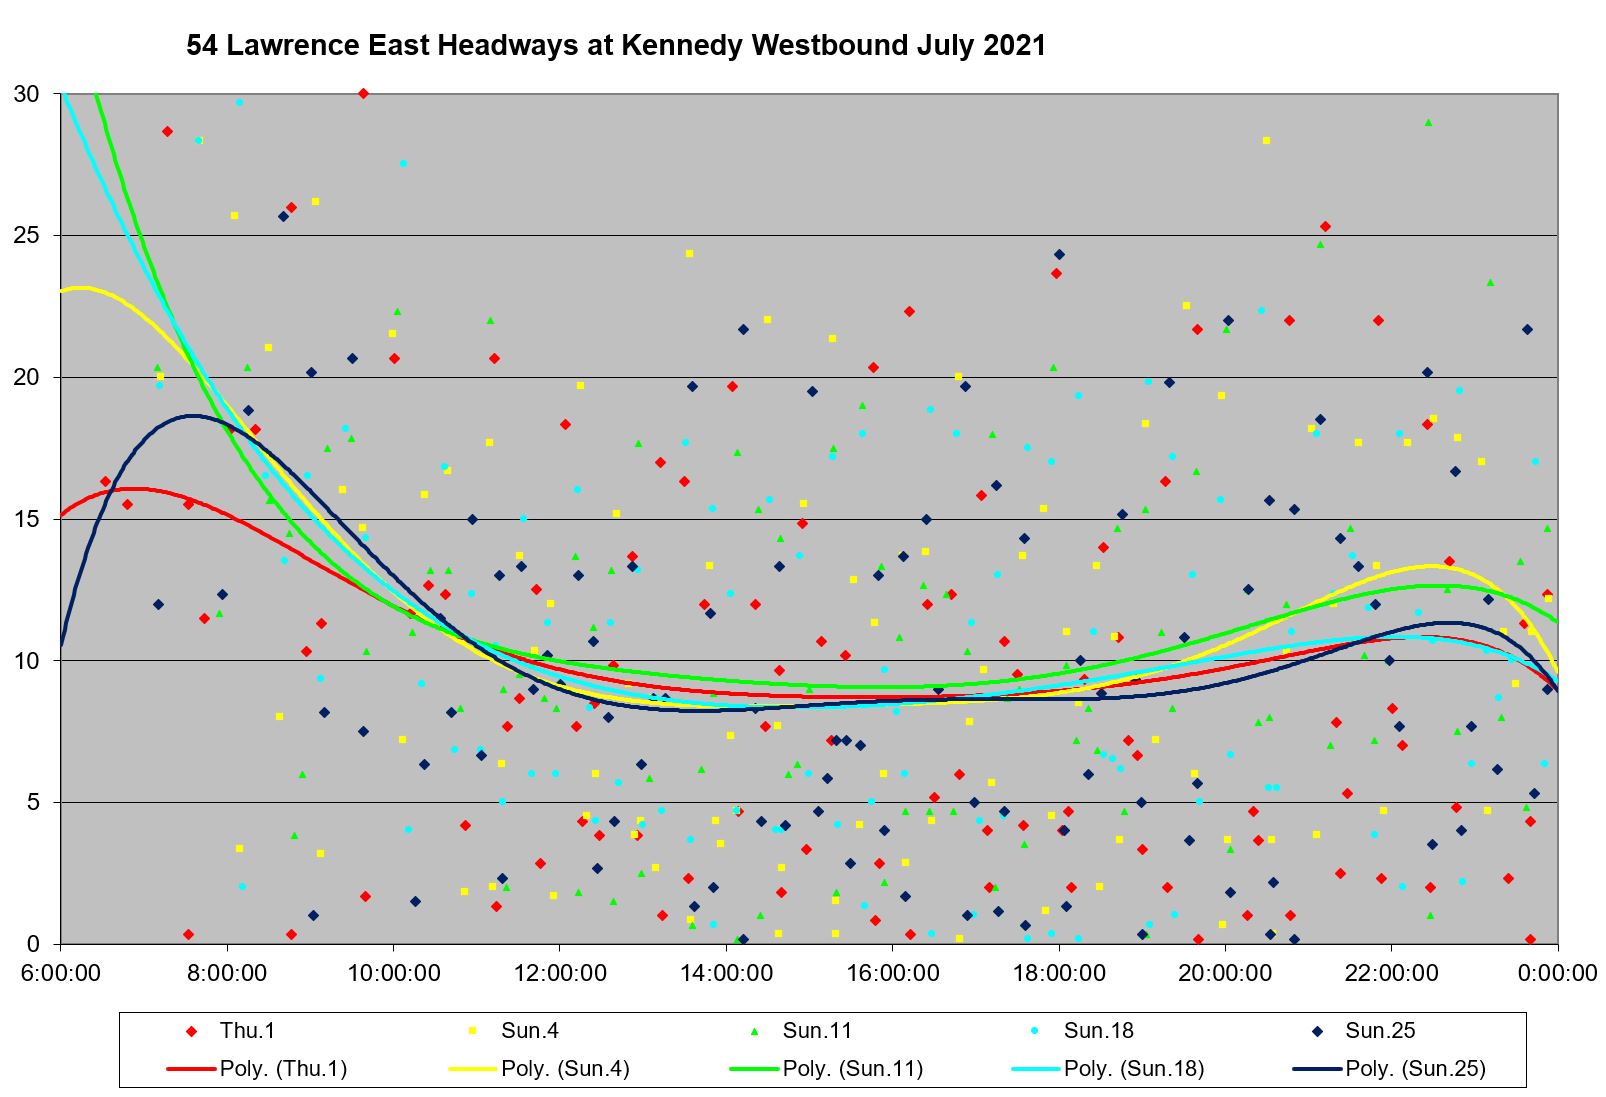
Headway Reliability at Lawrence East Station Westbound
The situation westbound from Lawrence East Station is identical to what is shown above for eastbound service. Headways range over wide values from 0 to 15 minutes on weekdays and more on weekends.
Headway Reliability at Eglinton Station
Service eastbound from Eglinton Station is actually somewhat better behaved than at other parts of the route. The standard deviation of headway values is not as close to the average and many of the data points are more tightly cluster around the trend lines.
Nonetheless, there is a lot of bunching and the only saving grace is that the cloud of data points is narrower than elsewhere on the route and the gaps are therefore not quite as bad.
Full Chart Sets
Travel Time Charts
- Eastbound from Midland to Port Union
- Westbound from Port Union to Midland
- Eastbound from Victoria Park to Kennedy
- Westbound from Kennedy to Victoria Park
- Eastbound from Don Mills to Victoria Park
- Westbound from Victoria Park to Don Mills
Headway Charts
- Westbound at Port Union (local service)
- Westbound at Port Union (express service)
- Westbound at Markham Road (local service)
- Eastbound at Midland (local service)
- Eastbound at Midland (express service)
- Westbound at Kennedy
- Eastbound east of Yonge

Thanks for this Steve. I can attest to the uneven headways throughout the day. I find this route has weird scheduling. Not sure if it’s still in the schedules, but in the May schedules, a westbound 54B coming from Orton Park gets to Orton Park and Lawrence at 5:47am, the exact same time a 54A from Starspray gets there. The 54B is given way less running time and is much faster than the 54A. Just a random observation.
Steve: Yes, the “scheduling” of supposedly blended service with two equal headways has always been a mess. The extra running time on one branch translates into random layovers at terminals because the driver knows that there is lots of padding is he takes a long break. As and when the 54B becomes a Kingston Road short turn, it will be interesting to see if this is finally fixed, or perpetuated in the new arrangement.
LikeLike
When I was going to Ryerson and living near Pt. Union and Lawrence, I took the GO in the morning, but coming home it was often actually faster to take the TTC, because if I finished before 3, I would get to Union about quarter after, but the train left at 13 past, so I’d have to wait almost an hour for the next one.
If the 54E was running by the time I got to Lawrence East, I still just took whichever showed up first, because I found that while the E only stopped at McCowan and Markham, it then tended to make almost every stop after that. The A, on the other hand, stopped at most stops before Markham, then skipped most of the stops after. So the actual travel time was similar.
LikeLike
When I lived in Scarborough near Lawrence and Warden, 1 stop north and 1 stop east, I could leave my house at the same time, walk to Lawrence and get the same run number everyday at the same time, unless there was snow, same for Warden. Sad to see how unmanaged the system has become.
LikeLike