
Updated June 17, 2017 at 7:30 pm: A new set of charts has been added at the end of this article to display the service capacity actually operated at various points and times on Queen in a manner that more clearly slows what is going on. The original charts have been left for reference.
This article continues the comparison of bus and streetcar operations on 501 Queen by reviewing the capacity of service actually provided on the route.
The chart below shows the hourly scheduled capacity of the route for its basic service in the central part of the route. This does not include the contribution of any trippers, only the regular service passing Yonge Street in each direction.

For all but the last two entries (May and June 2017) service is scheduled to be provided by ALRVs which have a design capacity for planning purposes of 108. For the last two months, service is provided by buses with a design capacity of 51.
There are minor variations from fall 2013 to February 2017 that are mainly caused by schedule changes related to whether or not the route operates as one continuous Neville to Long Branch line, or if it is broken at Humber. For the through service, headways are slightly different because of the need to blend service on the two branches.
In March 2017, running time was added to the route to accommodate a construction diversion that was not actually implemented. This was done only by stretching the headway, not by adding cars to the route thanks to the overall shortage of streetcars. The result was a drop in both the cars/hour value and the scheduled capacity.
In May 2017, streetcars were replaced by buses, but thanks to the shortage of buses, the capacity of the scheduled service was well below the level that streetcars had been providing. Although there were many more vehicles/hour, their much lower capacity meant that the scheduled capacity was below that of the streetcar service (especially when February 2017 or earlier is used as a base). The reduction was 17% in the AM peak and 27% in the PM peak, and this on a route that (a) the TTC knows is running over capacity and (b) has not had a service increase for many years thanks to the shortage of streetcars.
Providing equal capacity would require that buses operate more frequently than they are now scheduled to do.
This type of scheduling has been used in many places across the TTC system where requirements for extra running time have been achieved by running vehicles less frequently.
Additional Services
From the east, the 501 Queen service is supplemented by the 502 Downtowner and 503 Kingston Road Tripper routes which have added varying amounts of capacity west of Kingston Road. Headways and vehicle types changed from time to time primarily in response to equipment shortages. Note that because these routes serve different streets downtown, only half of the blended capacity is actually available outbound, and even this is compromised by ragged service, short turns (502 cars short turning at Church without serving Yonge Street eastbound) and missing vehicles (notably on the 503).
From the west, a small numbers of trippers were scheduled for the AM peak service inbound until January 2017. The number and vehicle type varied depending on availability.

Actual Service Provided
The service provided hour-to-hour and day-to-day is not as uniform as the chart above might suggest. The following chart sets illustrate the number of vehicles per hour and capacity of service actually operated on weekdays between September 2015 and May 2017.
Four pairs of charts in each set have the following layouts corresponding to four hours of operation in the AM or PM peak periods. In each case, data for individual days are plotted to show that there is some unevenness day-to-day. One cannot count on getting the same capacity of service every time one walks to a stop.
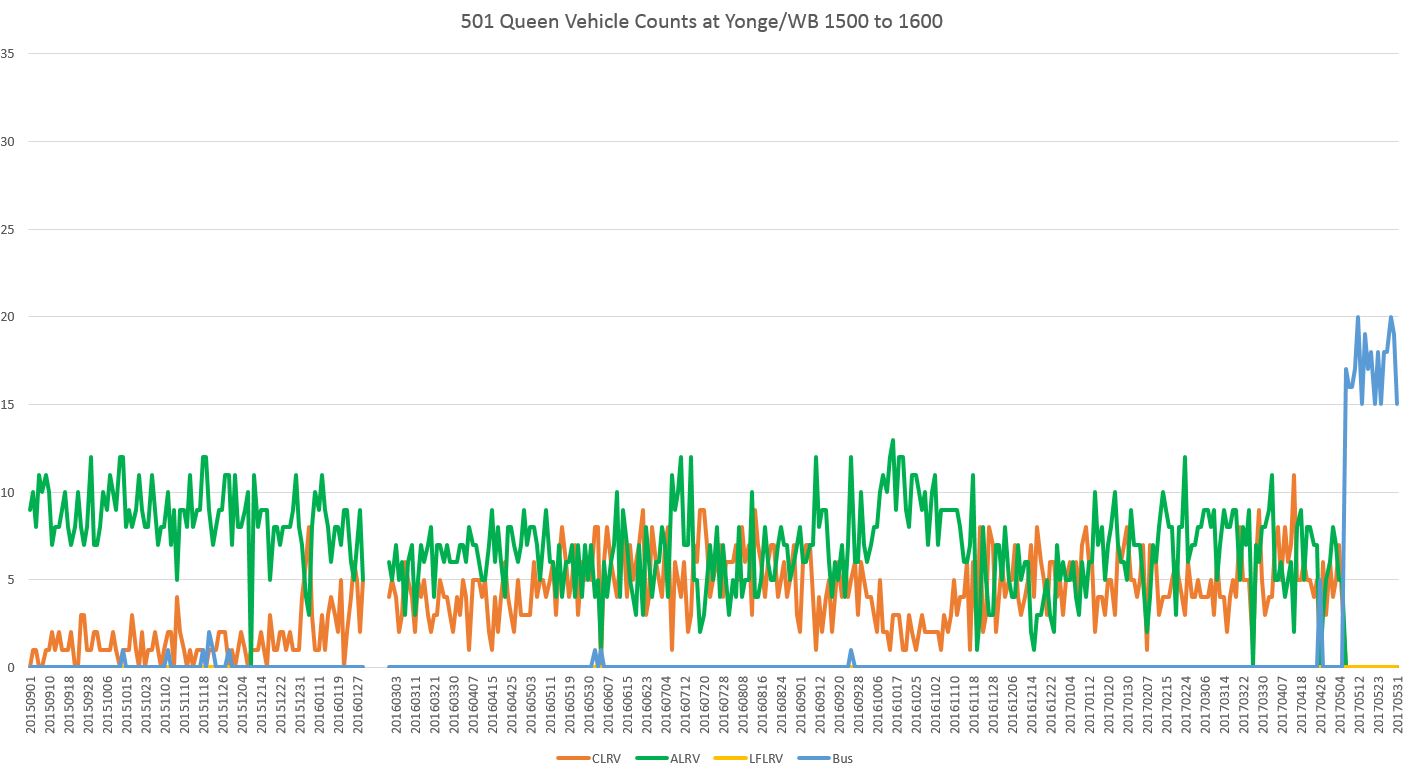
The first chart type (below) plots the vehicle counts by type with CLRVs in orange, ALRVs in green and buses in blue. Of course there should not be any CLRVs on this route, but it is clear that they have contributed substantially to operations going back to late 2015. The use of ALRVs has been correspondingly reduced during most periods and this has affected route capacity.
The second type of chart converts the vehicle counts into service capacity based on the design load for each vehicle type. The capacity actually provided is typically less than the scheduled value, although it spikes higher and lower due to bunching and gapping of the service. Particularly low values can be caused by service diversions or blockages that cause little or no service to pass the reference point during the hour charted.

The last page sums the capacity provided over the four-hour period covered by these charts.

AM Peak Data
Greenwood is used to show AM peak service inbound from The Beach because this avoids problems with periods when bus shuttles covered the eastern end of the line. These shuttles did not run through to downtown, and generally operated with less capacity than the streetcar service. From Russell Yard westbound, streetcar service was in place. The numbers here do not include the capacity of streetcars or buses on the 502/503 services.
Lansdowne shows the AM peak service inbound through Parkdale. Counts here do not include buses running on the Dufferin to Long Branch 501L service, only the streetcars running to downtown including the Queen trippers, when they exist.
Royal York is included to show how service has evolved on the Long Branch section of the route. The capacity provided has stayed roughly the same except for the period from 6:00 to 7:00 am.
PM Peak Data
For the PM peak, capacity is shown outbound from Yonge Street. This does not include any streetcars or buses on the 502 Downtowner service, only the 501.
The decline in capacity is quite noticeable, although this had started before the bus replacement service thanks to the replacement of several ALRV streetcar runs with the lower capacity CLRVs. The bus service operates at a capacity well below that of the streetcars as they were in 2015-16.
The point here is that streetcar capacity was reduced due to a shortage of vehicles, and the line continues to operate below the level formerly provided. The TTC has publicly stated that streetcar routes are overcrowded and running with loads above the design capacity. Serving the route at the level demand the TTC implies is present would require more buses and more frequent service than are now scheduled.
Updated June 17, 2017:
The sets of charts linked below present the same data as those above, but in a different format to more clearly show the relative level of service provided at various locations and times on Queen Street.
Here is a sample of the revised format:

The differences in this chart from previous versions are:
- The data are shown for only one year from June 2016 to May 2017 rather then from September 2015 to give the chart a bit more “elbow room”.
- The capacity contributed by each mode is shown as a solid area. Vehicle counts are not included in this set of charts, but they height of each colour band is proportional both to the number of vehicles and the capacity this represents for each type.
- A reference line showing the scheduled capacity based on ALRVs (for streetcar service) and standard sized buses is included for PM peak charts. This is not included in the AM because the level of scheduled service varies over the four hour period rather than being constant as it is in the PM.
AM Peak
Westbound at Greenwood, the cutback in capacity began in fall 2016 and continued in 2017. The effect varies by time period.
Eastbound at Lansdowne, the capacity between 0600 and 0700 is particularly low, likely because of the distance of garages supplying the bus service from the route. Building up the service later allows these buses to leave garages later than if the service ramped up at the same time as the streetcar operations. The four-hour total for this chart should be read with care because it includes the effect of the later start of frequent service for the bus operations.
The service level on the Lake Shore is lower than on the rest of the route, but the capacity is much more stable than on other parts of the route because service was (mainly) captive to this segment.
PM Peak
Both ways at Yonge Street, the drop in capacity provided by buses shows up clearly in these charts. Equally troubling, however, is the wide variety of capacities over time provided by streetcars which, in theory, operated at the same scheduled headway throughout. An important factor in this was the variation in the proportion of service provided by the smaller CLRVs.
