
This article continues a topic begun with Part I regarding the replacement of streetcars by buses over the entire Queen route due to several construction projects affecting the route this summer.
In the first article I reviewed vehicle tracking data for April 2017 when Queen was operating with streetcars between Neville Loop and Roncesvalles with data for May 7-31 after the route had been converted to buses. This look at month-long averages gives an initial impression that buses are faster under certain circumstances (period of lighter load and less traffic congestion), but this prompted me to look at other data to see if the pattern was consistent. What quickly appeared was that April 2017 was an unusually bad month for the route, and so average travel times in some areas were pushed above what is seen in other periods.
This article explores a more detailed look at historical travel time patterns on Queen. Apologies to readers who only want the highlights. I have included many charts in this post because some of you like a lot of detail and the ability to “look under the covers”. An important consideration here is that there is a great deal of variability in conditions on any route, and averages do not tell the full story.
The following sets of charts summarize historical data for Queen Street travel times from August 2013 to May 2017. There are a few small gaps either because I do not have data (November and December 2013, February 2016) or because for some periods through service did not operate over portions of the route (e.g. the fall 2016 construction project at Neville Loop).
As mentioned in Part I, note that for the purpose of this analysis, Silver Birch Avenue, a short distance west of Neville Loop, is used as the screen line for purpose of calculating trip times. This eliminates problems with vehicles laying over on street west of Neville Loop causing “travel” times to be artificially extended.
- 501_YongeRonces_WB_LinkHistory
- 501_RoncesYonge_EB_LinkHistory
- 501_SilverBirchYonge_WB_LinkHistory
- 501_YongeSilverBirch_EB_LinkHistory
Each chart set contains six pages which break down the day from 6:00 am to midnight in half-hourly segments. As a guide to reading them, here is a sample page from the first set. (Click to enlarge.)
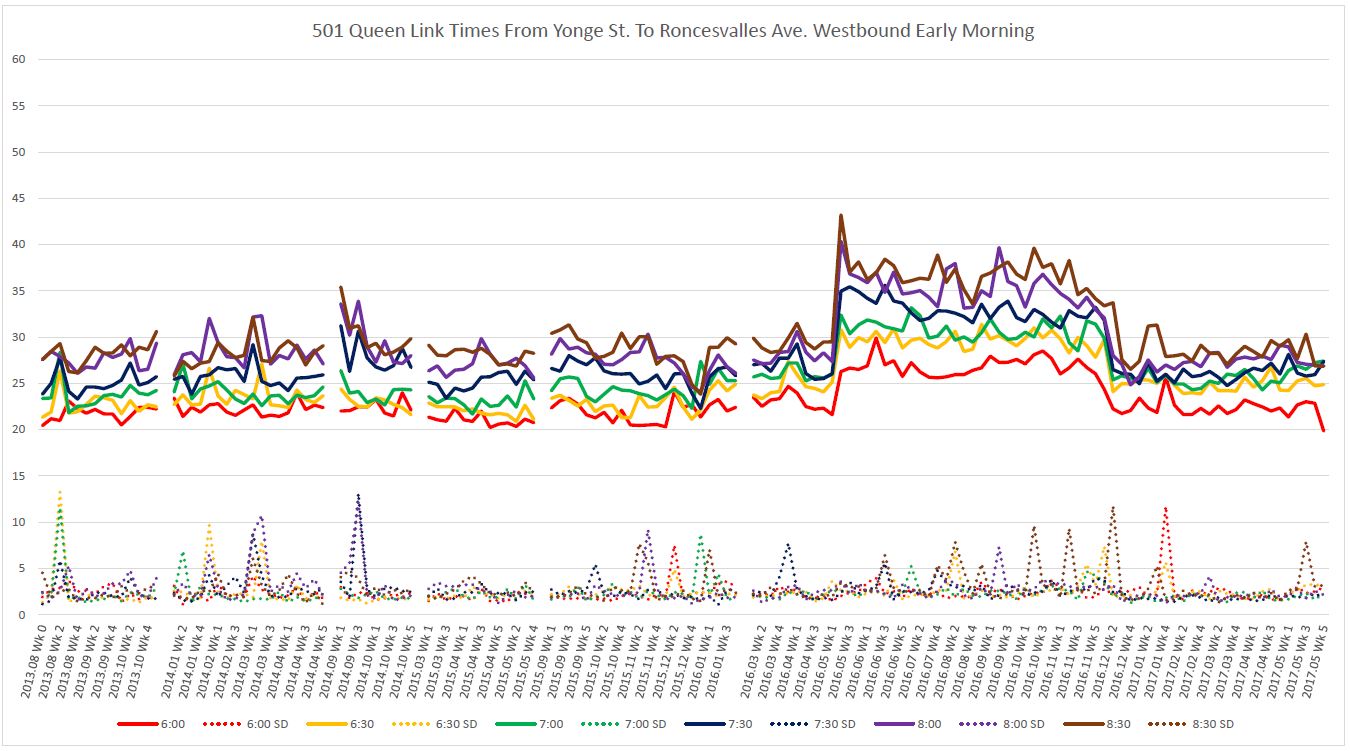
The solid lines show the average travel times, by half hour, westbound from Yonge to Roncesvalles. The dotted lines show the standard deviation of the values indicating the degree to which they are clustered around the average or dispersed over a wider range. The SD values in these charts can be “spiky” because the number of data points within a half-hour for one week is relatively small, and it does not take many unusually large values to raise the SD. In previous charts (in Part I) where data are consolidated by hour on a monthly basis, this is less of a problem.
To view data for the entire day, open the PDF linked above.
Yonge to Roncesvalles
The most striking feature of these charts is that running times through much of 2016 were longer. This was a direct result of the extended diversion of service via King between Spadina and Shaw for watermain construction on Queen. Another effect seen particularly in the afternoon chart is the effect of the TIFF diversion of King service onto Queen Street in 2014. This added many streetcar movements to Queen for which absolutely no transit priority assistance was implemented. (That is a general problem with TTC diversions, but a subject for another discussion.) The effect is less marked in 2015 because a different diversion scheme was used.
The period of bus replacement operation lies at the right side of the chart from Week 2 of May 2017 onward. For this route segment and direction,various comparisons can be made depending on what one looks at:
- There are periods when bus and streetcar travel times in April and May are comparable.
- There is a jump in some streetcar times in late April.
- There is a jump in some bus times in late May.
This sort of effect is not unusual, but it shows that care must be taken to review data at a sufficient level of detail to spot cases where values shift and understand why this happens. Looking at the historical data, it is clear that travel times can vary substantially depending on factors affecting a route.
The eastbound data from Roncesvalles to Yonge shows a similar pattern with a bump in streetcar times for part of April, and a bump in bus times (except in the evening) for the last week of May.
- 501_201704_WB_YongeSt_Roncesvalles_MonthLinks
- 501_201704_EB_Roncesvalles_YongeSt_MonthLinks
- 501_201705_WB_YongeSt_Roncesvalles_MonthLinks
- 501_201705_EB_Roncesvalles_YongeSt_MonthLinks
The charts above plot each day’s travel times, and allow quick review to spot days where something unusual is happening. Here is one page as an example:

Each point represents one trip between Yonge and Roncesvalles with the position on the horizontal axis (time) determined by the car’s departure from Yonge Street. Each day has its own colour, and trend lines are interpolated to show the overall behaviour of the data.
There were delays on two successive days, but as we will see below, they had different causes. On Thursday April 20th, there was severe congestion westbound to Roncesvalles that caused a backlog of traffic. Conversely, on Friday April 21st, all evening service was diverted via Spadina and Shaw taking extra time to cover the distance. On Tuesday April 18th, evening service diverted westbound via Spadina and Shaw, but the delays were not as severe as the club district congestion on King is not as bad on Tuesdays as on Fridays.
In May, there are extended running times west of Yonge in both directions on Monday May 15 at the end of the AM peak. The chart for this date also shows the amount of time buses spend sitting at Long Branch Loop because they have more time on the schedule than they actually require.
On Wednesday, May 31, congestion from west of Bathurst to Jarvis Street produced longer than usual running times for buses. This corresponds to the jump in May 2017 Week 5 on the Link History charts. It is unclear what caused this problem as there was no e-Alert from TTC explaining it. This persisted from the early afternoon through into the evening.
Detailed plots of the service on days with delays are in the following files:
- 501_20170404_Chart
- 501_20170413_Chart
- 501_20170418_Chart
- 501_20170420_Chart
- 501_20170421_Chart
- 501_20170428_Chart
- 501_20170515_Chart
- 501_20170531_Chart
Here is an example of one page from these charts:

On this type of chart, each line represents one vehicle, and the route appears to scale along the vertical axis. Time moves from left to right, and so westbound vehicles move upward, while eastbound vehicles move downward. This page shows the congestion problem between Lansdowne and Roncesvalles during the PM peak on April 4, 2017.
Many other issues can be gleaned from this type of chart, but a detailed review goes well beyond an online article. Items to note even in the page above:
- The 501L buses turn around just below (east) Dufferin Street. They are actually going to Dufferin Loop, but this has been mapped as if it were located on Queen just east of Dufferin so that it appears in the same “space” as the through 501 service on Queen.
- The 501M shuttles at Marine Parade show up as lines wandering back and forth between locations west and east of Humber Loop. (This service was replaced by the 501P buses on May 7.)
- Notwithstanding the TTC’s claims about cutting back on short turns, many of the 501L buses turn back at Kipling, and some streetcars short turn at Woodbine Loop.
I leave it to readers to peruse charts of interest to see how the line was actually behaving.
For eastbound trips between Roncesvalles and Yonge, the MonthLinks chart shows extended running times on certain days.
- Friday April 13 (see chart linked above): There was congestion eastbound through the core extending for a time as far as Jarvis Street, and two cars were help for a time eastbound at Yonge around 8:20 pm.
- Thursday and Friday April 20 and 21 (see charts linked above): The same diversions affecting westbound service also caused extended running times eastbound.
- Friday April 28: As above.
What is quite baffling for the last two weekends of April is why the TTC/City could not wait until after the bus replacement service had begun in May to perform weekend work that triggered these diversions.
Yonge to Neville Park
The situation on the eastern side of the route is quite different.
Westbound from Silver Birch to Yonge, buses have generally faster times in weeks 2-5 of May except during the AM peak when they are similar to streetcar times. The degree of difference varies by time of day.
For eastbound trips, there is a complementary pattern with afternoon peak bus travel times outbound being similar to those for streetcars.
The east side of Queen is not anywhere near as congested as the west side, and transit vehicles generally make fast trips except when activities in The Beach bring equivalent conditions to Queen West to the east end.
- 501_201704_WB_SilverBirchAve_YongeSt_MonthLinks
- 501_201704_EB_YongeSt_SilverBirchAve_MonthLinks
- 501_201705_WB_SilverBirchAve_YongeSt_MonthLinks
- 501_201705_EB_YongeSt_SilverBirchAve_MonthLinks
There were far fewer events triggering large increases in running time on the east side of the line. Those that did occur included:
- Wednesday, April 26: An event (unknown origin as the TTC issued no e-Alert about this) slowed eastbound service until mid-evening, and required a westbound diversion via Church, King and York Streets.
- Thursday, April 27: A fire at Queen and Beech blocked service from about 11:00 am to 12:15 pm. Later the same day, fallen overhead at DeGrassi Street required diversions both ways.
- Tuesday, May 23: Congestion eastbound between Coxwell and Woodbine caused extended running times.
- Monday, May 29: This shows an example of congestion westbound between Jarvis and Yonge Streets in the AM peak, an effect that can be seen on other days.
Service charts:
Driving “Culture” on Buses and Streetcars
One might well ask whether the faster bus times, where they show up, are a function of bus operators tending to drive faster because of the roads they are used to on suburban routes. A common situation seen on many bus routes is the accumulation of vehicles at terminals, and bus “operating culture” appears to favour getting to the end of the line as early as possible. Streetcar “culture” on the other hand can see vehicles dawdling along a route because they have too much running time in the schedule, a chronic problem on routes where the TTC overcompensates for congestion in an attempt to minimize short turns.
The TTC supposedly cares that vehicles do not arrive early at terminals, but in practice schedules contain enough padding to eliminate many of the short turns, even though this extra time is not always needed. Streetcar operators are “counselled” by management not to run early, but the same does not appear to apply to bus operators based on my analyses of many bus routes.
Anyone who has visited the Queen route during the bus operation will know that there are small fleets of vehicles laying over particularly at Park Lawn and at Long Branch.
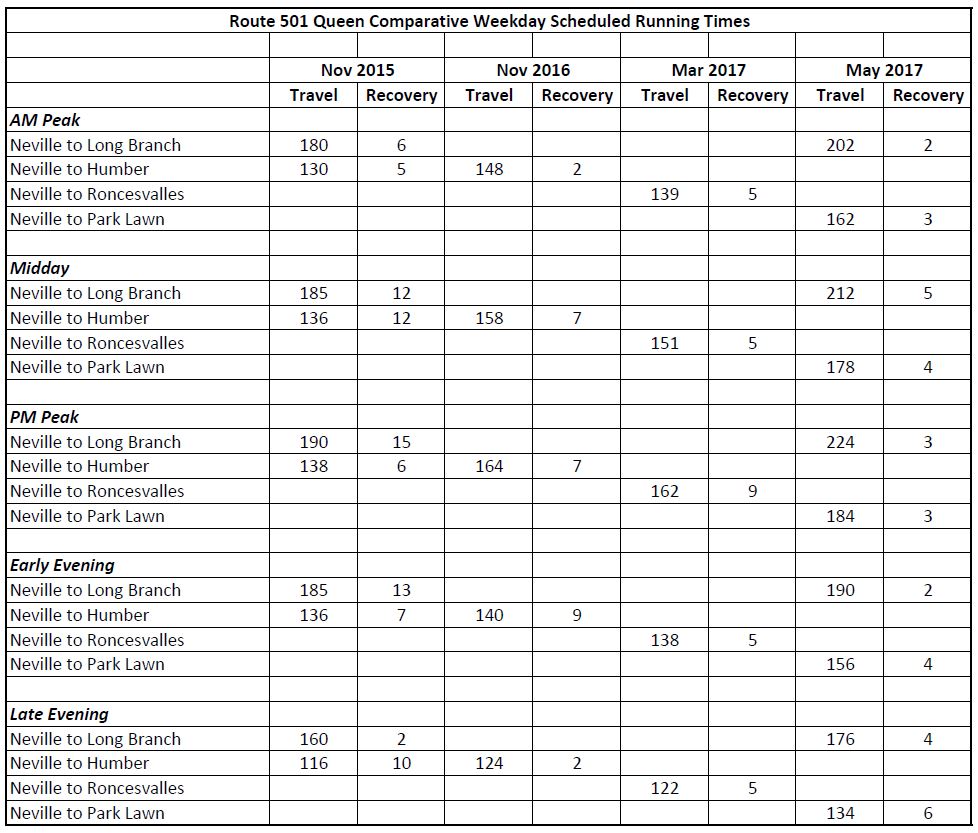
Back in November 2015, the streetcar service design had through operation from Neville to Long Branch. When service west of Humber was split off as a separate route to improve reliability on that segment, the remaining Humber service had its running time increased to compensate for problems in the congested central city. (This shortfall was responsible for much of the erratic service west of Humber on the consolidated route, not to mention many short turns to keep streetcars on time.)
In March 2017, with the streetcar service cut back to Roncesvalles, the change in running time versus Humber operations was considerably less than the actual round trip time to Humber Loop. This effectively added even more running time to the Queen car over the central part of the route. This was done in anticipation of a diversion between Spadina and Shaw for City work that did not actually take place. Therefore streetcars in April had more running time than they needed and this could explain some of the higher travel times observed during this period.
In May 2017, buses replaced streetcars. The running time to Long Branch is longer than the November 2015 streetcar times, but by amounts comparable to the changes made to the streetcar schedules in the intervening period. It does not appear that any provision has been made for extra time that will be needed by buses once construction starts in earnest on Lake Shore, and this will soak up some of the excess bus operators now enjoy.
Update: The City of Toronto will award the bid for reconstruction of Lake Shore Boulevard on Wednesday, June 14, and construction is expected to begin shortly afterward.
Still to Come
In the next article, I will review the motion passed by Toronto’s Public Works and Infrastructure Committee asking the TTC to compare streetcar and bus operation on Queen with a view to making the bus substitution permanent.
Also in the hopper is a review of weekend operations for streetcars and buses, as well as a comparison of scheduled service capacity.

I assume that the running times in the last table are round trip pr Queen is really screwed up, 180 minutes Neville to Long Branch or 180 minutes Neville to Long Branch return?
Steve: Round trip.
LikeLike