The TTC and City of Toronto work on the RapidTO proposal for Jane Street has reached the public consultation stage. There will be an online session on Wednesday, March 8, 2023 from 6-8 pm, and in person Drop Ins on March 22 and 28. Details are on the City’s RapidTO page for the project.
The proposed area for transit priority lies between Eglinton and Steeles Avenues with varying degrees of transit separation.
Options For Discussion

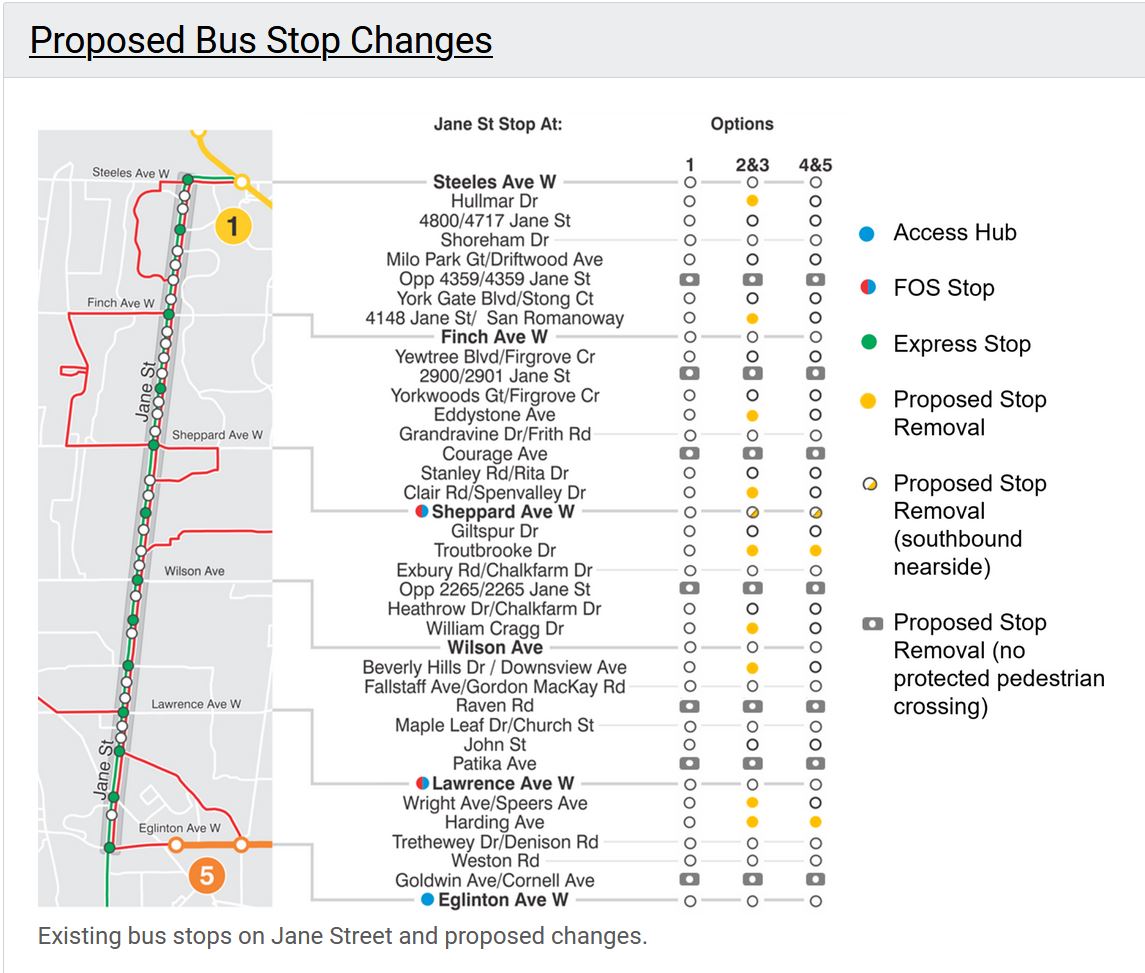
Stop Removals
As with the Eglinton-Kingston-Morningside RapidTO lanes, the Jane Street proposal includes the removal of some bus stops in the name of speeding transit.
The TTC proposes removal of 7 of 38 stops (18%) even if no transit priority is implemented. For options 2 and 3 which provide a relatively high level of priority, there would be a total of 16 stops (42%) removed. For options 4 and 5 which provide a lesser degree of priority, 9 stops (24%) would be removed.
Of the 38 stops, 13 are shared by the local and express services and they are not affected. This means that there are 25 local stops, of which Options 2 and 3 would remove 16, or two-thirds of these stops.
The premise for the Option 1 locations is that these have no crossing protection and, therefore, create a risk for jaywalking pedestrians. The additional stop removals for Options 2 and 3 are justified as “optimizing” the spacing. The proposal changes the route substantially to the spacing of express stops.
The unanswered question is why these stops exist in the first place, and what local traffic pattern to they support. Should the change be to improve pedestrian protection and access rather than simply telling riders they must walk further to reach their bus?
Another important question here is how much of the supposed benefit of the project will be gained from stop removal as opposed to provision of an all-day reserved lane for transit. The TTC touts the travel time saving through transit priority, but does not net this out against increased walking distance to and from stops.
The City’s page includes maps showing the changes in the 4-minute walking distance catchment areas for transit stops. They do not include information about stop usage, population density or the effect on major traffic generators such as schools.
Revised Lane Allocation
Jane Street is different from the Scarborough RapidTO implementation in important ways:
- Part of the Scarborough RapidTO area already had reserved bus lanes in peak periods.
- Eglinton Avenue and Kingston Road are six lanes wide plus a median/left turn lane in places. Jane is generally a four-lane street with a shared left turn lane.
Here is the typical existing layout.

Options 2 and 3 reserve the curb lane for transit as well for vehicles turning onto and off of Jane Street.

Option 4 assigns the curb lane for high occupancy vehicles, and Option 5 leaves the street as is with selected widening for queue jump lanes where right turns delay traffic today.
How well any of this will be enforced is anyone’s guess, and the situation on King Street does not inspire confidence.
Travel Time Changes
The anticipated changes in travel time are summarized in the table below. Note that these are for trip over the full distance between Steeles and Eglinton.
The change in stop access times is averaged over the entire route. This dilutes the effect on riders at specific stops by including many riders whose access distance is unaffected. This understates the impact on those who are directly affected. (Note that at an assumed walking speed of 1m/sec the change in distance is equivalent to the change in walking time in seconds.)
The TTC has beaten the transit priority drum for queue jump lanes for years, with only a few examples to show for their efforts. In this case, the provision of such lanes is by far the most expensive option, the longest to implement because of road reconstruction, and the least beneficial to riders. This is really a tactic that should be reserved for key areas with very high transit vehicle congestion where there is very frequent service and a clear payback.
| Option 1 | Option 2 | Option 3 | Option 4 | Option 5 | |
| Change in bus travel times (mins) | 0 | -5 | -4 | -2 to -3 | -2 |
| Average change in stop access (m) | None | +55 | +55 | +45 | +44 |
| Change in auto travel times (mins) | 0 | +3 to +4 | +2 to +3 | +2 to +3 | Minimal |
| Estimated Cost ($m) | N/A | $4.7 | $3.9 | $2.5 | $10.7 |
| Time to Implement (years) | N/A | 1 to 2 | 1 to 2 | 1 to 2 | 3 to 4 |
In a separate article, I will review the behaviour of the Jane 35/935 local and express services. A few key points from that review are worth making here:
- The variation in headways (time between buses) can substantially exceed the travel time savings shown here. Operation of reliably-spaced service would improve the rider experience today with any priority savings coming as gravy on top. Conversely, if headway reliability is not improved, then the benefits of red lanes will be undermined by erratic service.
- The difference in travel time for express and local buses over this section of Jane is comparable to the travel time saving foreseen in Option 2 (full bus priority). It is not clear whether this difference would persist especially in Options 2 and 3 where over 60% of the local stops are removed.