
A month ago, I looked at the O’Connor bus as a particularly bad example of TTC line management and the huge difference between service actually provided on the street, the scheduled operation, and the official claims of service quality. On December 20, I tracked the route’s operation during the PM peak period when it was short vehicles, and those actually in service provided erratic service with large gaps.
- Analysis of Route 70 O’Connor for October 2019
- An Example of Service on Route 70 O’Connor December 20, 2019
The November 2019 tracking data came in a while ago, but I have been distracted by other issues, notably the TTC budgets, and a lot of holiday cheer. Riders of the O’Connor bus need a lot of cheer to get through what passes for service on that route.
Scheduled Service
The schedule for 70 O’Connor has not changed from October.

The route originates at Coxwell Station, and it has two branches splitting off at O’Connor and St. Clair. One heads east to Warden Station, and the other goes north to Eglinton. Scheduled service is the same on both branches at almost all periods of operation.
Chart Formats
The charts for headways and travel times have a common format.
- Pages 1-4 contain data for weekdays broken down into the four calendar weeks of November. Each day has its own coloured dot representing one bus. The vertical axis shows the interval (headway or travel time respectively) and the horizontal axis shows the time of day.
- Pages 5-6 contain Saturday and Sunday data respectively.
- Note that Vision was down for an extended period from Saturday, November 8 until mid-morning on Tuesday, November 11, and there are no data for this interval.
- Page 7 contains the average and standard deviation, broken down by hour, for all weekdays.
- Page 8 contains the averages and standard deviations for each week.
- Page 9 shows the distribution of data by quartile for weekdays in bar-and-whisker format. Each section of the chart shows one quartile.
- Pages 10-13 show the distribution of data by quartile for each of the four weeks.
- Pages 14-15 show the average and standard deviation, as well as the quartiles, for Saturdays.
- Pages 16-17 show the average and standard deviation, as well as the quartiles, for Sundays.
Headways
The files linked below contain the charts of headways leaving the three terminals. (Wolverleigh is a street just north of Coxwell Station.)
- 70_201911_NB_Wolverleigh_MonthHeadways
- 70_201911_WB_Warden_MonthHeadways
- 70_201911_SB_Sunrise_MonthHeadways
Northbound from Coxwell Station
Headways leaving Coxwell Station at the start of November were scattered over a wide range of values all day long. The situation improves in weeks 2-4 because the delays on the Warden Station branch west of Warden (see “Congestion” section below) only existed for one week.
Here is Week 3. Note that the trend line lies consistently near the scheduled headway, but the data points are widely dispersed around this.

Here are the average and standard deviation (SD) values for all weekdays in November. Note that the SD is above five minutes for an extended period showing that the service for much of the day would be quite erratic. This illustrates the danger of simple averages which can give the impression that all of the service is “there”, but without revealing how irregular it actually is. Changes in the SD over the day show that the degree of scatter of the values varies, and any “reliability” stats that are measured on an average basis will mask the worst periods by merging them into the better ones.

When the data are subdivided by week, there is little week-to-week difference showing that the conditions shown for week 3 above are common.

The quartiles for week 3 illustrate the gradual rise in the SD in another manner with the spread of the central bar (quartiles 2 and 3) through the afternoon, followed by a drop in the evening. The first quartile (lowest) reaches down to the x-axis because there is almost always a bus running very close to its leader during almost all periods.

The situation on weekends is just as bad. Here are the Saturday data. Note that there were no data for November 9, and also no data for November 16 before about 11 am. Even when the standard “congestion” excuse simply does not apply, there is a wide range of headways, many buses bunched together and corresponding long gaps.

The quartile chart for Saturdays shows how the comparatively closely spaced data in the morning deteriorate in the afteroon. Half of the service operates at headways over a wide range from below 5 to above 20 minutes (the central bar) and the other half is even worse.

Westbound From Warden Station
With each of the route’s branches getting only half of the service, and the ragged nature where these branches combine, the situation on the outer ends of the line is quite appalling. Here is week 3 for service leaving Warden Station. Note that the scale for these charts has a maximum value of 60 minutes compared to 30 for the charts above at Coxwell Station.

Here are the Saturday data. Note how the very short headways become more prevalent as the day goes on with a corresponding increase in vary large gaps. There are only two buses on each branch with a round trip time of 44 minutes. This indicates that the buses are often travelling close together if not nose-to-tail.

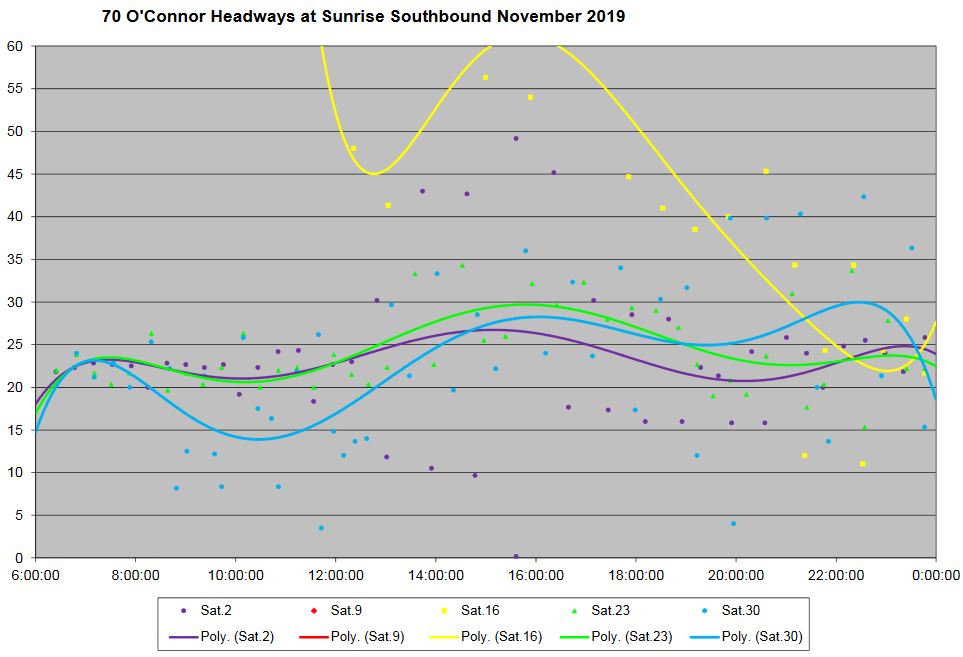
Southbound from Sunrise & O’Connor
The service southbound from Sunrise is similar to that seen above at Warden with a mixture of close headways and wide gaps. Again this is an example of how looking only at the trend lines or averages can mask the problem of widely dispersed headways.

Saturdays do not are well, and in particular November 16. There is no data before about 11 am because Vision was down, but after that, one of the two Eglinton branch buses was missing until late in the evening leading to extremely wide headways on this branch.
Congestion
The TTC points to the LRT construction at Eglinton as the source of problems on this route, but in fact the major and chronic delays are on O’Connor southwest of St. Clair where traffic in the area funnels across the O’Connor Bridge and along the one available arterial.
- 70_201911_EB_Coxwell&O’Connor_StClair&O’Connor_MonthLinks
- 70_201911_WB_StClair&O’Connor_Coxwell&O’Connor_MonthLinks
The congestion and associated jump in travel times is worse eastbound than westbound between Coxwell and St. Clair on O’Connor. The charts for weekends are almost flat.


For the first week of November, there were delays eastbound approaching Warden Station. This would contribute to problems on that branch, but only for the week when running times were longer.

Weekday Operations
In the next three sections, I will review operations on individual days to show how pervasive the problems are. The weekdays reviewed here are all Tuesdays.
November included a cold snap with snow on Monday, November 11. There is no VISION data for that date and so I have no record of how the route behaved under those conditions.
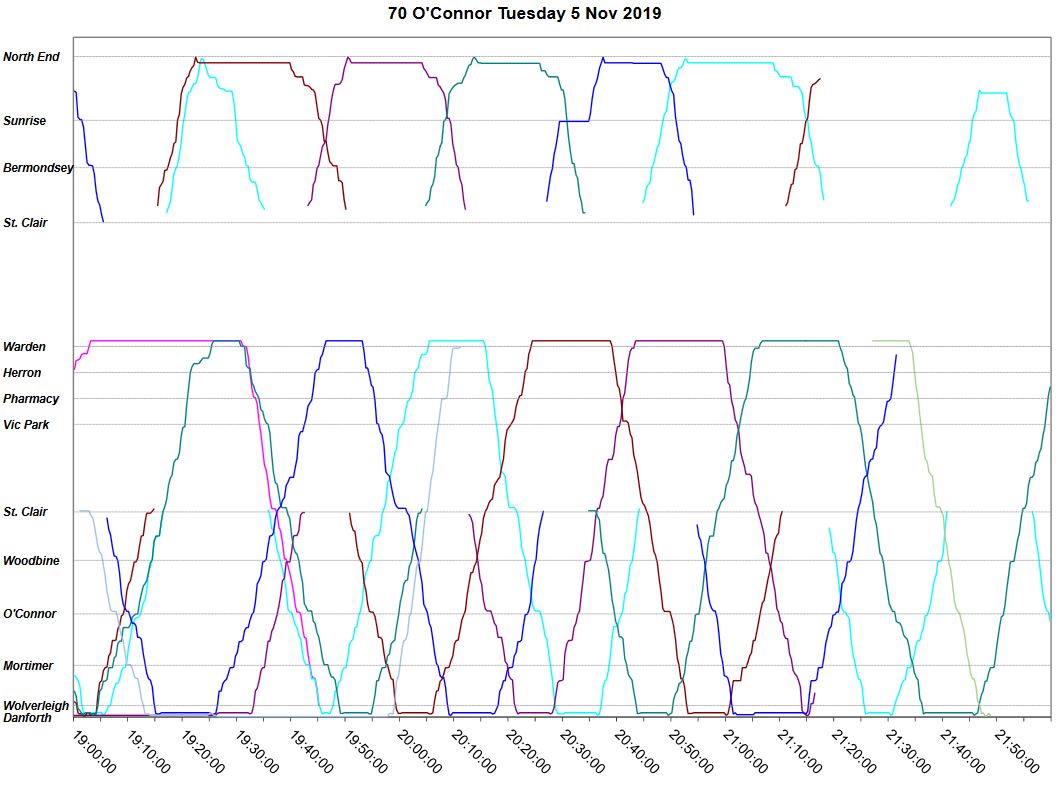
Tuesday, November 5
Here is a sample page to explain the layout containing data for Tuesday, November 5 between 7 and 10 am. Time runs from left to right, and location from bottom (Coxwell Station) to top. The common part of the route runs up to the “St. Clair” line where the route divides. The branch to Warden Station continues the lower part of the chart. For the buses that run north to Eglinton, there is a split and they are shown on the top portion. Note that each line appearing above St. Clair in the top section has a corresponding line that disappears at St. Clair in the lower section.
The slope of the line indicates the speed, and the more horizontal the lines are, the slower the buses. A horizontal line indicates a stopped bus, and these typically show up at stops along the route and of course at terminals.
During the morning period, spacing of buses is fairly regular, although some bunching develops from 8:30 onward.

Midday operations run fairly smoothly, but by the start of the PM peak, congestion starts to appear northbound west of Woodbine & O’Connor. Also visible here is the creation of pairs of buses at about 2 pm caused by southbound buses on each branch meeting at St. Clair. One bus (the light gray line) closely follows another to Coxwell Station, lays over, and then leaves together with another bus (purple). They make an entire round trip to Eglinton and back running lock step.

By 4 pm, things are really messed up with many buses running close together followed by long gaps. Note that the problems lie mainly on the Warden branch, not on the Eglinton branch which must deal with LRT construction delays. One bus (pink) at about 5:10 pm leaves Warden Station in a long gap, but at Victoria Park, it turns north onto the Eglinton branch and proceeds to take a long layover at the terminal. When it does come south, rather than filling a gap in service, it runs half way between two other buses. Also quite clearly shown here are bus pairs making round trips to Warden for the entire peak period.

The service gets sorted out by about 8 pm, although primarily because the “bad actors” are no longer in service. Note that our friend “pink” took a long layover at Warden Station and then left together with another bus. More generally, layovers in the evening are quite generous, particularly for a short route.
Tuesday, November 12
The VISION tracking system was down from November 9 until mid-morning on November 12. The charts for that day start at 10 am.
There is a gap in the Warden service that appears to be caused by a bus that missed a trip and laid over at Coxwell Station (brown line). The TTC has no performance metric for the ratio of scheduled trips to actual trips, and only reports an overall value for the vehicle hours operated system wide versus scheduled. This gives no indication of local variances or what their causes might be.

The afternoon peak had some bunching, again primarily on the Warden branch with a trio of buses that made the round trip together. This could have been fixed by spacing the service, but it was not. The TTC has no metric to report bunching, especially the kind that persists for long periods like this.

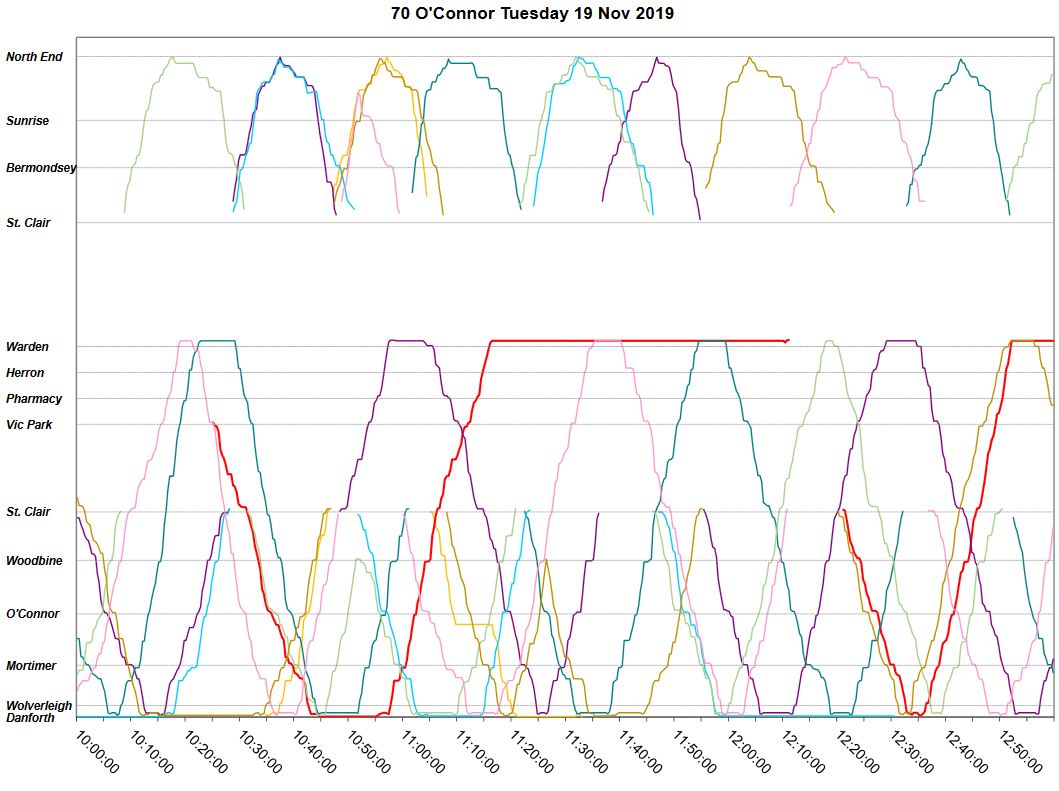
Tuesday, November 19
November 19 was not a good day. Bunching set in toward the end of the AM peak including a trio of buses to Eglinton and a pair to Warden.

Service to Eglinton continued to run in pairs through the late morning, but the buses left Coxwell Station that way. There is no evidence of “congestion” at the north end of the route in the data. Meanwhile at Warden, one bus took an extended layover from about 11:10, and when it re-entered service after noon, it ran as part of a pair. This bus (red with a thicker line than the others) continued on this pattern all afternoon. In many cases, when it was not on siesta at Warden, it was running close behind another bus.
Through the early afternoon, the pattern continued …

… and through the PM peak when other bunching problems arose.

Finally in the early evening, after yet another layover at Warden Station, this bus disappears.

Tuesday, November 26
On November 26, bunching starts to develop in the latter part of the AM peak, and it continues into the early evening.

One bus laid over at Warden Station starting at about 9:50 (chart above) and stays until after 11:00 when it disappears.
Another bus (taupe) leaves Coxwell Station at 11:05 closely followed by another at 11:10 (dark green). They make a round trip to Eglinton together, then to Warden. On the westbound trip from Warden, “taupe” short turns and joins the Eglinton branch northbound at about 12:30 together with another bus (purple). They continue as a pair until …

… after 2:00 pm when “purple” deeks over to Warden Station for a layover, than a trip to Coxwell Station. Meanwhile bunches occur regularly elsewhere on the route.

Bunching continues through the PM peak, and one bus (pink) manages to get two layovers of over one hour at Warden Station.

Service settles down by 8 pm.

Saturday Operations
Saturday, November 2
Saturdays in November showed the same pattern as in October with reasonably maintained service in the morning and evening, but a complete hash in the afternoon with all four buses coming together for some sort of tryst at Coxwell Station. The problem is already developing at 1 pm and it gets worse as the afternoon goes on with all four buses making a joint round trip starting at about 3 pm. Note that the only sign of “congestion” is westbound on O’Connor near St. Clair, and it is not severe.

The situation continues in varying degrees until after 6 pm.

Saturday, November 9
No data available due to a VISION outage.
Saturday, November 16
No data available before 11 AM due to a VISION outage.
The route had severe problems on November 16 because one of the two Eglinton branch buses was missing.

Meanwhile, the familiar pairing (at least of the Warden Station branch) occurs at about 3:30 pm. The one lonely Eglinton bus is fending for itself.

The two Warden Station buses make a complete round trip as a pair breaking apart, in stages, after 5 pm.

Meanwhile, the Warden Station service continues with only one bus until mid-evening when the service design changes to three buses instead of four making alternate trips on each branch.

Saturday, November 23
The service on November 23 was somewhat better than on previous Saturdays. The main problem was that buses on the Eglinton and Warden branches did not maintain an even spacing, but the paired round trips did not appear.


Saturday, November 30
By early afternoon, the two buses on the Warden Station branch are shadowing each other and by 3:40 we are back to the familiar paired round trips until about 5:30 when one of them takes a layover at Warden to restore the proper spacing.


Somewhat more regular service is restored in the evening, but there is still some bunching.

Sunday Operations
Sunday, November 3
During the early afternoon, there is some bunching at Coxwell Station, but it is mainly from the two branches getting out of sync with each other rather than providing a blended service.

During the late afternoon, there is the familiar problem that service is running in pairs. This is eventually sorted out by spacing one bus from each pair starting at 5:30 pm.

Sunday, November 10
No data available due to a VISION outage.
Sunday, November 17
Problems on November 17 begin in the late morning with the transition from a three-bus to a four-bus service (note the dark red line that appears at Coxwell Station at about 12:20. Three buses leave close together, and two of them run as a pair to Eglinton.

Service continues to run in bunches, notably on the Warden branch, and we reach the point where a quartet of buses leaves Coxwell Station at roughly 3:15 pm. Layovers at both outer terminals ensue to restore proper spacing.

Service in the late afternoon and early evening is better, although there are still problems with blending the two branches. There is also a change-off of one bus where “turquoise” above disappeared just before 4 pm southbound at Coxwell & O’Connor and was replaced by “yellow” which fills its spot.

Sunday, November 24
November 24 was an odd day because there were six buses in service through the afternoon even though only four were scheduled. Notwithstanding the extra service, there was still bunching, gaps and trip pairing.


If I were a TTC route supervisor (or the supervisor of a route supervisor) I would be interested in looking at the raw data to see whether it was always the same drivers who ‘paired up’ (or had threesomes). Can they use VISION to do such things? (I assume they can to the run number or bus number level.) Do they? (I would say not based on your analyses.)
Steve: Of course that is possible. I make a point, however, of not getting driver badge numbers in the data feed. It would be possible to look at run numbers and work backwards, but I’m far more interested in the service riders see overall of which problem operators are only one of many parts.
LikeLike
As I said in another comment, the TTC is unable to manage services with blended headways (and this is now a problem on the restructured 40 Junction too). The TTC should do what they did on Woodbine and create two separate routes with independent schedules, and give up any pretension of a blended service on O’Conner and Coxwell.
LikeLike
If we’re talking about what they “should” do, why don’t we jump to what they really should do which is fire some incompetent managers and start managing service? There is nothing difficult about managing service on the 70 O’Connor, even with the branching route structure — it’s pure incompetence. This is different from the situation with more difficult routes, where the problem is incompetence meeting a difficult problem.
Steve: This assumes that those at the top recognize the problem and want to do more than concoct measures of “success” at providing service that validate the status quo.
LikeLike
MBAs that I have worked with have liked to say “If you can’t measure it, you can’t manage it”. Then they try to manage based on spreadsheets or ‘dashboards’.
They never seem to be interested in asking “Are we measuring the right things?”
And instituting any measure — or procedure — without asking “Huh, how might a less-than-good actor try to game the system?” results in systems that are….really easy to game.
Is this blindness the result of the Three Monkeys syndrome (I see, hear, and say no evil, so my performance bonus will be HUUUGE)? Or is it the result of the MBAs and senior management never actually been line workers, or just being totally unable to put themselves in the position of someone in the ‘rank and file’?
Whatever the case, the dashboards with the green and yellow and red lights aren’t addressing so many of the problems that the TTC really has, at least not directly and effectively.
LikeLike