
This article is a companion to Part 1 of my update of travel time behaviour on key routes for 2020-2022. That article dealt with routes east of Yonge Street, and this part turns to routes west of Yonge:
- 29 Dufferin from King to Wilson
- 35 Jane from Eglinton to Steeles
- 60 Steeles West from Finch Station to Kipling
These three routes show more variation over time than most of the routes east of Yonge reviewed in the first article. The greater variation implies that they are more sensitive to changes in overall road demand and have less headroom to begin with. They are more likely to benefit from priority measures, but taking road space for transit will be more politically challenging in car-oriented areas.
Any detailed study that purports to establish time savings through red lanes must be careful to be an apples-to-apples comparison avoiding projected savings against conditions (construction projects and future route changes) that will change on their own. Similarly, and by reference to what was done on the Eglinton-Kingston corridor, “savings” due to stop eliminations, if any, should not be counted as a “benefit” of transit priorty.
General Notes
These notes are copied from Part 1 for readers’ convenience.
- There are several days in October-November 2021 with no data due to the cyber-attack and related outage in the TTC’s vehicle tracking system.
- Some but not all periods show a drop in travel times in December-January 2021/22 corresponding to both the holiday season and the shutdown imposed for the omicron wave.
- Late January 2022 shows a spike in some travel times related to the “snowmageddon” event, and some of these last for days implying that the roads in question were not given priority for clearing.
- Each set of charts is linked as a gallery, and you can step between the pages within them.
- Some locations and times show little or no change in travel times during pandemic shutdowns implying that there was little congestion to be overcome.
- Some charts have the low y-axis value set above zero to give variations in the data more “elbow room” in the space they occupy.
29 Dufferin
For a detailed look at the effect of the January 2022 snowstorm on this route, please see “Snowmaggedon and the Dufferin Bus”.
29 Dufferin data reflect not just the covid-related change in road traffic levels, but also the effect of congestion near Yorkdale Mall, a perennial problem location for this route. One might also expect congestion near Eglinton for the Line 5 Crosstown project, but this turns out not to be a problem location. These areas are reviewed in separate charts that zoom in on the route later in the article.
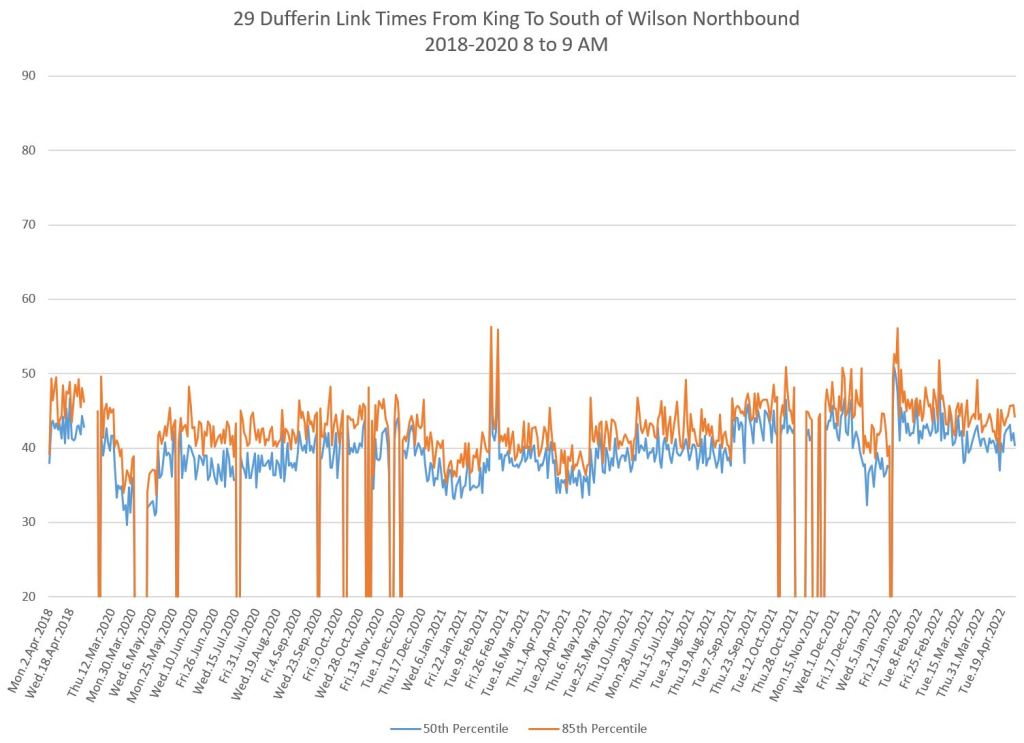
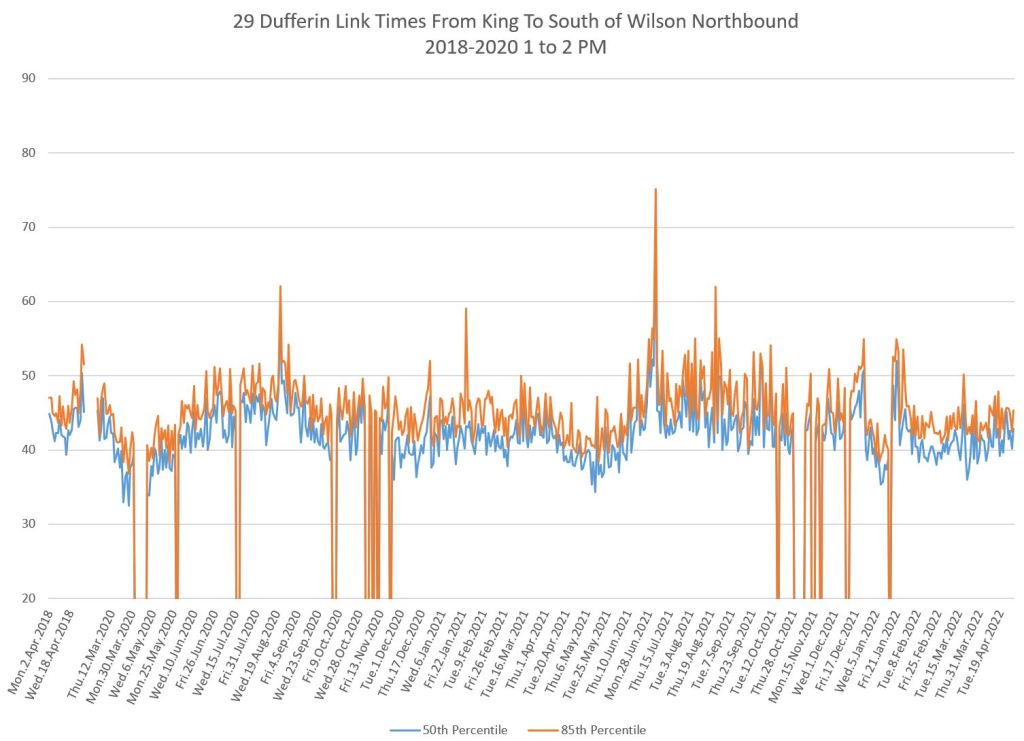
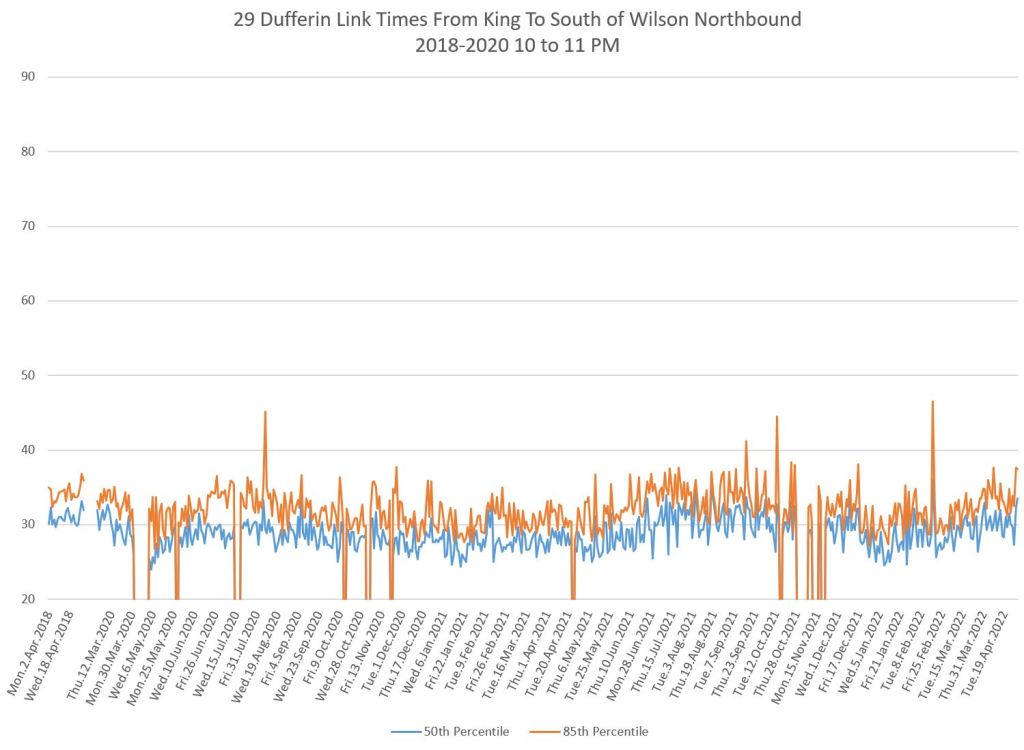
Northbound from King to Wilson
Travel time northbound over the route varies a great deal from early 2020 to 2022, especially in the afternoon and pm peak. During most periods shown below, travel times are back at close to pre-pandemic levels.
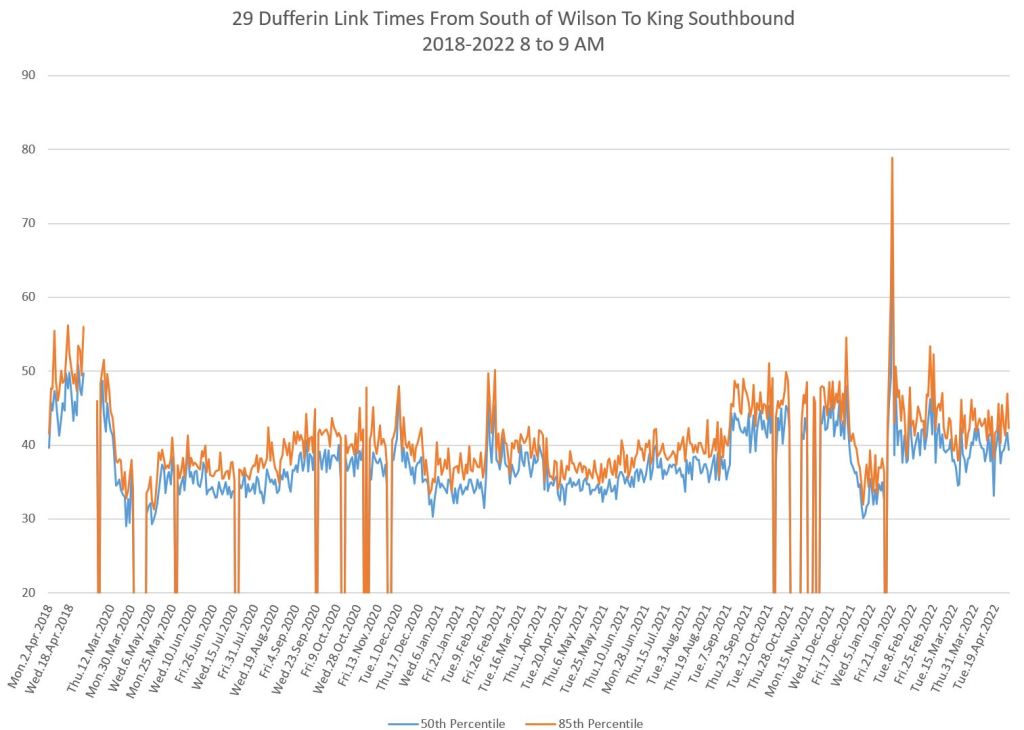
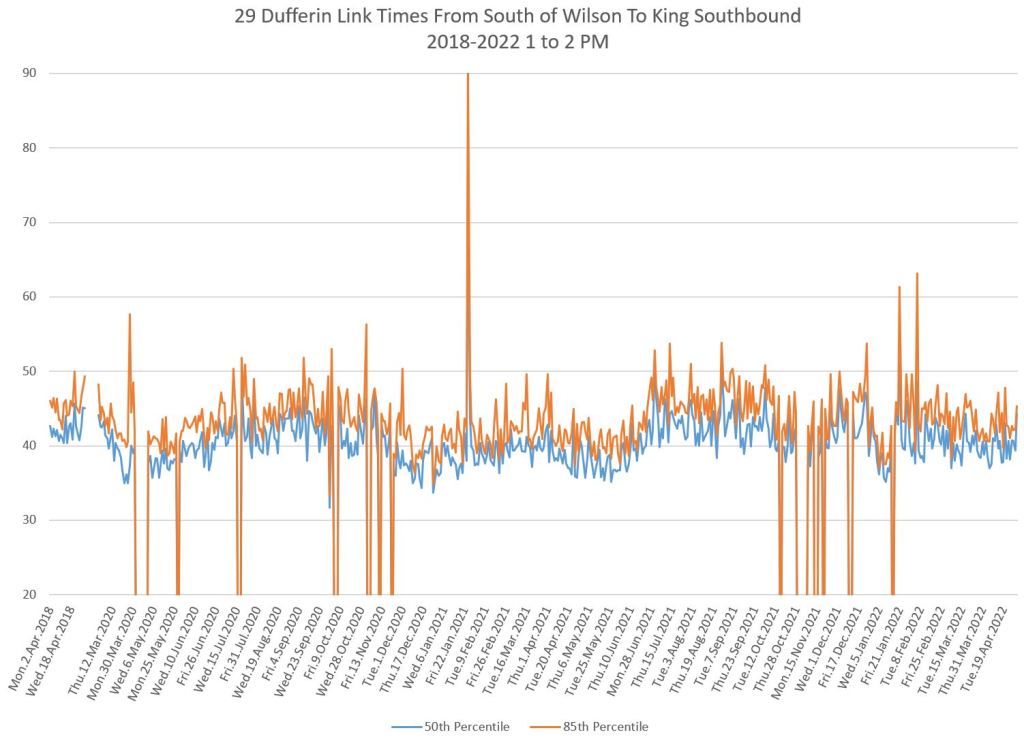
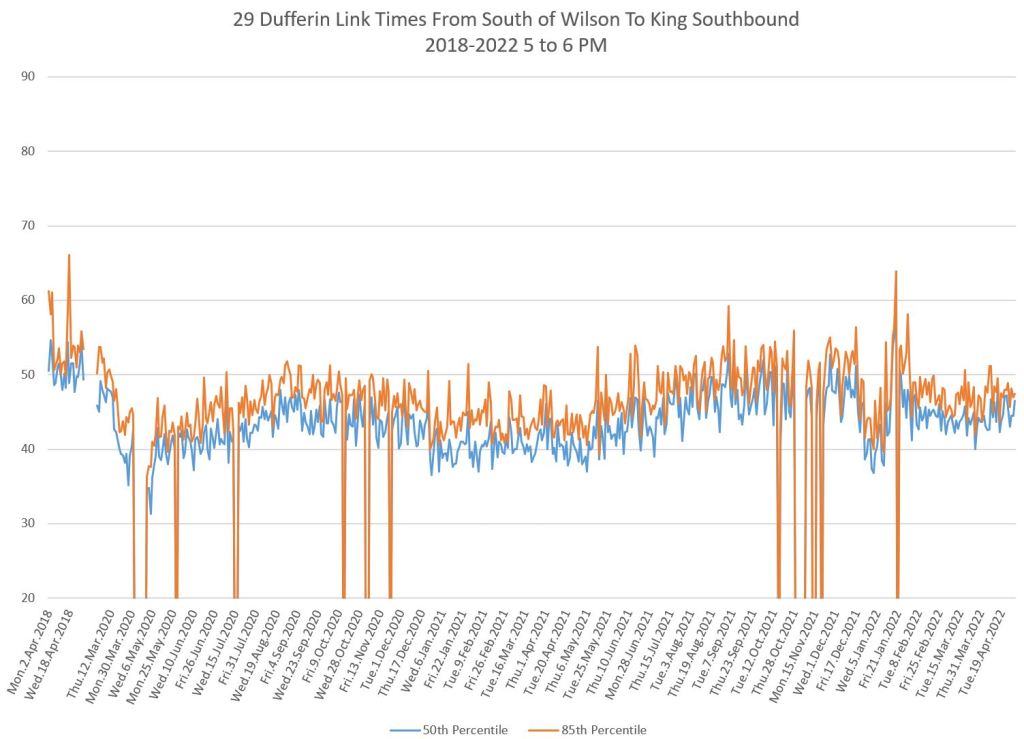
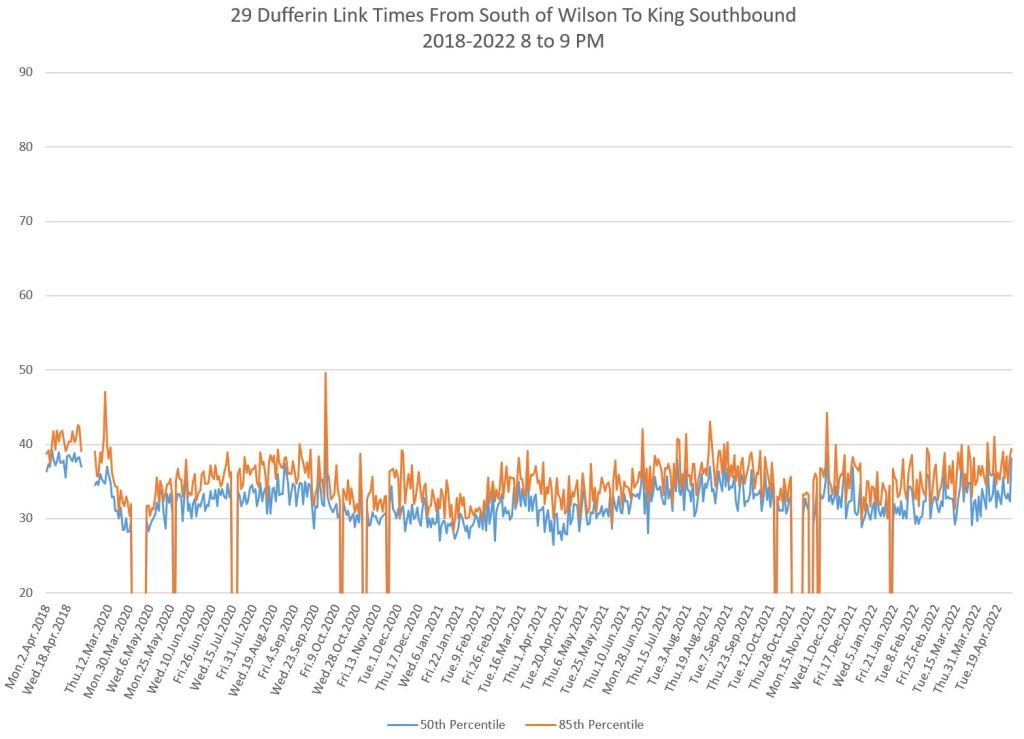
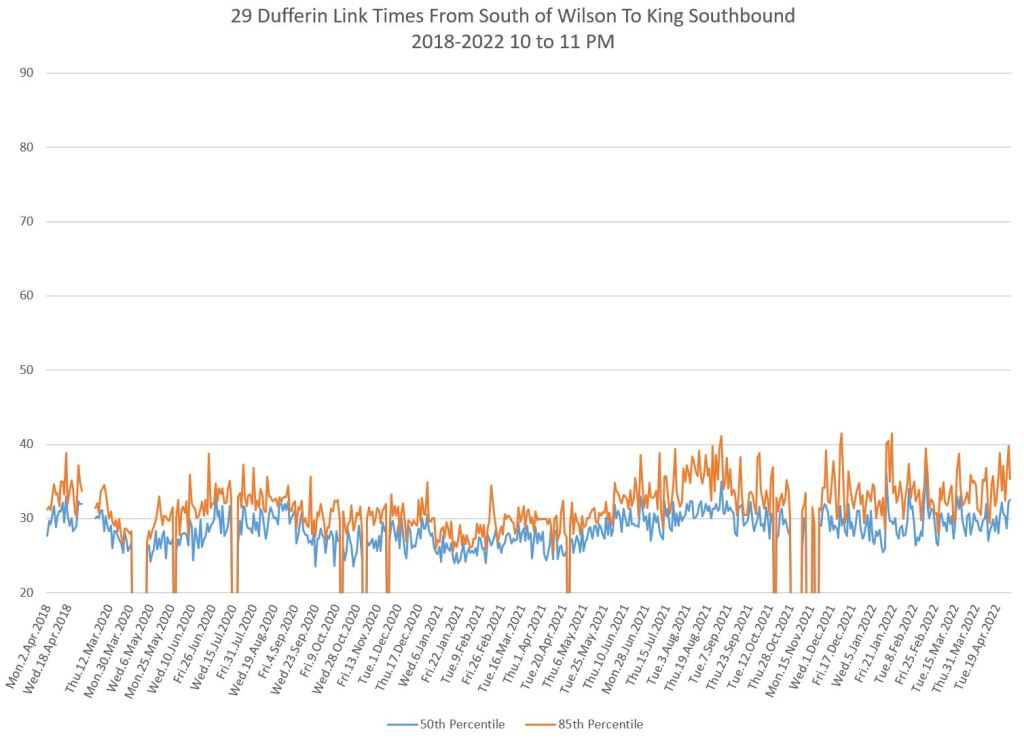
Southbound from Wilson to King
The variation in travel time southbound on Dufferin is much less extreme. There are the dips associated with the original lockdown in Spring 2020, and again at December/January 2021/22.
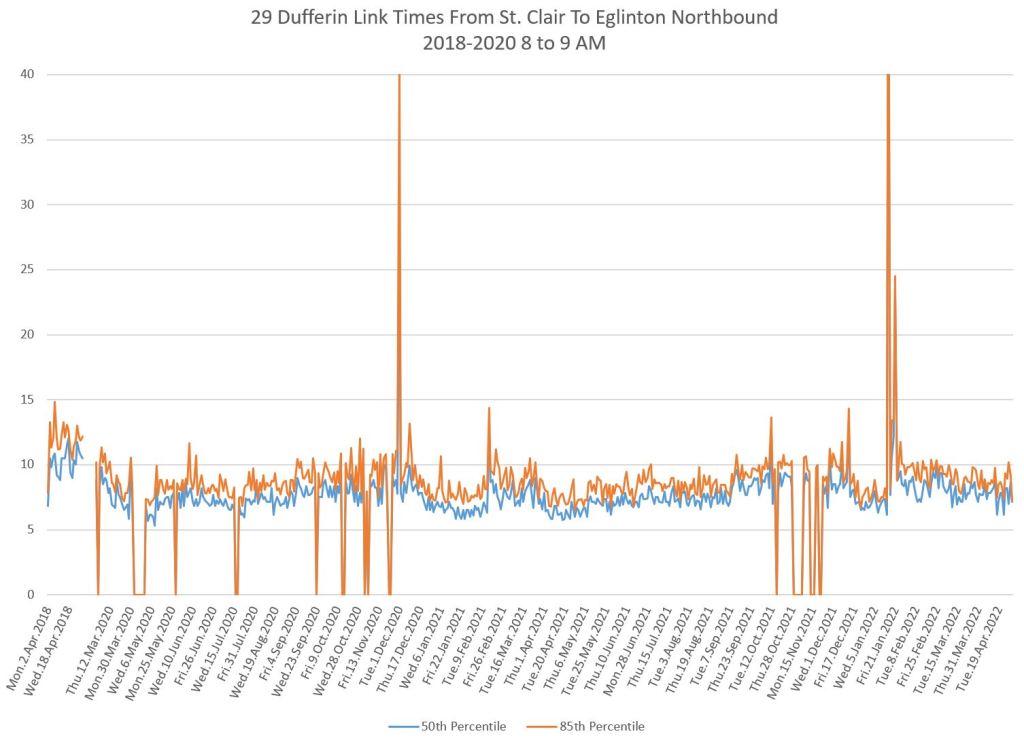
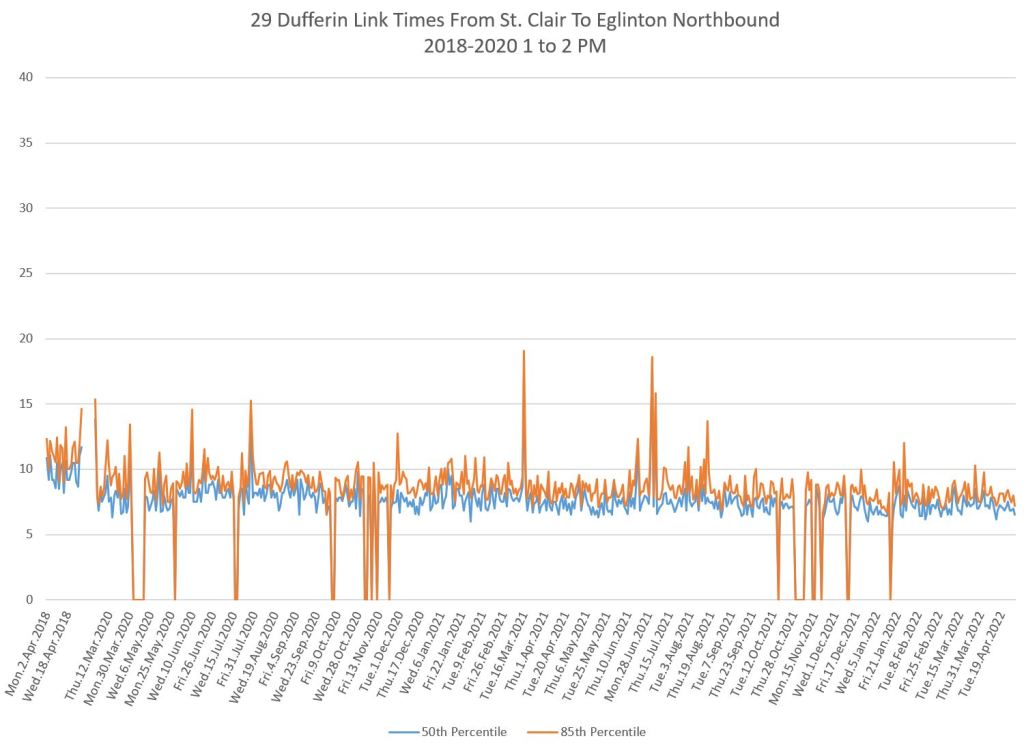
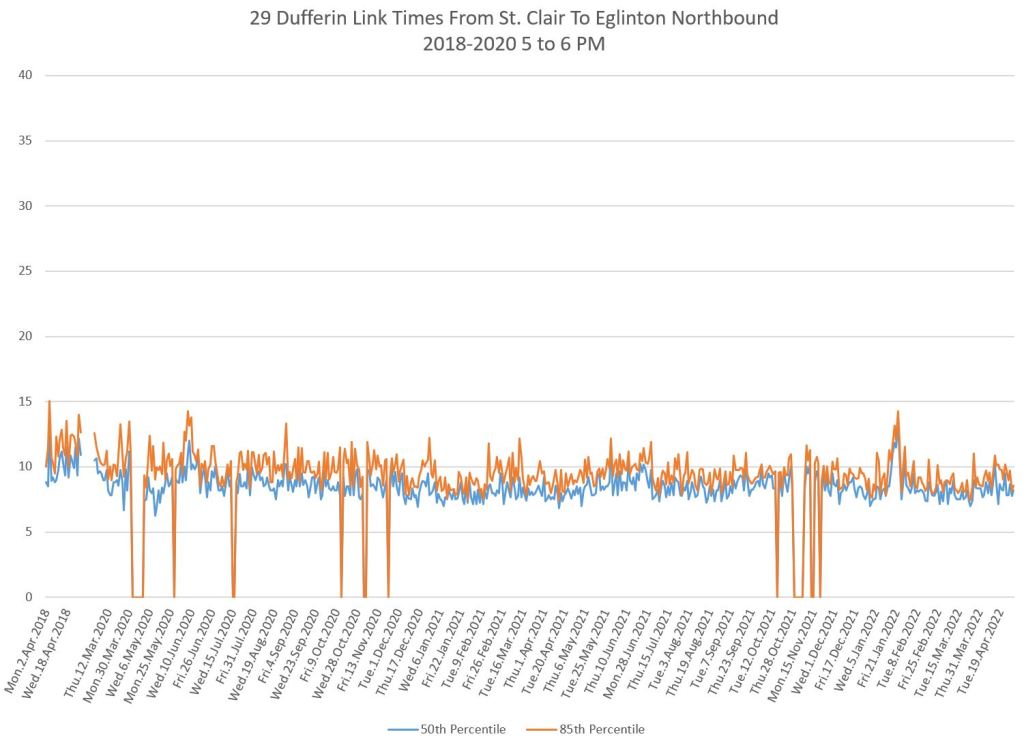
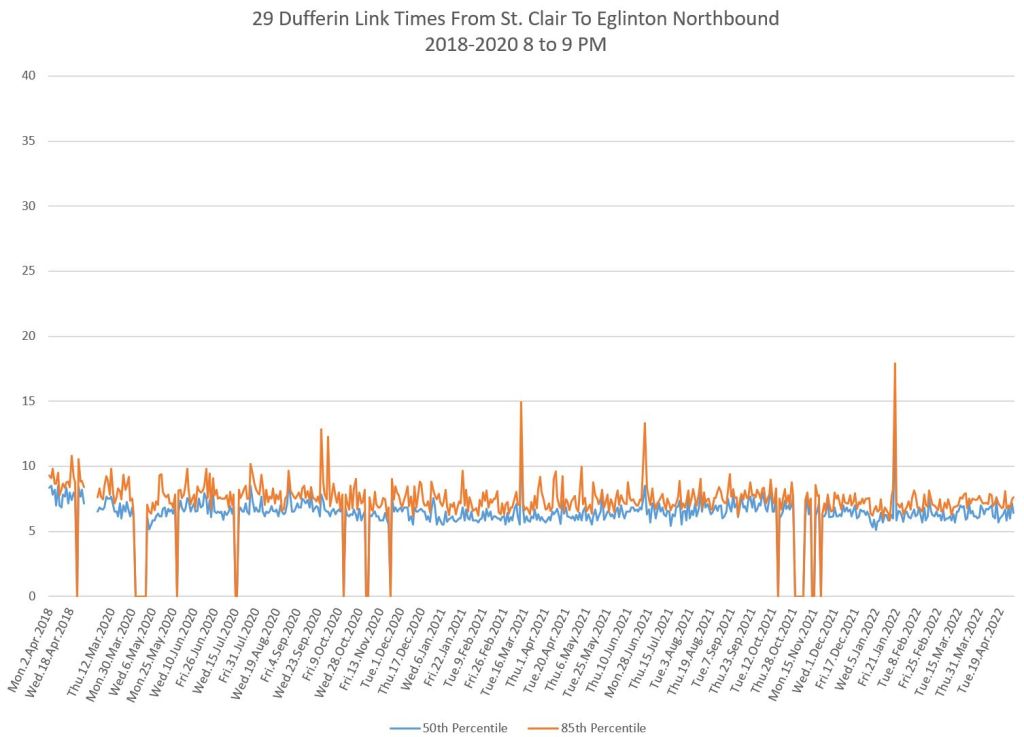
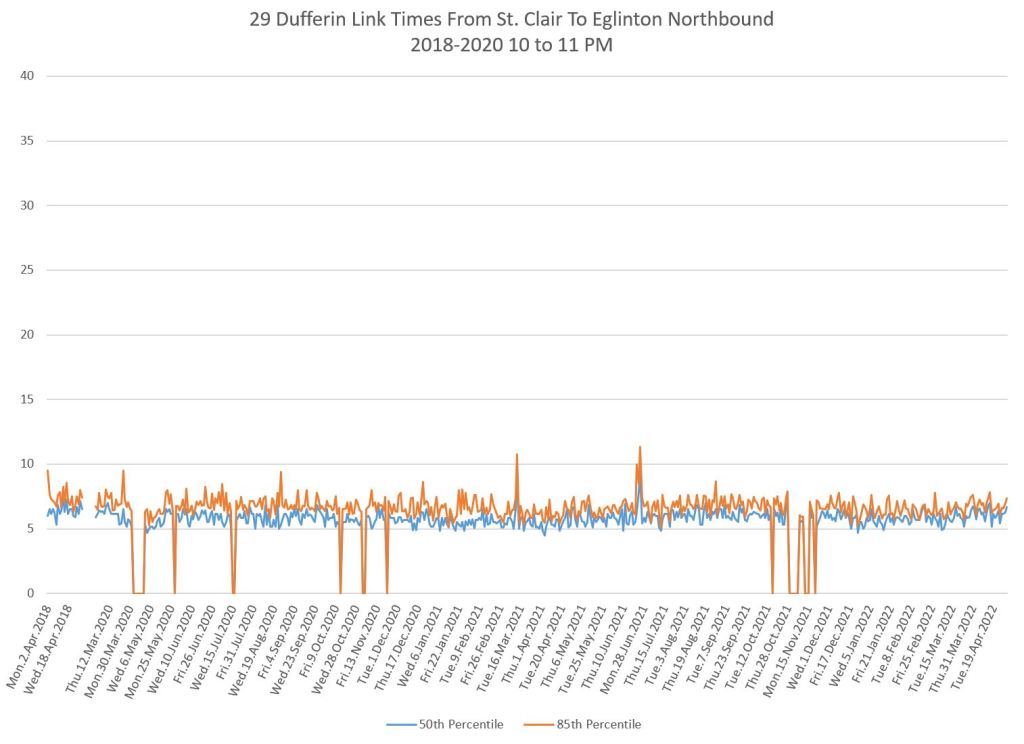
Northbound from St. Clair to Eglinton
An obvious question is whether construction for Line 5 Crosstown at Eglinton had an effect on the route. To that end, I plotted times approaching Eglinton from the south (St. Clair) and from the north (Eglinton). The charts are almost entirely flat with few exceptions. If Fairbank Station were fouling up the Dufferin Bus, we should see periods of changing or unreliable travel times, but that is not the case.
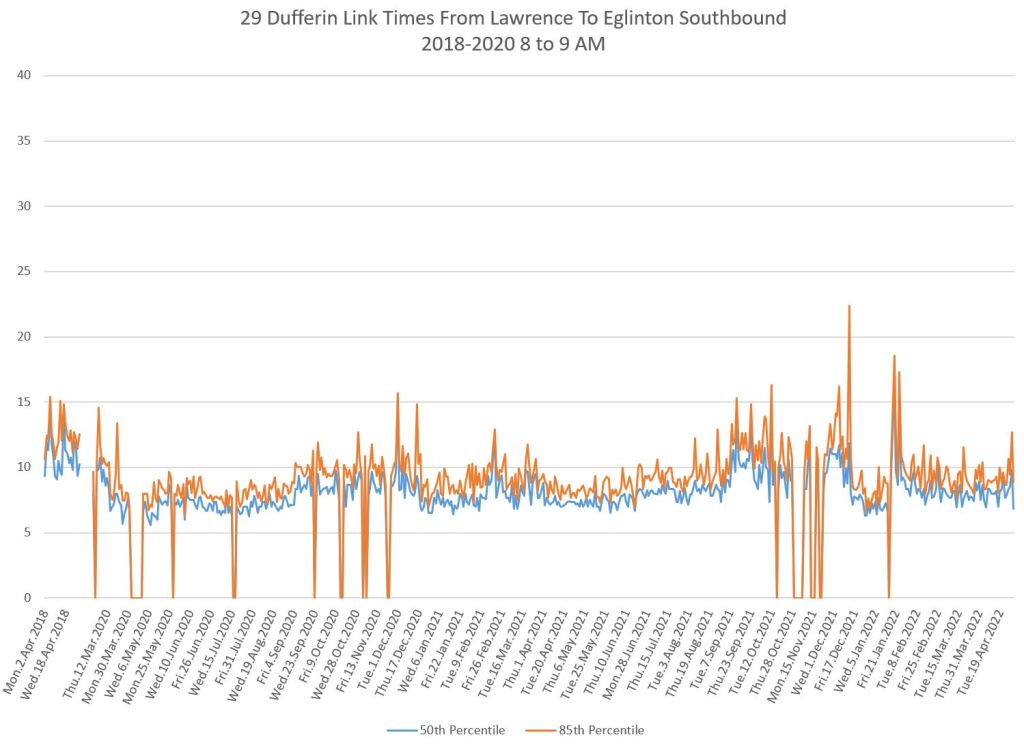
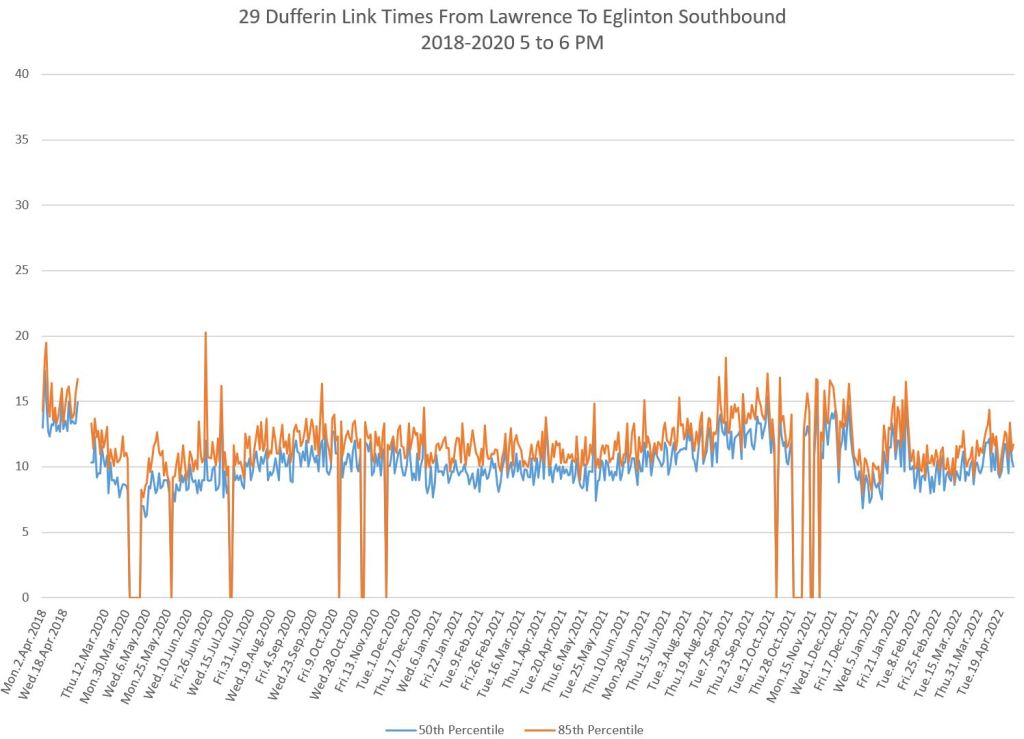
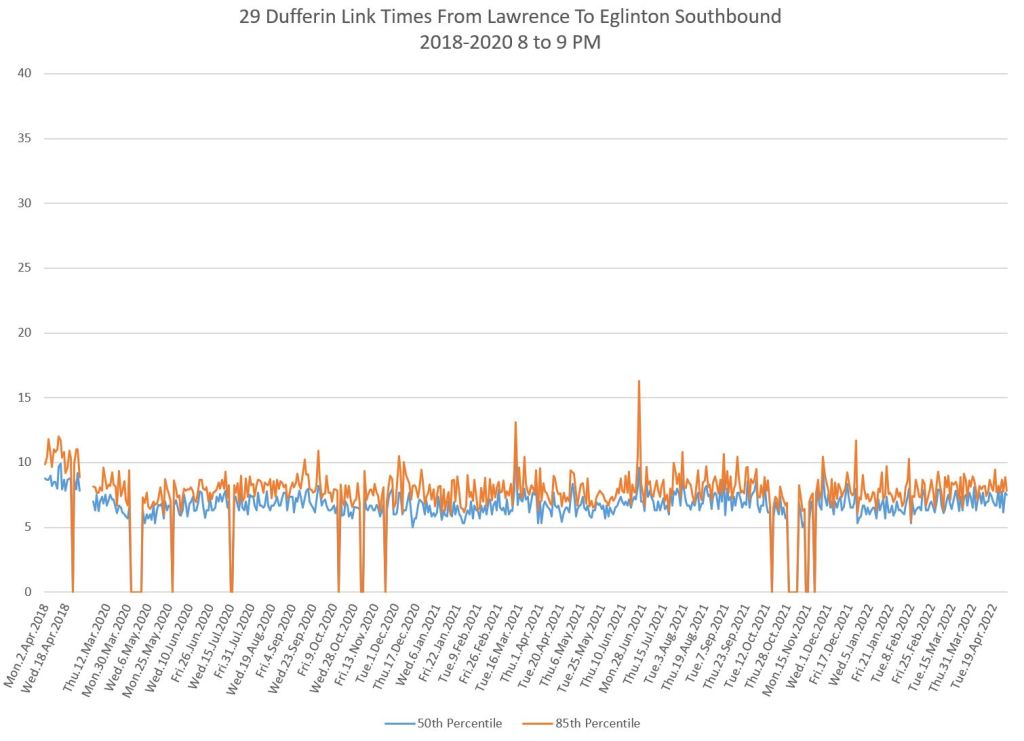
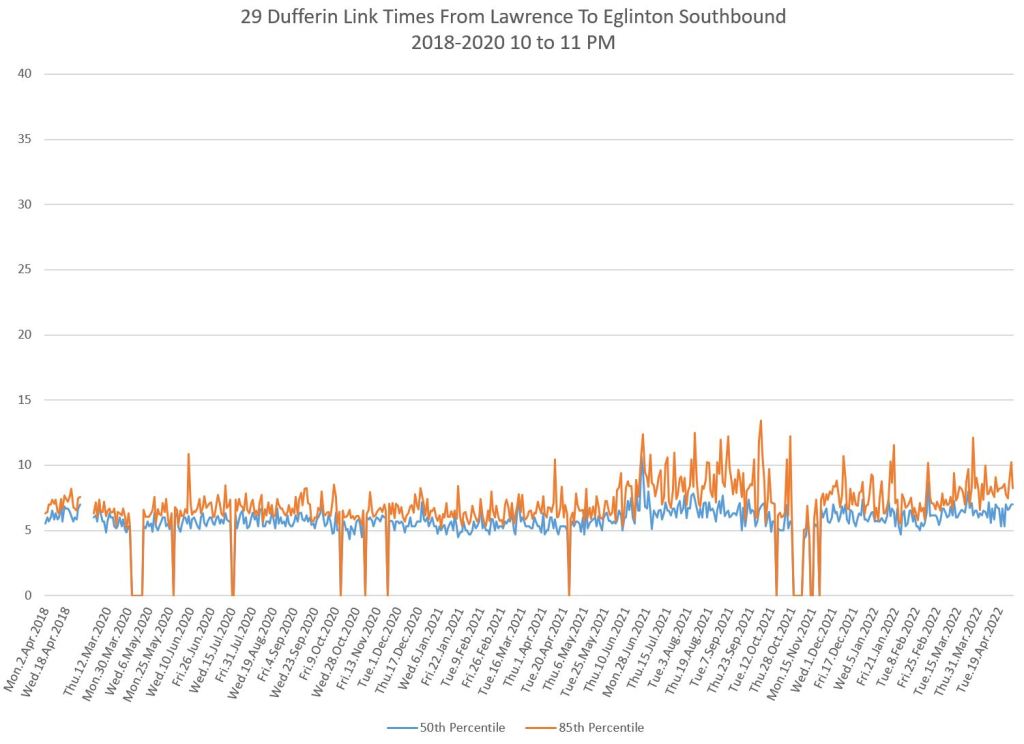
Southbound from Lawrence to Eglinton

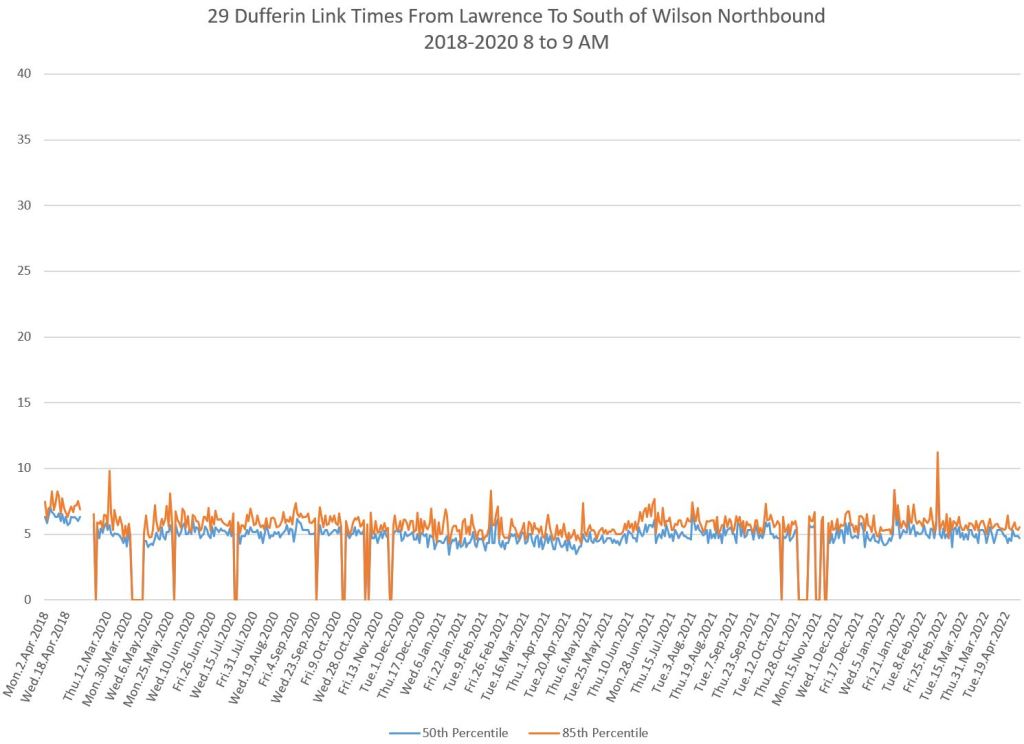
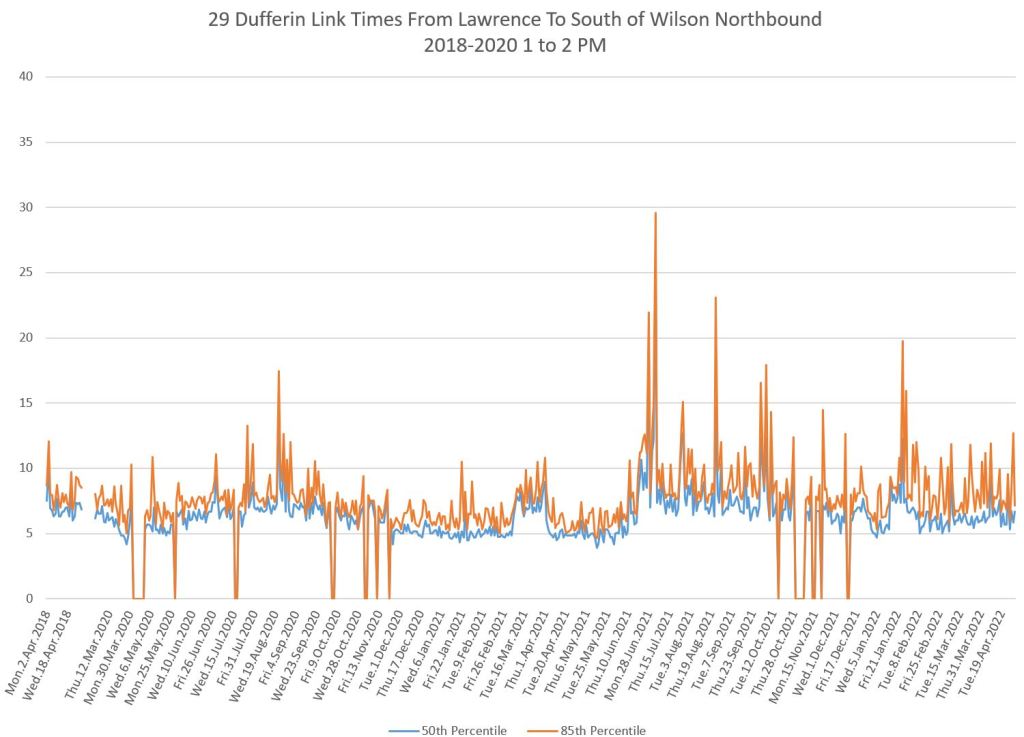
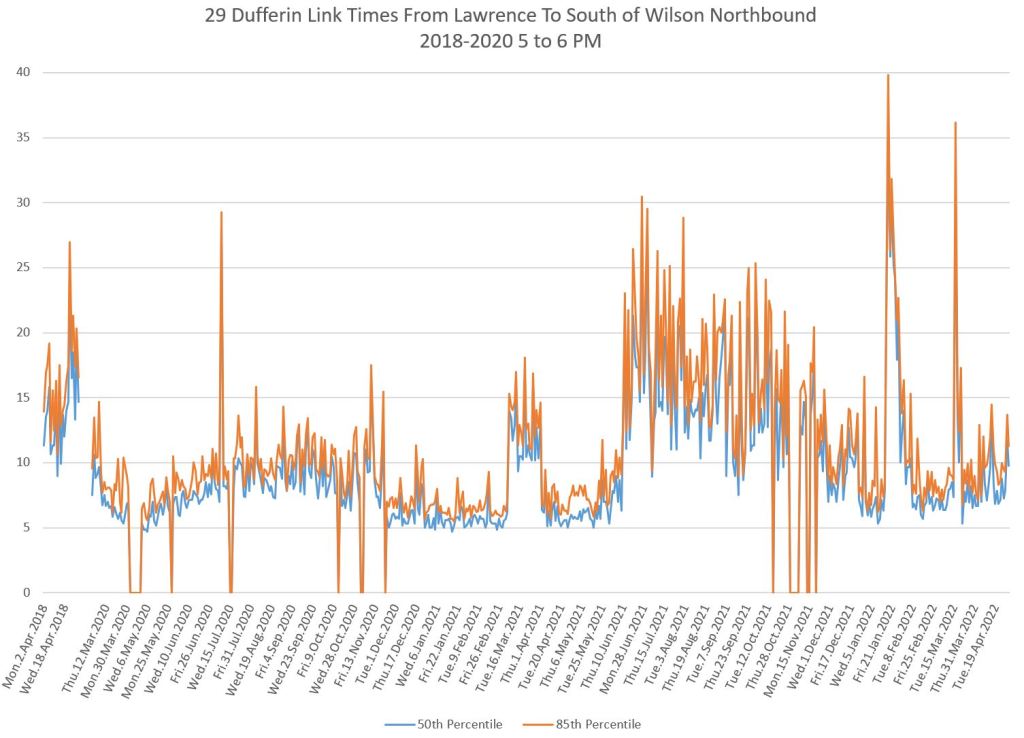
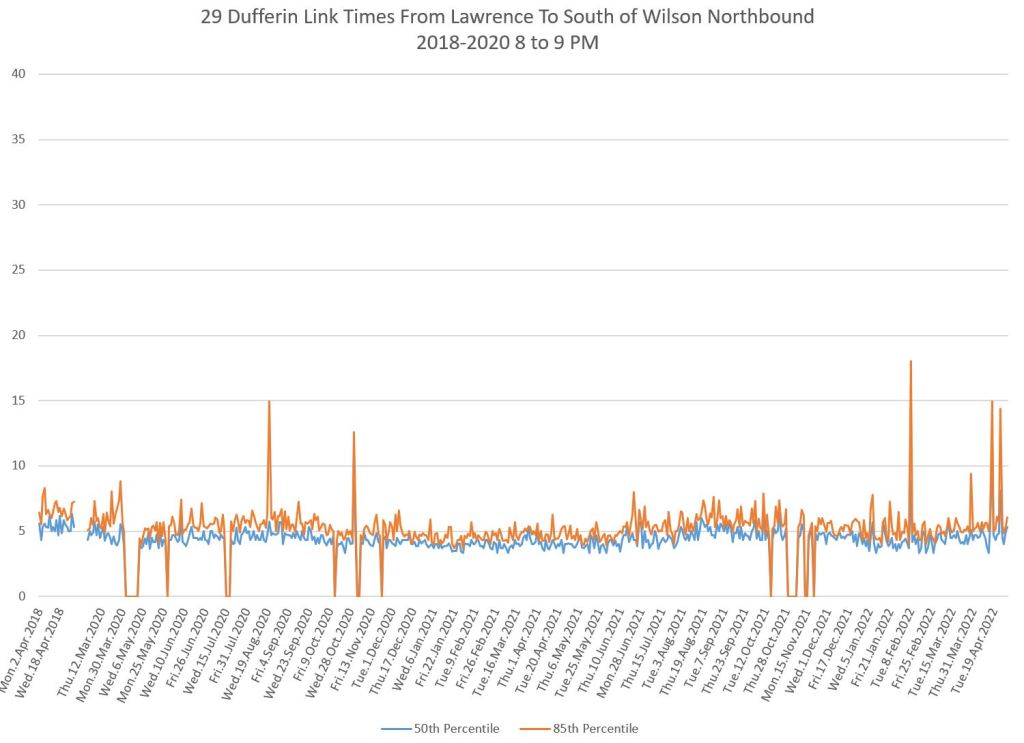
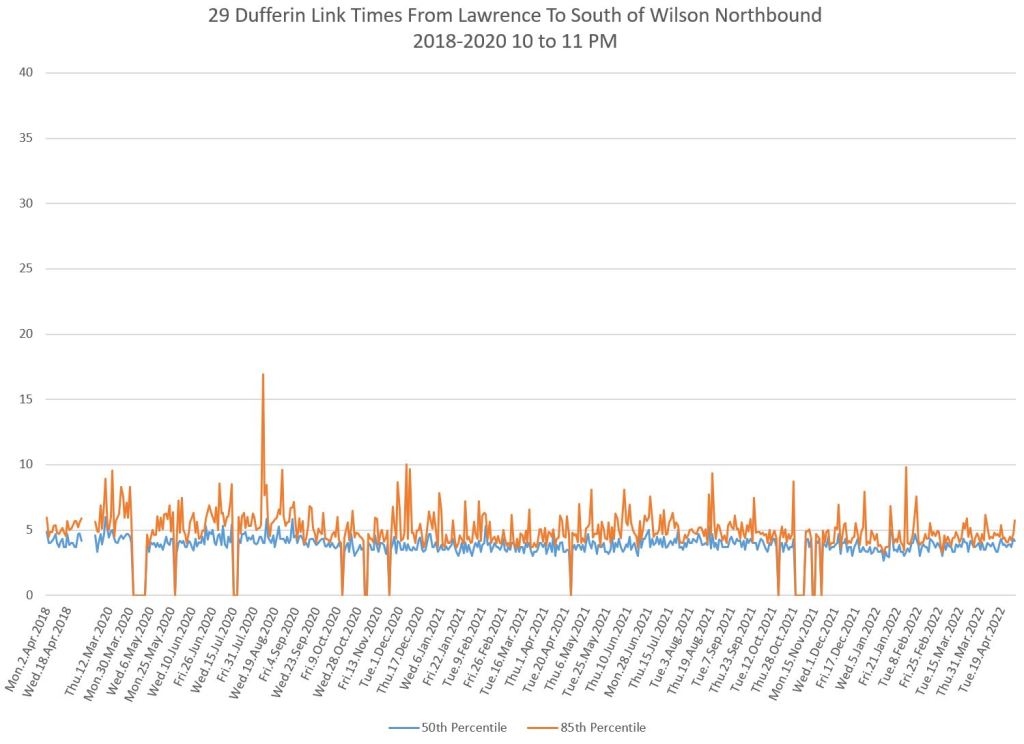
Northbound from Lawrence to Wilson
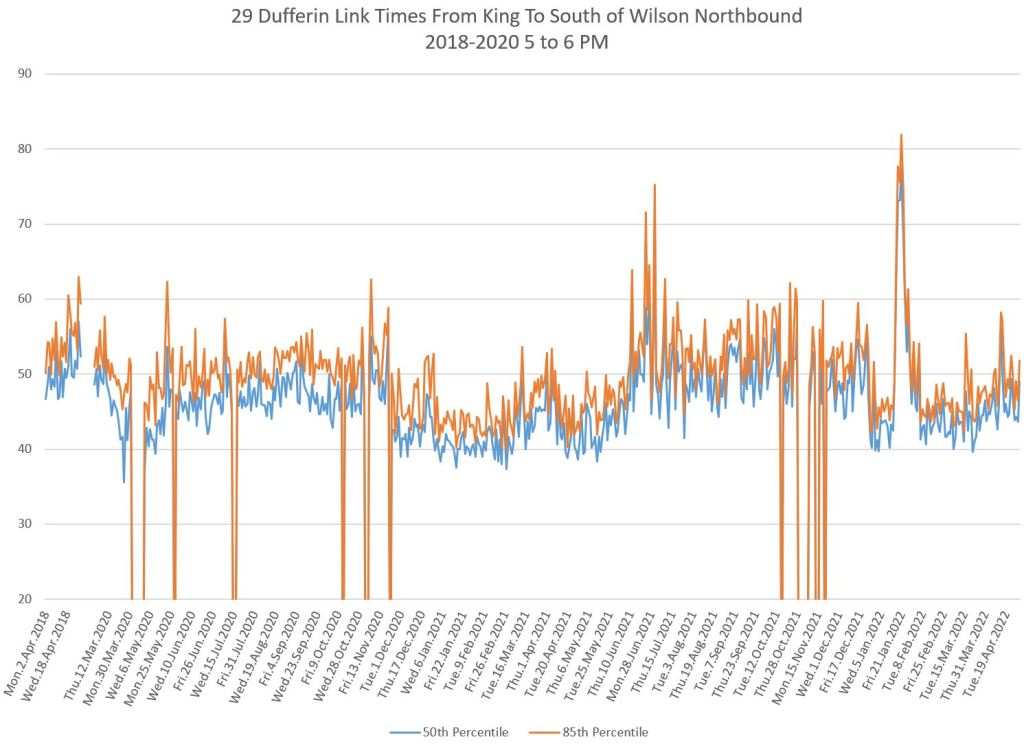
From past examinations of 29 Dufferin, I have seen routine problems northbound at Yorkdale Mall. These show up quite dramatically in the afternoon and especially PM peak periods.
Looking at the 5-6 pm chart (third chart below), there is a quick, marked dropoff in travel time in March 2020. The line drifts up slowly corresponding to a period of gradual, but limited, reopening. In December 2020, the time is back to March 2020 levels as new restrictions were imposed. Then, for a period in March 2020, the times bounce up. This was a brief period where covid rules were relaxed, but that was short-lived and by April the times drop again. Only with the general reopening of shopping do the times jump up and become irregular in Summer 2021.
By year-end 2021, times drop again with the omicron lockdown, but spike with the major snow event in January 2022. Still to be seen is how these values evolve over Summer and Fall. (Note that the worst days for congestion at Yorkdale are weekends, but these days are not included in the charts below.)
A key point here for RapidTO studies is that some of the worst service delays can occur in areas where road capacity is constrained and where getting a reserved lane for transit will be politically difficult and a challenge for traffic engineers.
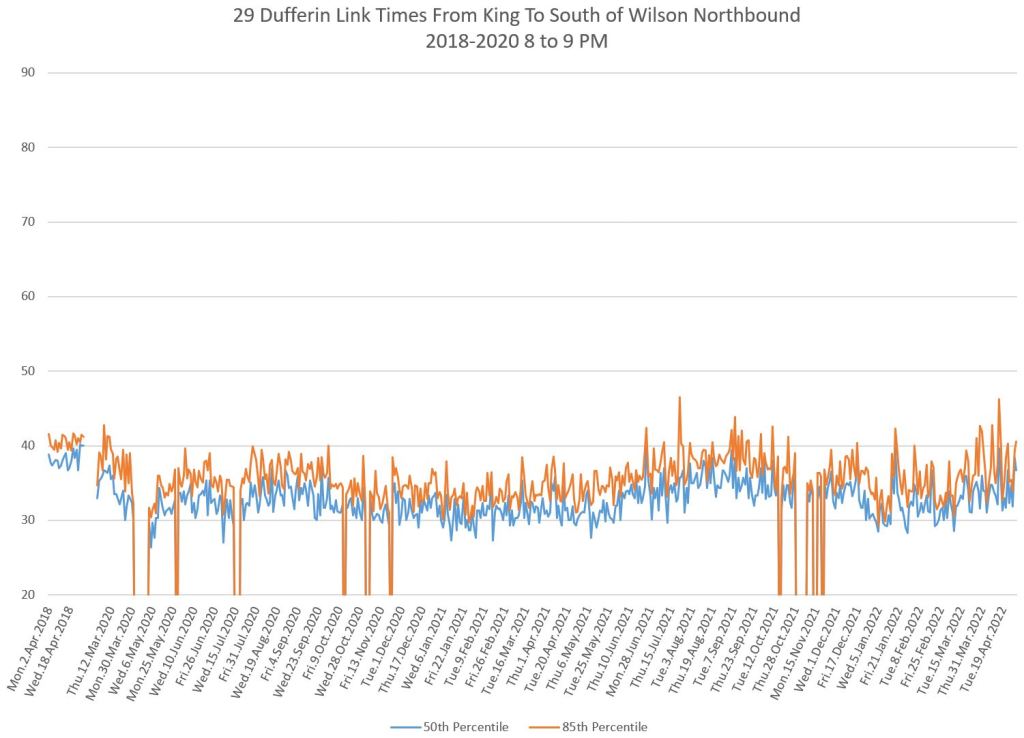
From the charts below, we can see that this problem does not affect the am peak or weekday evening periods, but the consistency of the travel times in those periods suggests that a reserved lane will be of limited benefit then. Conversely, stats that are averaged on an all-day basis might imply that congestion is a minor problem whereas on a detailed level it is clear that this is not true.
35 Jane
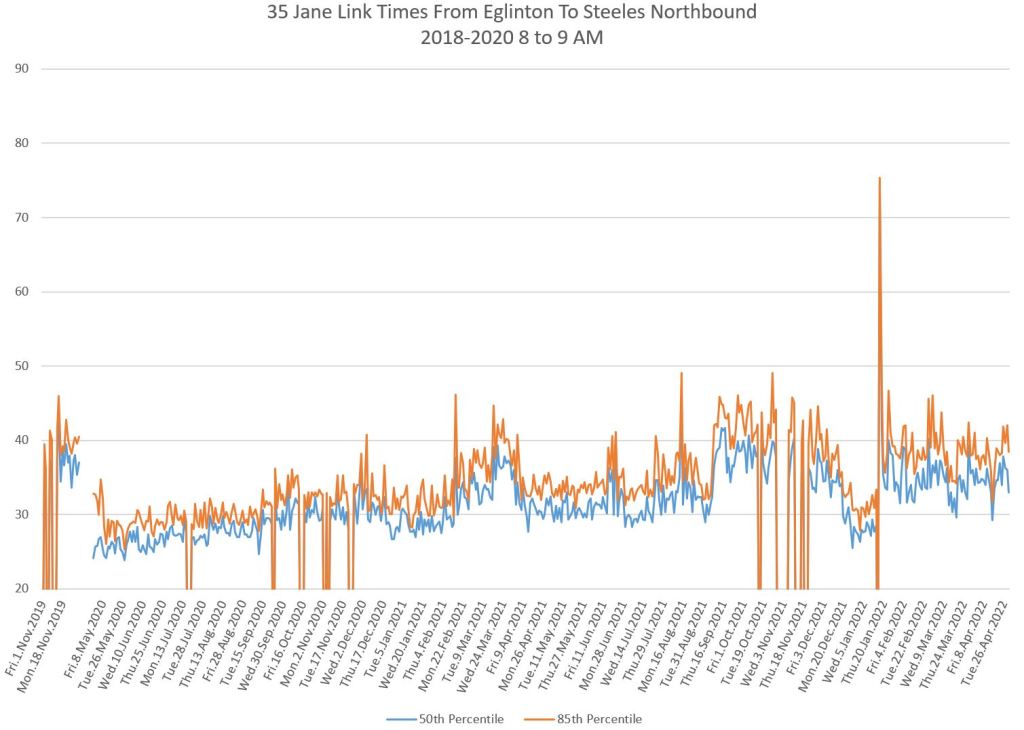
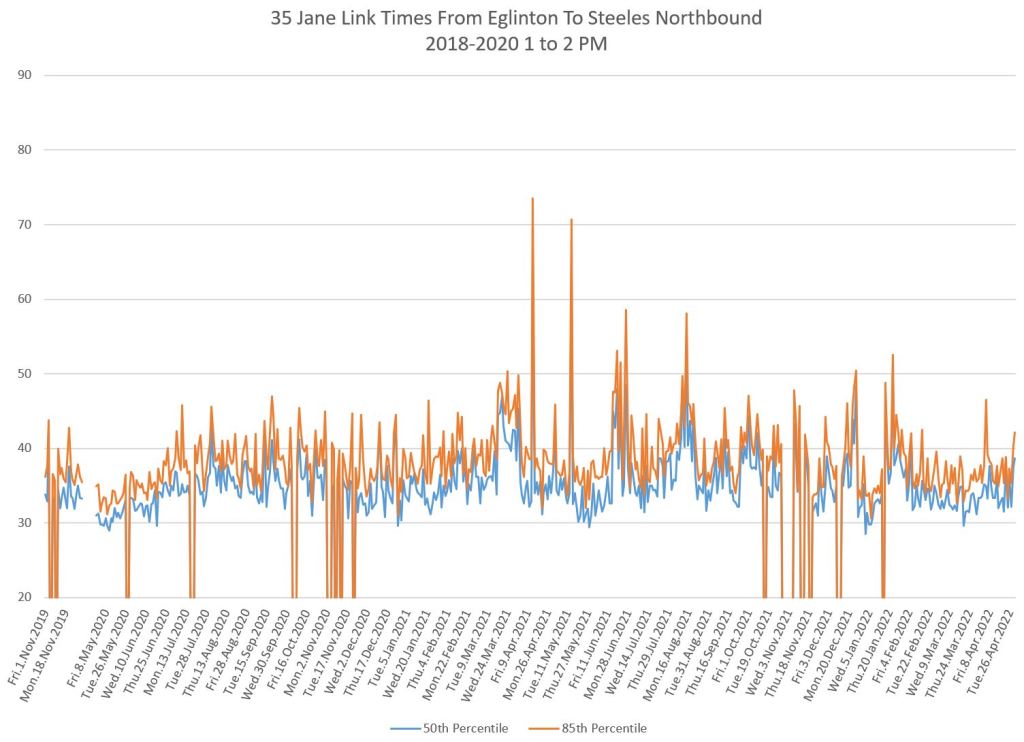
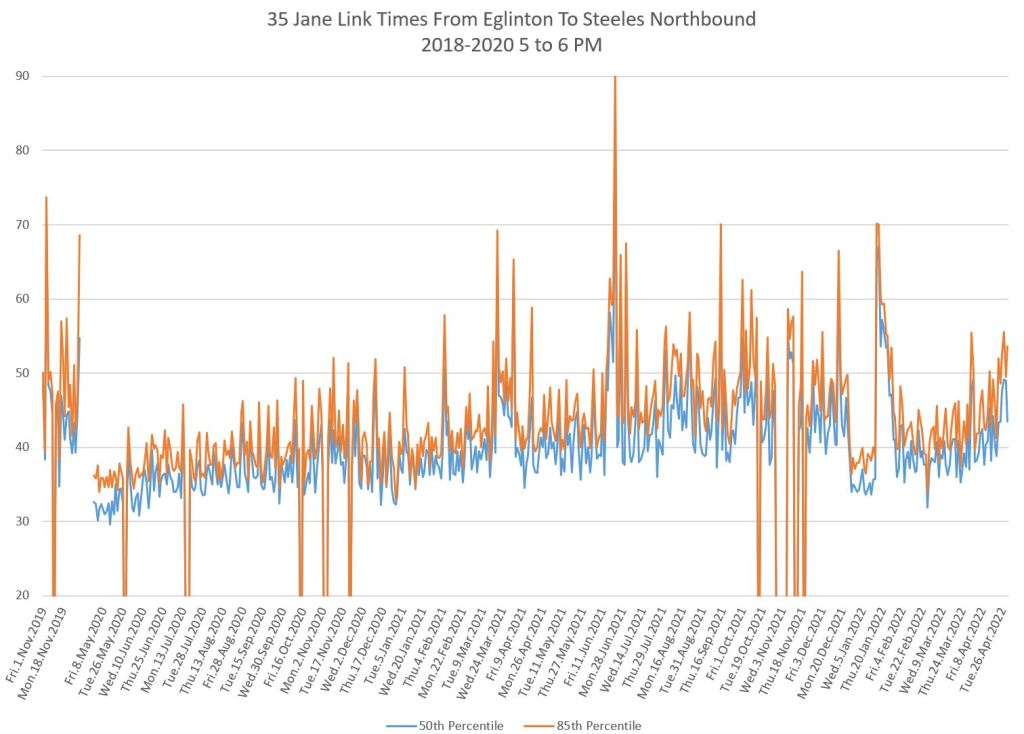
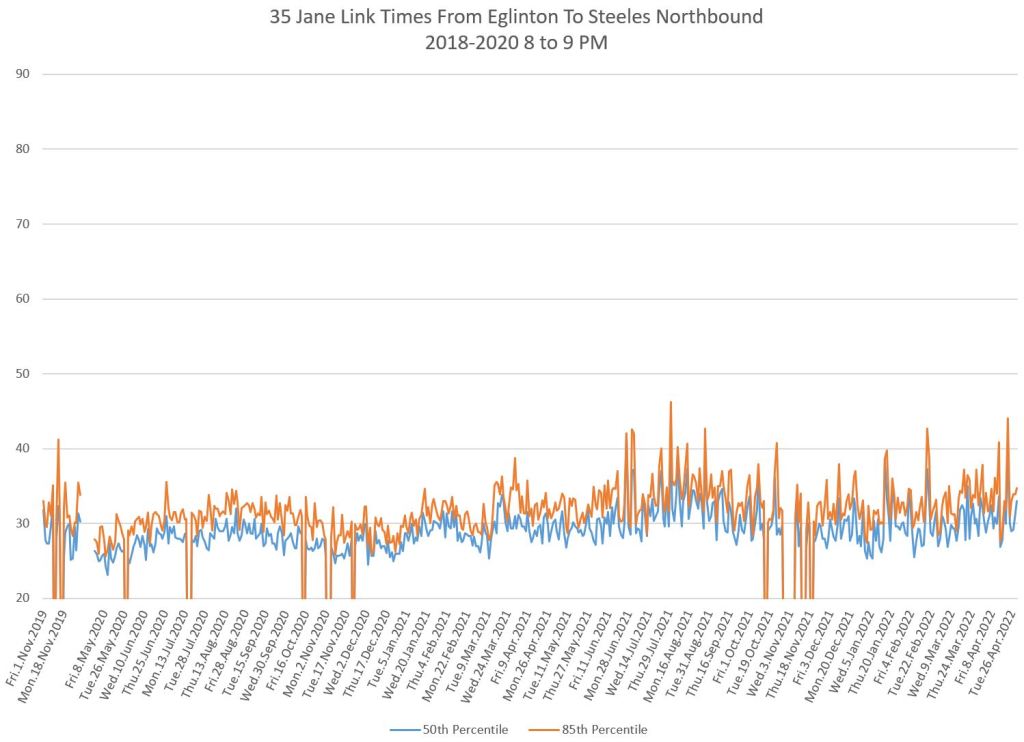
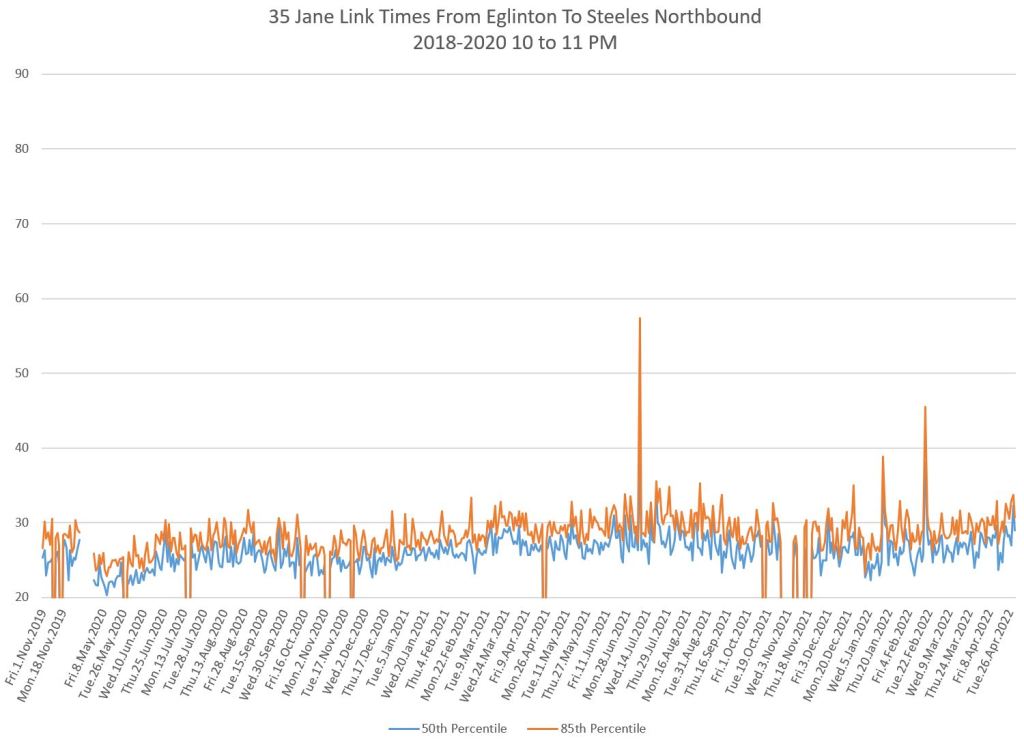
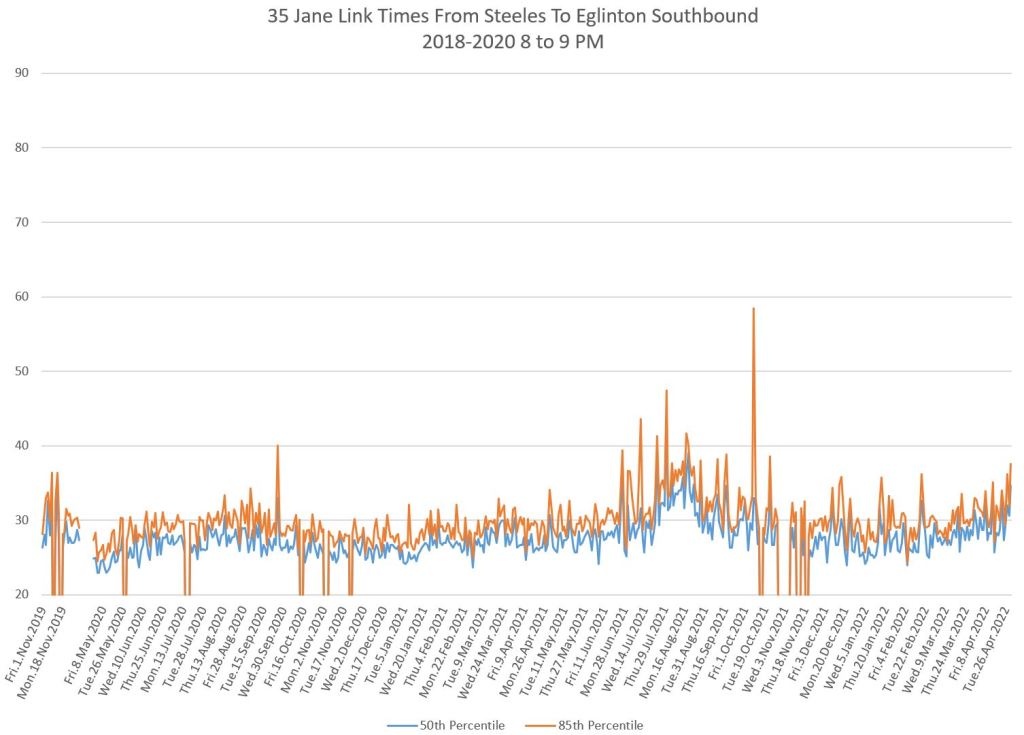
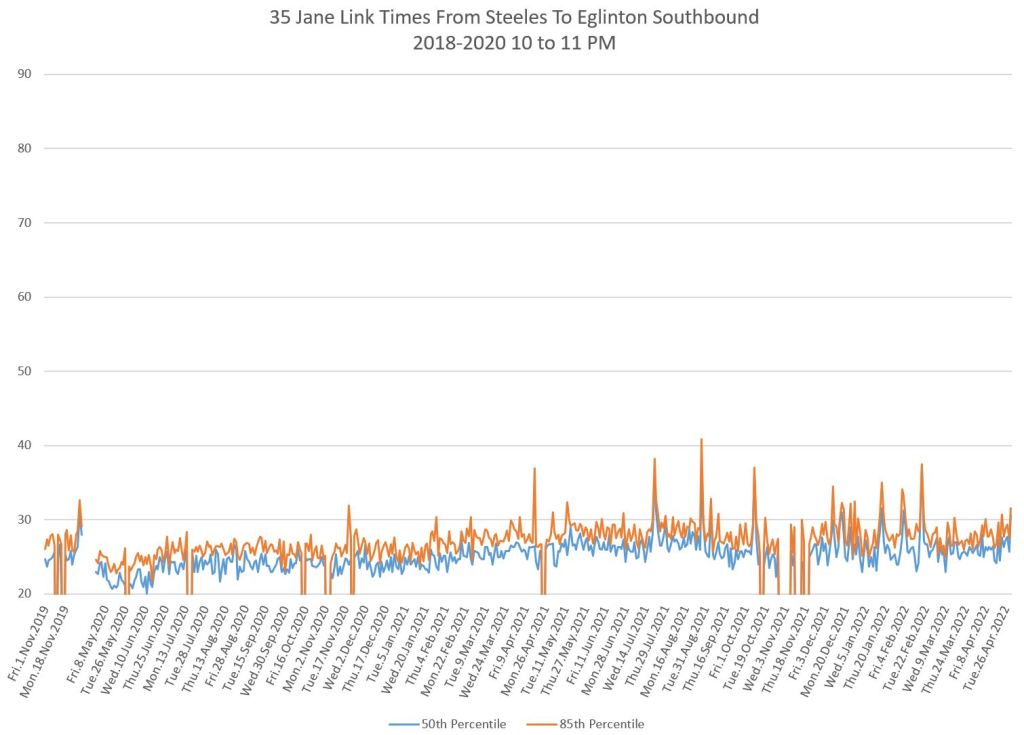
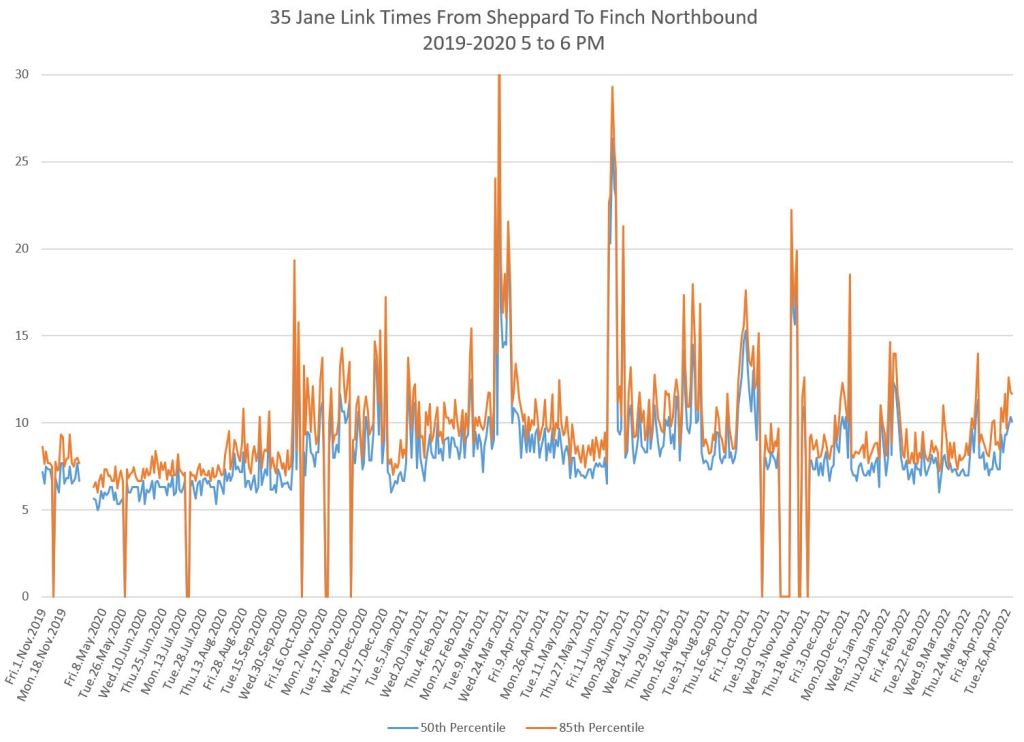
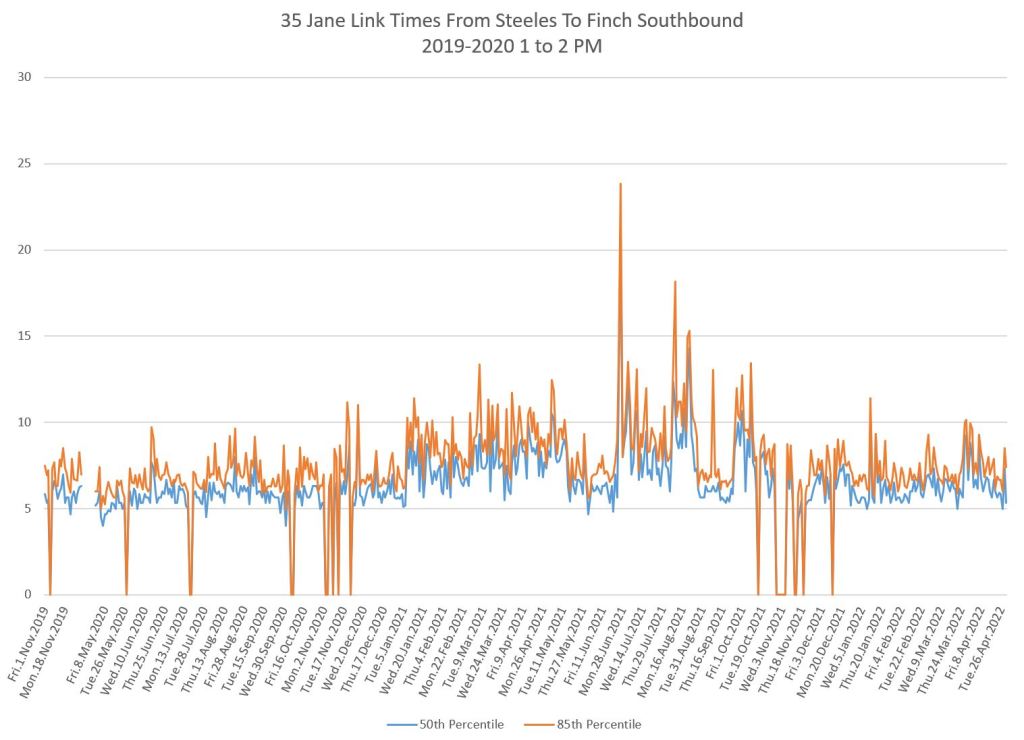
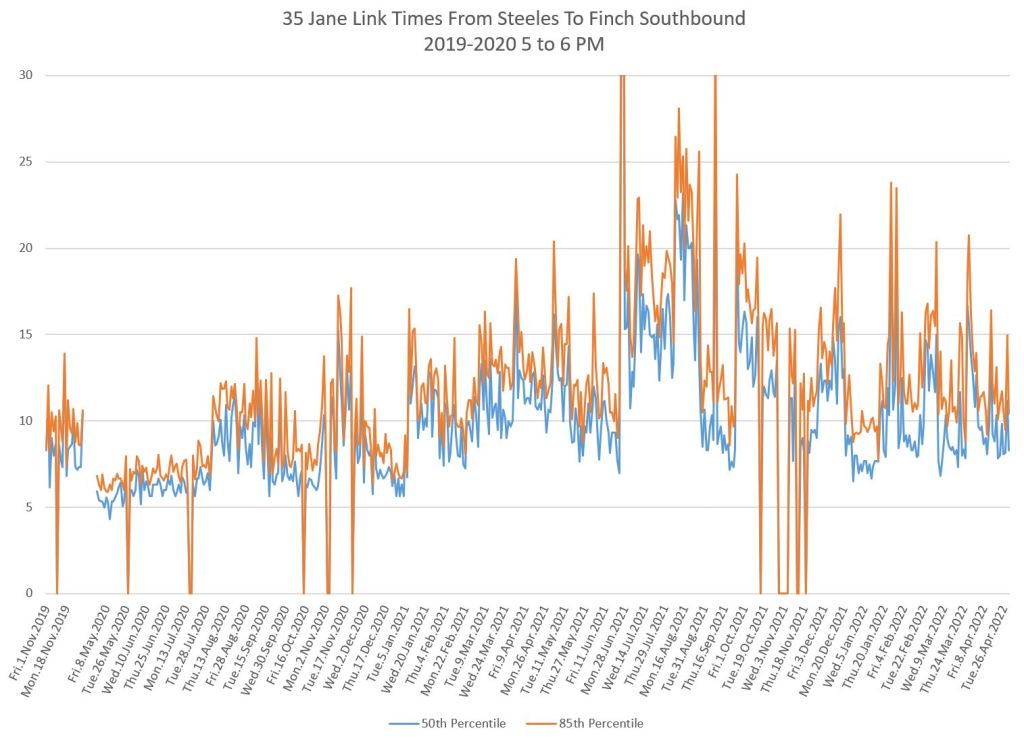
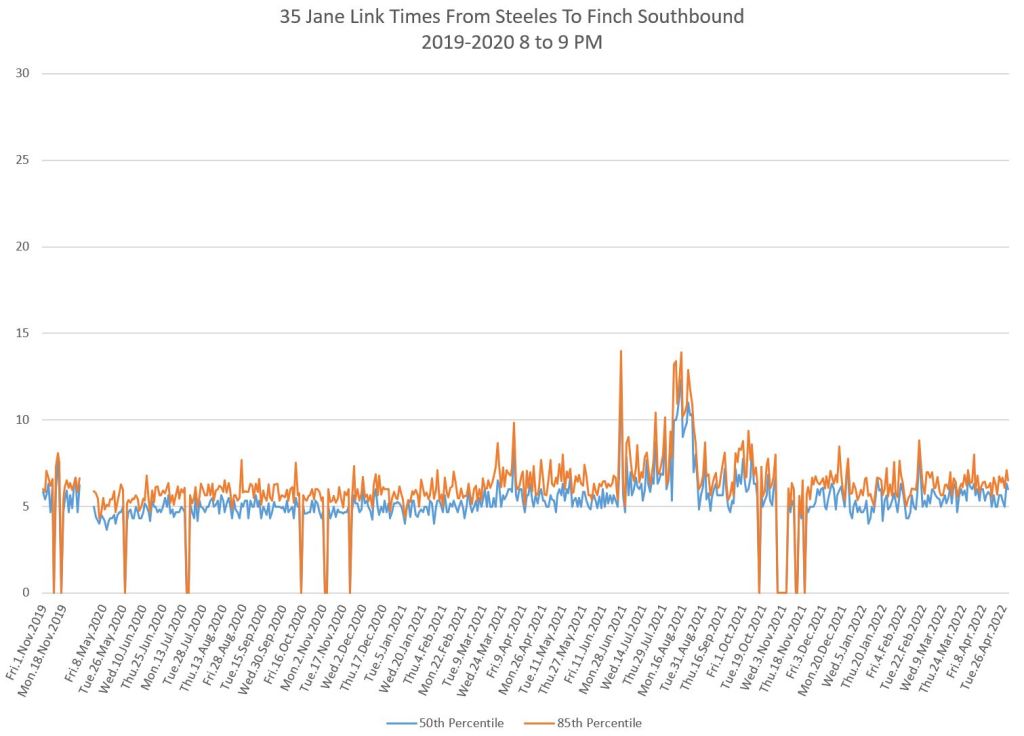
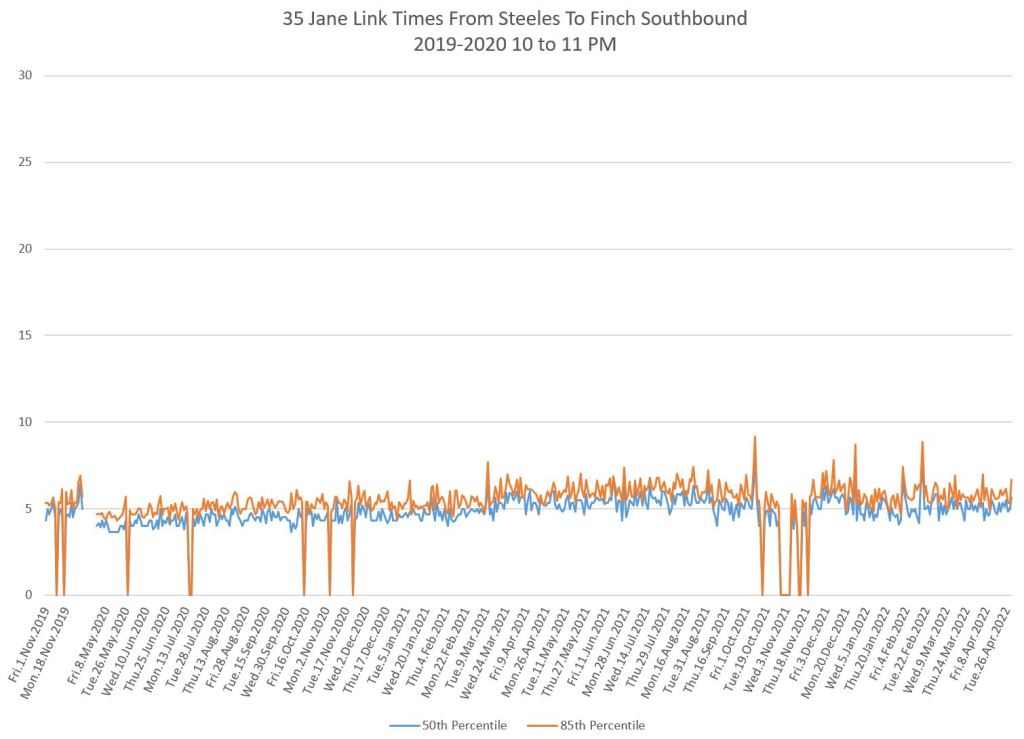
Jane Street shows a different pattern from Dufferin in that the data are “spikier” with more variation, and there has been a general growth in travel time over the two year period. An obvious question, as on Dufferin, is whether the extra time is concentrated in one place such as Finch and the Line 6 LRT construction project, or along the entire route.
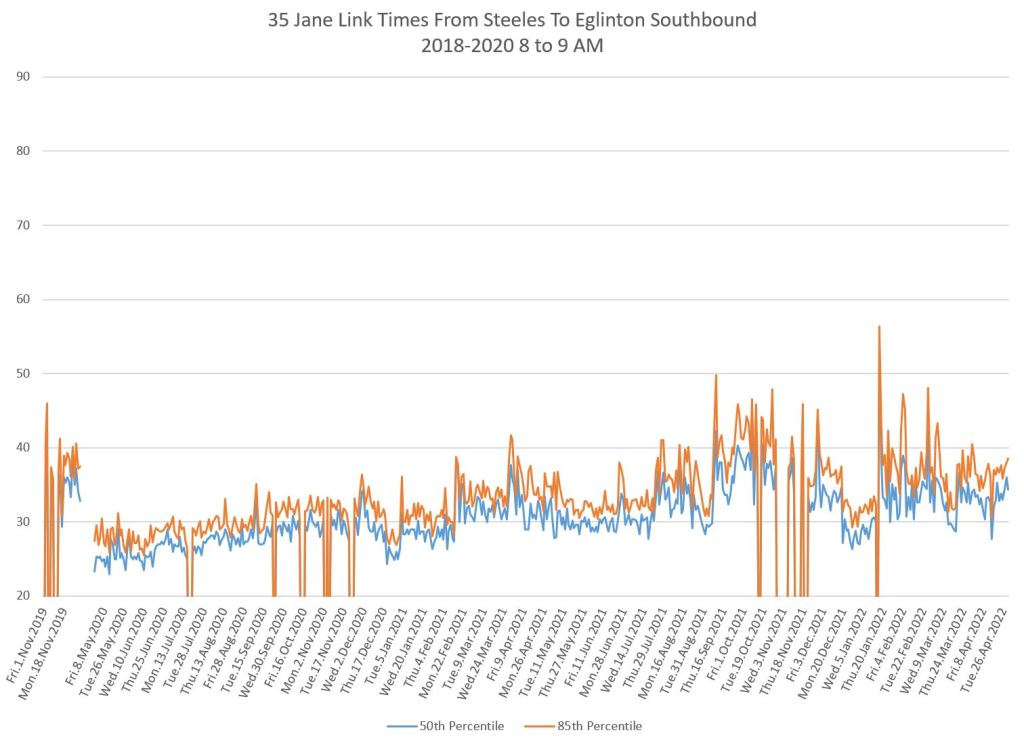
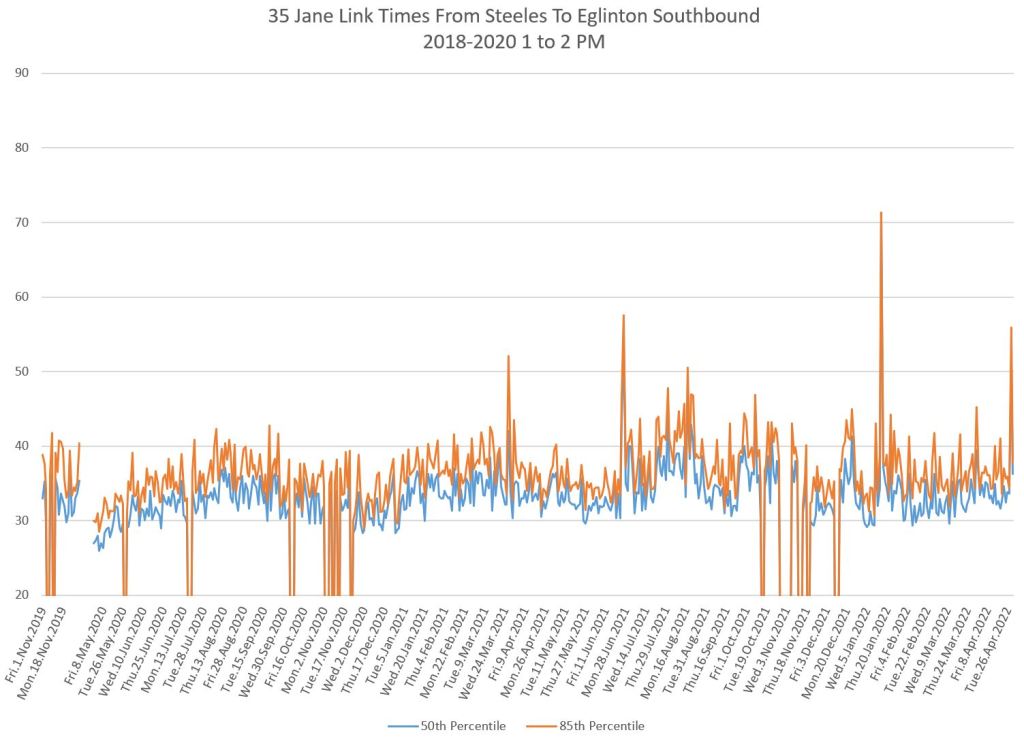
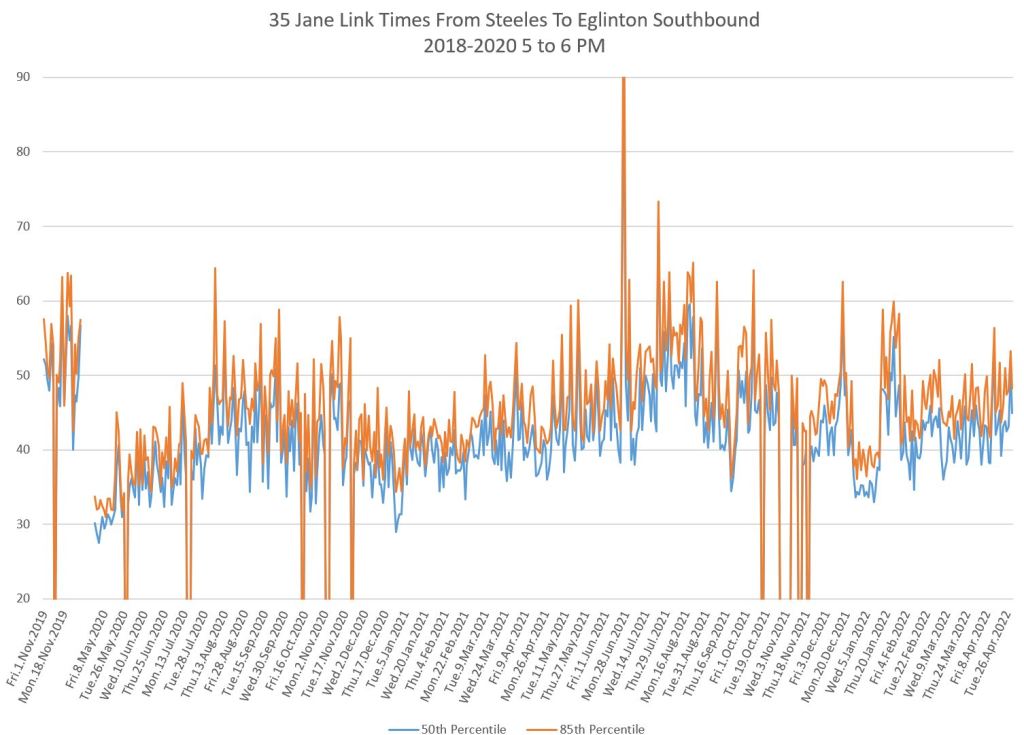
Although there is a drop in travel times at the start of the pandemic, this is undone, and in some cases bypassed as traffic return. Visible in some charts here are the initial March 2020 drop, the March 2021 brief reopening, the omicron drop at the end of 2021, and the snowstorm of January 2022. These all have different effects depending on the time of day and direction.
Northbound from Eglinton to Steeles
Southbound from Steeles to Eglinton
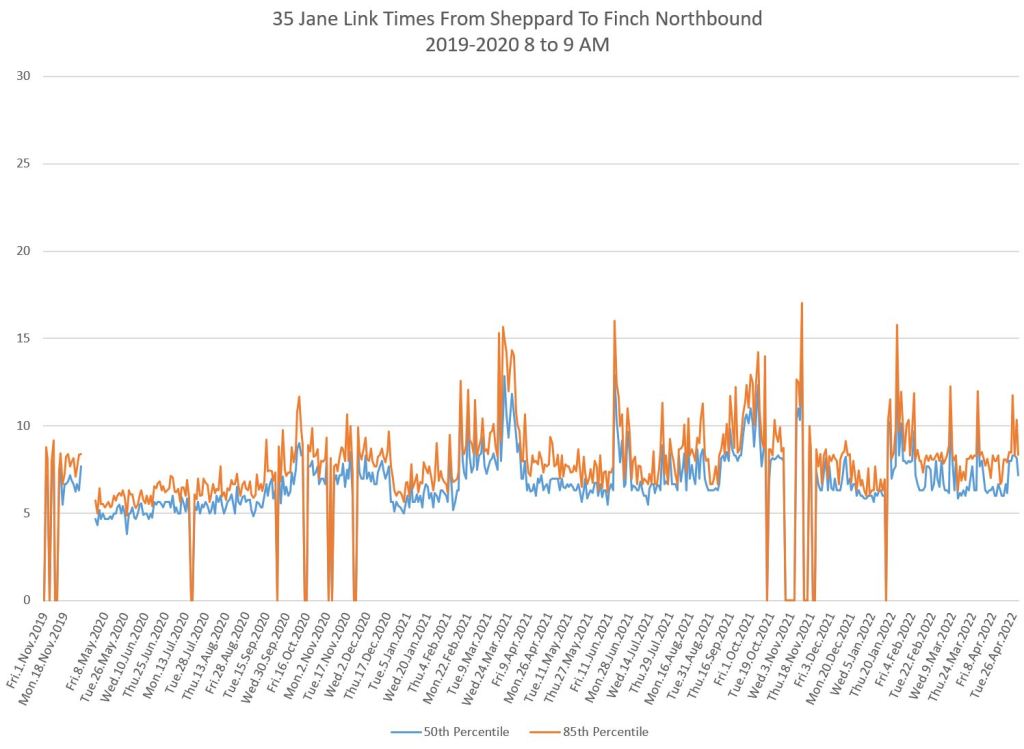
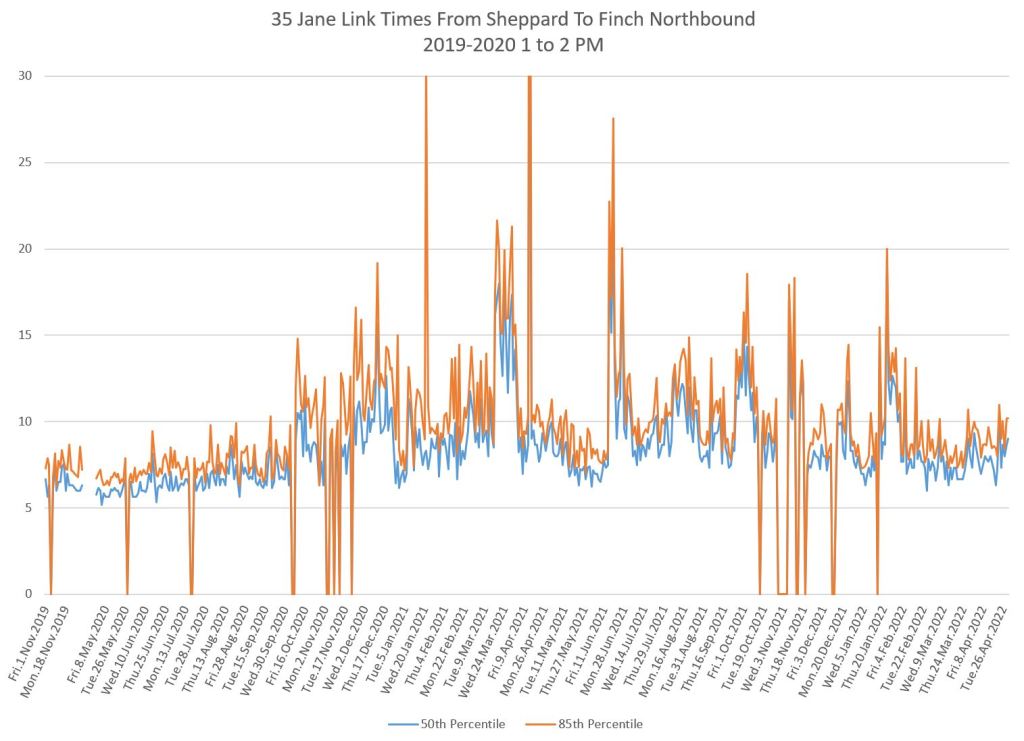
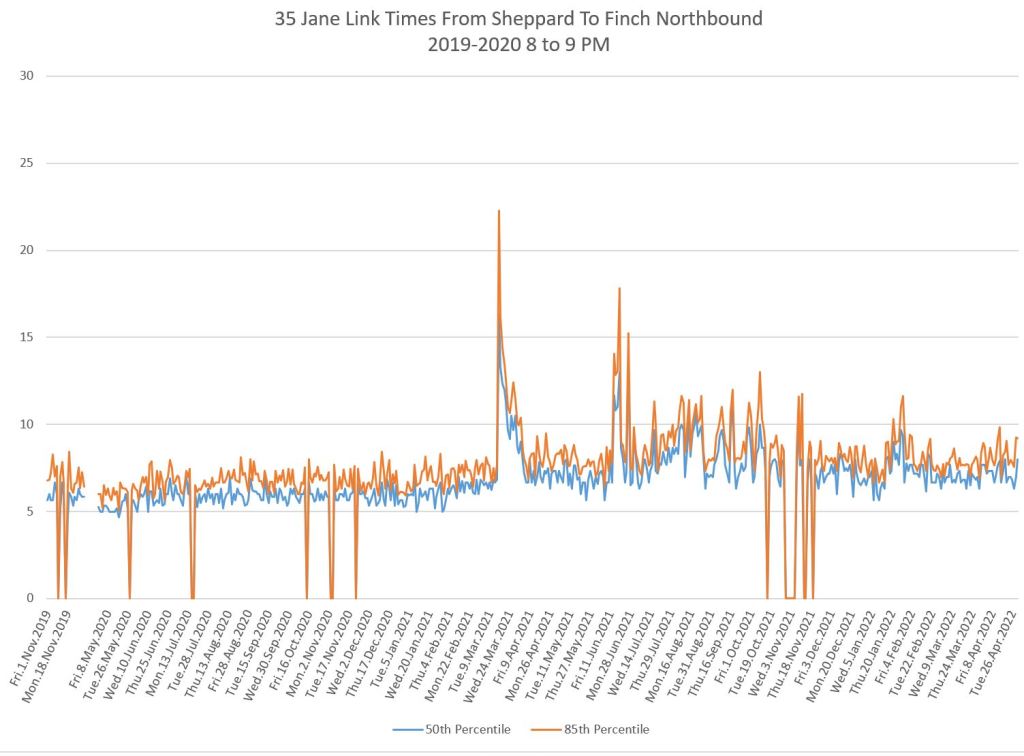
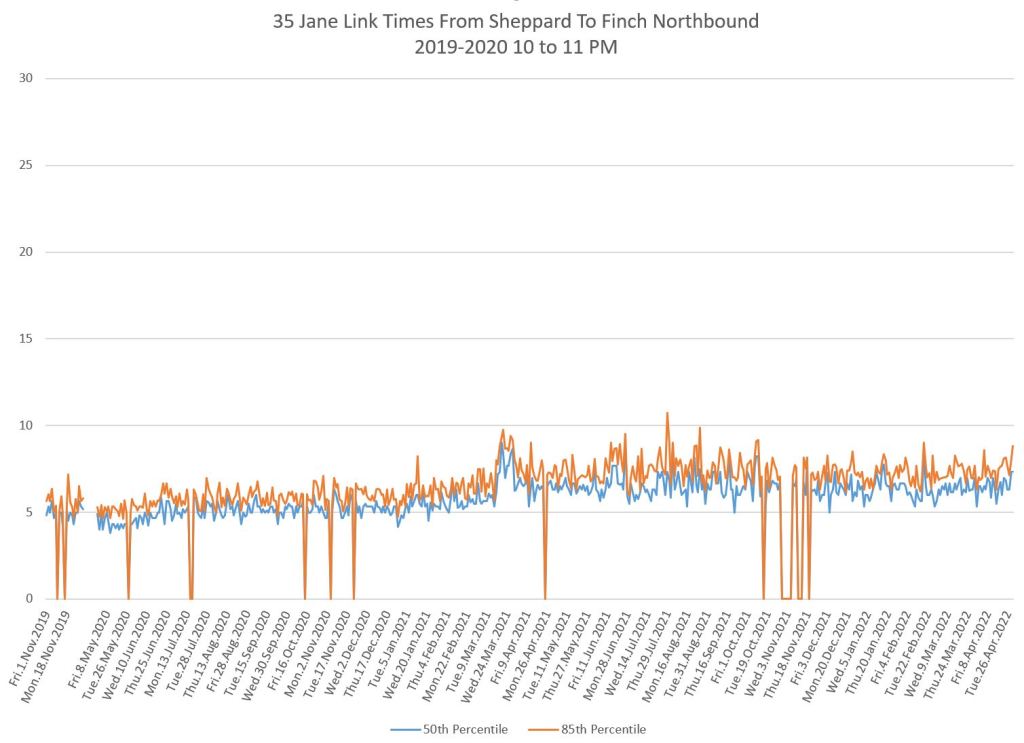
Northbound from Sheppard to Finch
Like Dufferin, Jane has had the effect of LRT construction on a cross street, albeit at the surface rather than an underground station. Periods of longer times are not always the same northbound from Sheppard to Finch as they are southbound from Steeles to Finch. Possibly the effects of construction changed as the project went through different phases and affected the two directions of travel differently.
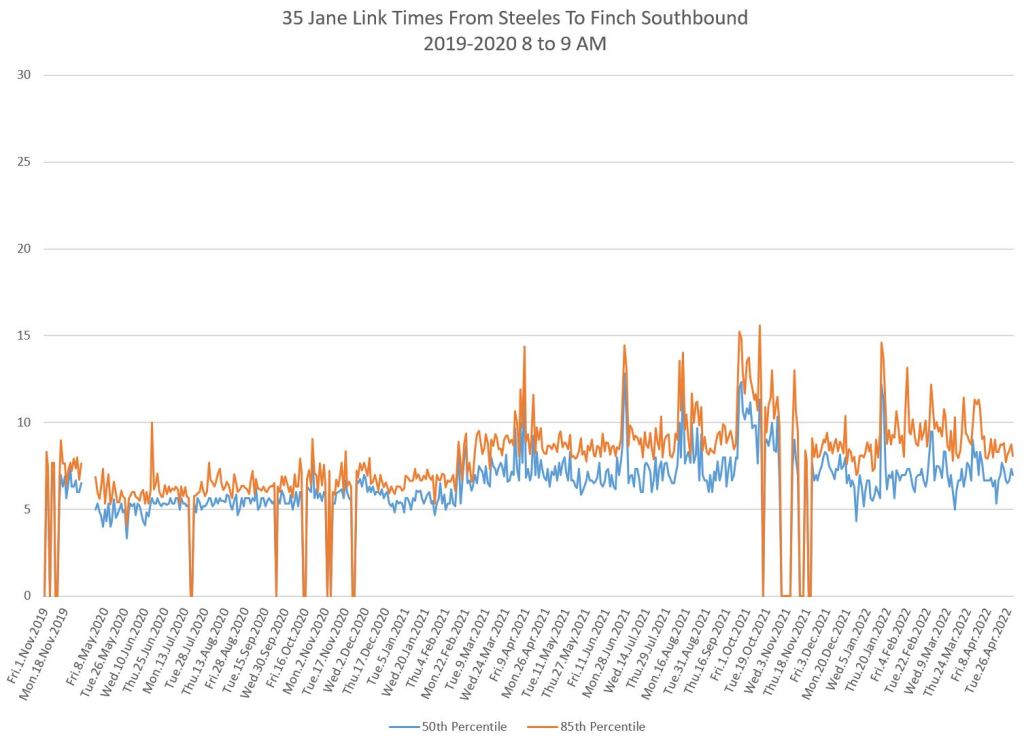
Southbound from Steeles to Finch
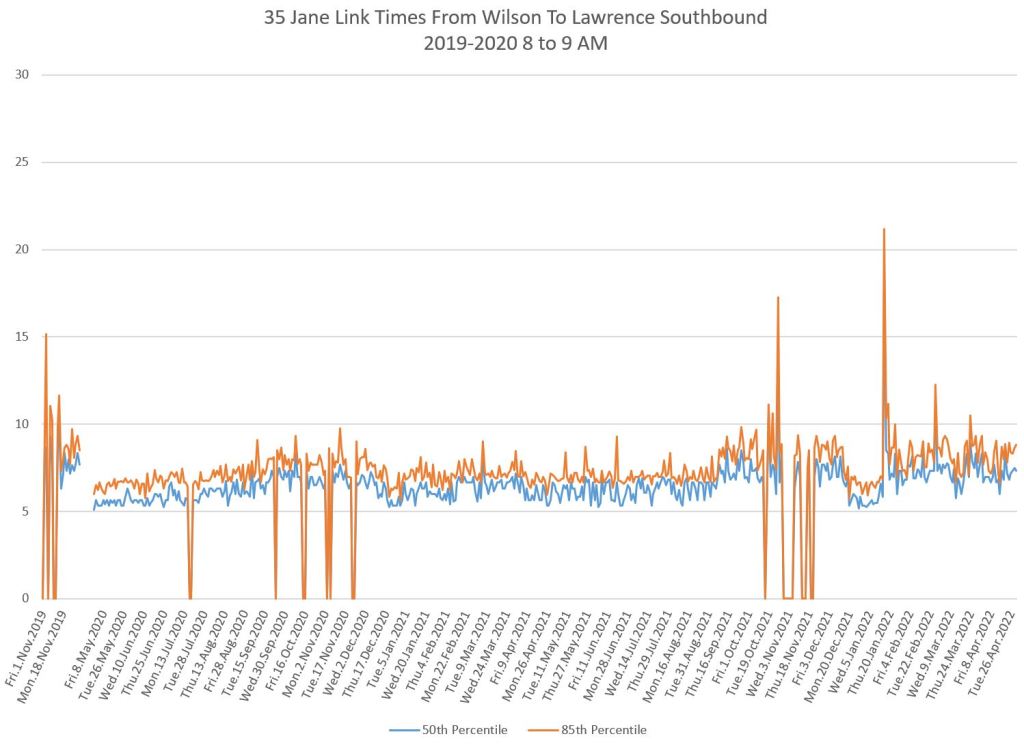
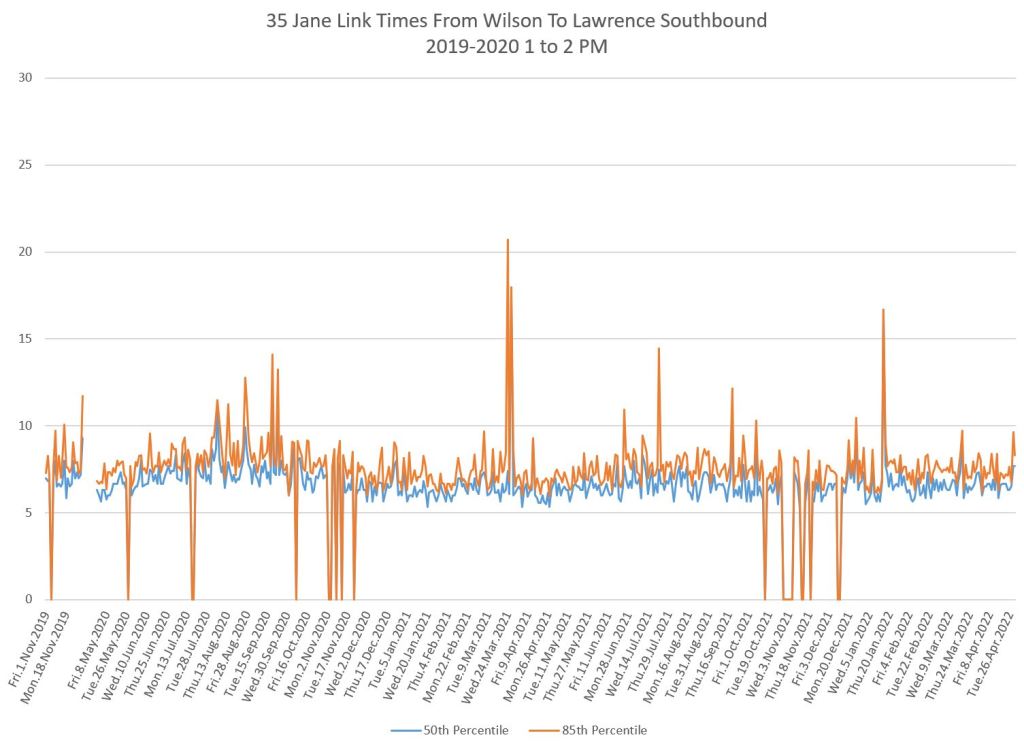
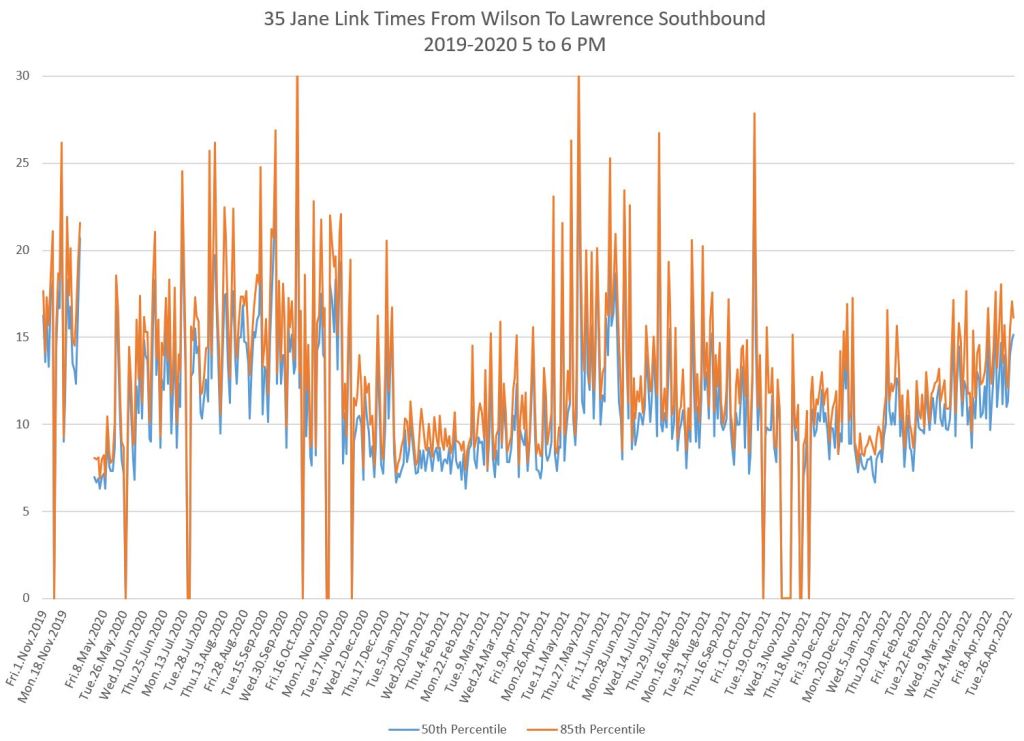
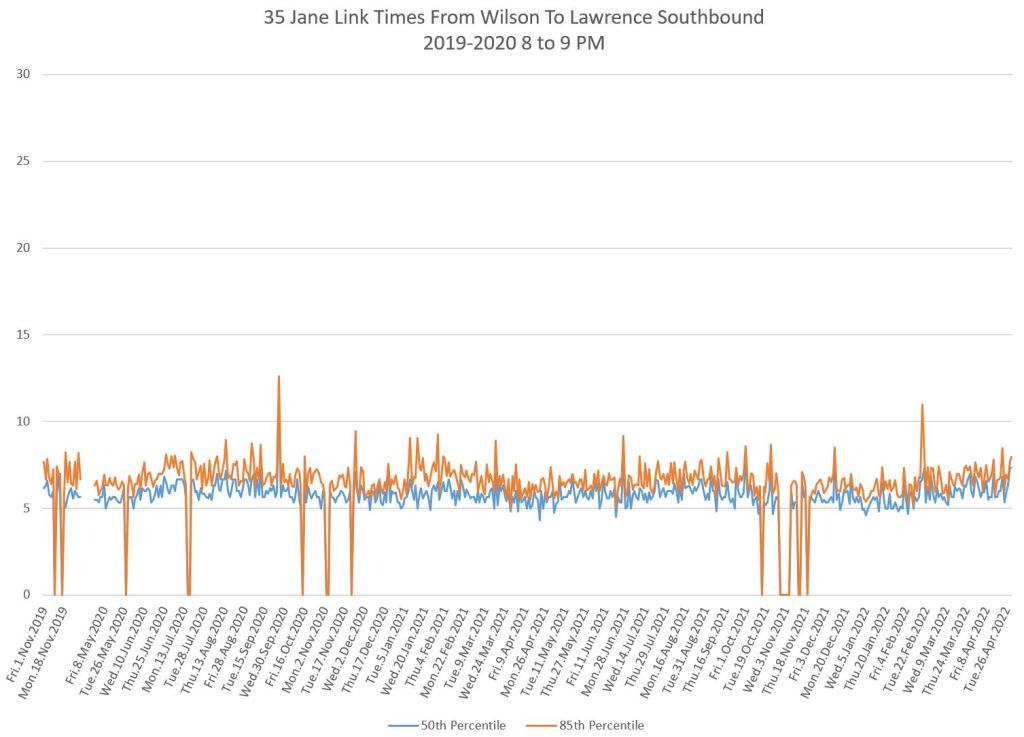
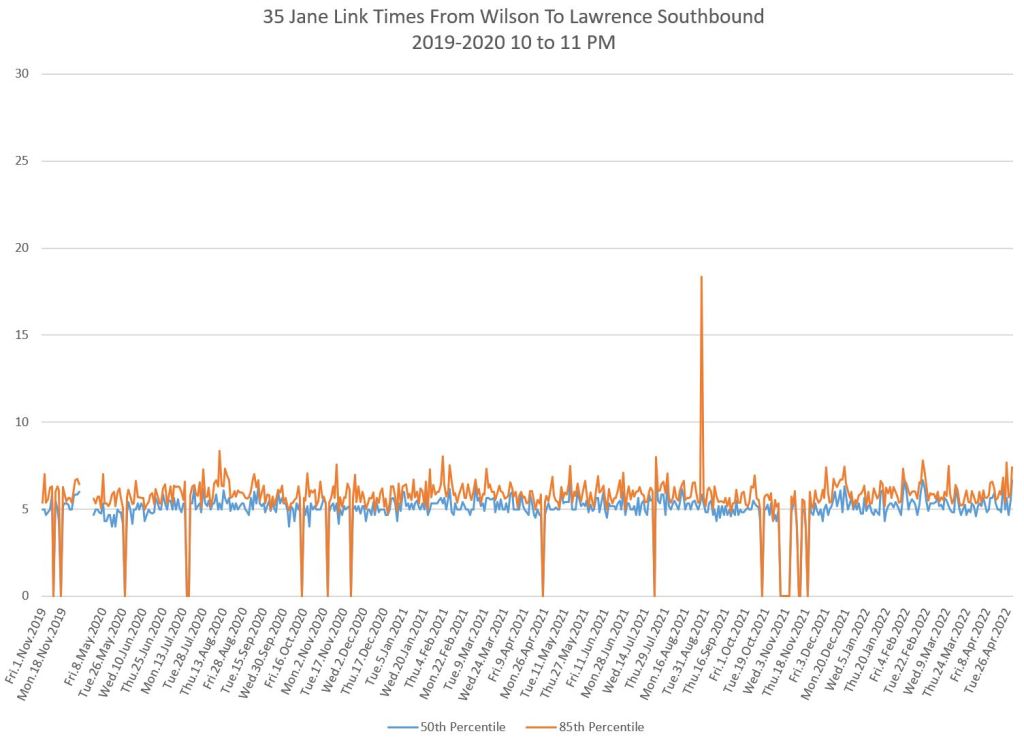
Southbound from Wilson to Lawrence
One area of particularly severe congestion, albeit only during the PM peak, was southbound from Wilson to Lawrence. This fell off after each major lockdown (original in March 2020, then December 2020 and finally Dec/Jan 21/22. By the end of April, the values were building up again but not yet to pre-pandemic levels.
Note that this problem confined to a certain period of the day.
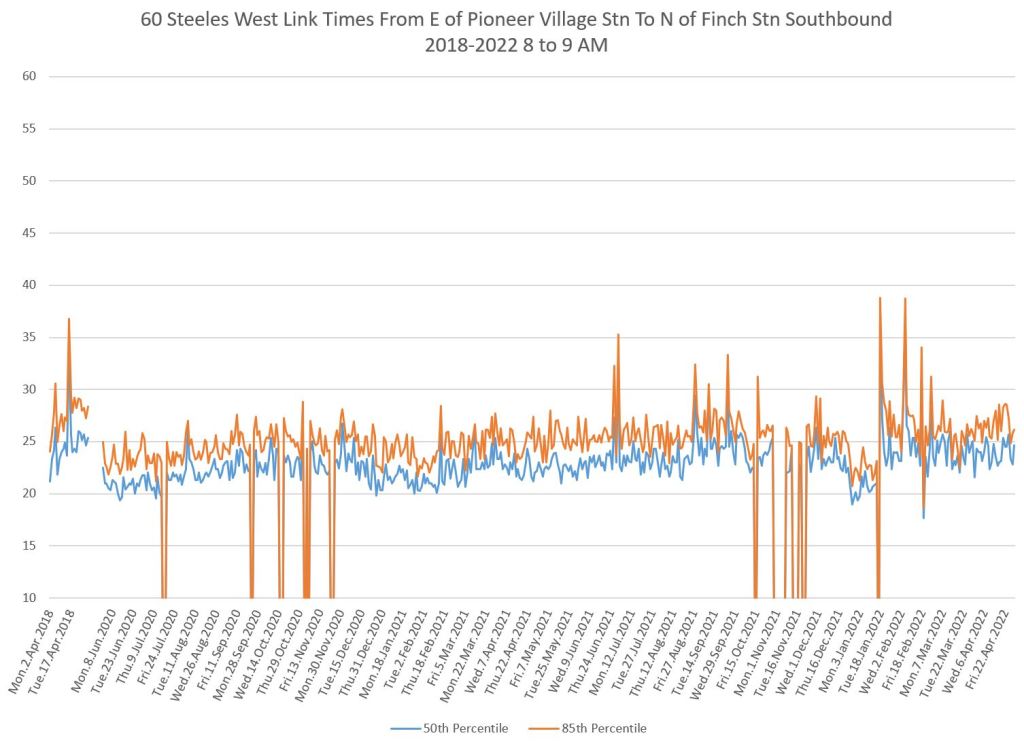
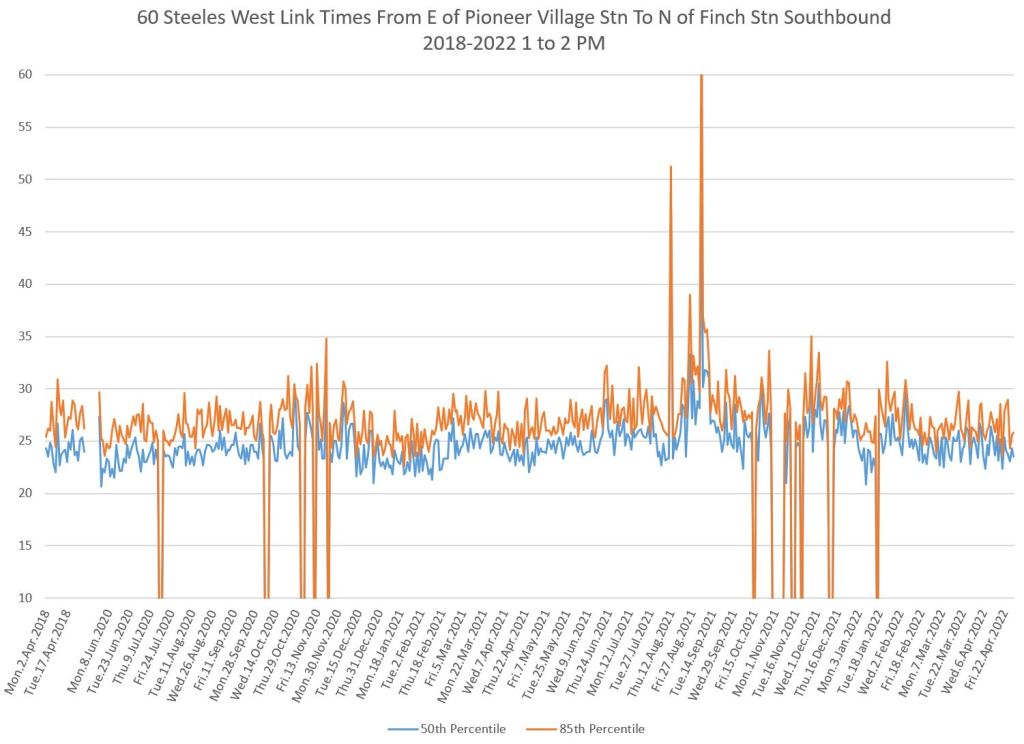
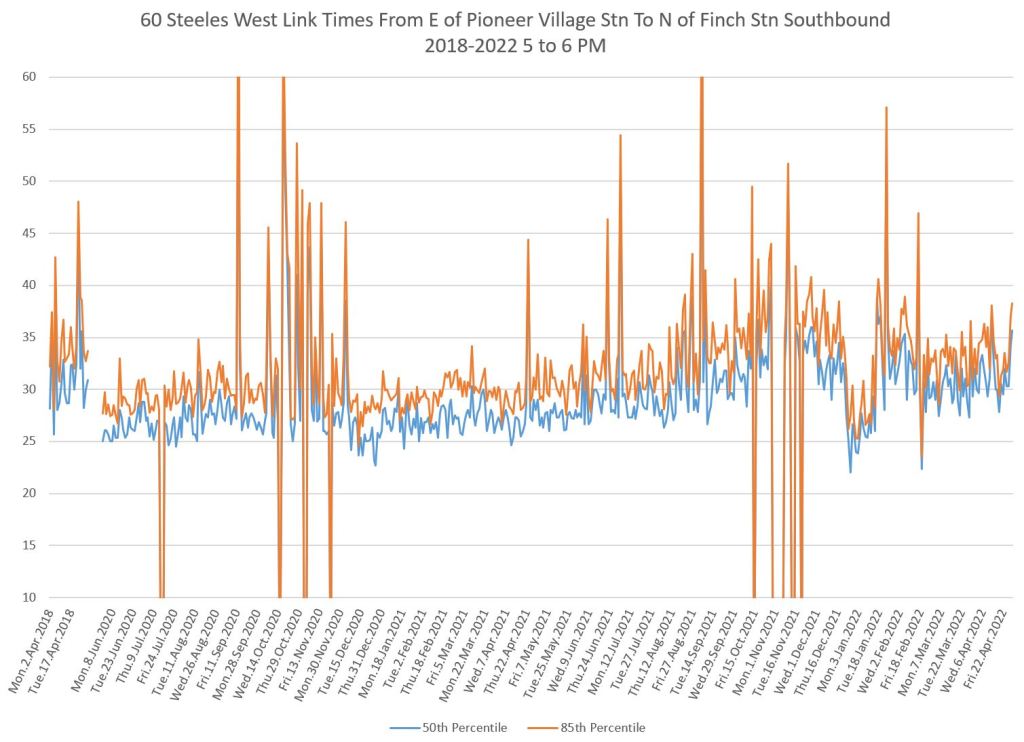
60 Steeles West
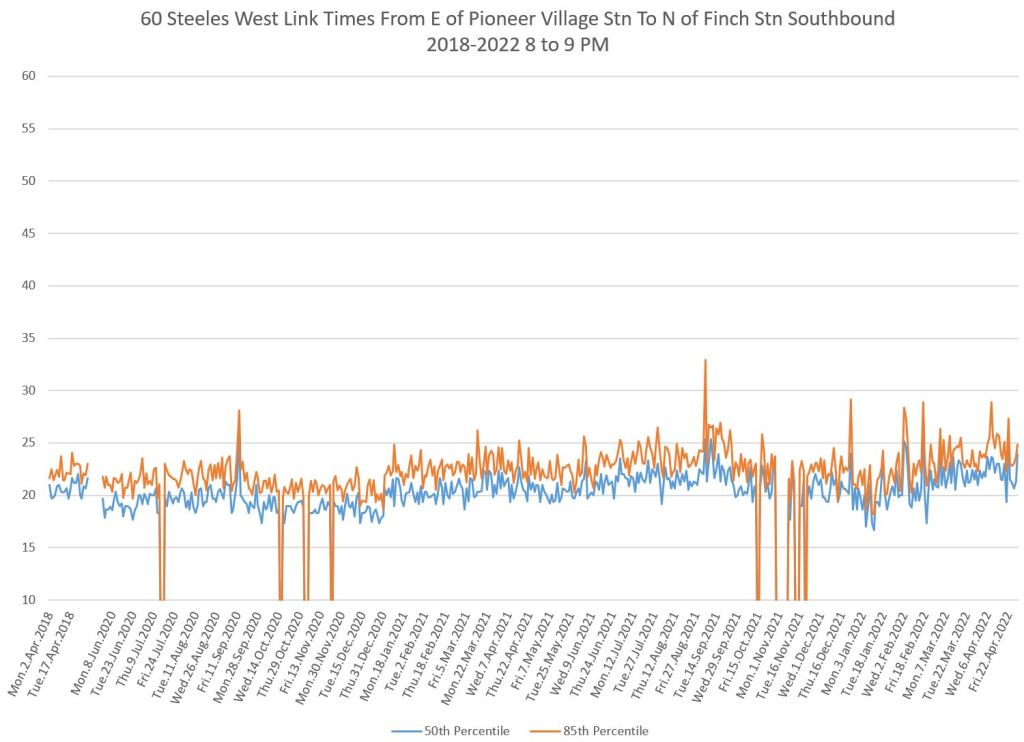
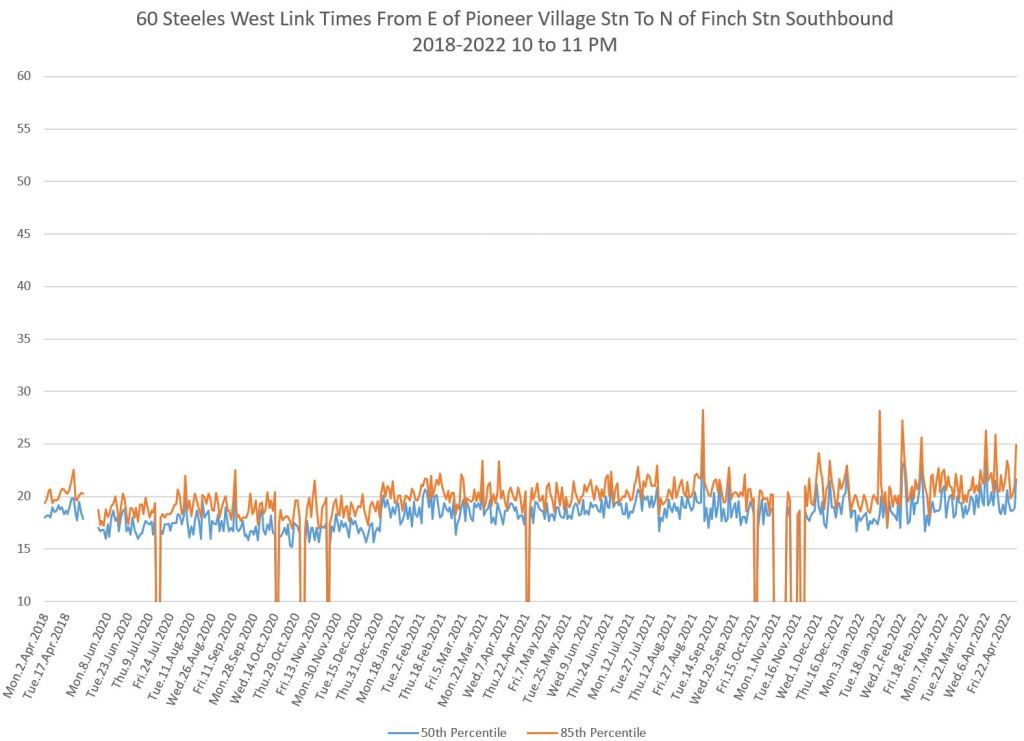
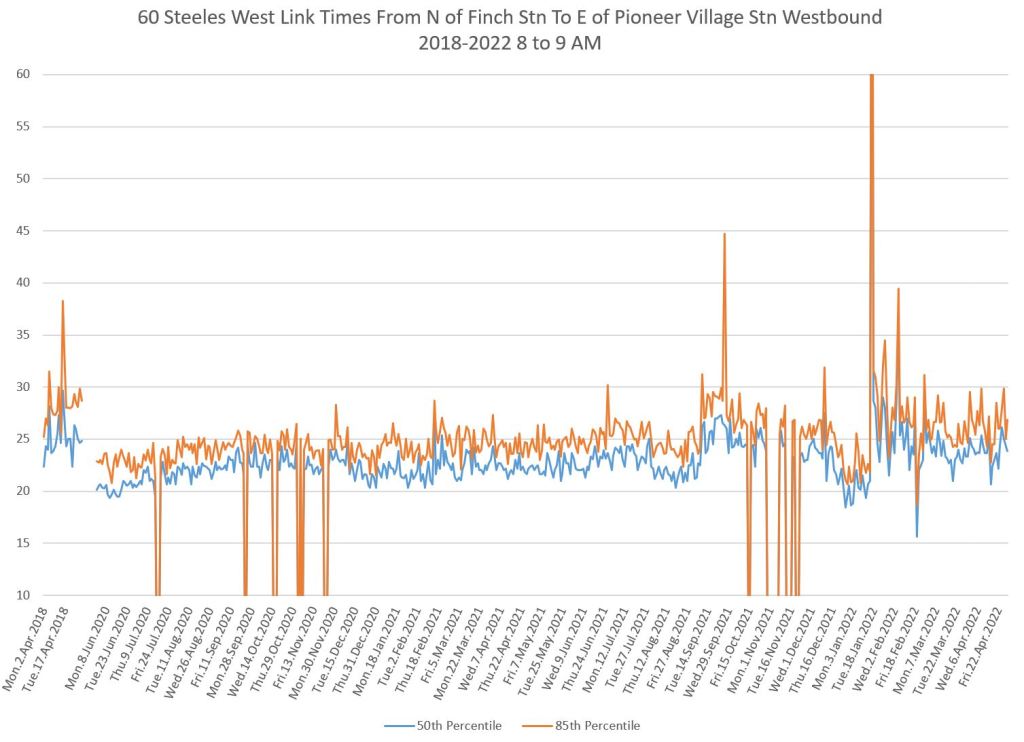
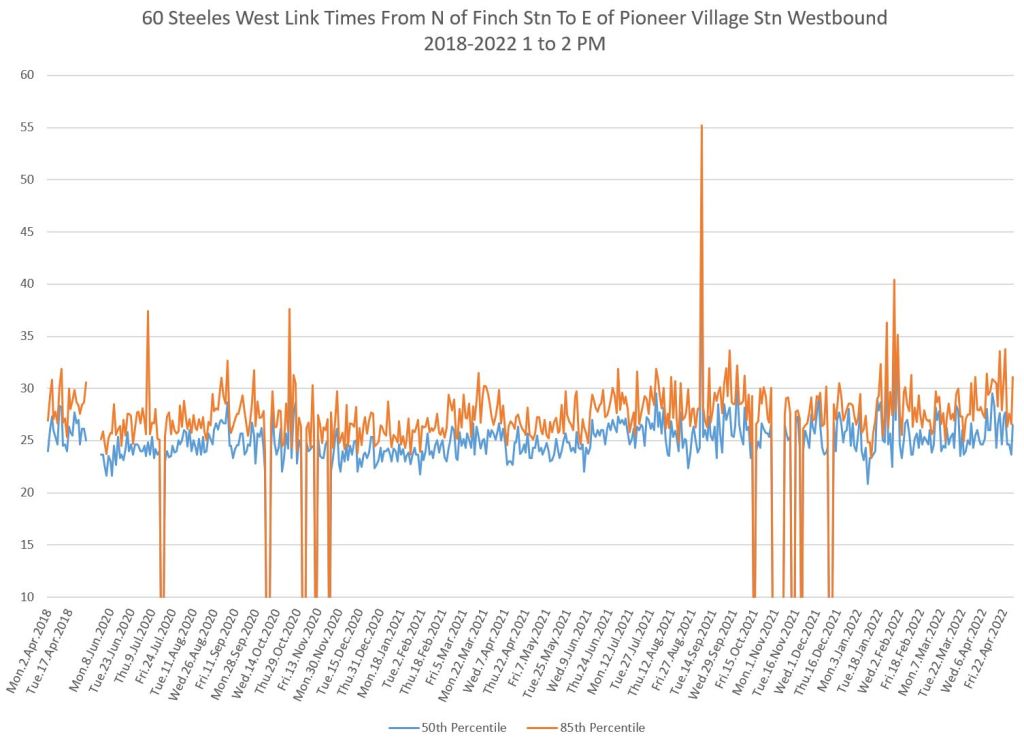
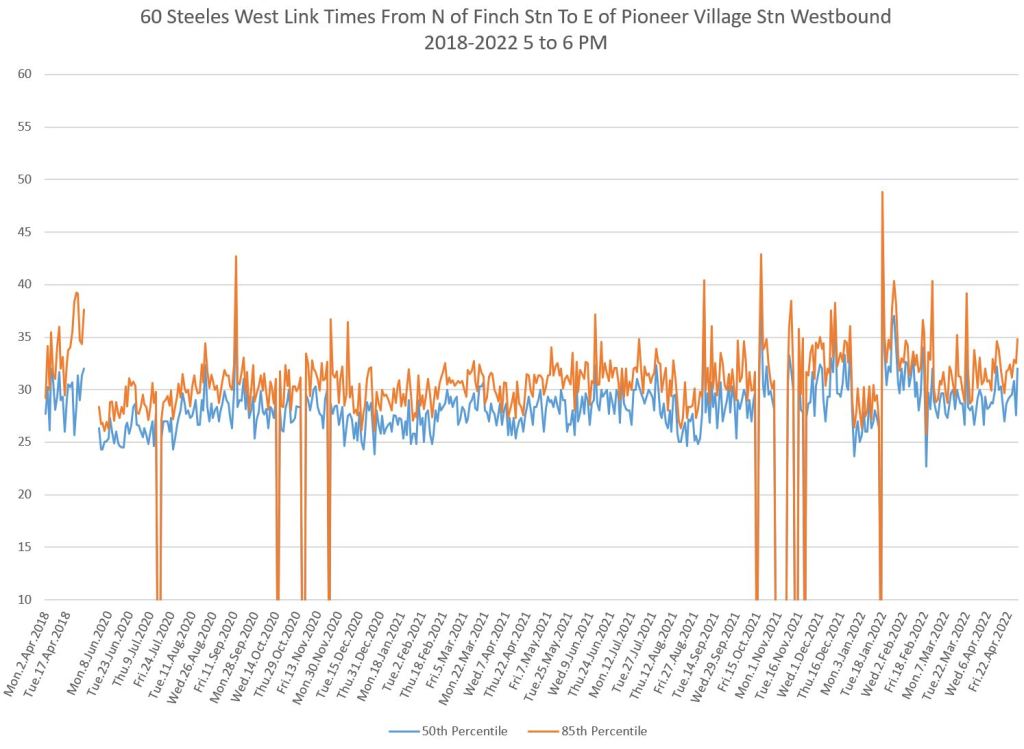
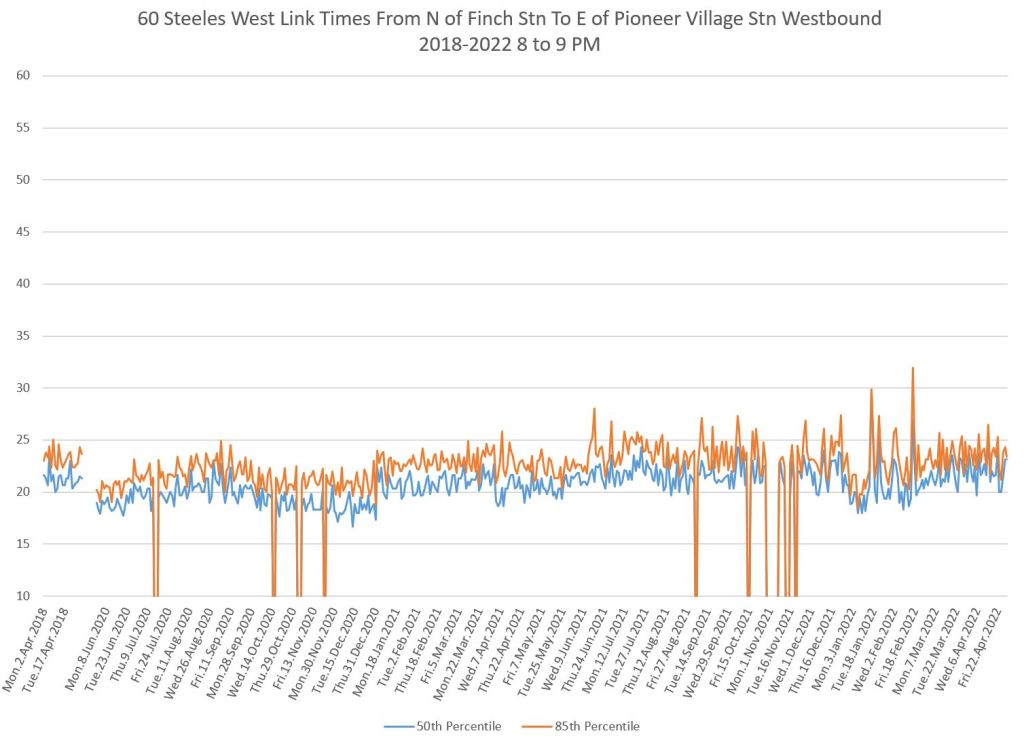
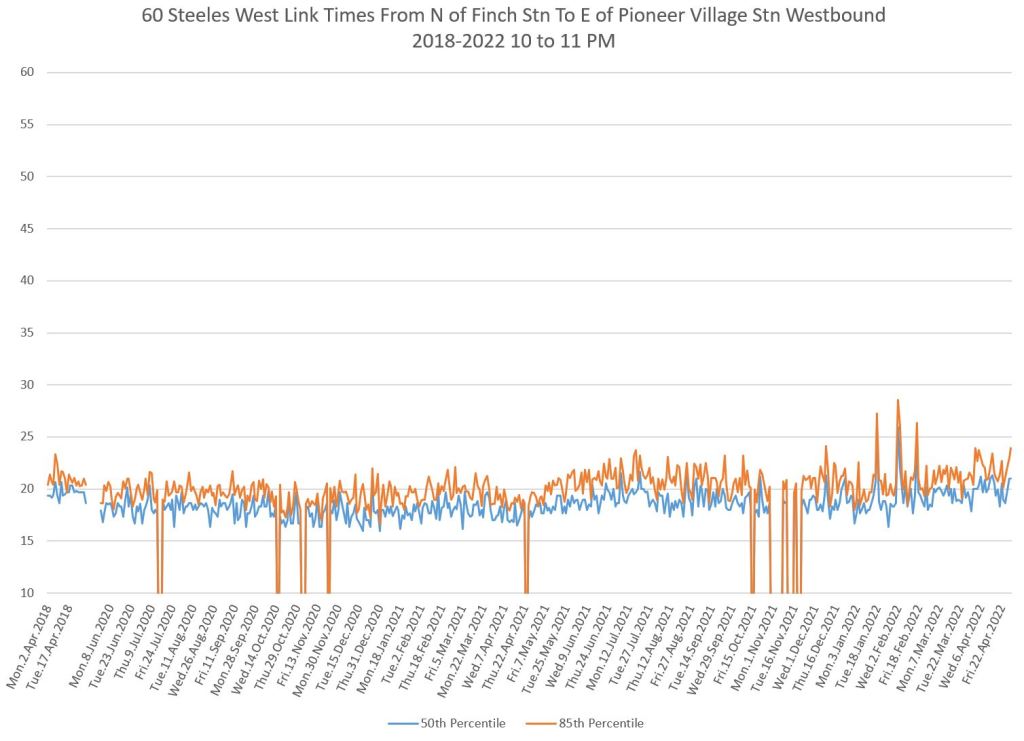
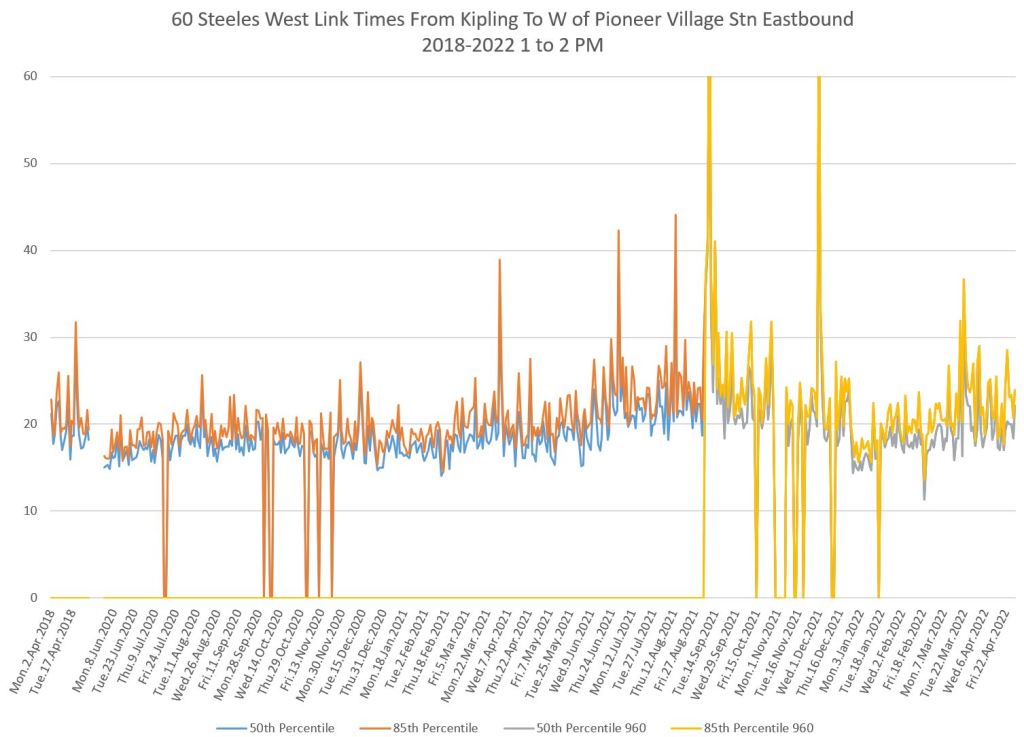
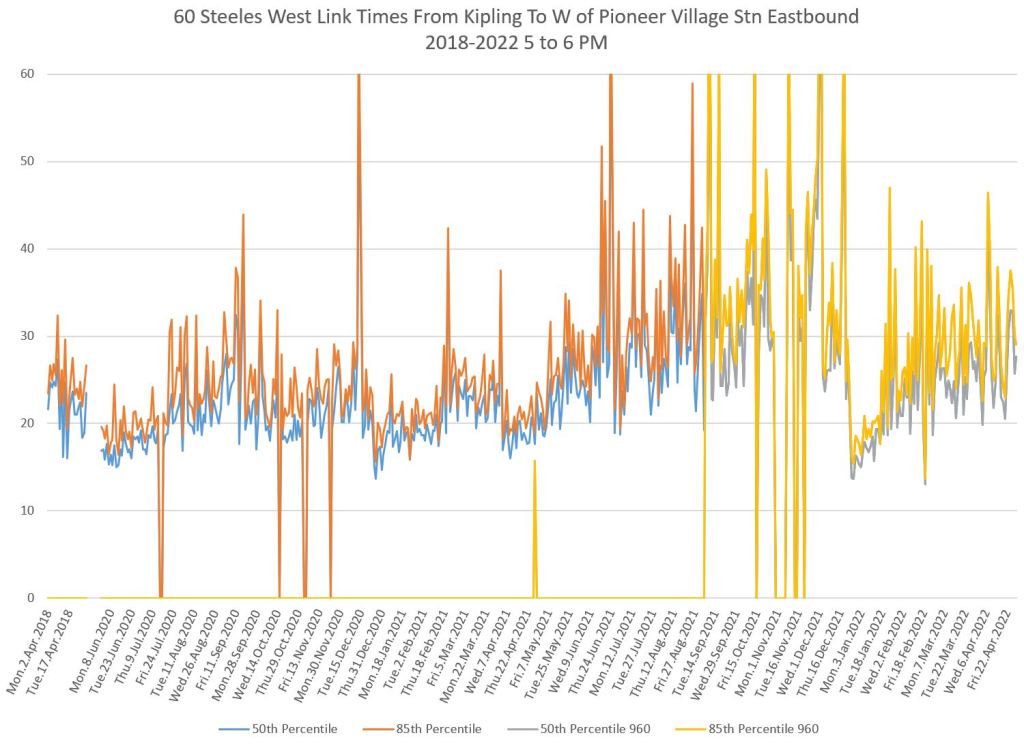
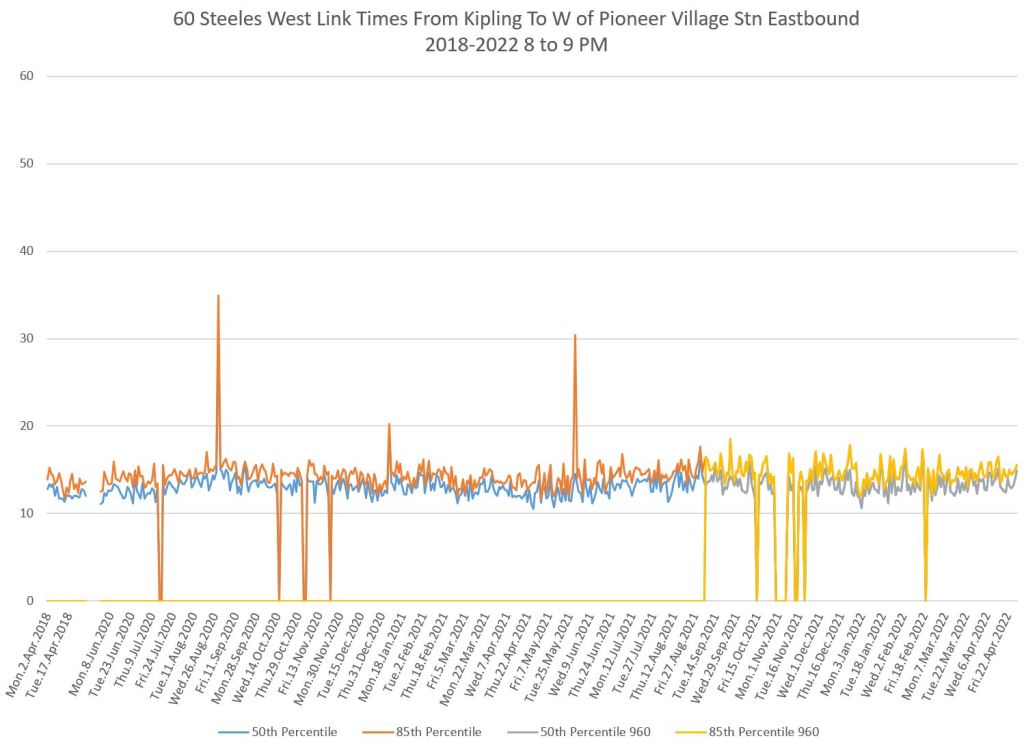
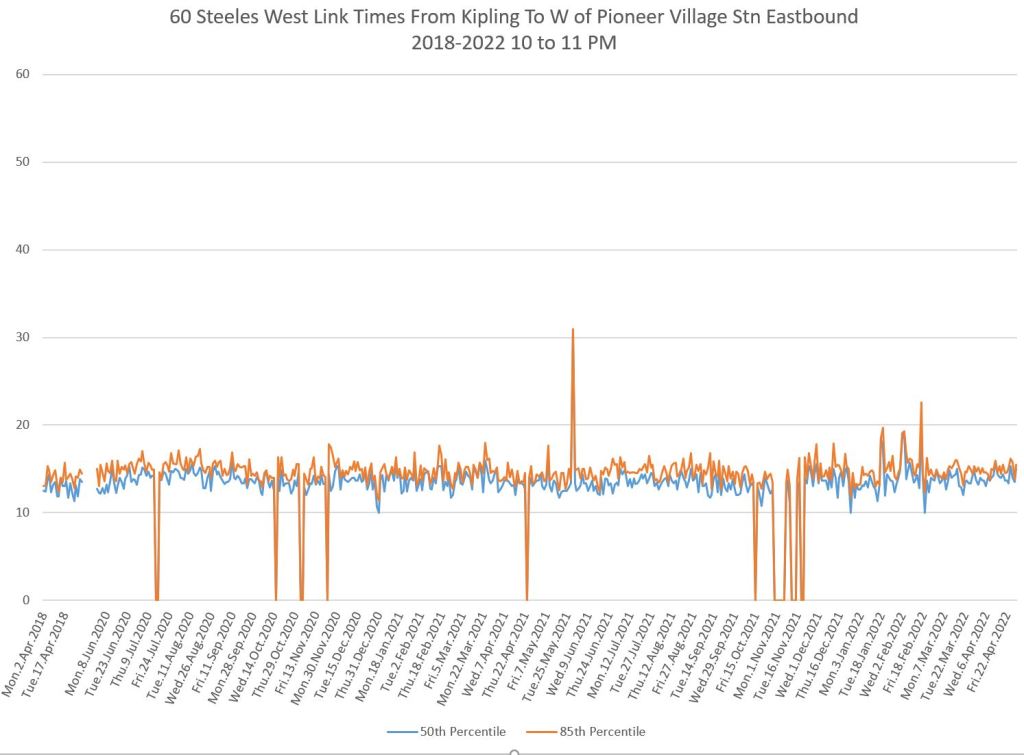
Travel times on Steeles West did not drop much at the onset of the pandemic, although they show a gradual rise over the past two years. A large drop is visible in the PM peak for the omicron wave (Dec/Jan 21/22), and it is more pronounced eastbound than westbound. Other shutdowns and reopenings had less visible effect on this route than some others.
Looking at the detailed data (not shown here), the primary source of congestion was the intersection of Yonge & Steeles, with lesser delays at the intersections of Bathurst and Dufferin Streets.
Any move to improve operations at Yonge Street really depends on the eventual shift of this route from Finch Station to the new Steeles Station, plus whatever transit priority/BRT scheme might be in the works for Steeles. Both of these are many years away.
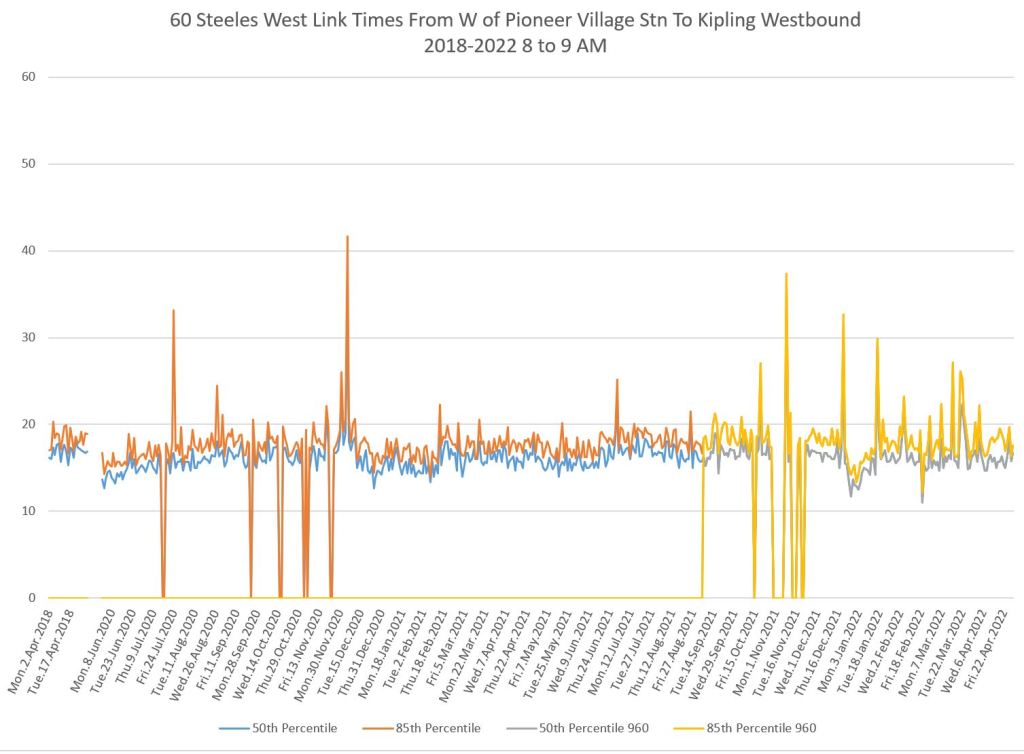
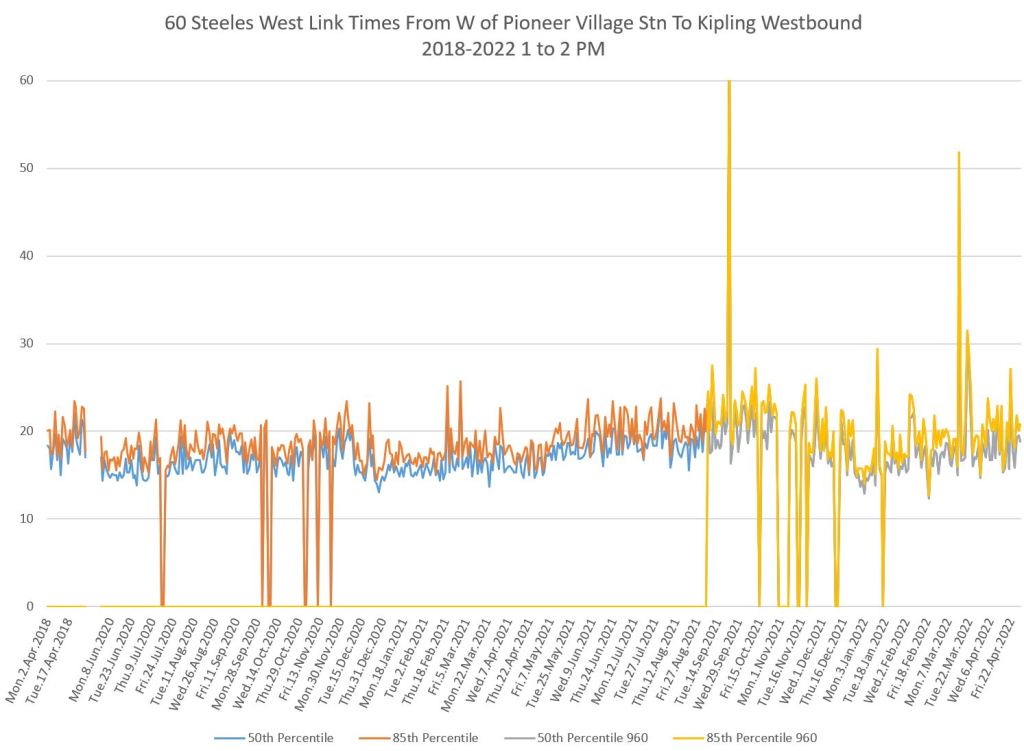
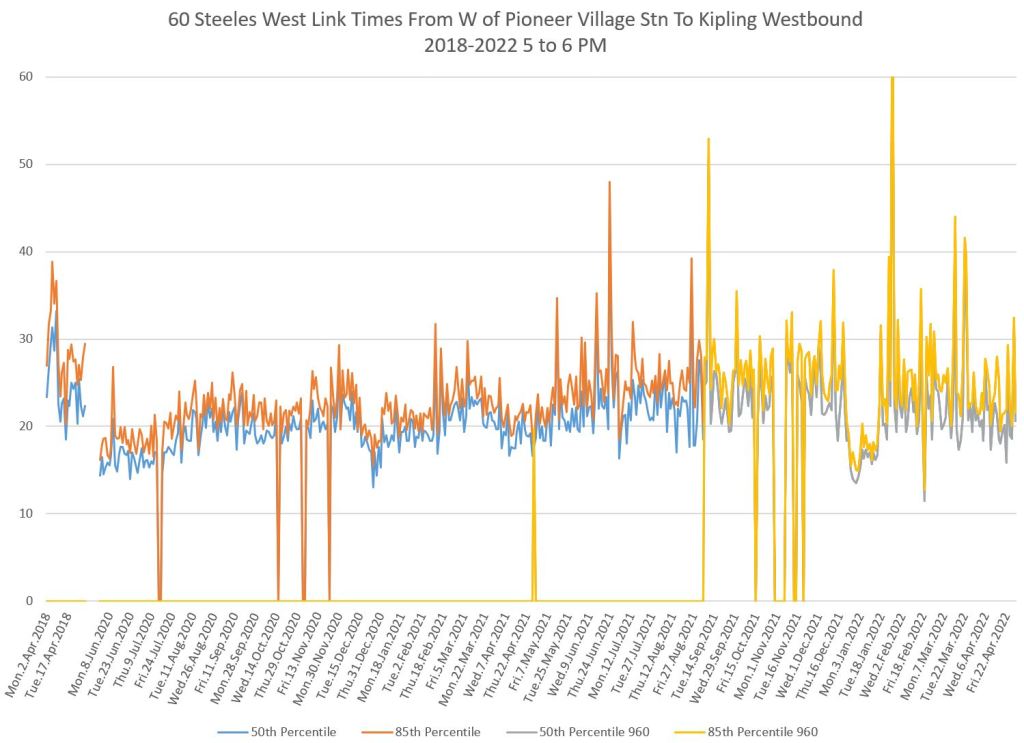
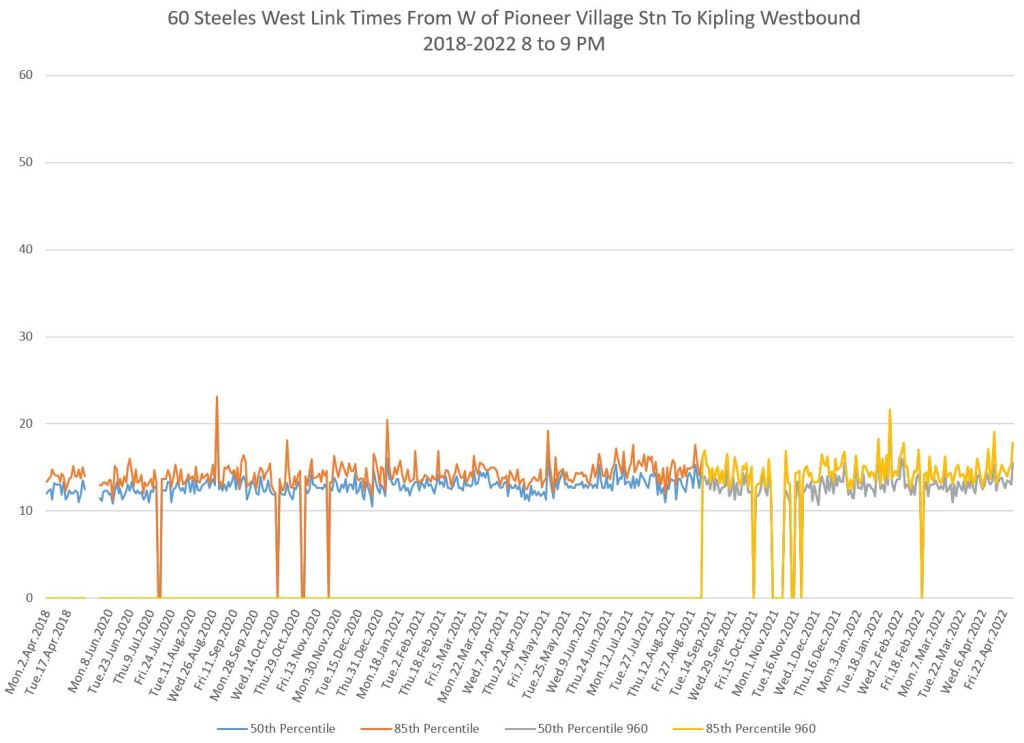
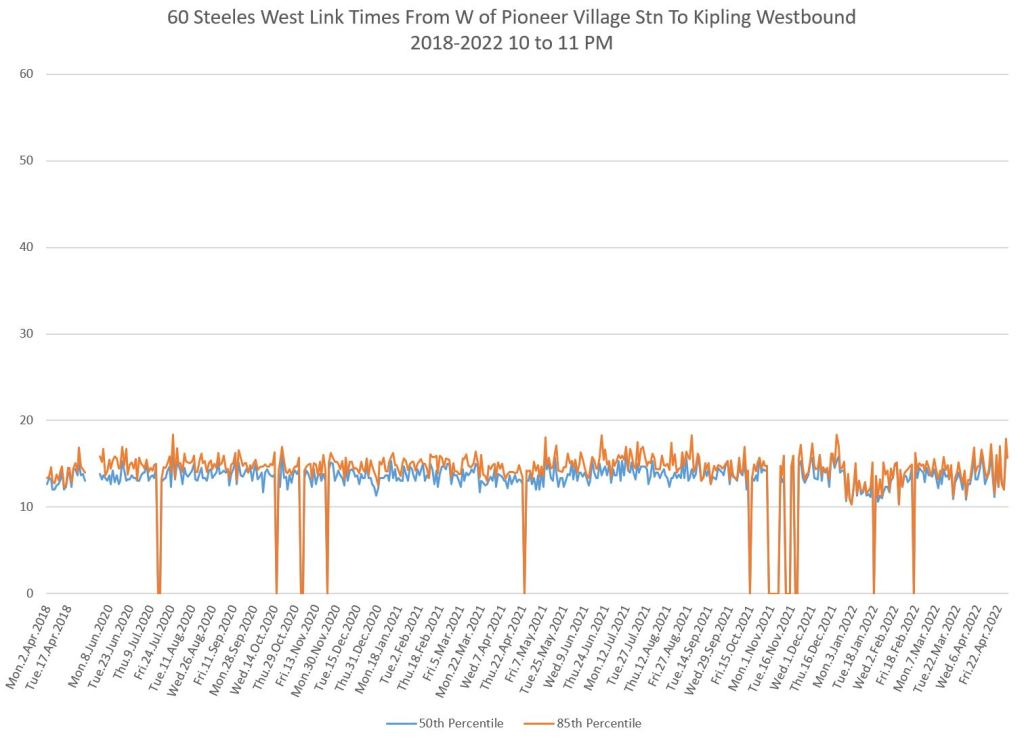
In the original list of possible RapidTO corridors, Steeles was only under consideration east of Pioneer Village Station where service is more frequent. However, it is west of that station where travel times are much more erratic and have grown beyond pre-pandemic levels in some periods.
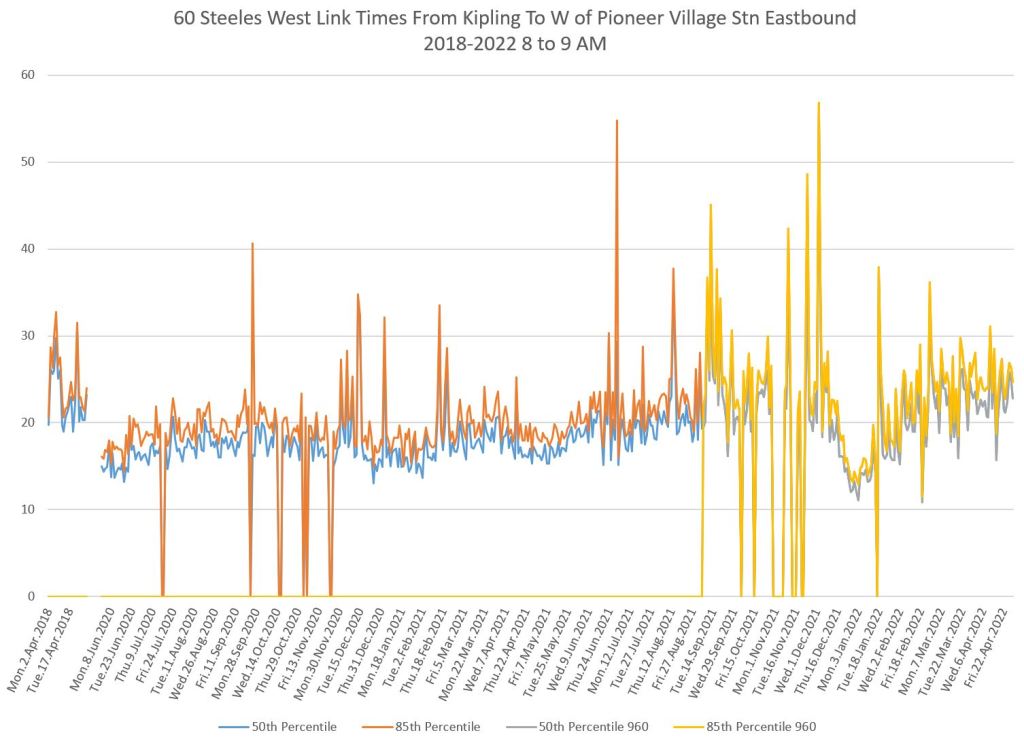
Note that from September 2021 onward, much service west of Pioneer Village Station was provided by the 960 Steeles West Express. In the charts for that segment, there is a colour change where the data for route 960 takes over from route 60.
Eastbound from Pioneer Village Station to Finch Station
Westbound from Finch Station to Pioneer Village Station
Eastbound from Kipling to Pioneer Village Station
Westbound from Pioneer Village Station to Kipling

Be interesting to see estimated run time and even more actual times. I *hope *the express routes prove both faster and more reliable. I’m not sure that will succeed.
Cheers, Andy
Steve: I have done separate comparisons of express and local services and will return to this in due course. The differences are not huge, and can be undone by the unpredictable wait for an express bus rather than just taking the first thing that shows up. An issue for any BRT design especially with really dedicated lanes will be how express buses will pass the locals.
LikeLike
Traffic along Steeles west of Jane in both directions is significantly worse than it used to be, I think it its mostly down the the LRT construction along Finch, it made me change my travel route rather than being stuck on the 84C therefore I assume a lot of drivers did the same. It would be interesting to see trip times for the 84C especially in the afternoon as the traffic is backed up way down Arrow. Is it impacting vehicles coming out of the Arrow garage getting to where they need to be? I’m home in the UK for the next couple of weeks and hoping that the situation on Arrow at Finch will have improved. I will be having a ride on the new Elizabeth Line (Crossrail) when I head to London for a couple of days before returning.
Steve: I have not been tracking the 84 Sheppard and its branches at the same level of detail as some other routes and will have to look at how it is behaving. Thanks for flagging this.
LikeLike
Your information on the 35 JANE is only between Eglinton and Pioneer Village Station. Likely because once Line 5 opens, the 35 JANE will be split into two. The 35 JANE will operate between Mount Dennis Station and Pioneer Village Station, the the new 27 JANE SOUTH will operate between Mount Dennis Station and Jane Station. Can expect some improvement to the 35 JANE, especially since the Mount Dennis garage is next door to the Mount Dennis Station.
The 29 DUFFERIN bus doesn’t look like it will be split. Odd that with the Wilson garage next door to the Wilson Station, they still have problems filling in supplementary buses on Dufferin.
Steve: My tracking has been for Eglinton to Steeles on Jane because that was the originally proposed transit priority corridor. The more numerous and extended corridors were added much later to the scope of the RapidTO project. I could easily run the numbers for the whole route, but stayed with the original segment for consistency with previous articles. Improved service, well, maybe, but the TTC is not flsh with spare cash for that sort of thing. Whether the line is right beside the garage or not makes little difference as you note for the Dufferin bus.
LikeLike
Do you see John Tory putting in political capital for a Jane street/Dufferin Road pilot like the King Street pilot? Or are the suburban councilors just not care enough to do so. After all, RapidTO is just the King street pilot brought to the suburbs.
Steve: First off, no, I don’t see this happening. But more important, RapidTO is most definitely not King Street brought to the suburbs. It is little more than a takeover of curb lanes over an extended area in many cases where complet street redesign for other, notably pedestrian, uses is very unlikely. Also, King Street through the core had the advantage of parallel streets to which traffic could divert, and as a streetcar line, the curb lane remains available for stopping and loading in some areas. The nature of the entertainment district is such that patios have a value, much as they do on The Danforth which does not even have a transit route.
One important thing we learned on King (at least those who were directly involved) is that you cannot just slap down a one-size-fits-all “solution”, but have to go block by block to evaluate the effect of a new layout. Another important lesson was that reliability of travel times contributed more than reduction in times to the overall quality of service on the route. I worry that in these times of tight budgets, red lanes will be portrayed as a money-saving measure to contain transit costs, and there will be little if any spending on service improvement.
LikeLike