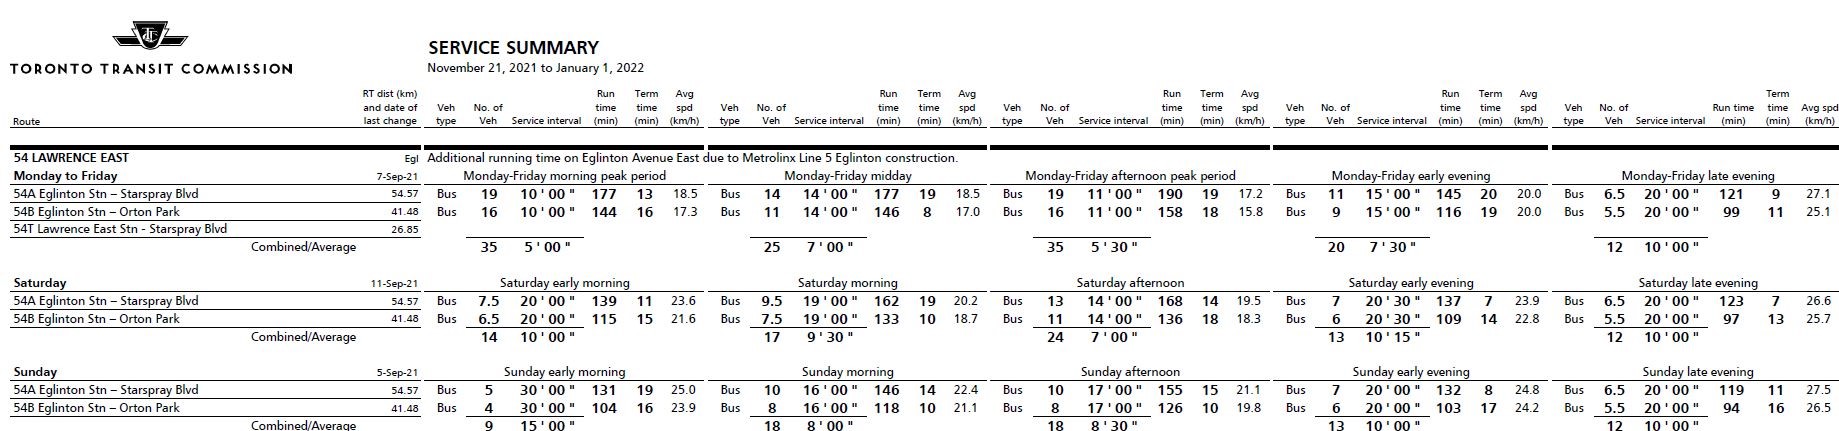
Service on Lawrence East is provided by two routes:
54 Lawrence East local service operates from Eglinton Station east via Eglinton and Leslie to Lawrence, then east to two destinations:
54A runs to Starspray Loop near the eastern boundary of Toronto.
54B runs to an on-street loop via Scarborough Golf Club Road, Brimorton Drive and Orton Park Road. The direction of this loop reverses after 3pm.
954 Lawrence East express service operates during peak periods between Lawrence East Station and Starspray Loop.
As part of a proposed route reorganization in Scarborough, the TTC proposed splitting off a separate Brimorton service, but this scheme is on hold.
Following opening of Line 5 Crosstown, the 54 and 954 services will be rerouted to Science Centre Station at Don Mills & Eglinton. As part of the RapidTO scheme, red lanes are proposed on Lawrence between Don Mills and Starspray Loop. This article reviews running service quality and travel times on three segments of the route:
Port Union to Midland: Port Union is used as a screen line at the east end of the route because buses lay over at various places and in both directions making measurements right at Starspray Loop unreliable. Midland is the western screen line because it is just east of Lawrence East Station where buses might layover for various periods unrelated to traffic conditions.
Kennedy to Victoria Park: Kennedy is the eastern screen line because it lies just west of Lawrence East Station. Victoria Park is the western screen line because this was the originally proposed western end of the red lanes.
Don Mills to VictoriaPark: This section was added to the red lane proposals.
The schedules for both the local and express services are unchanged since September 2021.
Note that as in previous articles, data are missing for some days at the end of October and through November due to the cyber-attack on TTC systems.
In Brief
As on other routes reviewed in this series, the distribution of actual headways is well beyond what is contemplated in schedules or even in the TTC’s Service Standards which aim to keep most service within a six-minute wide band of “on time” performance.
Bunching and wide gaps are very common, even on comparatively “quiet” days like weekends and holidays.
Severe congestion effects appear rarely and typically show up as bulges in average travel times for specific weeks and days pulling them away from normal levels.
Headways on the express service 954 can be quite variable and the range of values exceeds the typical 5-minute difference in travel times between local and express operation between Port Union and Midland.
Some improvement in service is possible with reserved transit lanes to make travel times more reliable, but this must be accompanied by dispatching service so that buses are regularly spaced.
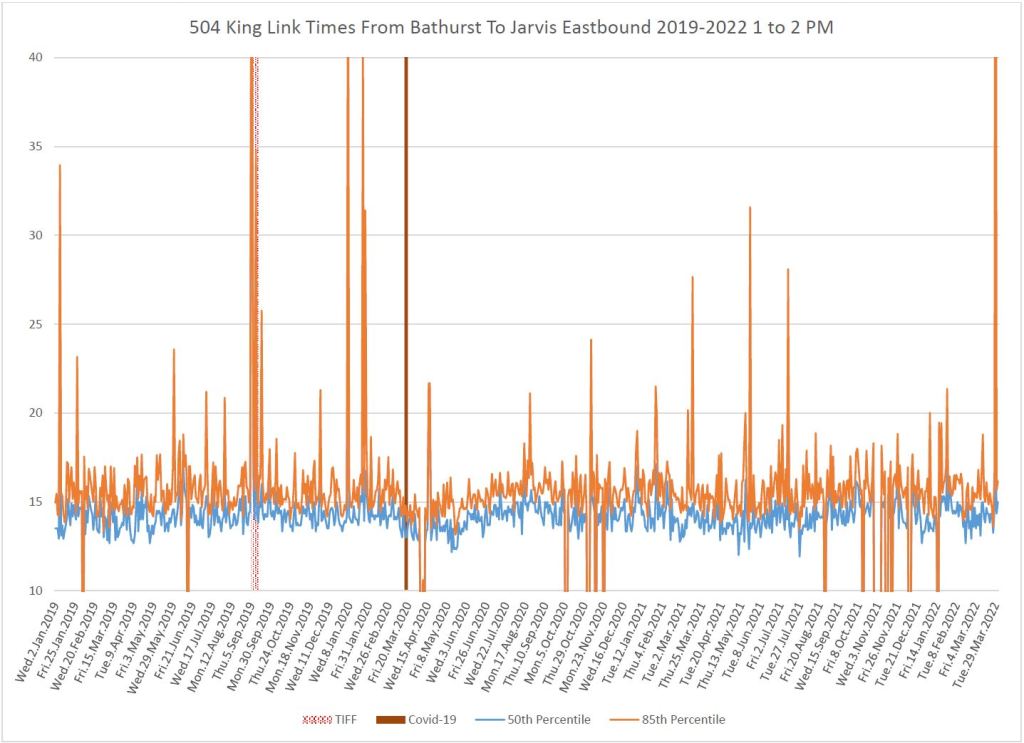
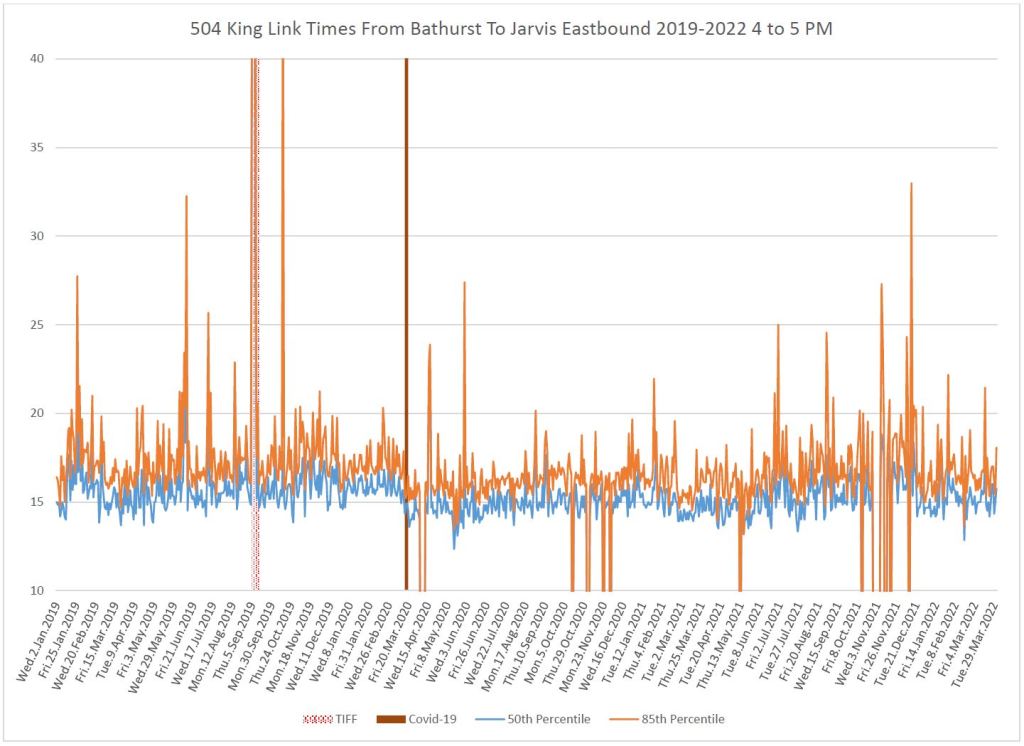
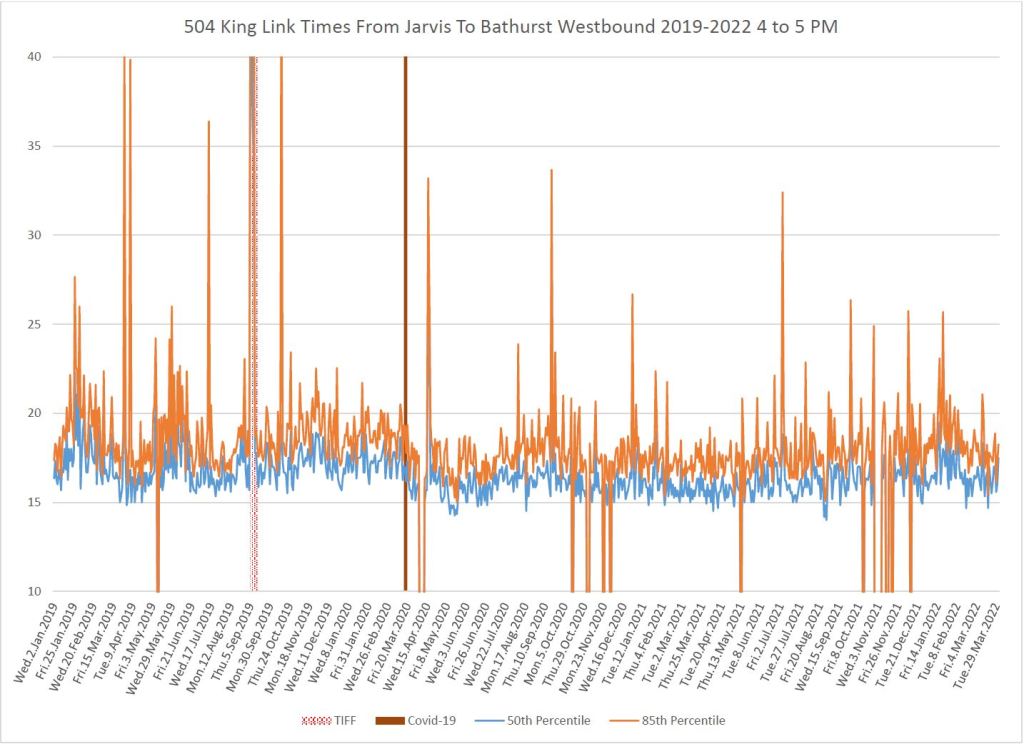
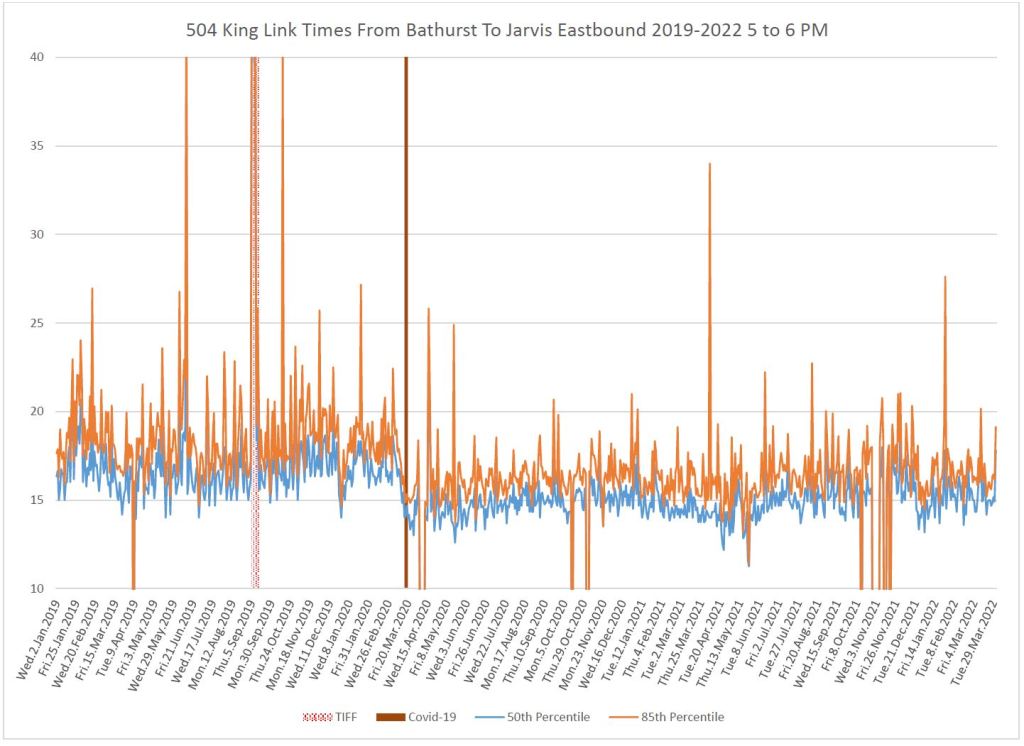
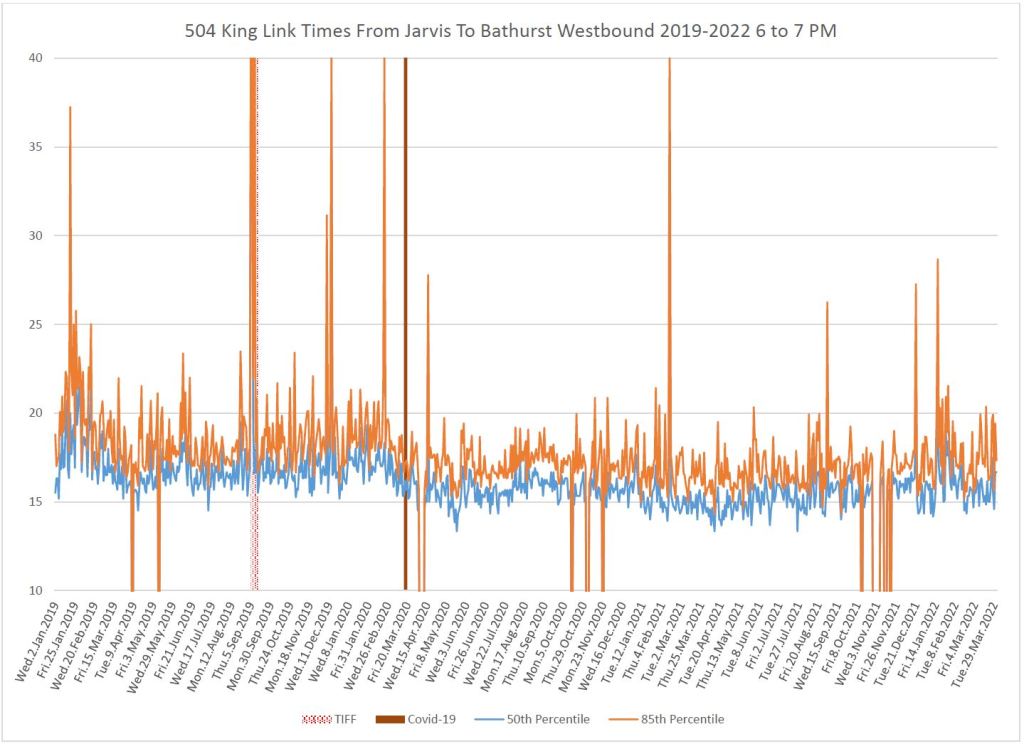
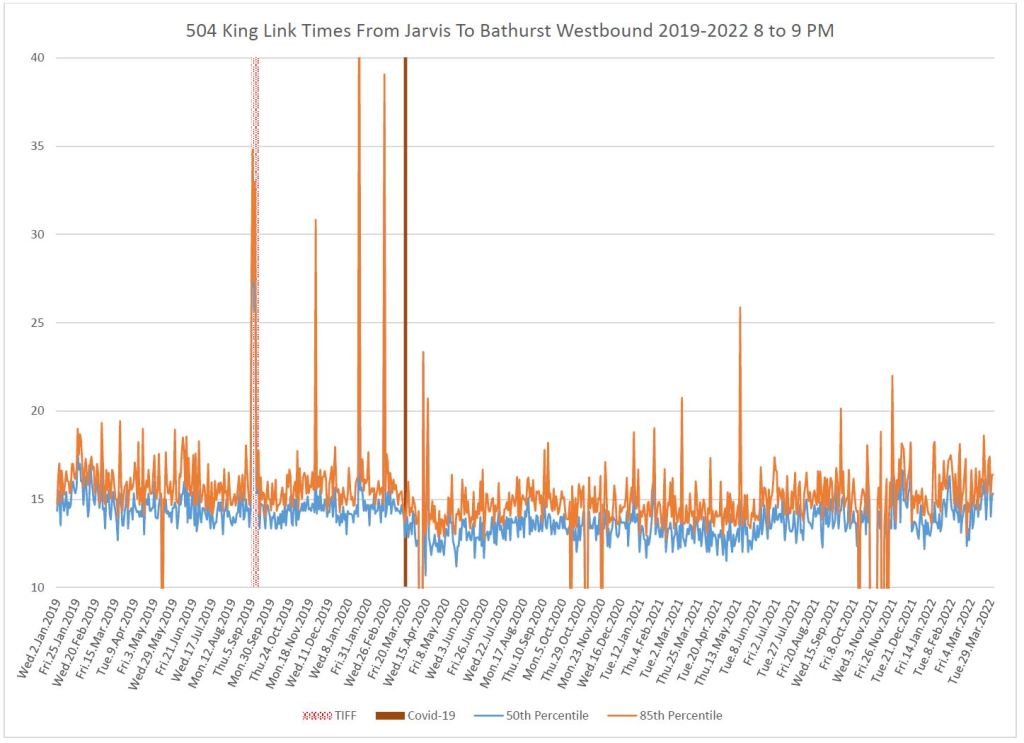
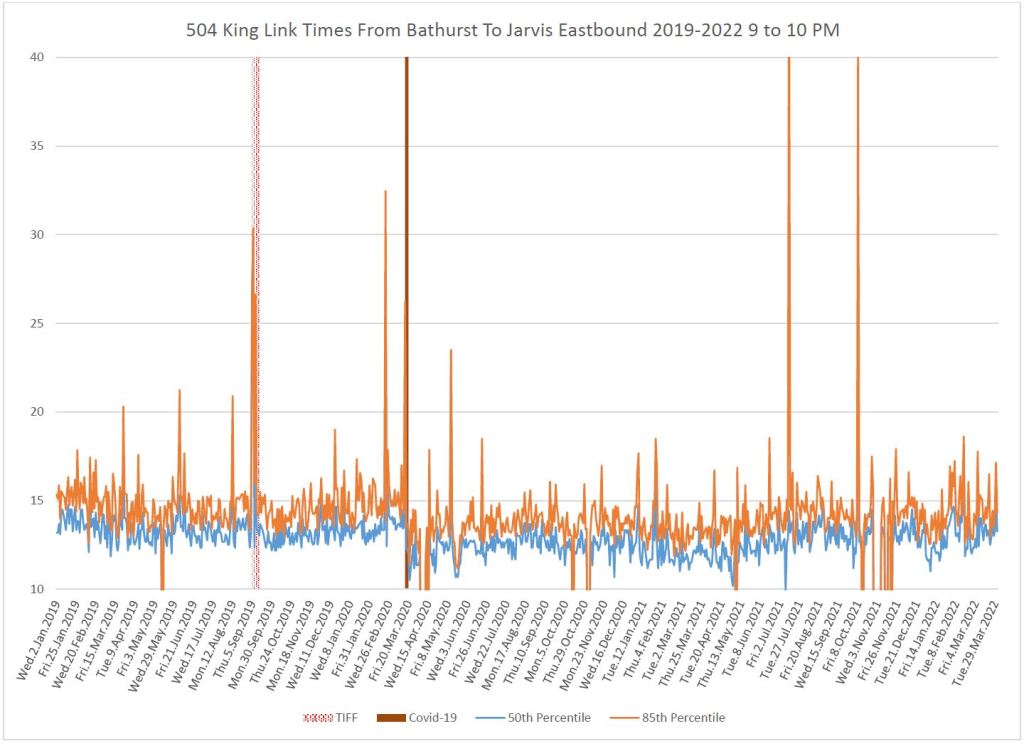
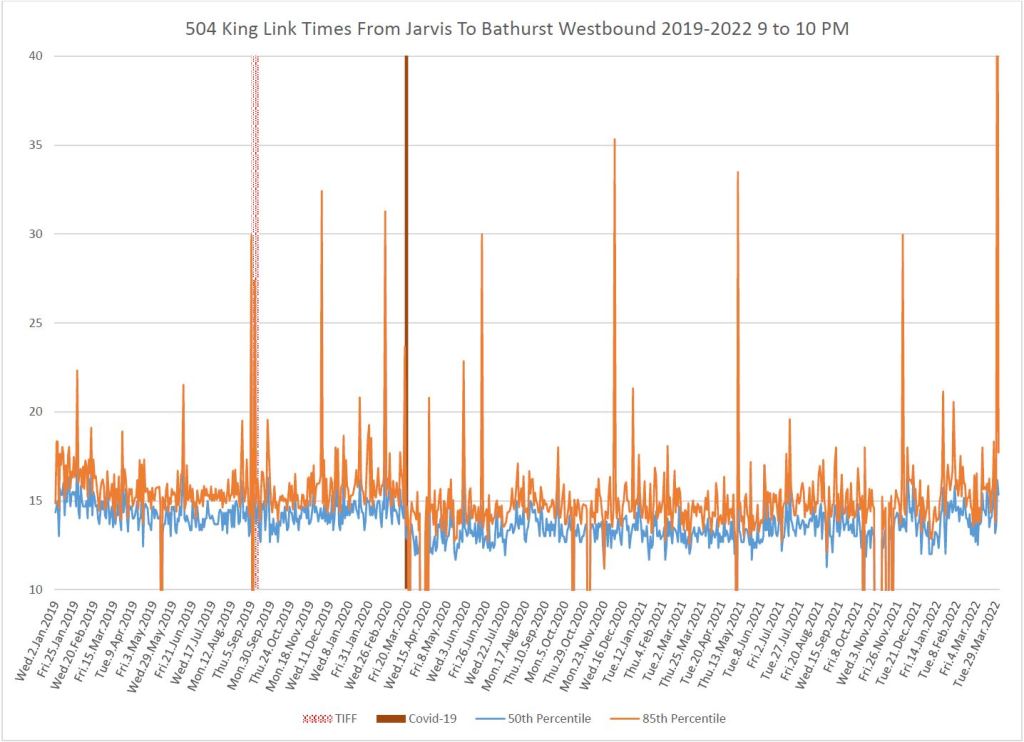
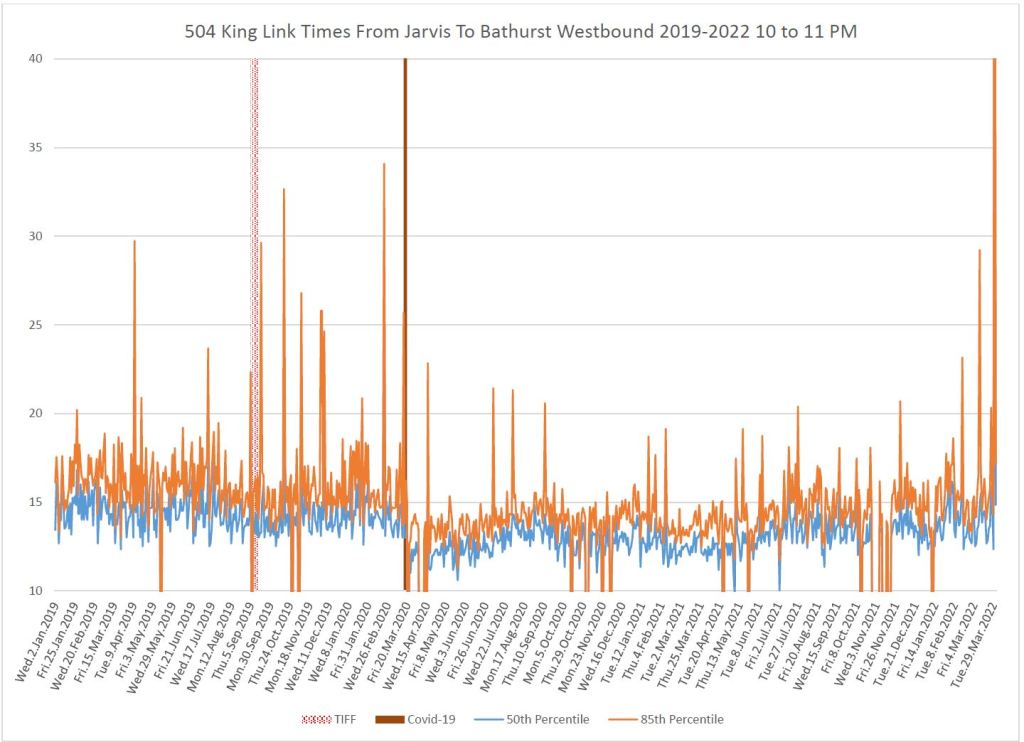
In previous articles, I have documented the benefits of the King Street transit priority corridor between Jarvis and Bathurst Streets. This had the combined effect of reducing travel times at certain times, but more importantly of providing greater regularity.
Since the covid-19 pandemic began, traffic downtown has been considerably quieter than before. This article updates the stats on the priority corridor to show the period from immediately before the pandemic to the end of March 2022.
The changes in travel time in mid-March 2020 when a state of emergency was declared are quite evident, although to varying degrees by time of day and direction. The brown vertical lines in the charts mark this point.
The charts below are arranged with eastbound times in the left column, and westbound times in the right showing averages for various hours of the day beginning with the AM peak and running into the mid-evening.
In some periods that saw a drop in March 2020, travel times have not changed much over the past two years. Small changes are evident in early 2022, notably in the times for evening trips westbound where entertainment district traffic typically affects streetcar service, but not to the degree of pre-March 2020.
Comparable data for some suburban bus routes tell a very different story with a recovery to or beyond pre-pandemic travel times through 2020 and 2021. I will review several routes in a future article, and will return to King Street in fall 2022.
Note: Data in these charts include only vehicles on route 504 although the segment between Jarvis and Bathurst has been shared by other routes from time to time.
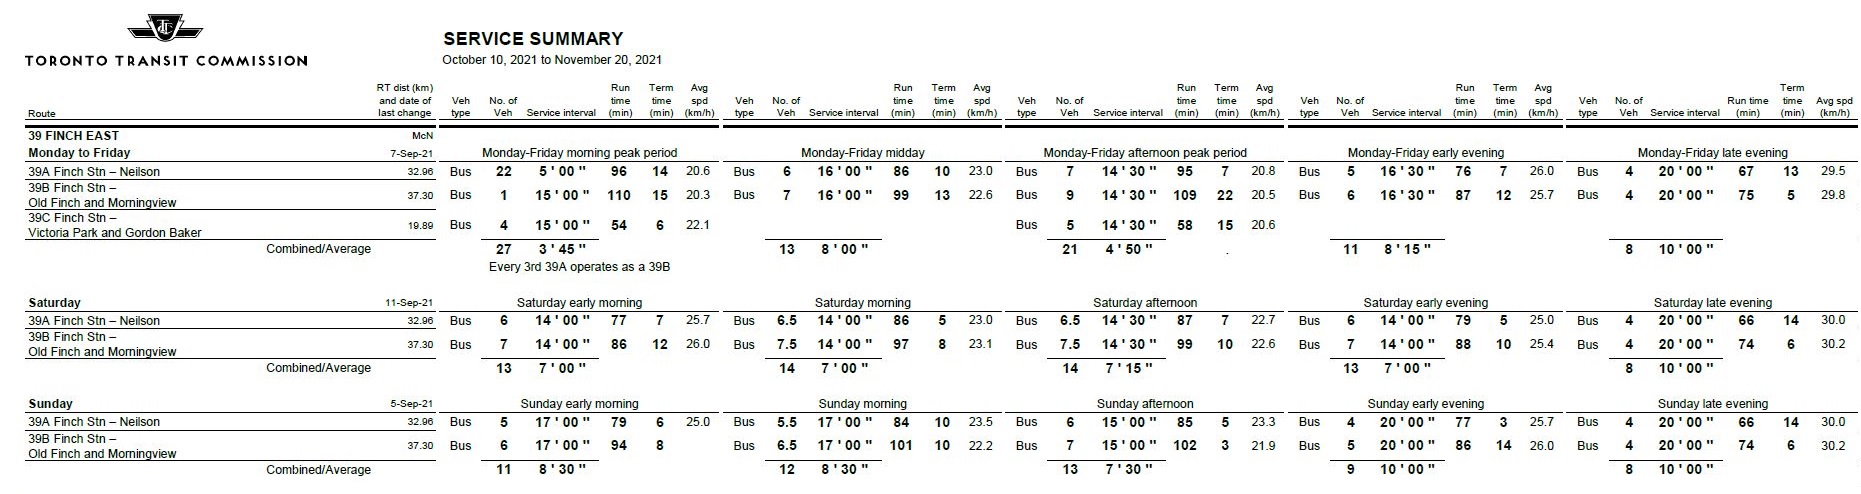
Route 39 Finch East operates from Finch Station with three branches:
39A to Neilson Road
39B to Morningview Trail
39C to Victoria Park & Gordon Baker Road (peak only)
The schedule was unchanged through the October-December 2021 period.
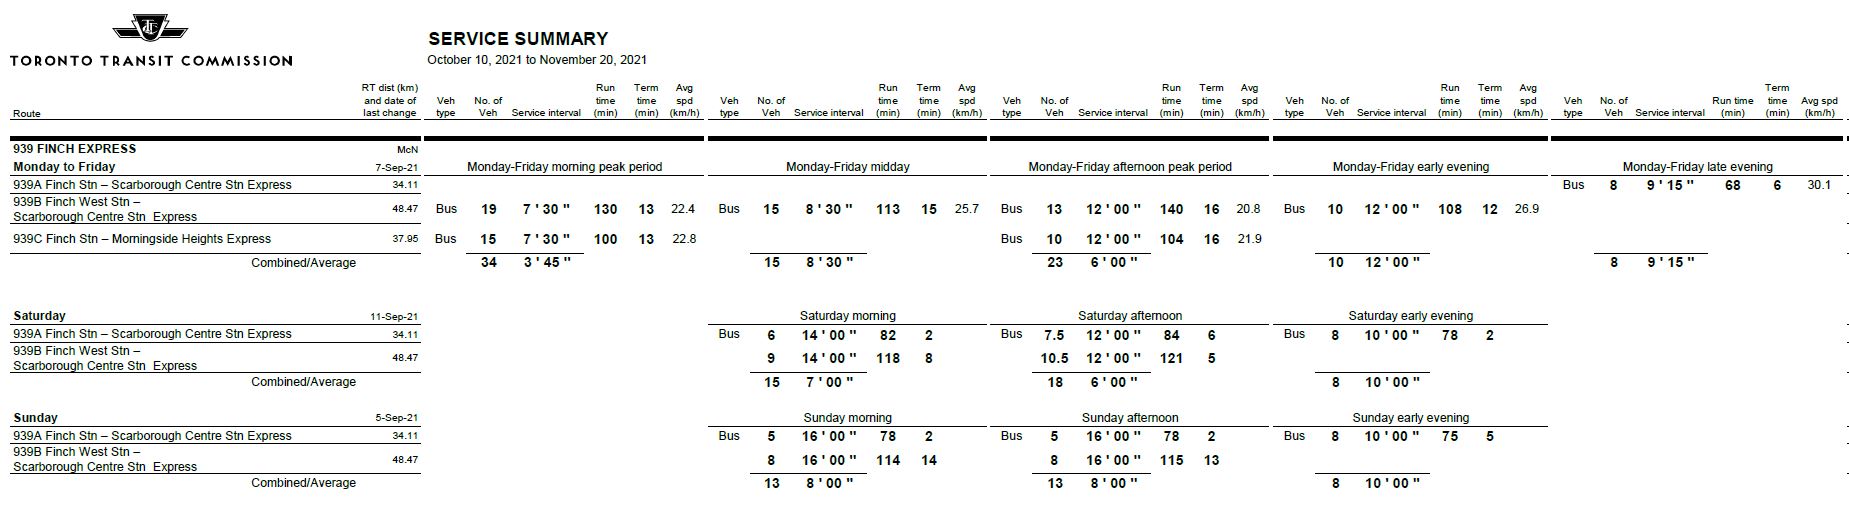
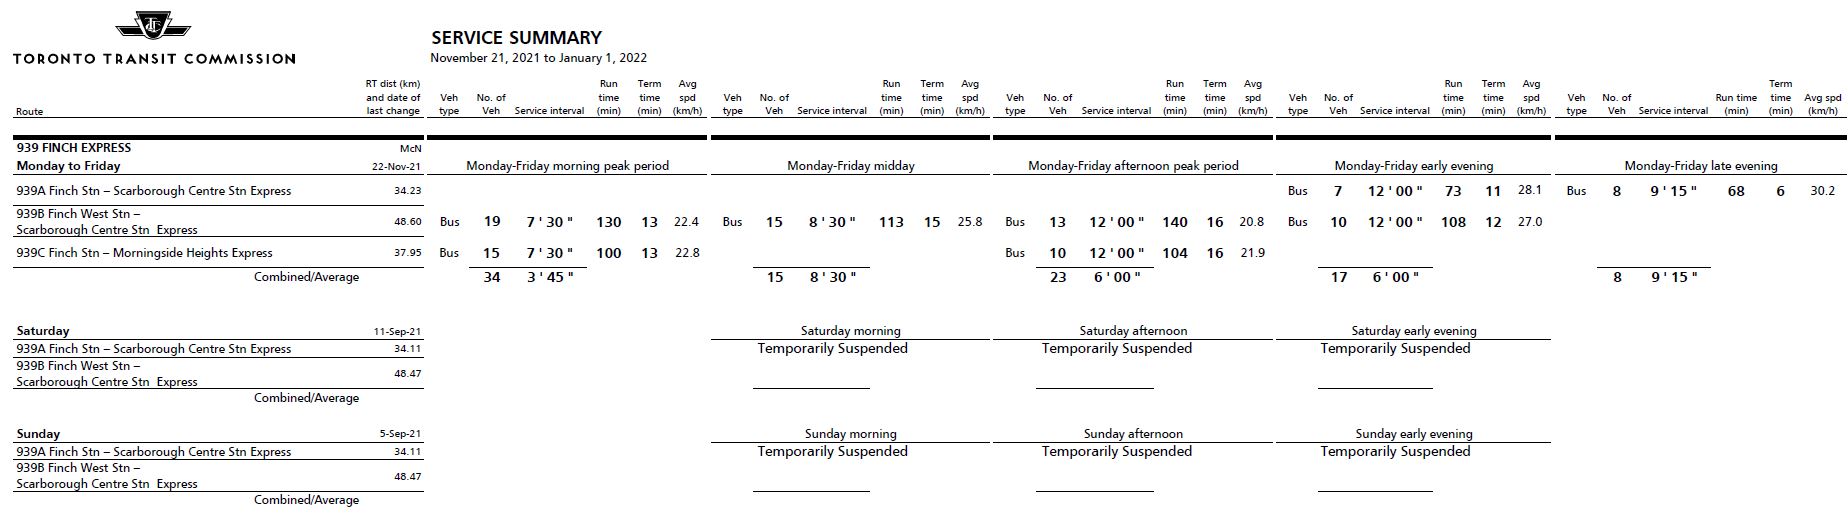
Route 939 Finch Express operates between Finch West Station and Staines Road with three variations. Service east of McCowan serves all stops, while for the section west to Yonge the 939s run express.
939B operates from Finch West Station to Scarborough Town Centre Station weekdays until mid evening, when it becomes the 939A and terminates at Finch Station.
939C operates only during peak periods between Finch Station and Morningside Heights.
On weekends until November 20, the service was split between the A and B branches as shown below. This operation was suspended on November 21 as part of the fall 2021 cutbacks. There was no compensating change in the local service, and the weekend service has not yet been restored.
Weekday early evening service was improved by the addition of 939A service on November 22.
The Finch corridor is among those proposed for “red lane” treatment in the RapidTO program between Yonge and McCowan.
The scheduled headways on the 39 and 939 routes would not blend even if they kept to their schedules, and so this analysis looks at each route on its own.
As with the previous article on the York Mills service, there is data missing from the period immediately after the cyber attack on the TTC in late October and into early November. However, this does not prevent analysis of the overall pattern of service.
In Brief
Erratic headways are common on both the local and express services. These generally result from bunching in terminal departures or at route merge points, not from pervasive traffic congestion.
During the period reviewed here, missing buses appeared to be rare, and they fell generally in the latter weeks of the year. There does not appear to be an effort to space service to allow for the missing bus, and rather a double-headway travels across the route where the absent bus should be.
Average travel times over the proposed “red lane” section of the route between Finch Station and McCowan differ by about five minutes for local and express services.
Where there are congestion effects, they tend to last for a few days or weeks at a location, and then disappear. This implies that they are caused by short-term factors such as construction projects rather than being inherent to traffic patterns on the street. This has implications for red lane operations because there is no single location where transit priority will “fix” a long-standing problem.
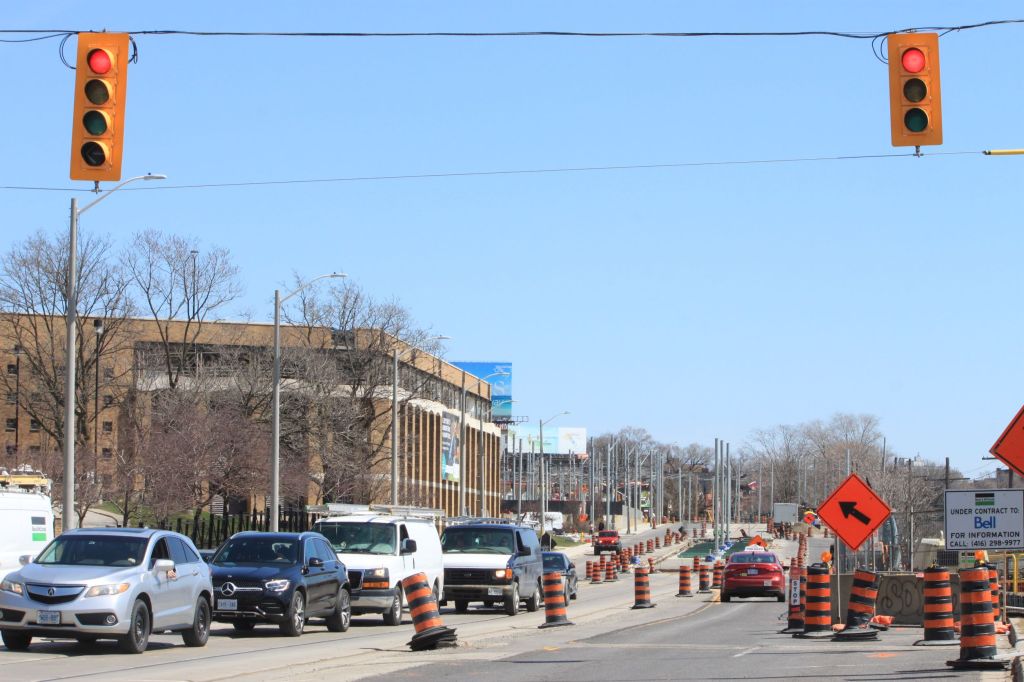
Work on the reconstruction and reconfiguration of the King-Queen-Queensway-Roncesvalles (KQQR) intersection and approaches to it resumed in April after a winter hiatus. Work has also begun at Dundas West Station for the reconstuction and realignment of the streetcar loading platforms.
King-Queen-Queensway-Roncesvalles
April 4, 2022
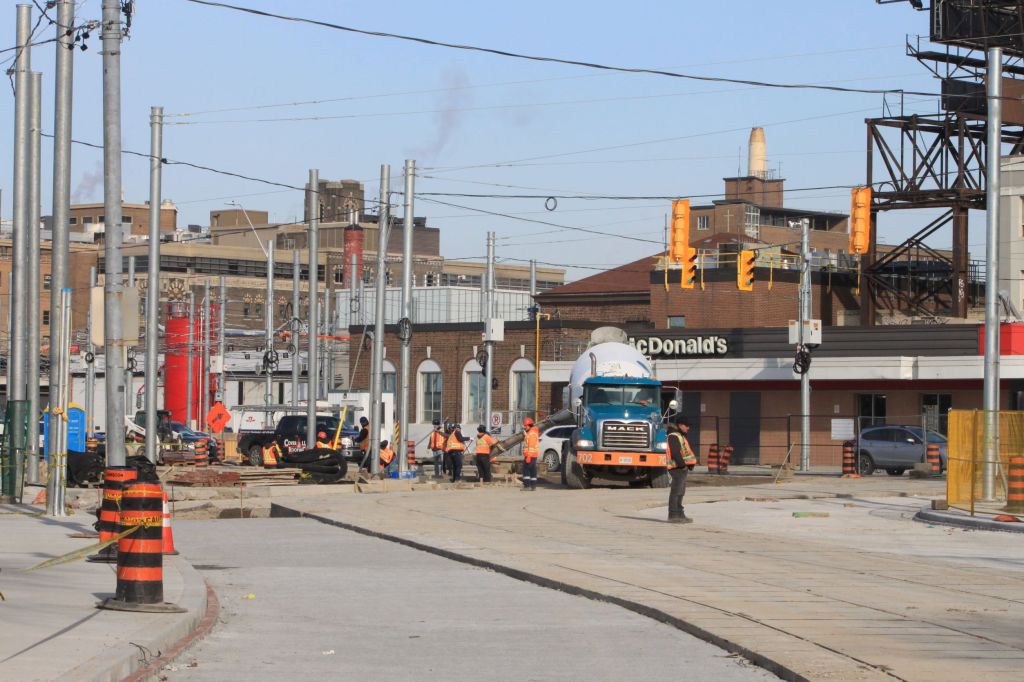
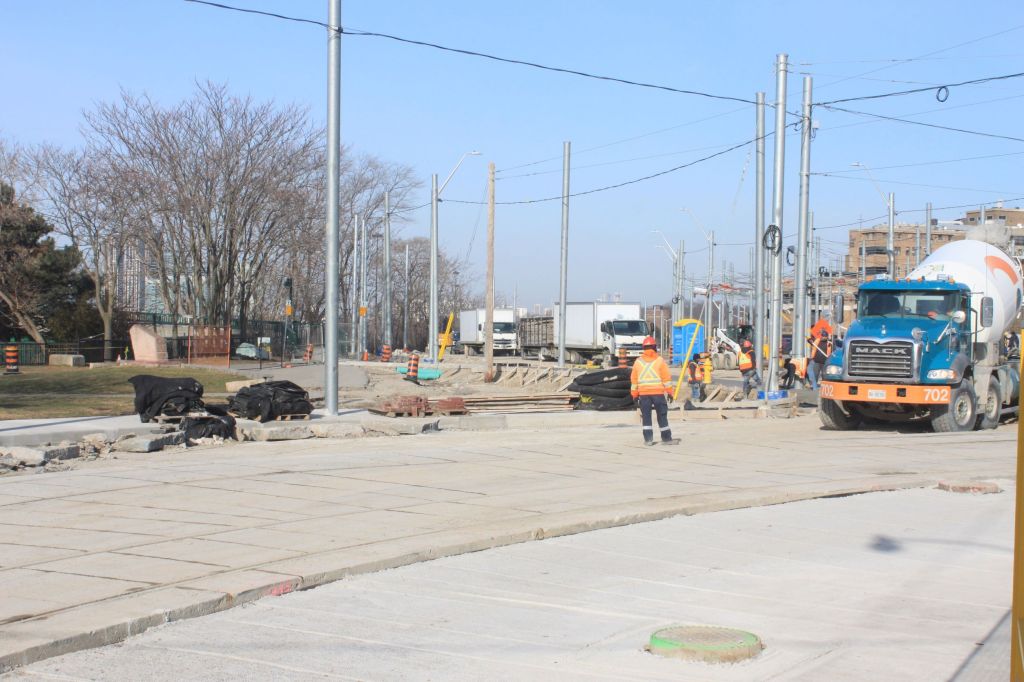
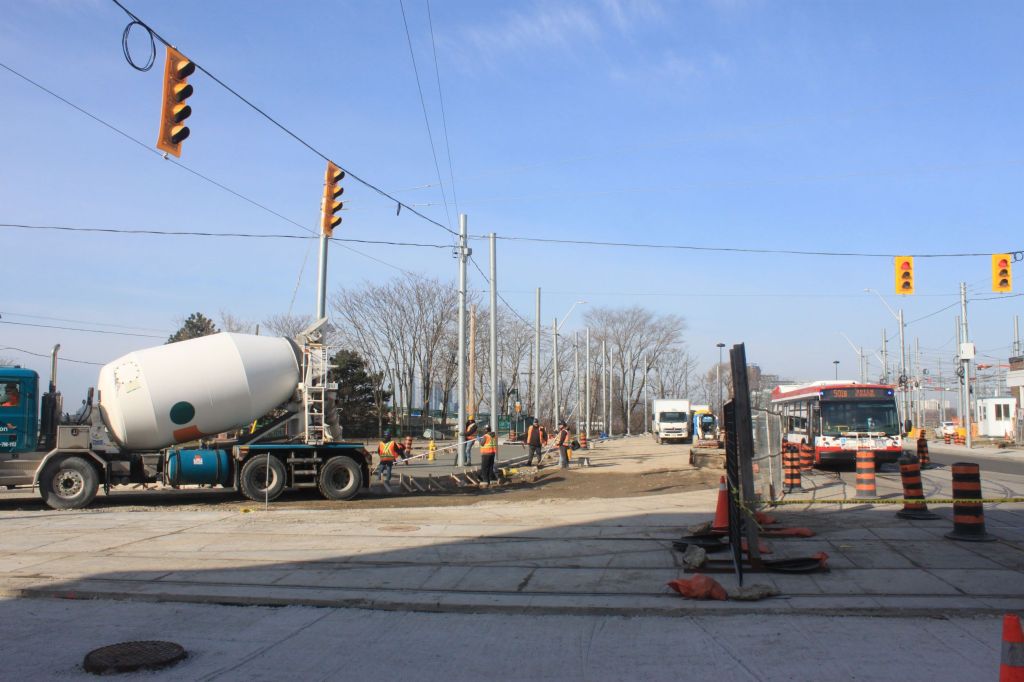
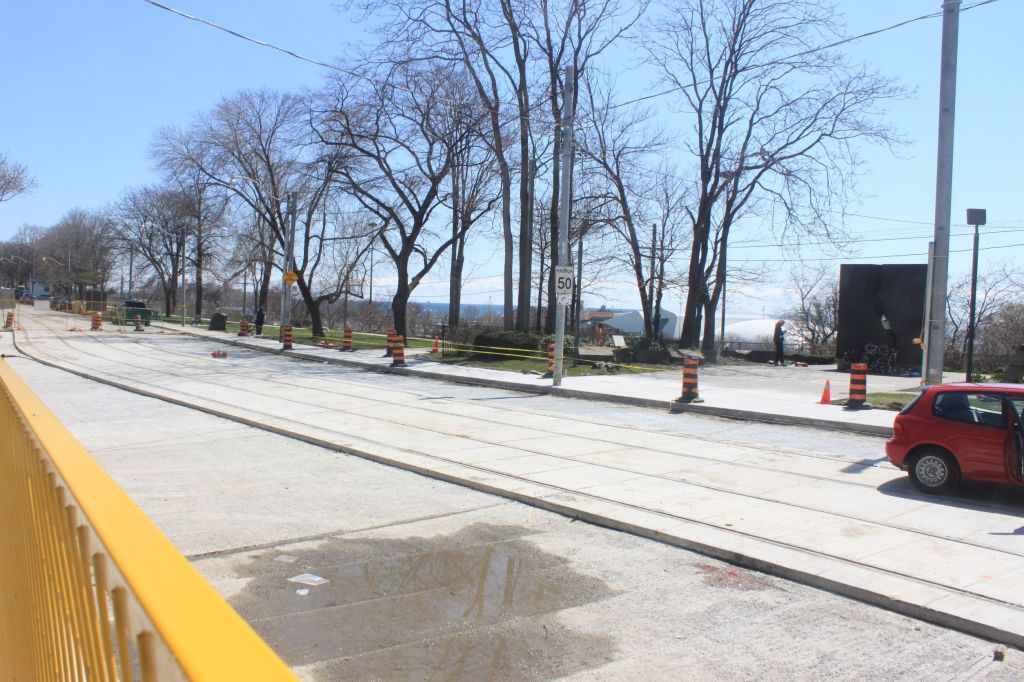
A significant change at KQQR is the removal of the “slip lane” which allowed eastbound traffic on The Queensway to “slip” past the intersection onto King Street without stopping. However, this created a safety hazard for pedestrians trying to reach the south sidewalk and the bridge to Sunnyside Park. The first four photos below show the construction of the revised junction from various points of view.
The fifth photo looks west on The Queensway at Sunnyside showing early stages of converting the mix-traffic streetcar lanes to a right-of-way matching what is already in place from Parkside westward.
Looking NW on King to The QueenswayLooking W across King at The QueenswayLooking W along The Queensway across KingLooking SE to King from The QueenswayLooking W on The Queensway at Sunnyside
April 20, 2022
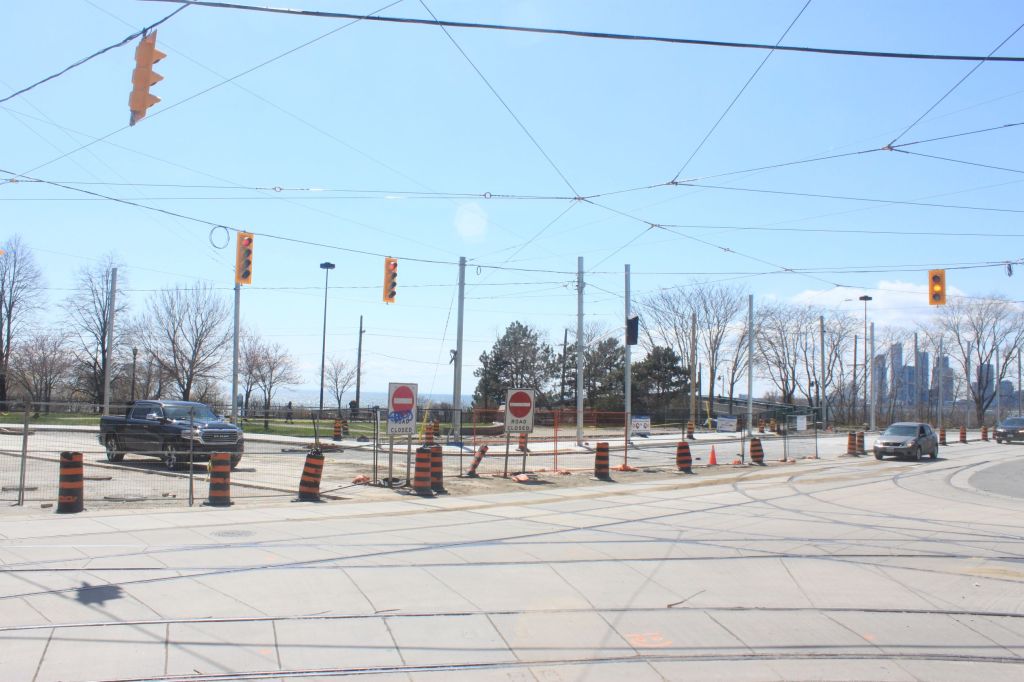
By April 20, two weeks later than the photos above, work had progressed to complete the new south sidewalk and to concrete all of the King Street approach. That leg now awaits the asphalt top layer.
In the view SW across the intesection there is a mixture of permanent and temporary poles and signals, as well as the beginning of the spiderweb that will hold up new overhead for the junction. Some of the new traffic signals have been hung, but they are hooded or faced away from traffic pending the changeover from the temporary ones.
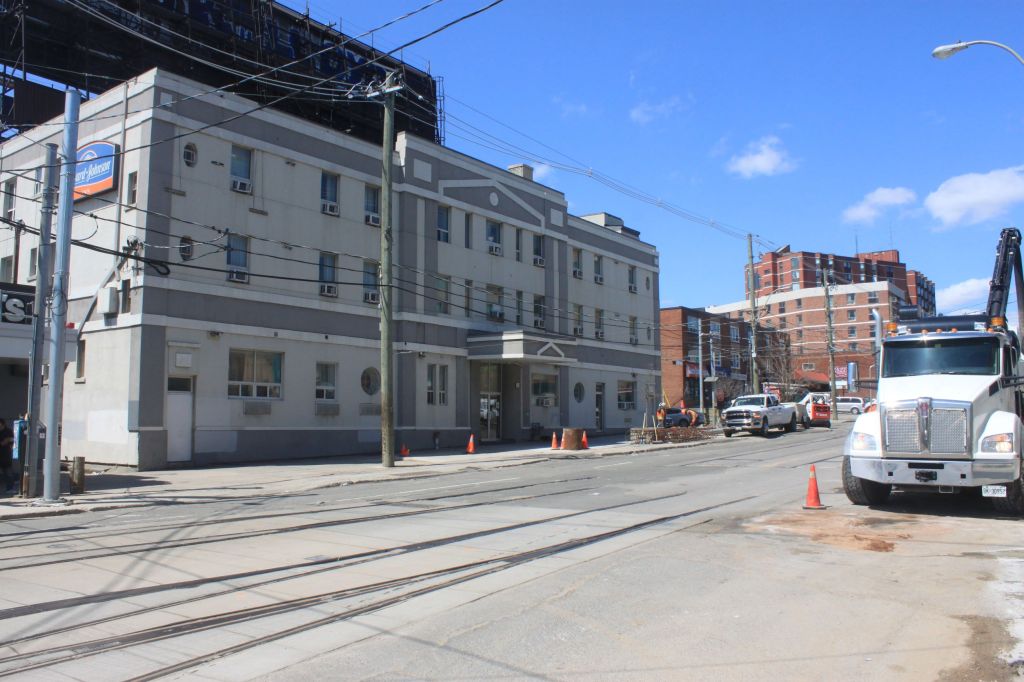
On both sides of Roncesvalles north of Queen/Queensway, work has begin on bases for new overhead poles.
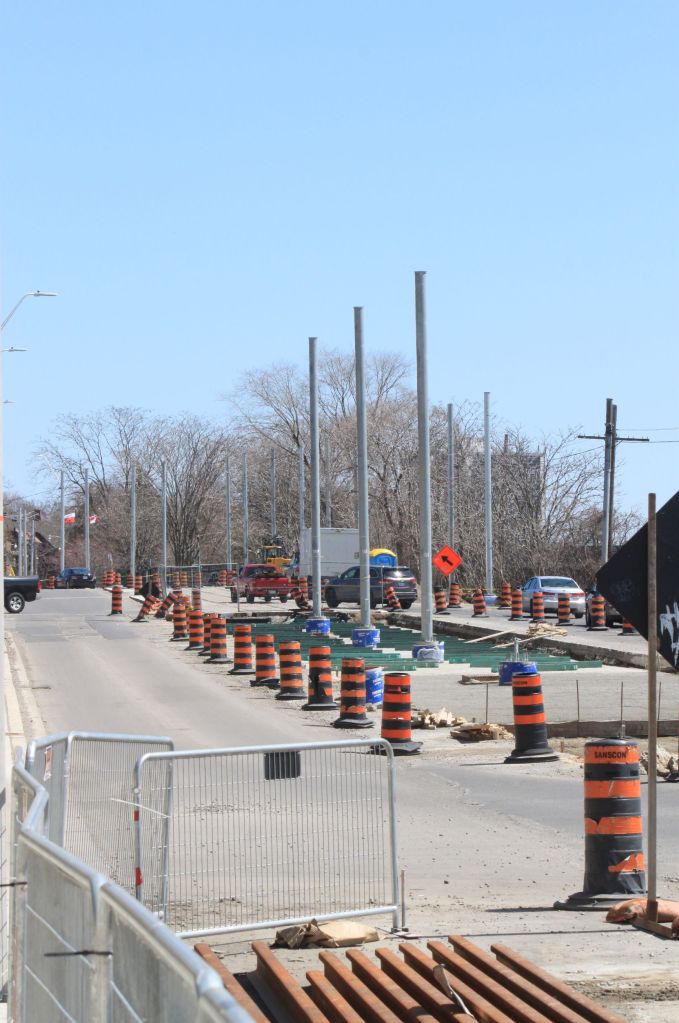
West of Sunnyside, work has begun on track installation, but this will be done in stages as road traffic is shuffled around between old and new lanes. In the eventual configuration, the streetcar lanes will be reserved and protected with a curb east to Roncesvalles except where needed for lane crossings.
The TTC has not yet announced a date for resumption of streetcar service to Sunnyside on King and on Queen, nor further west on The Queensway to Humber and Long Branch.
Looking E on King StreetLooking W across King to The QueenswayLooking SW across KQQRRoncesvalles N of The Queensway (former Edgewater Hotel)Looking E on The Queensway toward Sunnyside (N side)Looking E on The Queensway from Glendale (S side)The original right-of-way west of Claude has been used as a staging area for construction materials.
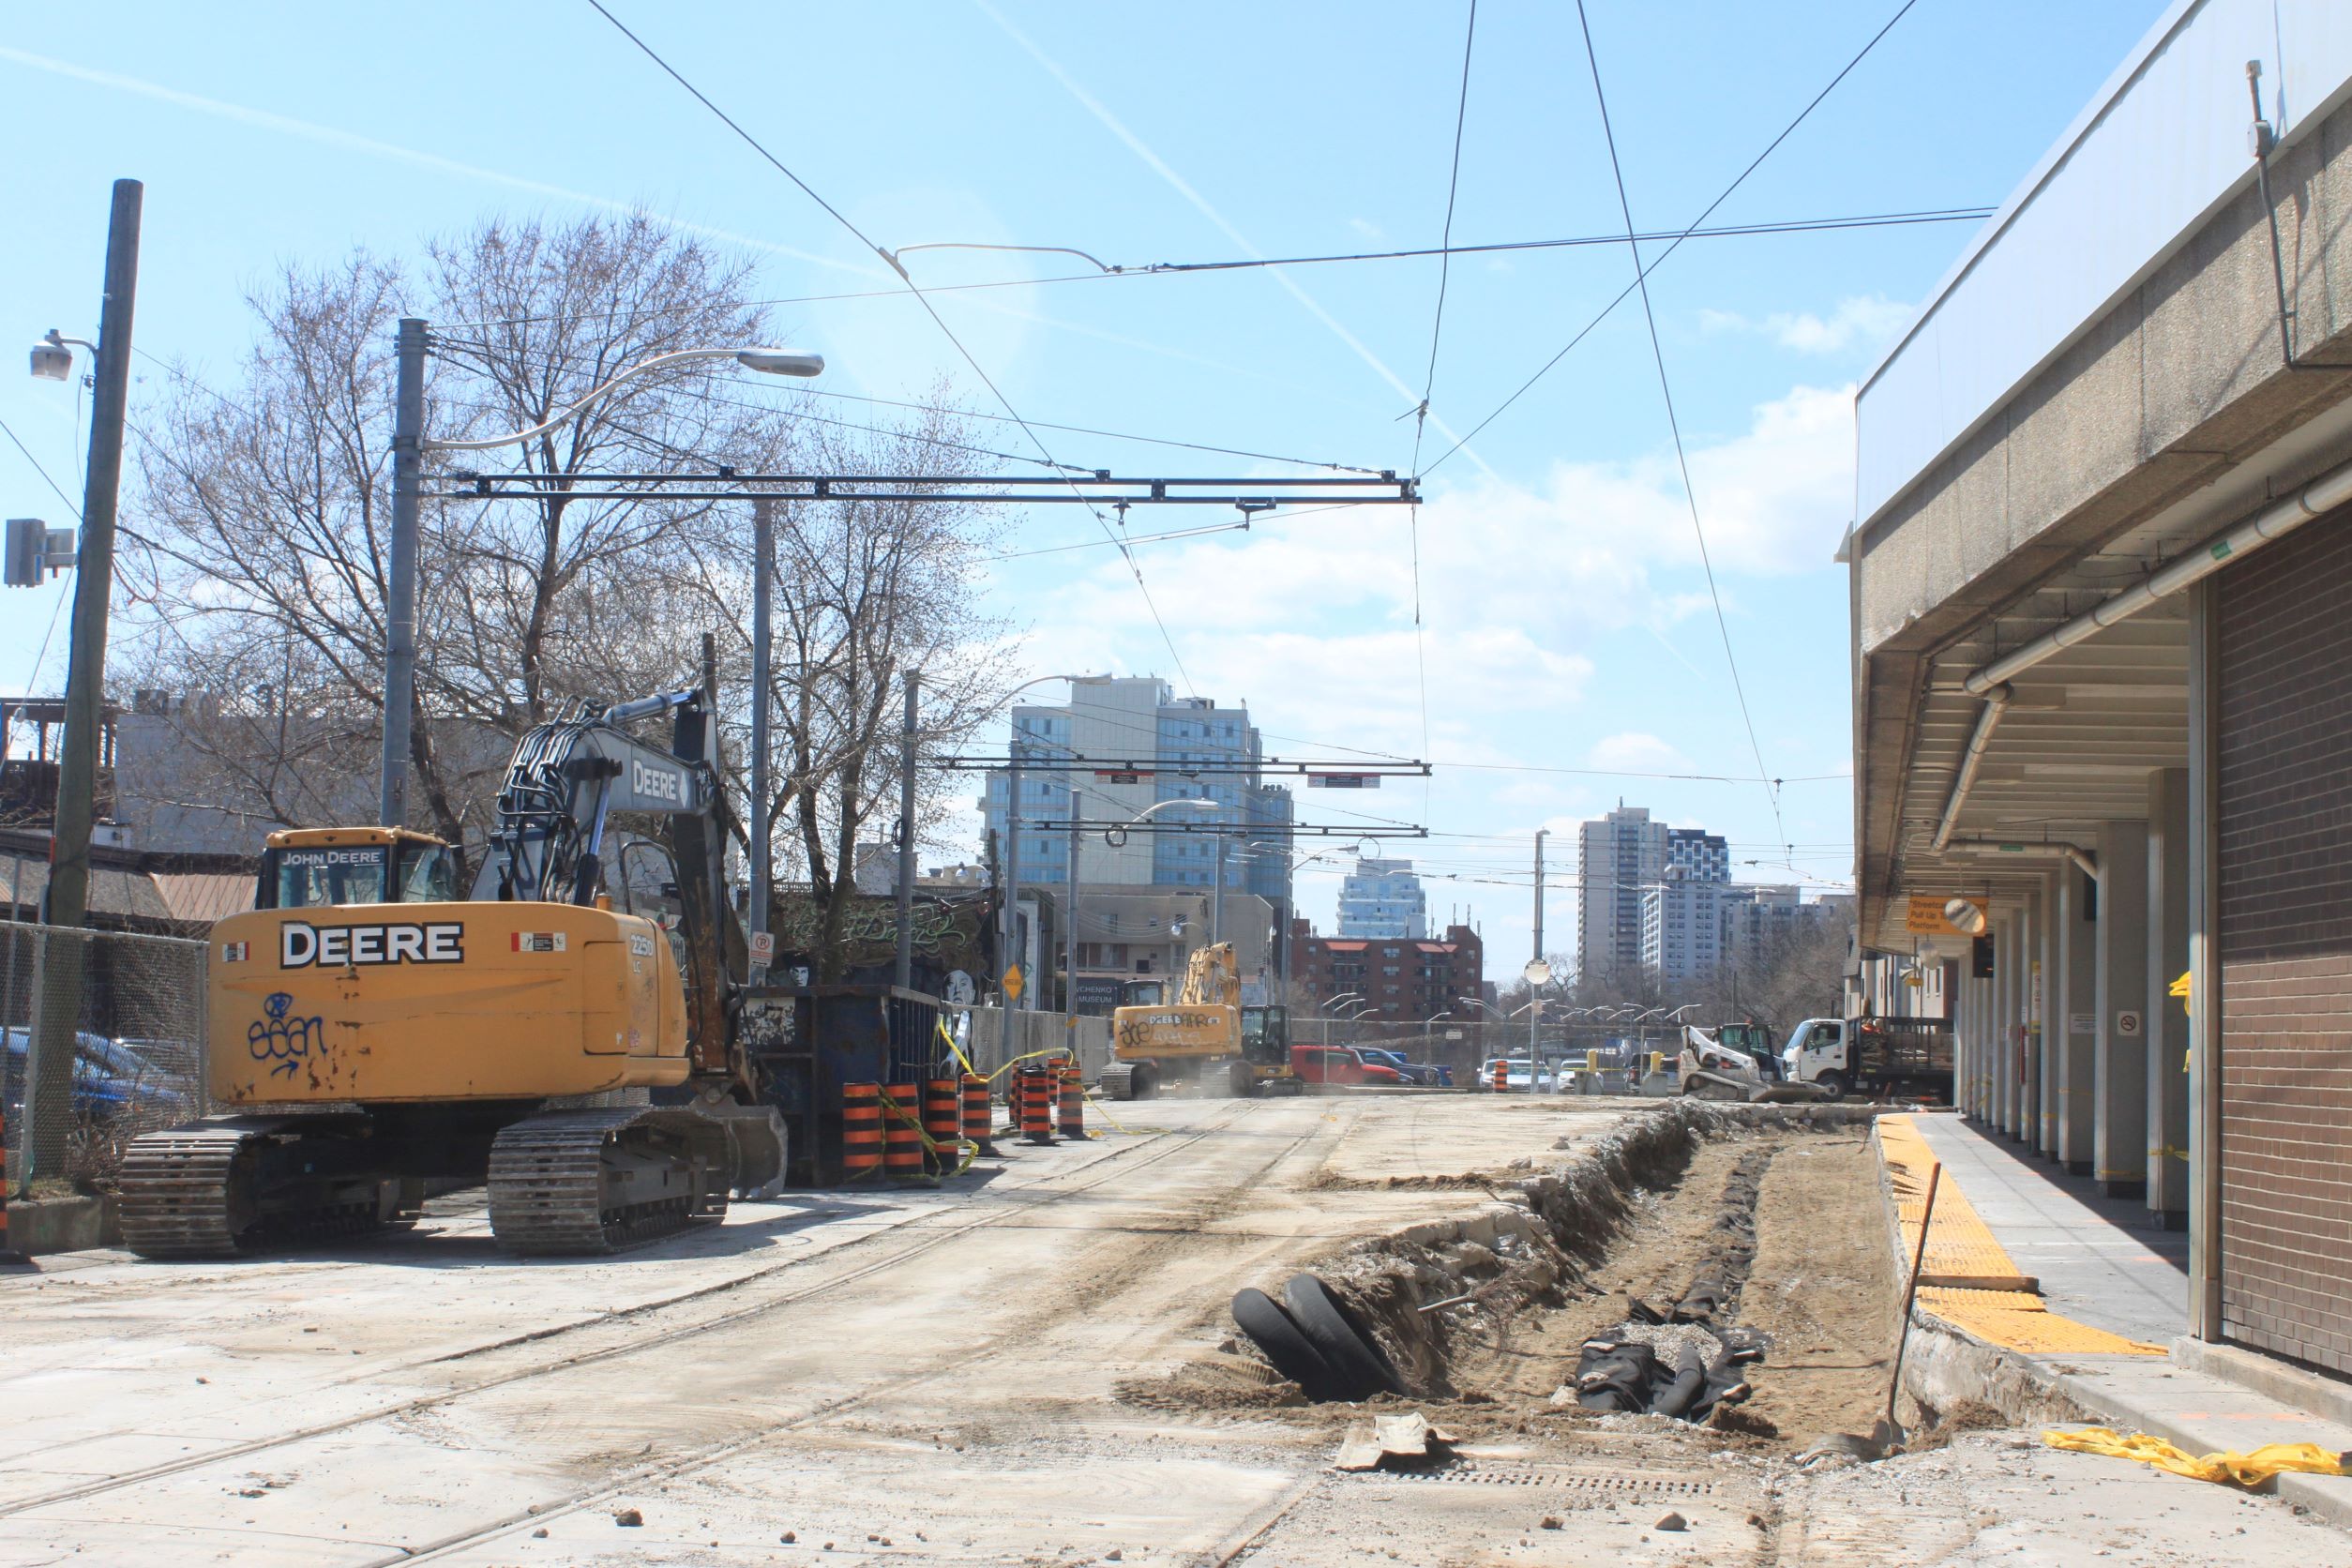
Dundas West Station
The existing King streetcar track has been demolished and excavated for a new foundation. Track for the Dundas cars will be shifted and a new longer loading platform will be provided here.
Looking W through Dundas West Station streetcar loading area
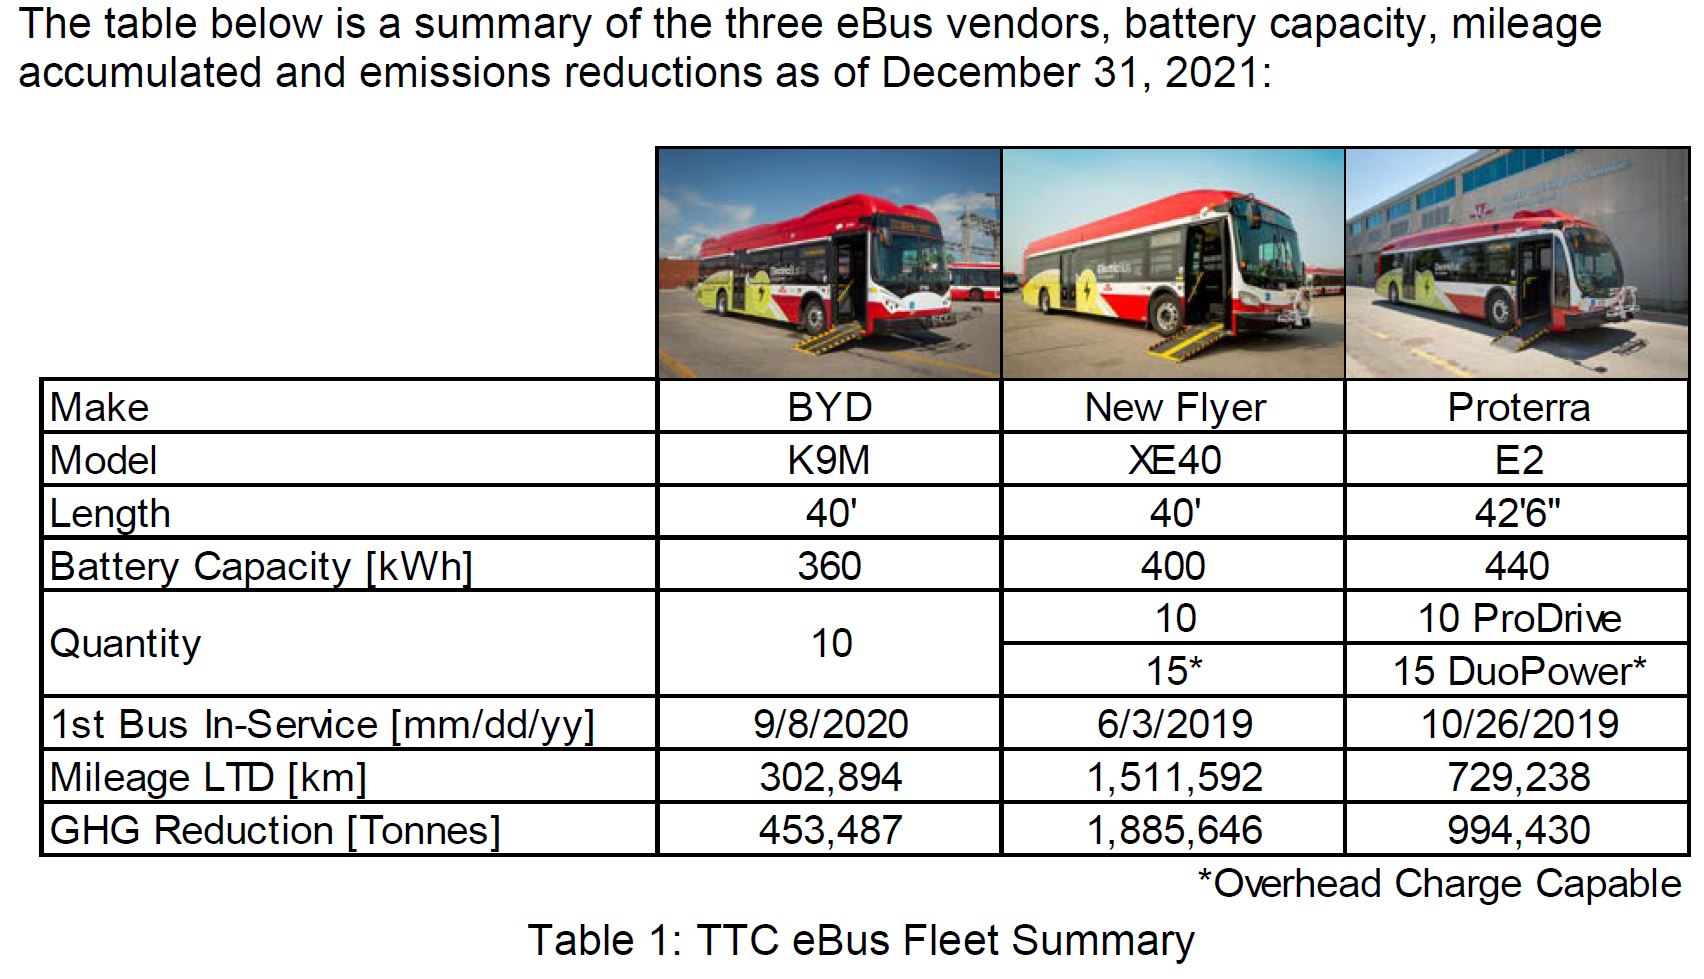
In a comment on my article TTC eBus Study: Final Results, an alert reader noted that the claimed GHG reduction from the new fleet was vastly out of proportion. Here is the TTC’s chart from that report and accompanying text (highlighing added).
The TTC’s first 60 eBuses were procured from BYD, NFI and Proterra. Prior to the delivery of these eBuses, three garages (Arrow Rd, Mt Dennis and Eglinton Garages) were retrofitted with depot charging systems to accommodate charging up to 25 eBuses per location. All 60 eBuses procured have now been in-service between one to 2.5 years at the TTC with more than 2.5 million kilometres driven, and have reduced GHG emissions by 3.3 million metric tonnes.
TTC Report at p. 14
The basic problem here is the claim that for every kilometre travelled by an eBus rather than by a diesel bus, the saving would be over 1 Tonne of GHG. In the paragraph above, the saving should be 3.3 thousand metric tonnes, not 3.3 million. Who knows how many times this erroneous number will be cited.
The basic numbers are summarized in one paragraph on page 97 of the report:
GHG Reduction
The greenhouse gases (GHG) reduction is primarily due to the avoidance of diesel fuel consumption. At an average fuel economy of 0.53 l/km, the TTC’s Nova clean diesel buses release 1.4 kg of CO2 per kilometre driven. The generation of electricity also creates emissions through many factors including direct emissions from fuel-fired power plants. For Ontario, the average CO2 emission for base load power is 32 g/kWh. The eBus fleet in 2021 averaged 1.62 kW/km (including all non-operating energy consumption sources), which equates to emissions of 0.05 kg CO2/km. Based on the fleet mileage of 1,555,174 km in 2021, emissions associated with the electricity supply are 80.8 Tons CO2. An equivalent clean diesel bus fleet would have emitted 2,177 Tons of CO2.
Note: The highlighted value should be 1.62 kWh/km. This is a typo in the TTC’s original text.
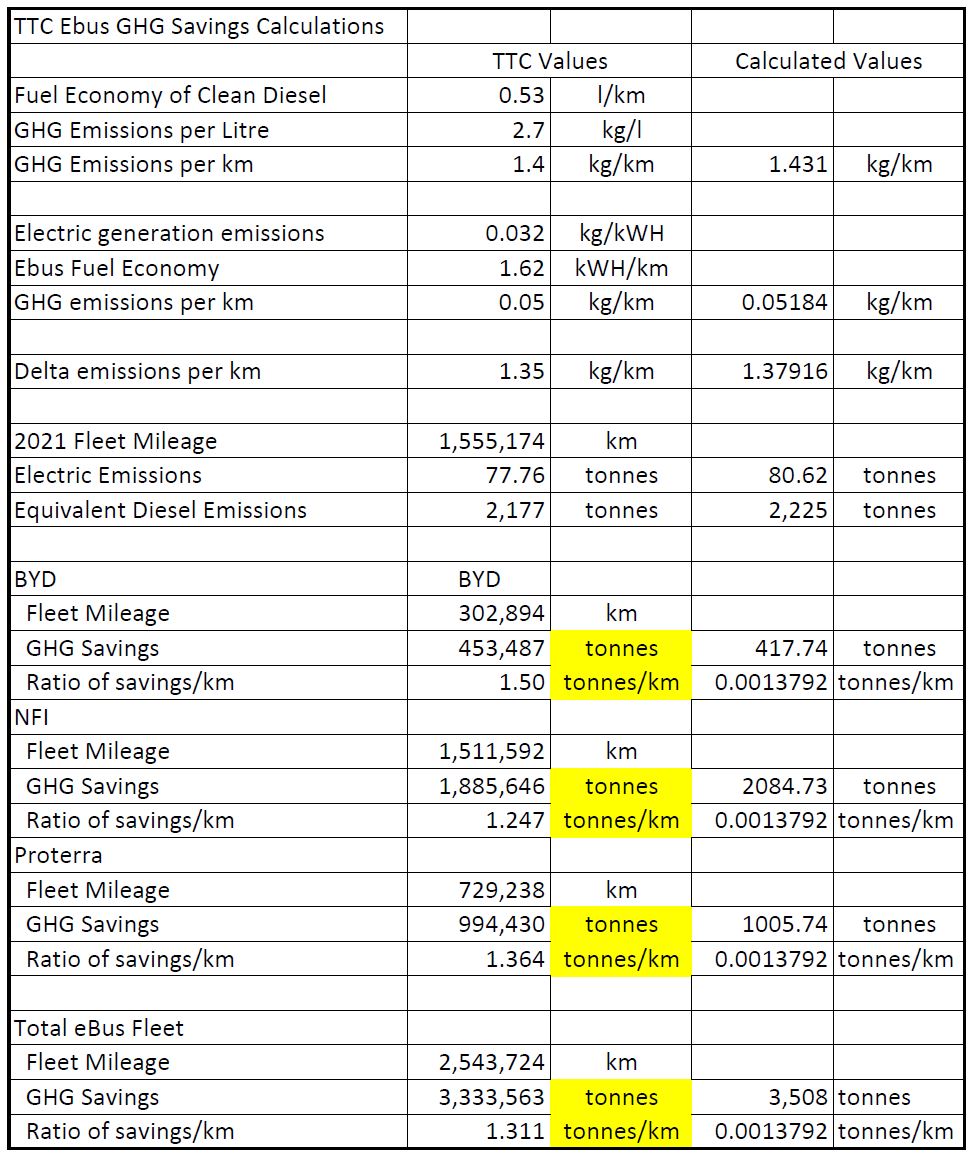
Running the Numbers
To save readers from working through these numbers, here they are consolidated as a spreadsheet.
The table below compares the TTC’s cited numbers with calculated values. Where a value is calculated, I have not rounded it as in the TTC’s descriptive text. For example, the GHG emissions per km for eBuses is shown as 0.05184 rather than 0.05 kg/km. Cells highlighted in yellow have the wrong units, but this is what the TTC specified in its chart.
The problem here is that the line “GHG Savings” claimed is erroneously stated in Tonnes (1,000 kg) rather than in kilos making the numbers 1,000 times bigger than they actually are.
This has the absurd effect of making the “saving” per kilometre over 1 tonne when the diesel fuel we start with weighs less than 1 kg.
I checked with the TTC, and, yes, the chart is wrong. It should specify savings in kilos, not in tonnes.
The calculated emission savings are obtained by multiplying the “delta” value (difference in emissions by fuel source) by the reported fleet mileages. The claimed values are taken from the TTC’s chart above.
There is a further problem that the ratio of claimed GHG savings to distance operated varies from one vendor to another. There is no explanation for this although the report does cite different fuel consumption rates for each manufacturer’s bus.
Although I have asked, the TTC has not explained why these values are different.
Clean Diesels vs Hybrids as a Reference
There is a further issue with the numbers published by the TTC. They are based on a comparison with “clean diesels” even though some of the vehicles to be replaced include the first generation of hybrids with have lower fuel consumption.
The TTC reports that the GHG saving between a first generation hybrid and an eBus is about 1.315kg CO2/km, as against 1.379 for clean diesels (from the table above). This suggests that the first generation hybrids are not saving much fuel compared to the diesels (less than 5%).
Getting It Right
The main report contains a more reasonable number:
When the entire fleet is zero-emissions, the following benefits are expected to be realized:
1. Greenhouse gas emissions will be reduced by approximately 250,000 tonnes of CO2 annually; […]
TTC Report at p. 3
In pre-covid times (2019), the TTC operated 145.1 million km with its bus fleet. At a saving of about 1.38 kg CO2/km, this translates to 200,000 tones of CO2, a somewhat lower figure than the TTC claims.
As Toronto launches into a new electric era, the TTC needs to clean up its statistics and calculations so that those trumpeting our efforts use the correct data.
Environmentalists, transit boosters, city planners, anyone who is touting electrification should be careful to cite correct figures for the expected benefit of eBuses.
I have no problem with “going green” and welcome the shift to electric vehicles. That said, it is important that the benefits be stated accurately and clearly so that “green” is not oversold. Toronto’s transit history is littered with hucksters.
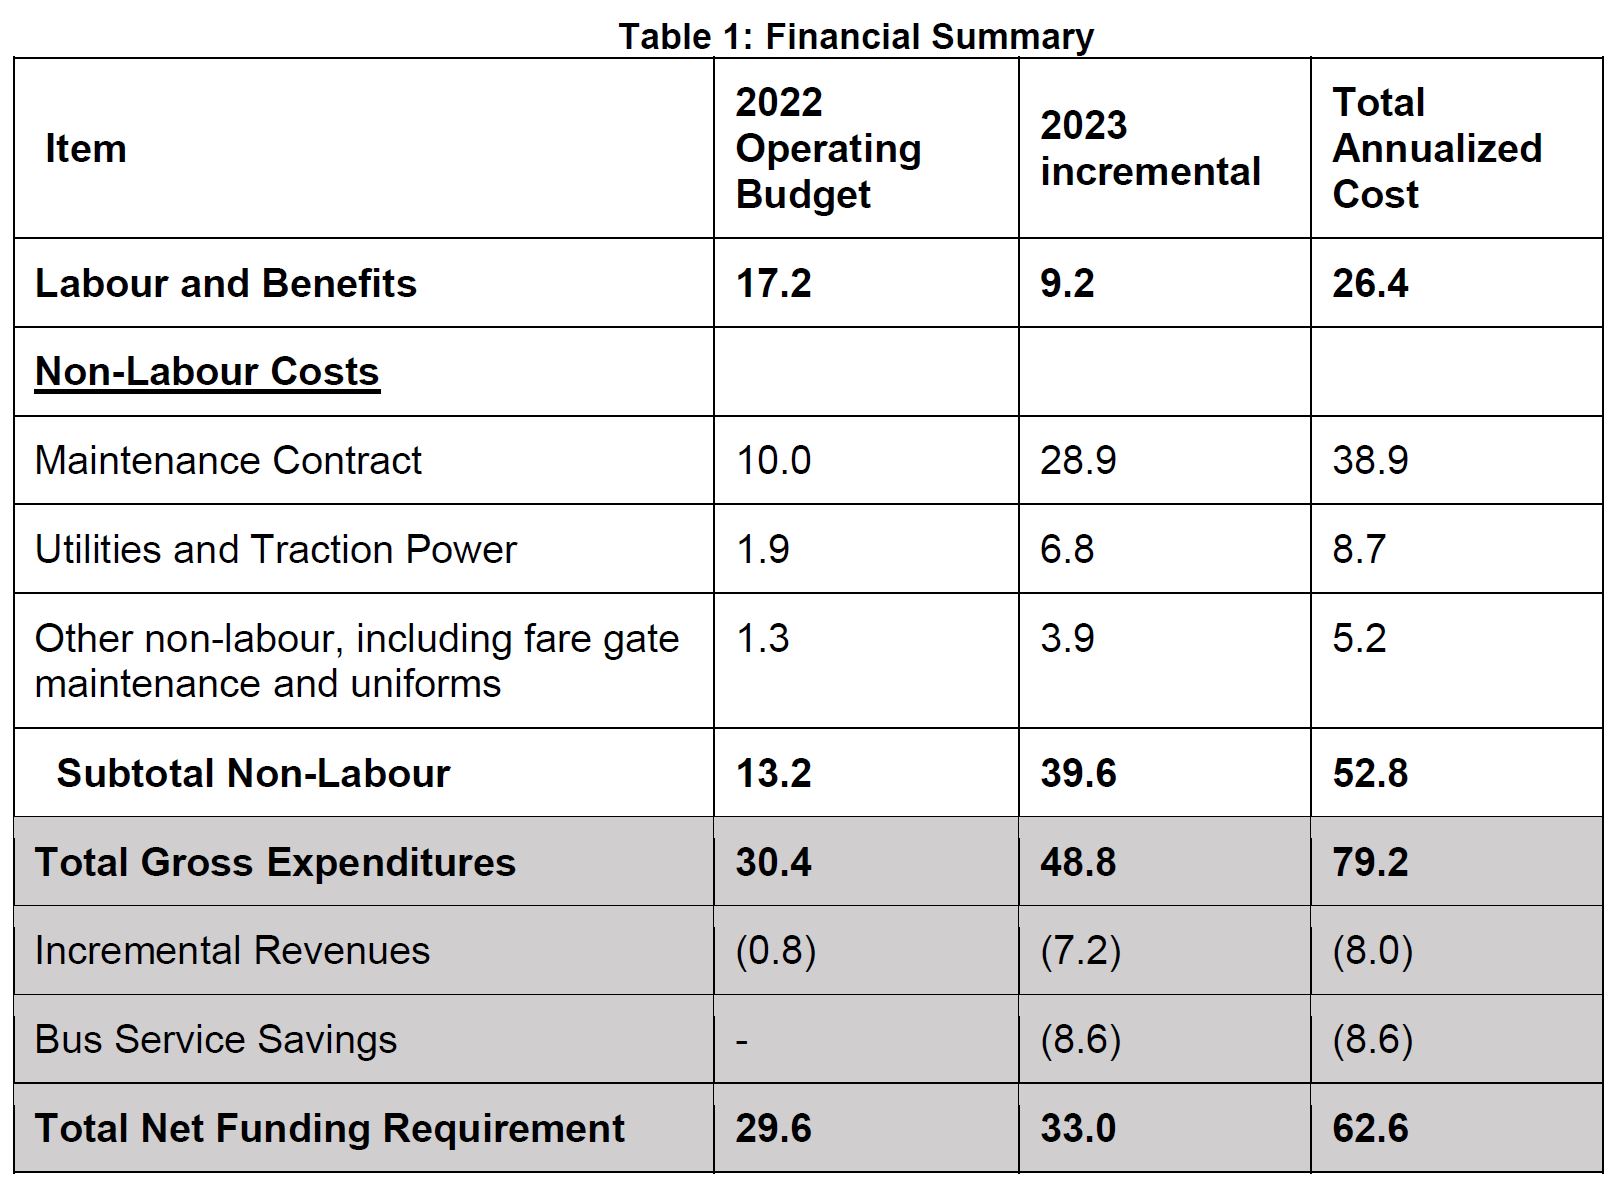
At its meeting on April 14, 2022, the TTC Board will consider a report about the arrangements with Metrolinx for operation of Line 5 Crosstown. This line, at least from a budgetary standpoint, is expected to open late in 2022.
There is a long agreement between Toronto and Metrolinx about how the costs are shared and who does what, and a much longer Project Agreement between the province and Crosslinx, the private consortium that built and is responsible for maintenance of the infrastructure and equipment.
Within the TTC report, these two documents are referred to as the “TOFA” and the “PA”.
Even with Toronto keeping any revenue the line generates, the net result will be an increase in the TTC’s costs. On an annualized basis, the net new cost to Toronto is $62.6 million annually. This is not surprising, but a fascinating point about this table is that the maintenance contract and other non-labour costs total $52.8 million while the labour and benefits for TTC staff (station, on-train, supervision) amounts to only $26.4 million.
This illustrates the substantial cost of owning and maintaining infrastructure as opposed to running the trains.
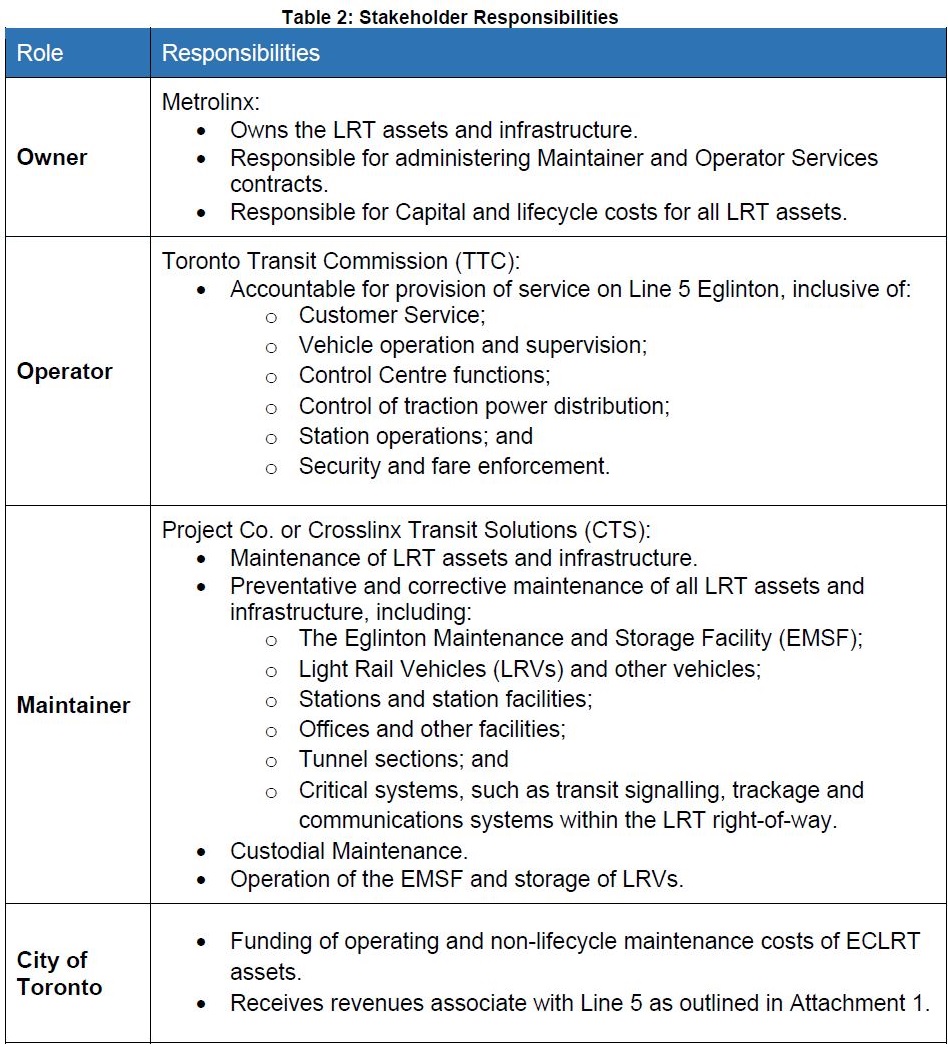
Responsibility for aspects of the route are divided among the parties as shown below.
The TTC Board agenda for its April 14, 2022 meeting includes two reports that show the current status of ridership, as well as the financial situation both for 2021 and 2022.
It is possible that some of this will be updated in the staff presentation at the meeting, and if so, I will revise this article.
Ridership
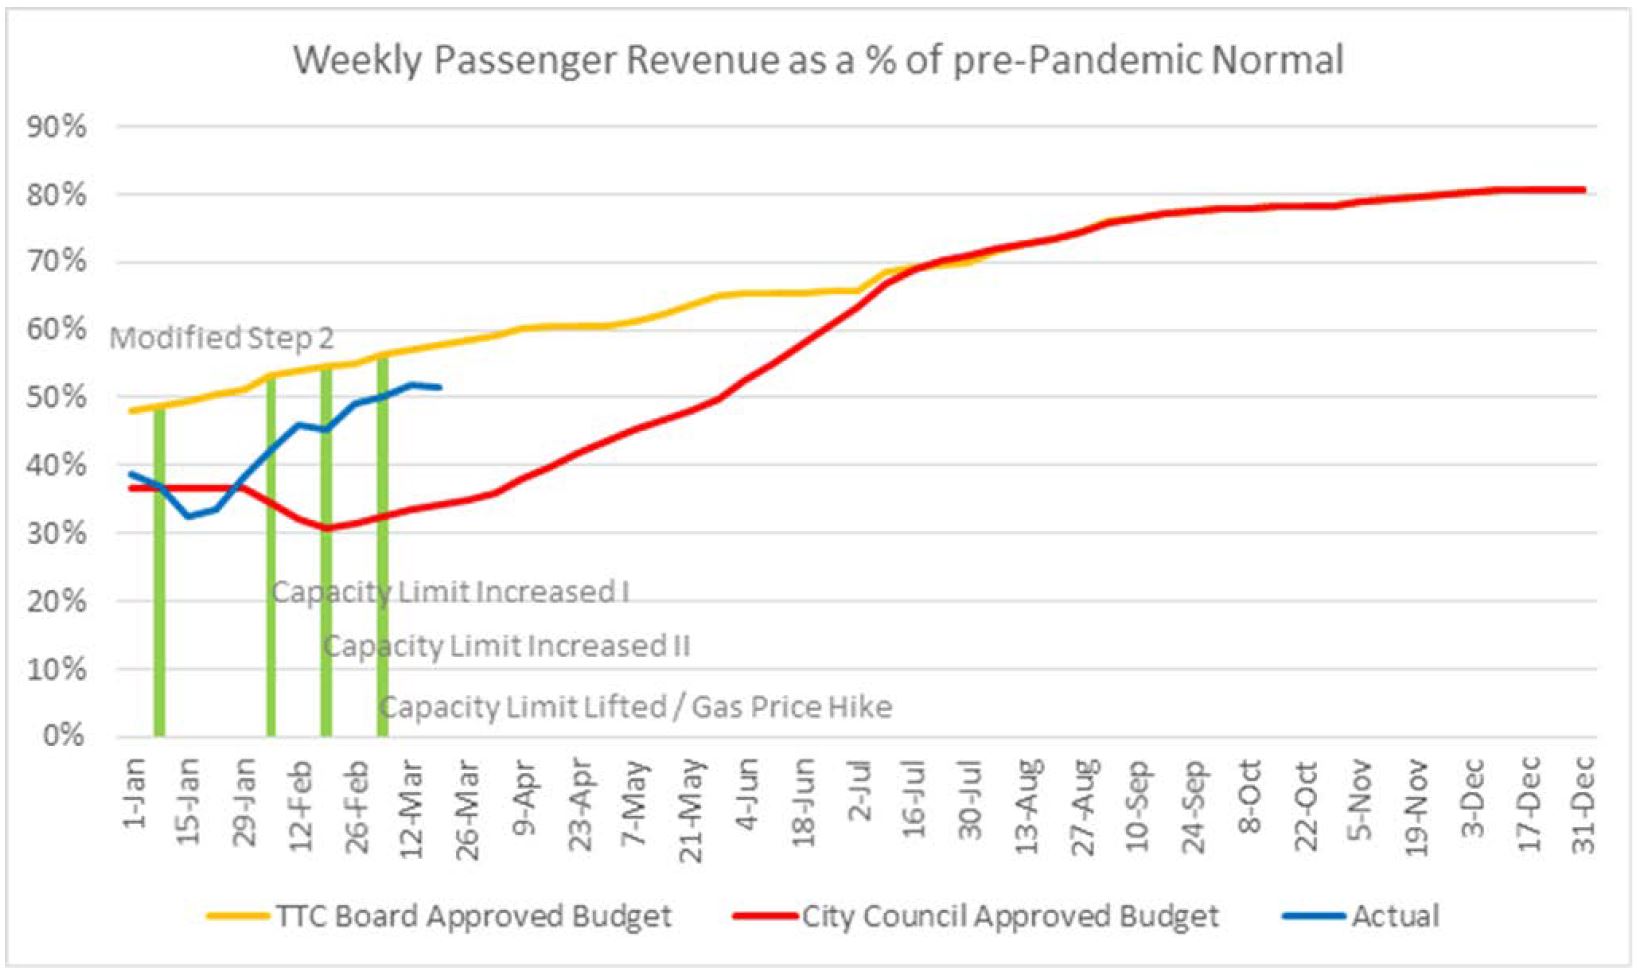
With various waves of Covid-19 and associated shutdowns, ridership has not been recovering at the rate hoped for when the 2022 budget was prepared. That budget was amended during its trip through City Council to take into account lower projected demand through at least the first part of 2022.
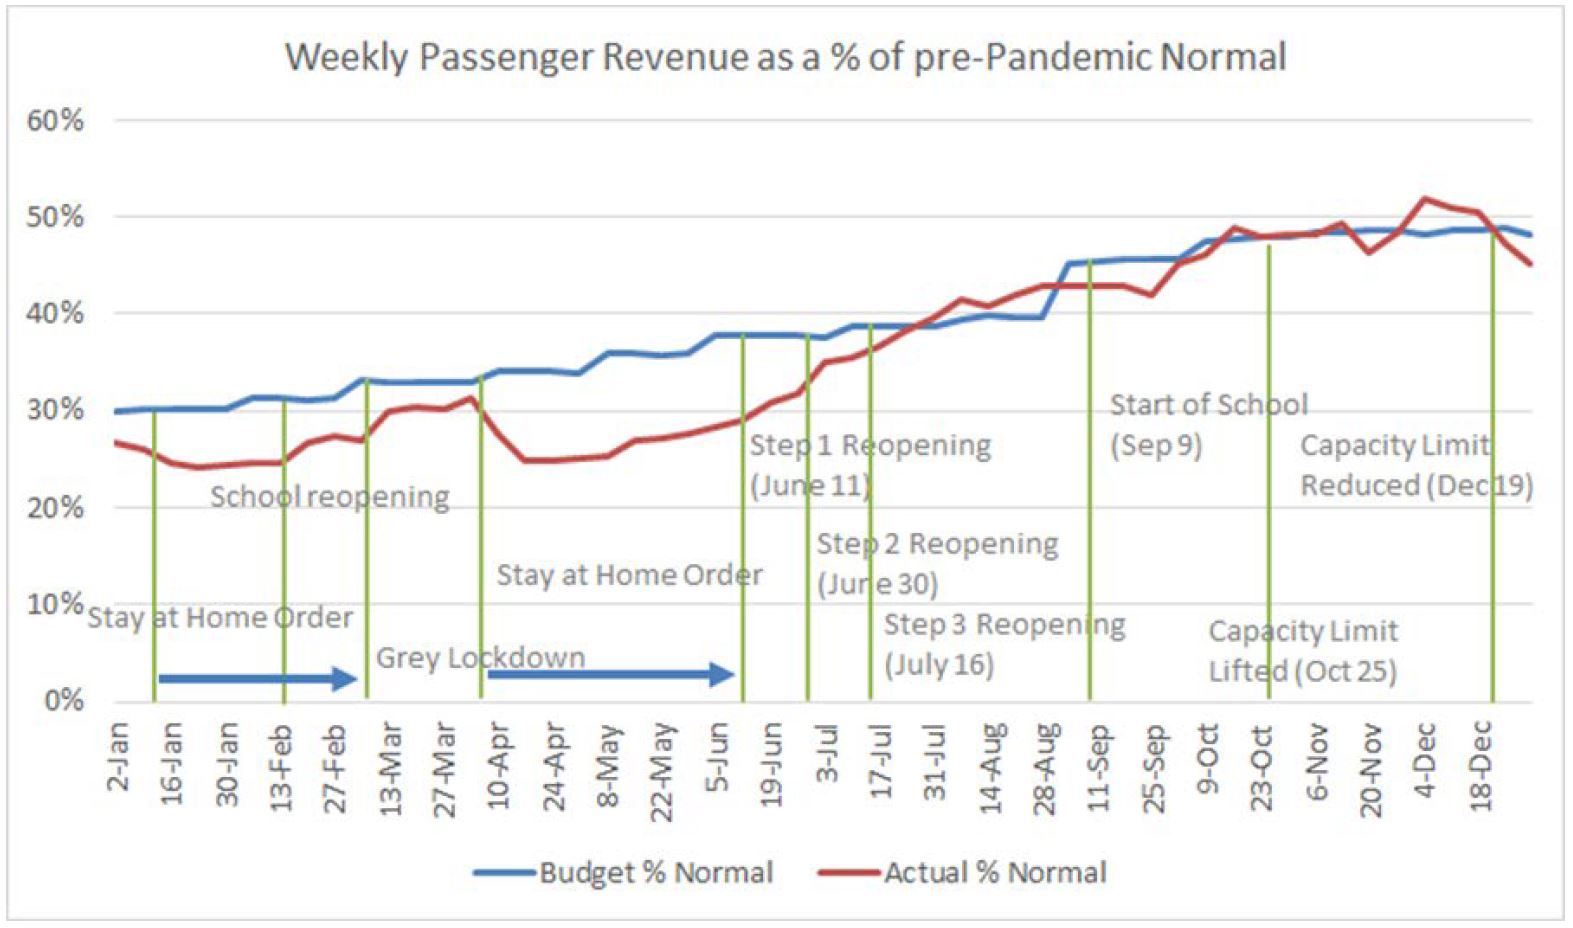
Through early and mid-2021, ridership was below budget, but caught up again later in the year. This still left 2021 overall with a shortfall.
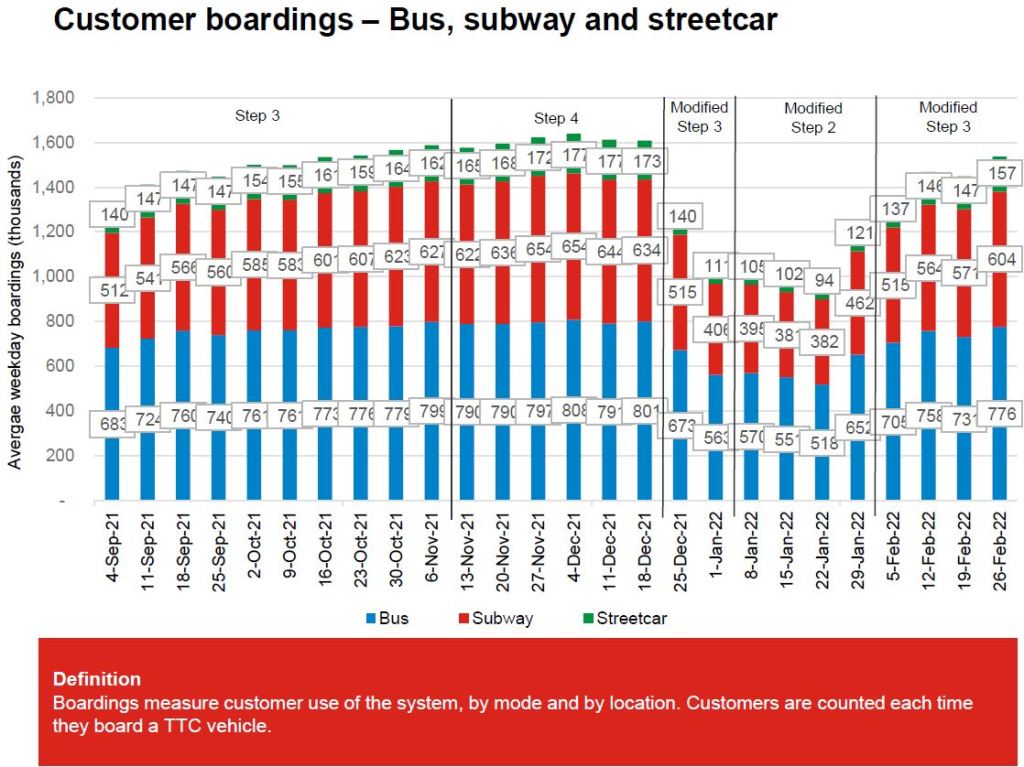
The effect of Omicron shows up in comparing the originally budgeted ridership (yellow) with the projected approved by Council (red) and with actual results to date (blue). Depending on the evolving health situation, the actuals could catch up to the original budget sooner than expected, but this could also leave a deficit for the year as a whole depending what happens in coming months.
The ridership habit is changing for the better in a small way. The proportion of riders using passes or who tapped 10 times or more per week rose in February from 16% to 19% with a corresponding drop in occasional or infrequent riders. The pre-covid proportion of frequent riders was 32%, and so the system still has a lot to recover within that group.
Ridership by mode has improved in early 2022 although it is still not back to fall 2021 levels. Bus ridership has consistently been the strongest reflecting the type of trip and traveller in areas served by buses where work-from-home is a less viable option.
Overall, the TTC expects that the March stats will see them crossing the 50% line for current-vs-prepandemic boardings, and this will trigger a build-up to former service levels through the year.
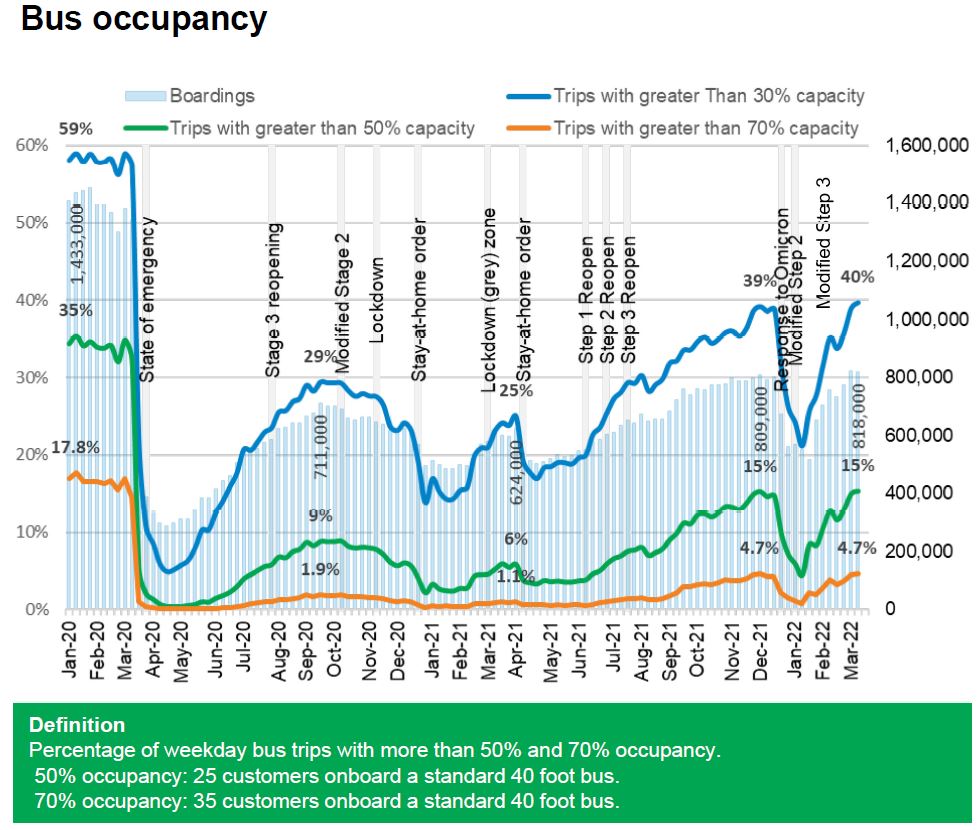
Bus crowding continues to be an issue, although the TTC does not break down stats by route and time of day. The proportion of trips at various capacity levels has grown back to late 2021 levels by the end of March 2022. This does not reveal how crowding is concentrated, and the percentages can be diluted by trips at off-hours and on routes that typically do not have very heavy demand.
There is also the question of uneven headways that can lead to crowding variations as I have discussed in many articles here. The basic point is that although a total of 40% of trips run at less than 30% capacity, the remaining 60% of trips have more riders on them, and the average riding experience is determined by what they see. (For example, if 60 riders are distributed between two buses with 45 on one and 15 on the other, a poll of all riders will reveal that most riders see a crowded bus even though the average load is only 30.)
Updated April 10, 2022 at 10:30pm: Minor typos fixed. Bus order size for eBuses by TTC corrected. Reference to use of pantographs for charging on TTC buses corrected.
Updated April 18, 2022 at 2:50 pm: Note that the GHG savings cited in the TTC’s chart below are off by a factor of 1,000 because they mixed up kilos and tonnes partway through the calculation. See also TTC eBus Errata: Tonnes and Kilos Are Different.
Since June 2019, the TTC ran head-to-head trials of three manufacturers’ battery-electric buses with a fleet of 60 vehicles:
New Flyer models SR2304 (10) and SR2382 (15)
Proterra models Catalyst 40 E2 RR Pro Drive (10) and DuoPower (15)
BYD model K9M (10)
Nova Bus was not part of the trial because, when it was launched, they did not have a vehicle with sufficient range to meet the specifications. However, their hybrid diesel-electric bus, of which the TTC has many, was used as a comparator for the trial.
The low number of BYD buses was due to their inability to supply vehicles even though their lobbyists had engineered, through Deputy Mayor Minnan-Wong, a “deputation” at a TTC Board Meeting that turned into a full sales pitch clearly hoping to short-circuit the procurement process. This was not a high point in TTC history, and the move to a green fleet was launched under very dubious circumstances.
There is also bitter irony for those who remember TTC history. Three decades ago, the TTC opted for the allegedly-green technology of Natural Gas buses as a replacement for trolley bus system expansion. The CNG buses are long gone from Toronto, and the TTC now plans to move completely to electric transit. Lobbyists are good at selling things – whether they work or not is a secondary consideration.
The 102 page report TTC’s Green Bus Program: Final Results of TTC’s Head-to-Head eBus Evaluation goes into great detail of Toronto’s experience with their trial fleet and sets out many “lessons learned” and “must haves” for any large-scale procurement. This article is organized somewhat like the report with an overview followed by some of the technical background. The “lessons learned” have been consolidated at the end. Interested readers should consult the full report.
The clearly superior vehicles in the trial were the New Flyer buses. There were severe problems with reliability and maintainability in both the Proterra and BYD fleets, and some of the “must haves” would exclude them from consideration even if both vehicles and manufacturers had performed better.
Whether this technical outcome will be coloured by another round of lobbying remains to be seen. There will be a lot of money sloshing around as governments rush to “buy green”, but running transit requires a fleet that delivers reliable service, not just publicity photos. Toronto cannot afford to tie the future of its bus fleet to a manufacturer whose political connections outweigh their ability to deliver good products.
The TTC has funding in place from various governments to cover the purchase of about 600 vehicles. These will meet its replacement and growth needs from 2022 to 2025. In February 2022, the TTC ordered 336 buses for delivery by the end of 2023:
Nova Bus LFS Hybrid 40′ (134)
New Flyer Xcelsior Hybrid 40′ (134)
New Flyer Xcelsior Hybrid 60′ (68)
These will be the last buses with diesel propulsion for Toronto, and they would be due for replacement in the mid 2030s completing the conversion to an all-electric bus fleet.
An RFP (Request for Proposals) was issued on April 4, 2022 for a large purchase (at least 240 vehicles) of eBuses with contract award planned for the third quarter of 2022. This lands in the middle of the municipal election campaign, and the authority to award will be delegated to TTC management by the Board. Bids will close on June 17, and the successful vendor(s) would be notified in July with execution of agreements in August. (The last scheduled TTC Board meeting is on July 14, 2022.)
The specification for these buses was developed jointly by the TTC with other agencies:
The TTC is engaged with other peer transit agencies in the province, including Brampton Transit, Mississauga Transit, York Region Transit, and others through the Ontario Public Transit Association on the first interagency co-operative procurement of eBuses. The aim of this collaboration is to develop a single zero-emissions bus procurement specification with the immediate benefit of reducing cost through economies of scale. The long-term benefit is through the optimization and standardization of customer experience and, operations and maintenance throughout the GTHA and beyond.
TTC Report at p. 4
The potential quantity of buses is considerably higher with options for both the TTC and other agencies.
Source: TTC Vendor Briefing Session Deck April 8, 2022 at p. 5
In parallel to its migration to an electric fleet, the TTC must convert its bus garages including the provision of charging infrastructure for hundreds of vehicles at each location. At a previous meeting, the Board authorized an agreement with Ontario Power Generation and Toronto Hydro for the charging infrastructure. The utilities will build, own and maintain this as an extension of their distribution system.
Although the specification includes a requirement for on-route charging using stationary charging points, the TTC has not yet determined if or how such facilities would be used. There is no consideration of “in motion” charging using conventional trolleybus infrastructure to avoid the need for buses to lay over to recharge during their revenue service hours.
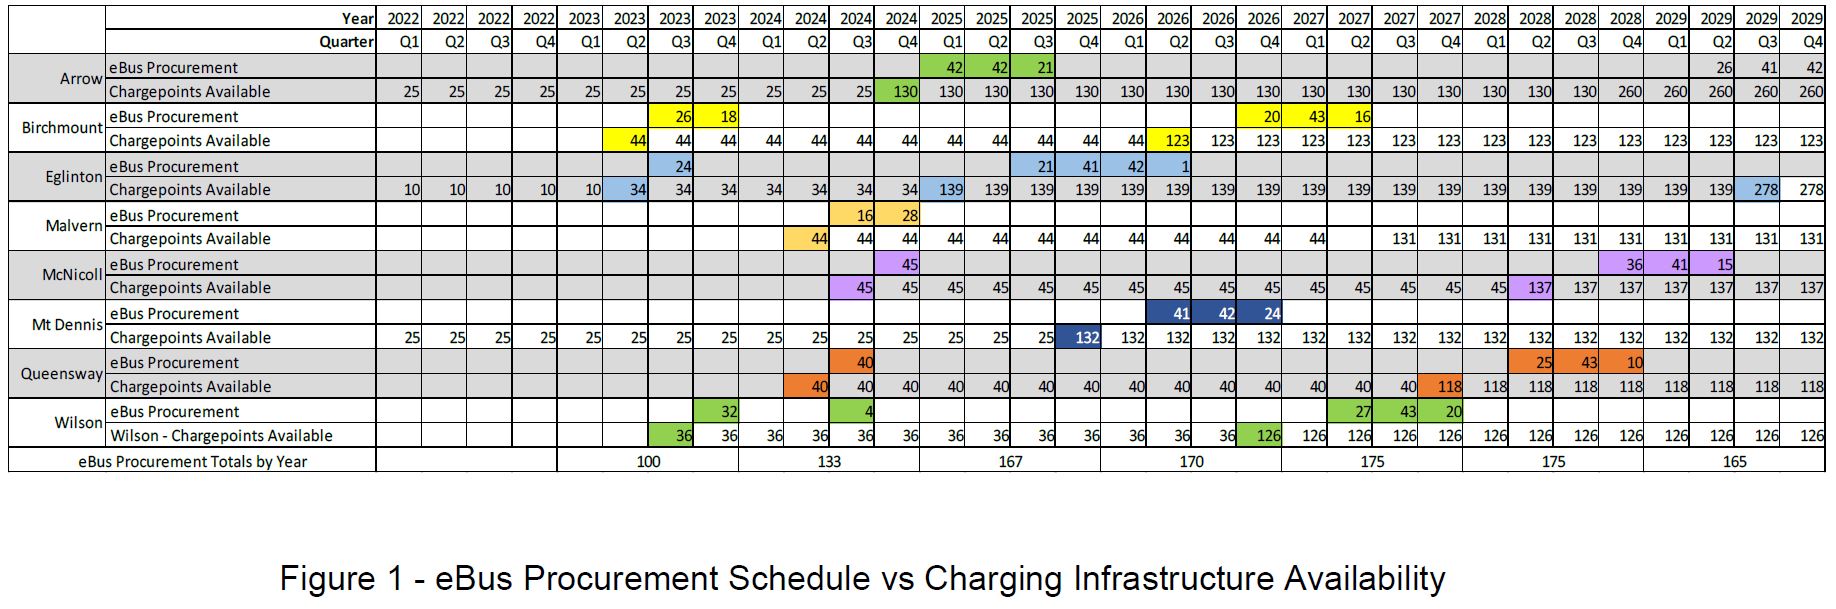
The overall plan for both buses and charging infrastructure is shown in the table below grouped by garage. This accounts for 1,085 buses, about half of the existing fleet. The first 240 buses planned in the contract award this year would take the TTC into early 2025. The program is not funded yet beyond that point. As and when more money appears, the TTC would extend its order.
Note that there are two phases to the installation of charging facilities at garages as the roll out of electrification works its way through the system. This allows some routes from each garage to operate with eBuses earlier in the program than might be practical if the conversion went garage-by-garage over the next decade.
The two-step scheme would also allow for a tactical change in charging strategy to move more of this to enroute facilities such charging stations at terminals. Although the TTC report is mostly silent on any charging technique beyond garage-based plug-in systems, there is a reference in “lessons learned” to a conversion to pantograph charging as a cure for problems with charging cables.
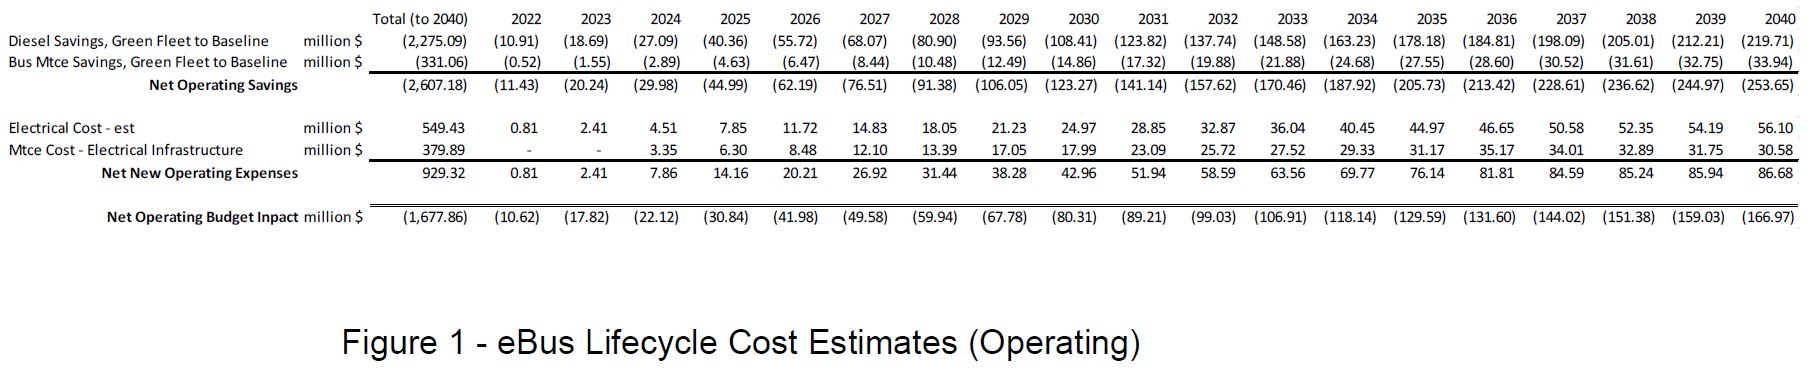
The TTC projects that life cycle costs for an electric fleet will be lower than for the diesels and hybrids it will replace because both energy and maintenance costs will go down. By 2040 this would save about $167 million annually. These estimates are sensitive to the future price of diesel fuel compared to electricity, but the TTC has not shown a range of values to indicate what the effect might be.
An 18-Year Design Life
Although the TTC report does not mention this, the actual RFP includes an interesting specification for fleet longevity. This signals a return to 18-year lifespans for the bus fleet after a retreat to 12 years in current fleet planning. If this can be achieved, it will offset the higher capital cost of the vehicles compared to hybrids or diesel buses.
1.1.1 The Bus shall have an 18-year design life and be equipped with a long life structure in accordance with Specification Section 1.8, made from full stainless steel in accordance with Specification Section 3.0, have a body with a maximum overall length of 12.8 m (42ft.) including a stowed Bike Rack , 2.59 m (8 ft.-6 in.) in width and a maximum overall height of 3.4 m (134 in.).
RFP Technical Requirements Section 1, Page 6
Later in the RFP:
1.8 SERVICE LIFE
Buses shall be designed for a minimum service life of 18 years or 1,610,000 km (1,000,000 mi.), under severe operating conditions similar to revenue transit operation in the City of Toronto.
RFP Technical Requirements Section 1, Page 19
And in more detail:
The vehicle design life shall be validated by successful completion of a simulated 12-year average New York City duty cycle service life. The test program shall be designed around input measurements taken from a vehicle configured similarly to the test vehicle while it’s being operated over a known severe route. The New York City B.35 route or an approved equivalent (i.e., the Queens Q.44 route is now reportedly used by New York City), shall be used for a simulated 800,000 km (500,000 mi.) to demonstrate Bus longevity. This is generally considered to be the equivalent of 16 to 18 years operating life at all other transit properties.
RFP Technical Requirements Section 1, Page 20
“Must Have” Specifications
An important outcome of the trial has been the development of a “must have” list, and certain aspects of any new fleet are not negotiable. Toronto has a history with every type of vehicle (subway, streetcar, bus) where pervasive problems have hobbled fleet performance and availability.
TTC’s next large-scale eBus procurement includes ‘must have’ requirements that are informed by the head-to-head evaluation and focus on ensuring longevity of the bus structure and high system reliability through a proven platform (e.g. stainless steel structure, doors, HVAC, suspension, etc.).
TTC Report at p. 2
These requirements are:
1. Altoona and shaker table testing has been successfully completed; 2. A full stainless steel structure with a minimum of six years of in service experience; 3. A minimum usable battery capacity of 400 kWh; 4. A maximum overall bus length of 12.8 m (42 ft.) including a stowed bike rack; 5. A maximum overall height of 340 cm (134 in.) including any roof-mounted equipment; 6. Ability to charge via roof mounted pantograph charging interface, capable of accepting a minimum charge rate of 300kW (400 ADC) at 750 VDC or greater via SAE J3105/1; and 7. Two rear-mounted charging ports capable of accepting a minimum charging rate of 150 kW (200 ADC) at 750 VDC or greater via SAE J1772.
TTC Report at p. 24
Requirement 3 conflicts with statements elsewhere in the report where a maximum length of 40 feet is cited so that buses will fit within existing garage designs and operations. The difference appears to be in whether the bike rack counts toward the total, but it is not clear whether the Proterra bus would meet this requirement.
Physical Compatibility: The industry standard bus length is 40-feet (12 metres). This standard was used to design storage facilities in the TTC’s existing bus garages.
The Nova HEV, BYD, and NFI buses meet this standard. Proterra buses are 42.5 feet long, but also offers the highest seating and standee capacity. Based on our bus garage layout, procurement of additional Proterra buses would result in a loss of storage capacity of approximately 10% at four of eight garages. The remaining four bus garages could accommodate this additional length. However, this would impose a significant operational constraint that would prevent movement of buses between garages.
TTC Report at p. 15
A maximum bus length specification of 40 feet is required in order to preserve bus storage density at existing maintenance facilities; …
TTC Report at p. 16, also p. 28, under “Lessons Learned”
It is not clear whether the TTC is prepared to accept buses over 40 feet long, and what position they will take about Proterra vehicles on that account. Other issues with that vendor, notably bus reliability, might knock them out of the running regardless of bus length.
An additional requirement applies to the contract itself rather than to the buses, and it addresses the City’s equity goals:
In support of the commitment to diversity, equity, and inclusion, the Contractor must agree, as a fundamental component to the Contract, to meet the Procurement Equity Requirements, by applying a percentage of the Contract Price in respect of the Diverse Business Enterprise Requirement and a specified number and percentage, as stated in the Proposal, in respect of the Equity Hired Requirement.
TTC Report at p. 7
This is a contrast to recent provincial actions to back away from equity and community benefit components in contracts.
After extensive study and public consultation, TTC staff will present a plan for bus replacement of the Scarborough RT to their Board at its April 14, 2022 meeting. Although it is a long report, much of it has appeared before during the consultative process and in an interim report to the Board. Interested readers can browse the full version, and I will only touch on the major points here.
My apologies for the resolution on some of the drawings included here. The versions in the TTC report online are not good, but if better renditions show up in the future, I will replace the originals here.
The Scarborough RT is on its last legs and, frankly, should have been replaced years ago. Let us not get into the whole subway/LRT debate as that train has left the station. However, the constant delay in making any decision has now pushed the opening of any replacement service well beyond the reasonable lifetime of the existing SRT fleet, and even that will require work to keep it operating until bus facilities are ready.
Various dates for the SRT shutdown are proposed, and these depend on completion of alternate bus terminal facilities. Thanksgiving weekend would certainly be an ironic cutover date.
The candidate dates for Q4 2023 would mean the last day of train service could be: Saturday October 14, 2023; or, Saturday November 25, 2023. If construction is complete ahead of schedule, a September closure date could also be possible, on Saturday September 2, 2023.
TTC Report at p. 15
The Recommended Option
When the need to close the SRT before the Scarborough Subway Extension opened became apparent, the first thought was that riders would be consigned to buses plying the roads from Scarborough Town Centre to Kennedy Station for many years.
To no great surprise, there was a better idea that emerged during the consultations: use as much of the existing SRT right-of-way as possible for a bus roadway bypassing local street and intersection congestion and providing a direct access to Kennedy Station. That is the scheme that has been recommended, named in the report “Option 1 Hybrid Line 3 ROW” (Right-of-way).
As shown in the map below, the bus service will operate from STC station to Kennedy on street to Ellesmere Station and then on a new road in the existing SRT right-of-way to Kennedy Station. Stops will roughly match the existing SRT, except for McCowan. A new stop will be added at Tara Avenue, ironically a proposed station location decades ago when the SRT was to be built as a conventional LRT line.
The frequency of service is such that aggressive transit priority measures will be needed for the on-street portion.
The TTC will begin work on reconstruction and expansion at Dundas West Station Loop on Monday April 11, and the project is planned to be mainly completed by June 18. The full notice is on the TTC’s website.
The timing of various stages of the work has changed from the original plan discussed in a previous article.
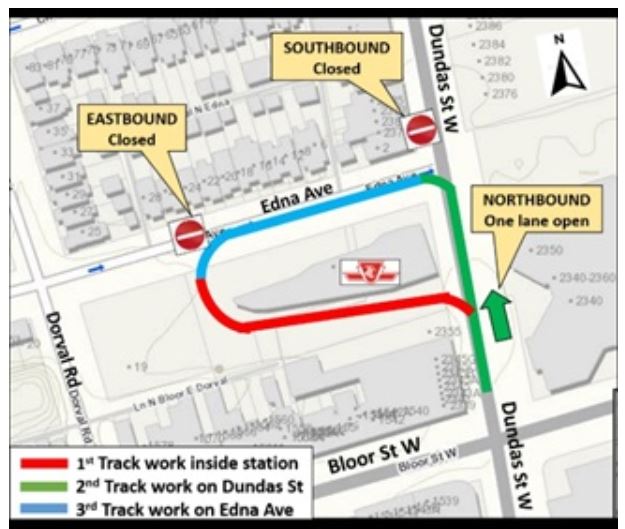
The original plan was to replace the trackwork on Dundas north from Bloor including the special work at the loop entrance first, followed by the track on Edna Avenue (the north side of the loop), and finally within the loop itself including expansion of platform used by 505 Dundas.
In the revised plan, the area within the loop will be done first working from west to east, followed by the track on Dundas Street, and finally the track on Edna Avenue.
The new phasing also changes plans previously announced for diversion of connecting surface routes.
During phase 1 (April 11 to May 7), the loop will be closed and all surface routes will divert:
40 Junction, 168 Symington and 312 St. Clair Night buses will loop on street stopping on Edna Avenue.
504C King shuttle buses will divert via Bloor to High Park Station and will serve Dundas West Station with on street stops a Bloor & Dundas.
505 Dundas and 306 Carlton Night cars will divert to High Park Loop.
402 Parkdale Community bus will divert as required (TBA).
During phase 2 (May 8 to June 18), some of the diversions will change:
505 Dundas, 504C King and 402 Parkdale will continue as in phase 1.
40 Junction and 168 Symington will divert to Lansdowne Station via Dupont and Bloor Streets respectively.
312 St. Clair Night bus will divert to Keele Station.
306 Carlton Night service will be replaced with buses and these will operate to Keele Station similarly to the 504C service.
Effective June 19 most routes will return to normal except for two that must await completion of new overhead wiring at Dundas West Station:
505 Dundas will continue to operate to High Park Loop.
306 Carlton will continue to operate as a bus service, but will terminate at Dundas West Station.
Additional work to be undertaken includes:
Emergency track repair on Dundas south of Bloor.
Construction of a “bump out” pedestrian area at the eastbound stop on Dundas just east of Roncesvalles.
There is no effect on subway service, and the station will remain open for access to trains.