This article continues a series reviewing major east-west routes in Scarborough that began with:
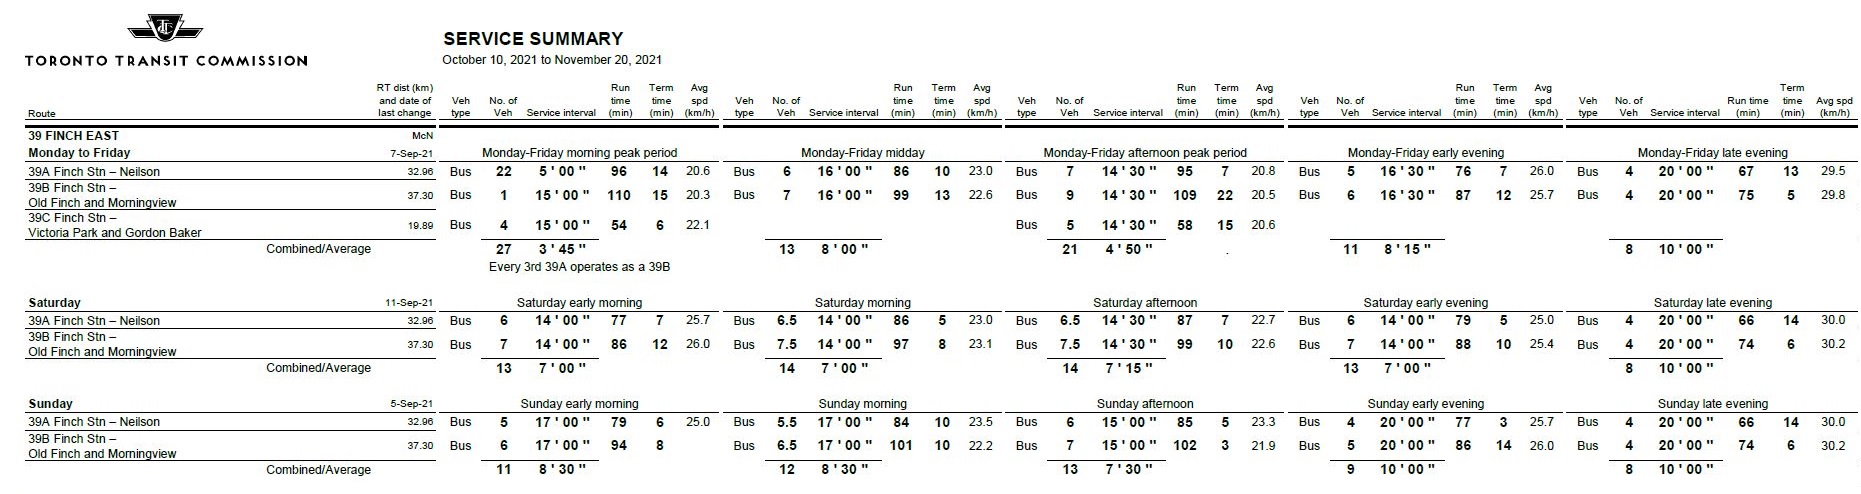
Service on Finch East is provided by two routes.
Route 39 Finch East operates from Finch Station with three branches:
- 39A to Neilson Road
- 39B to Morningview Trail
- 39C to Victoria Park & Gordon Baker Road (peak only)
The schedule was unchanged through the October-December 2021 period.
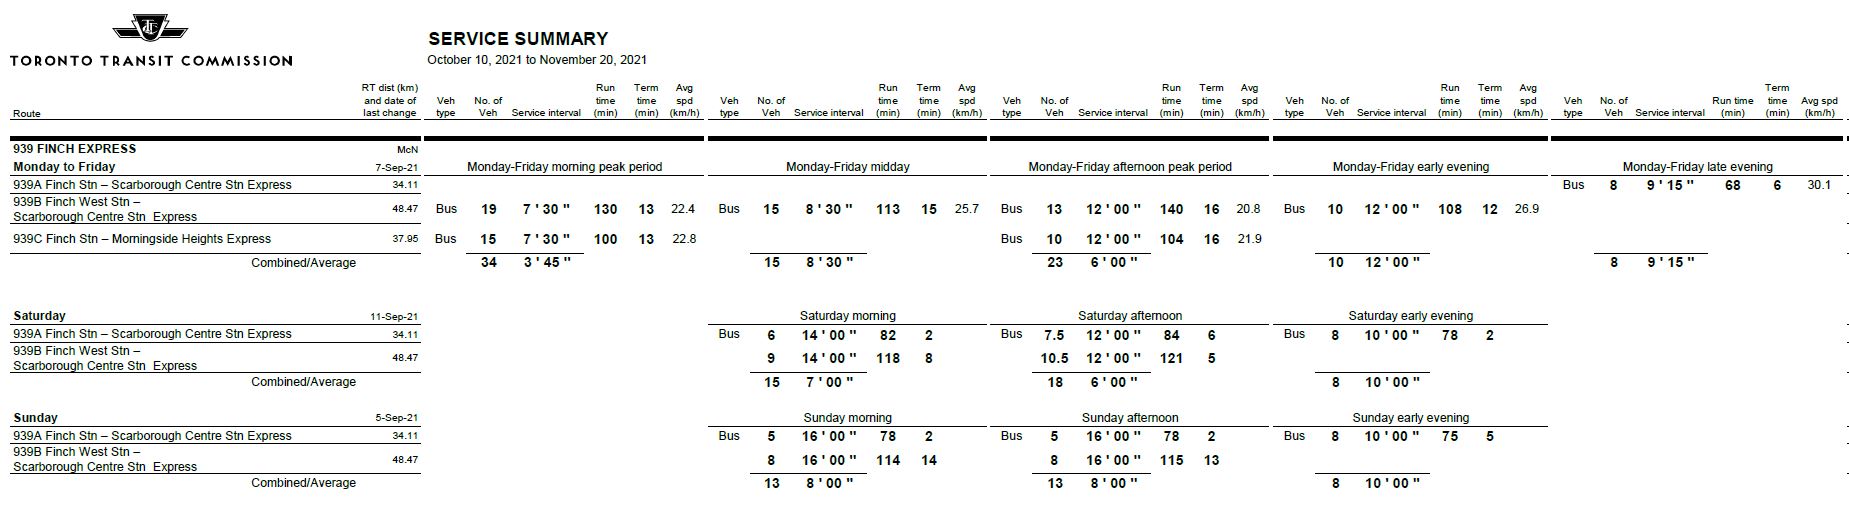
Route 939 Finch Express operates between Finch West Station and Staines Road with three variations. Service east of McCowan serves all stops, while for the section west to Yonge the 939s run express.
- 939B operates from Finch West Station to Scarborough Town Centre Station weekdays until mid evening, when it becomes the 939A and terminates at Finch Station.
- 939C operates only during peak periods between Finch Station and Morningside Heights.
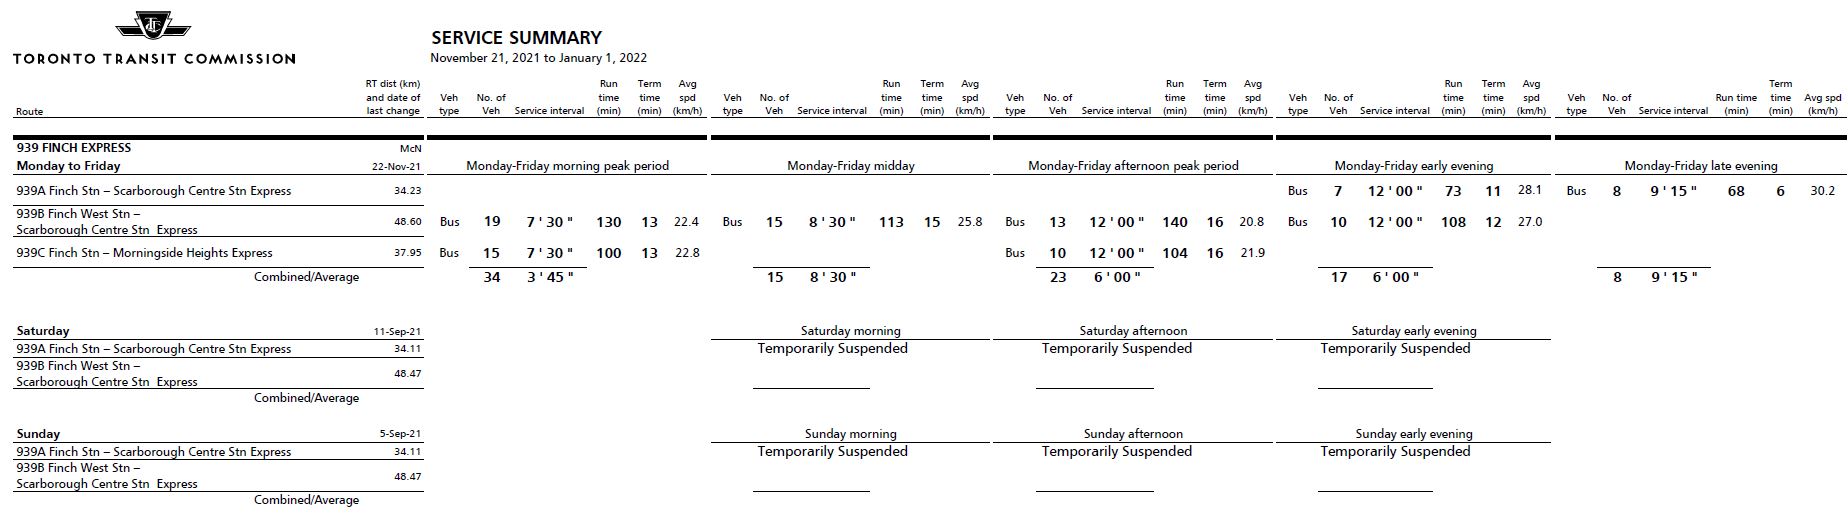
- On weekends until November 20, the service was split between the A and B branches as shown below. This operation was suspended on November 21 as part of the fall 2021 cutbacks. There was no compensating change in the local service, and the weekend service has not yet been restored.
- Weekday early evening service was improved by the addition of 939A service on November 22.
The Finch corridor is among those proposed for “red lane” treatment in the RapidTO program between Yonge and McCowan.
The scheduled headways on the 39 and 939 routes would not blend even if they kept to their schedules, and so this analysis looks at each route on its own.
As with the previous article on the York Mills service, there is data missing from the period immediately after the cyber attack on the TTC in late October and into early November. However, this does not prevent analysis of the overall pattern of service.
In Brief
- Erratic headways are common on both the local and express services. These generally result from bunching in terminal departures or at route merge points, not from pervasive traffic congestion.
- During the period reviewed here, missing buses appeared to be rare, and they fell generally in the latter weeks of the year. There does not appear to be an effort to space service to allow for the missing bus, and rather a double-headway travels across the route where the absent bus should be.
- Average travel times over the proposed “red lane” section of the route between Finch Station and McCowan differ by about five minutes for local and express services.
- Where there are congestion effects, they tend to last for a few days or weeks at a location, and then disappear. This implies that they are caused by short-term factors such as construction projects rather than being inherent to traffic patterns on the street. This has implications for red lane operations because there is no single location where transit priority will “fix” a long-standing problem.
For a detailed description of how to read these charts, please see Understanding TTC Service Analysis Charts: A Primer.
Weekday Service Eastbound
39 Finch East Local from Finch Station
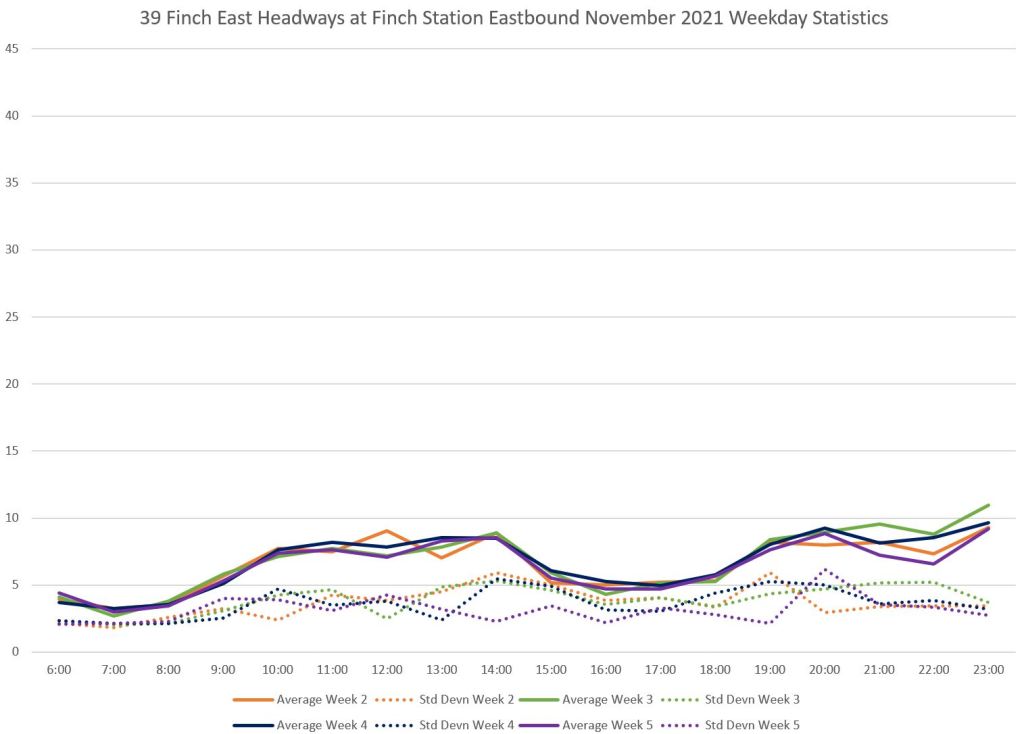
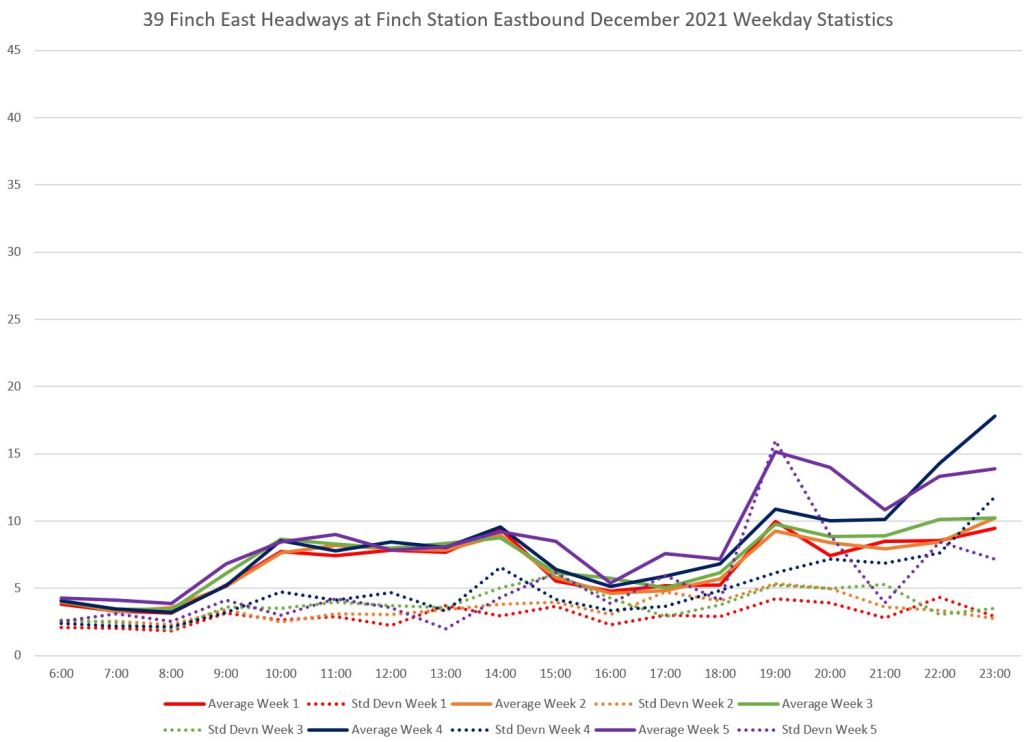
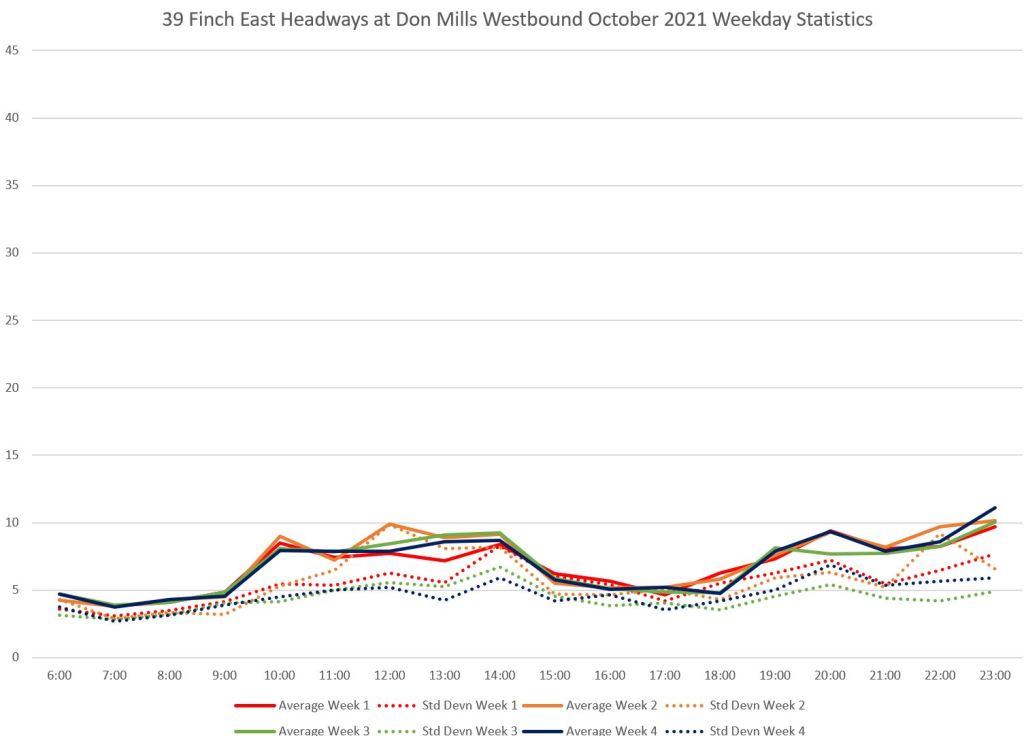
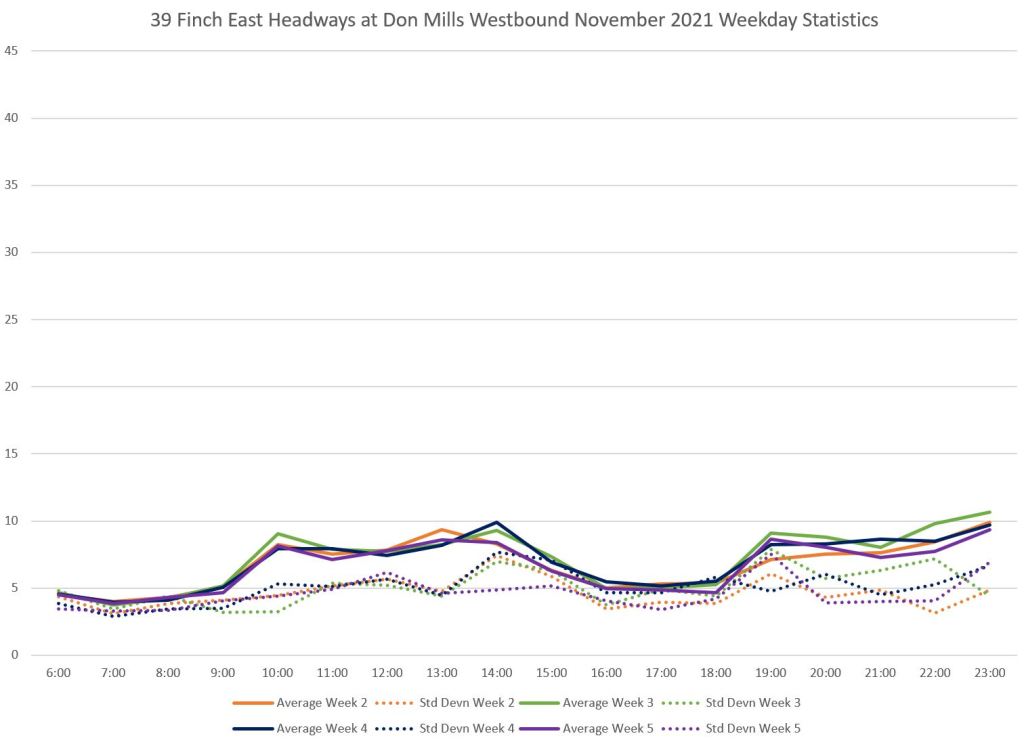
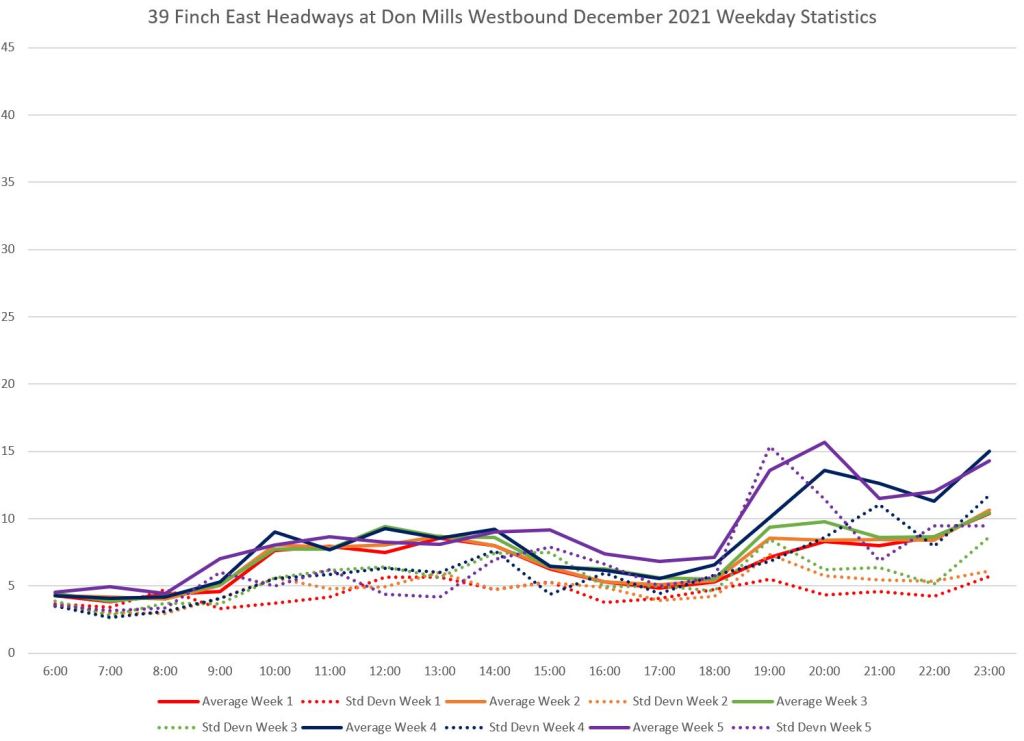
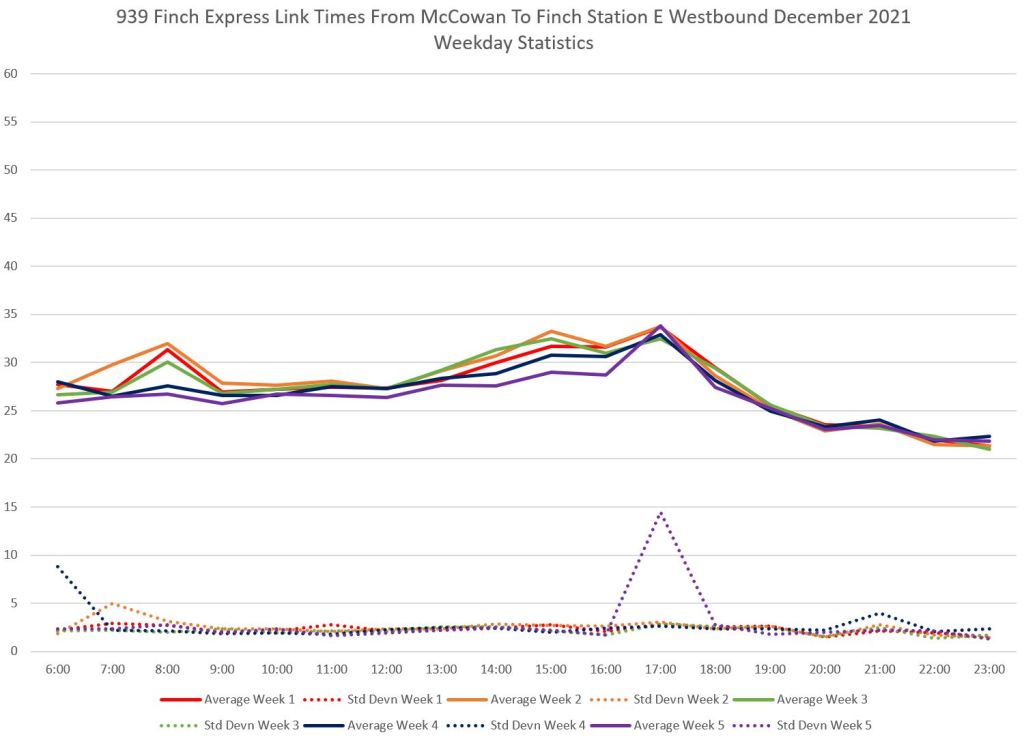
The weekly average headways (top row of charts) follow a similar pattern because there were no changes in the scheduled service. The last few weeks of December, however, show worse evening service possibly due to missing vehicles. Standard deviation values range up to five minutes even though this is service from a terminal showing that departures at Finch Station are irregular.
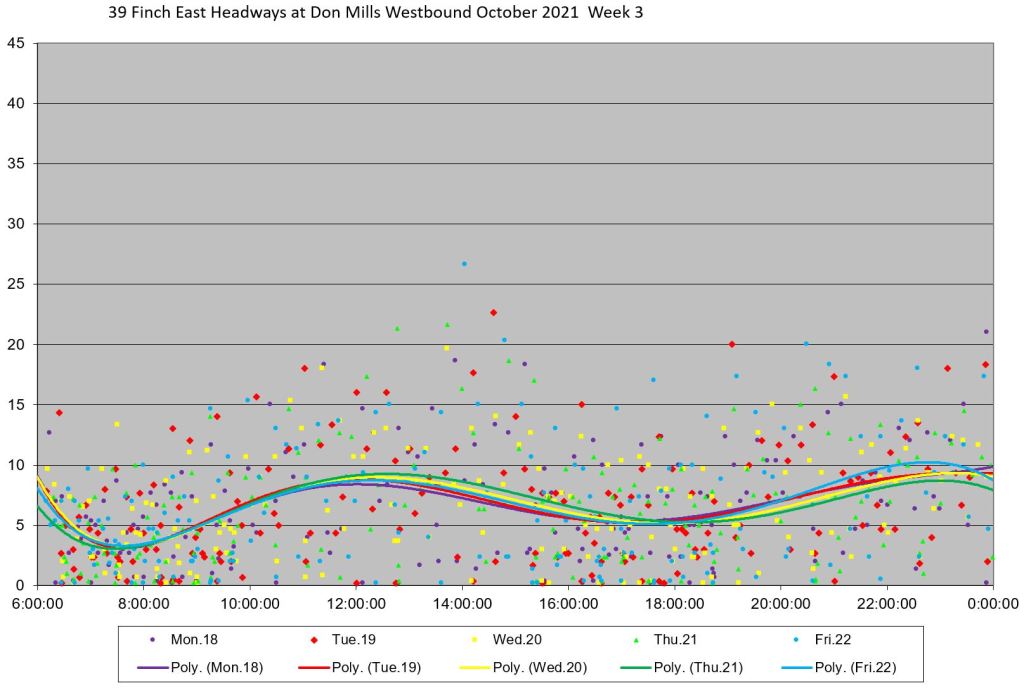
That problem shows up in the following charts with details of specific weeks. (The same sample weeks are used for all locations in this article to allow comparison of service at different points along the routes.)
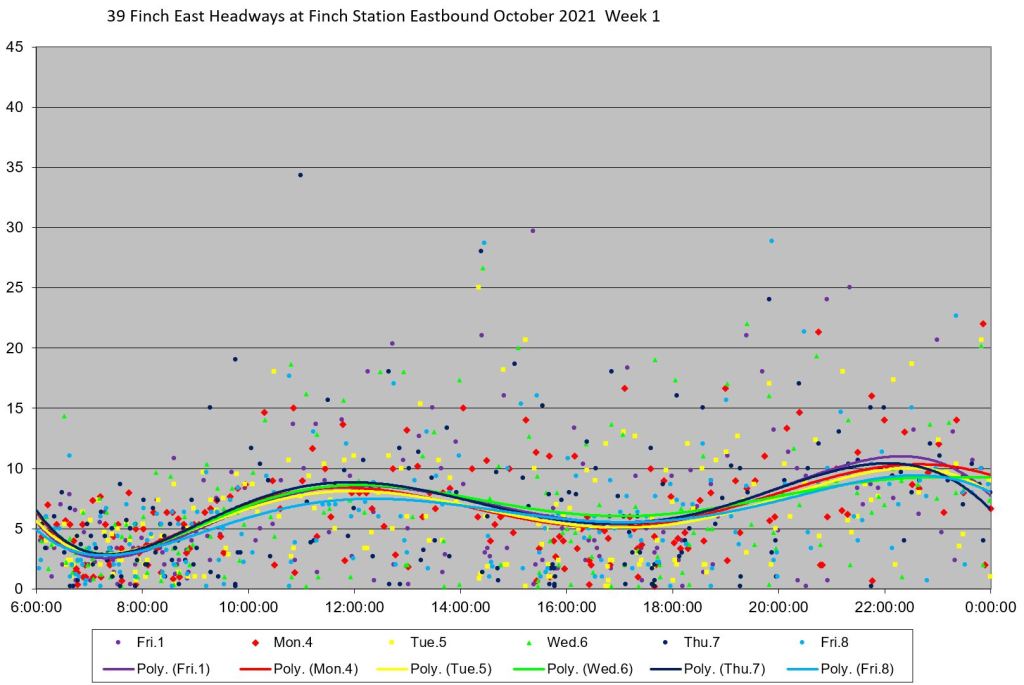
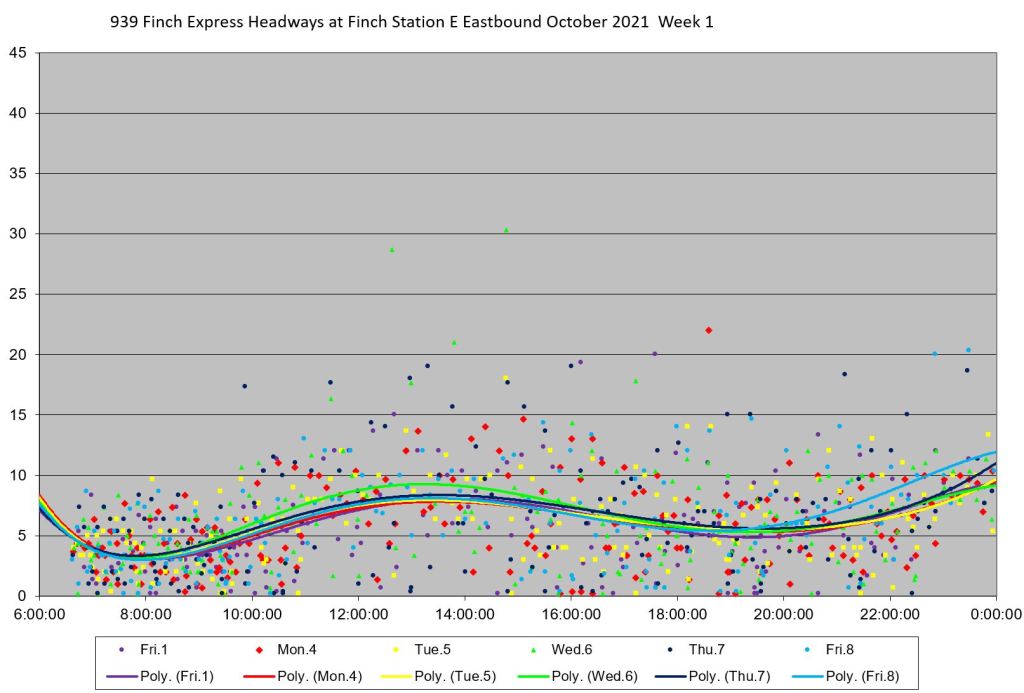
Many headways are close to the zero line indicating vehicles leaving the terminal in bunches, and many are well above ten minutes with occasional points over half an hour. The two October charts for weeks 1 and 3 illustrate the difference in scatter of values and its effect on the standard deviation which is higher in week 1 (red dotted line) than in week 3 (green dotted line).
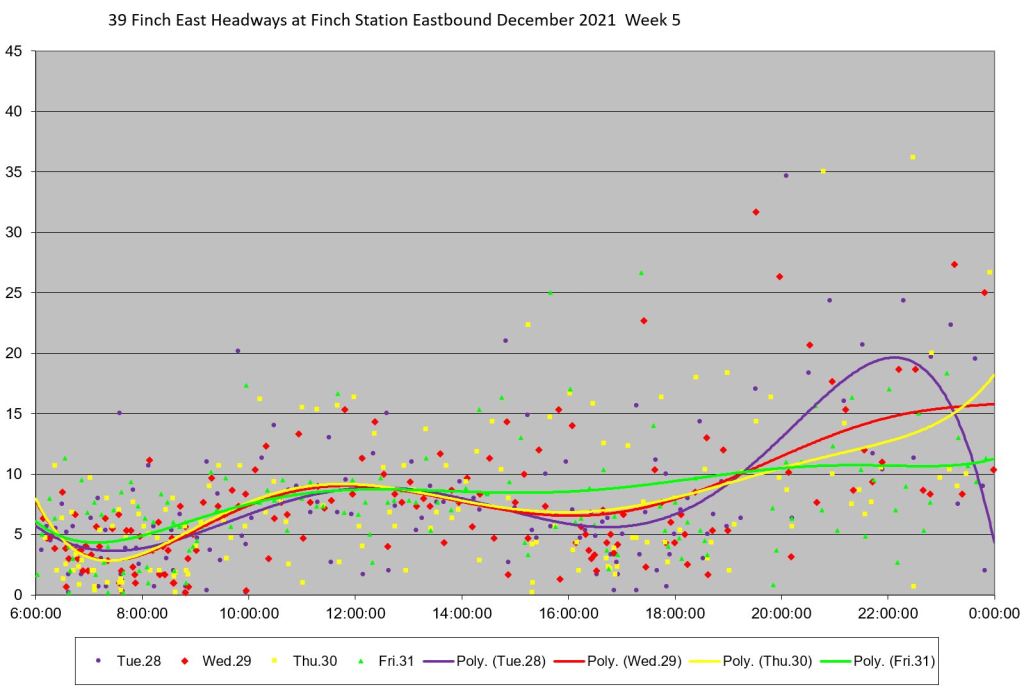
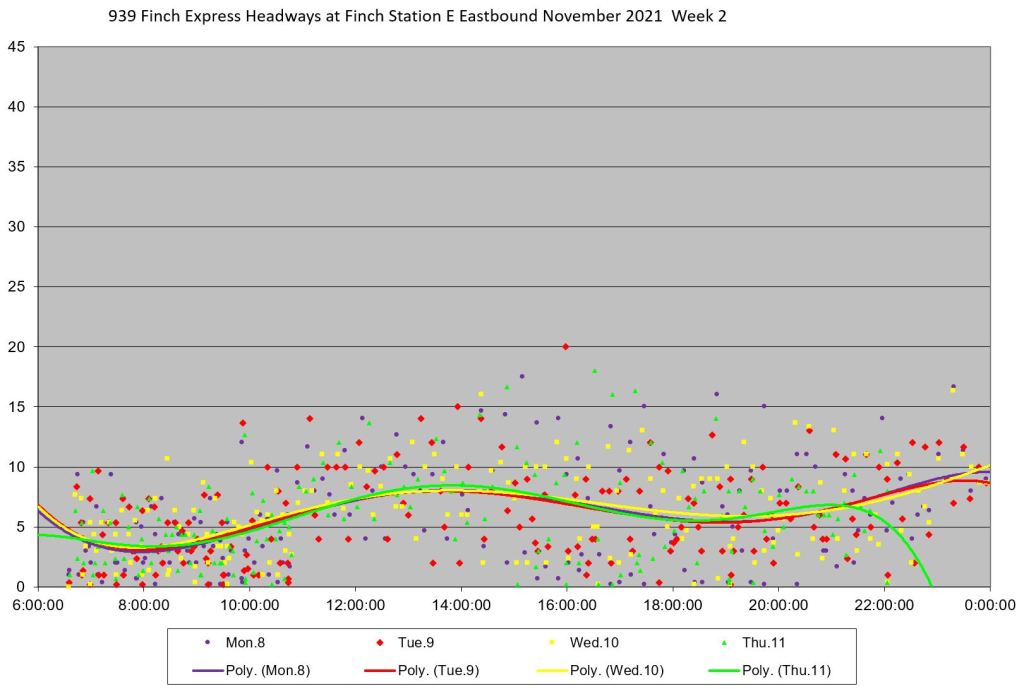
SD values are lower in November with a correspondingly less scattered set of headway values (week 2 shown as a sample). Even so, bunching and wide gaps are not uncommon. December shows a big problem with headways especially in the evenings late in the month.


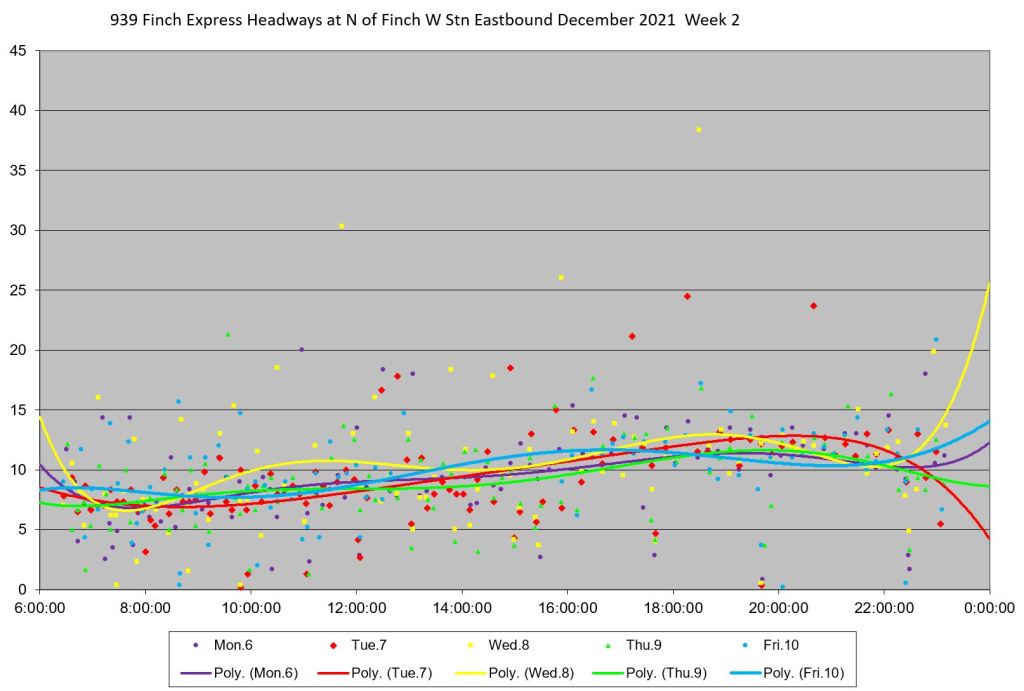
939 Finch Express from Finch West Station
Headways on the express service leaving Finch West Station are measured north of the station as these buses travel north to the busway in the hydro corridor.
The standard deviation values start off low in most weeks but grow as the day goes on showing a constant worsening of headway reliability. This is reflected in the detailed charts for selected weeks.


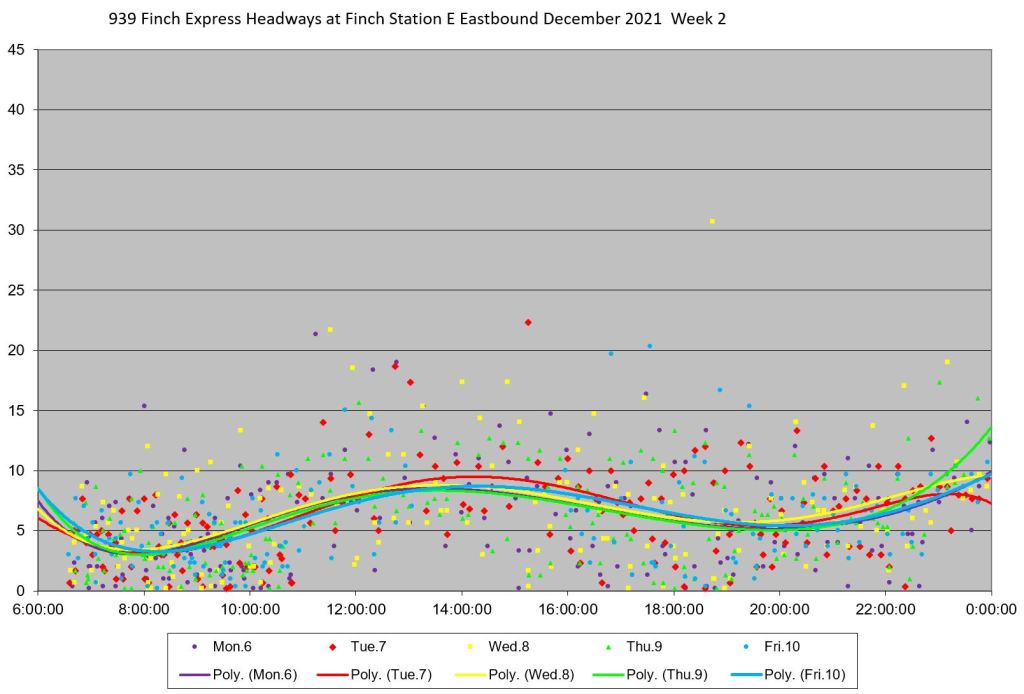
939 Finch Express from Finch Station
At Finch Station, the 939B service originating at Finch West is joined by 939C and 939A (depending on the time period). The actual service shows a lot of bunching with very short headways and corresponding gaps. When the SD values are very close to the averages, this indicates that most service is running in bunches even though on paper there is a blended headway for the two branches.
Again, even though this is a terminal where service could be dispatched on a regular headway, this does not occur.


Weekday Service Westbound
39 Finch East Local from Littles Road / Morningview
During most operating periods, half of the service runs to Morningview while the other half turns back at Neilson. During peak periods, the proportion is reduced to one third because there is an additional short turn at Victoria Park.
Scheduled inbound service from the outer end of the line does not vary much as is evident from the average headways shown below. However, the SD values are consistently high, particularly later in the day, and especially in late December where the average values climb showing that buses were missing.
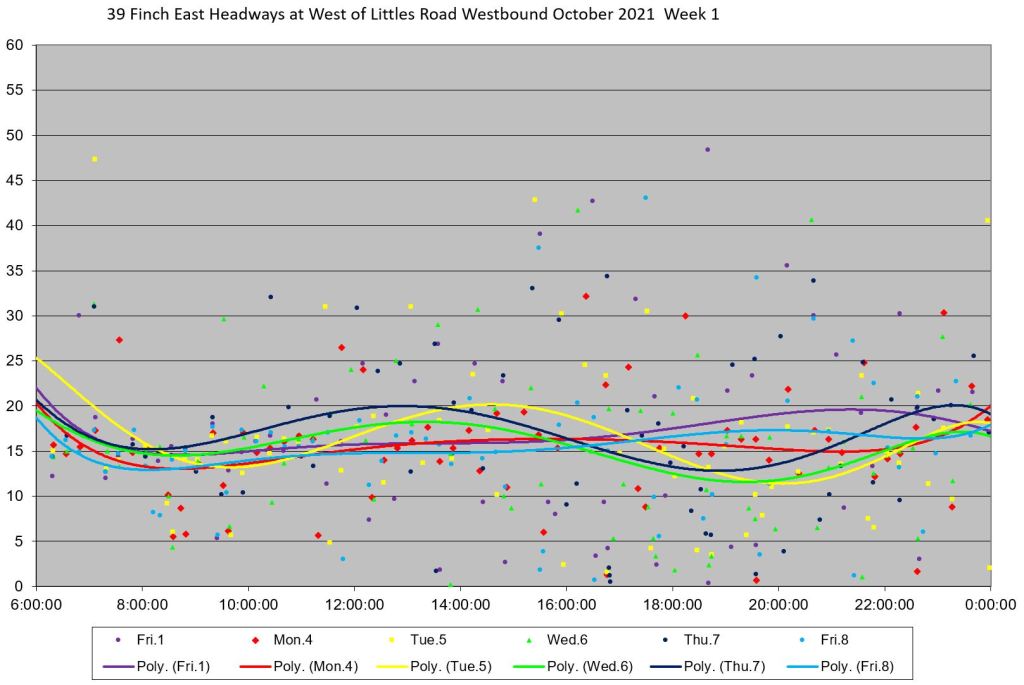
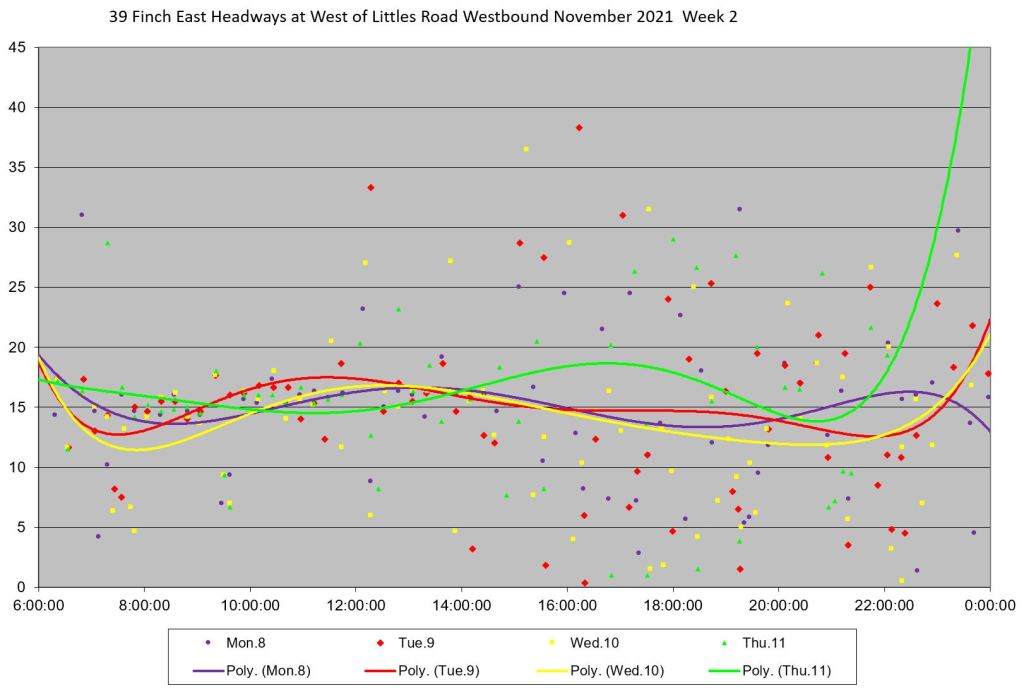
In the detailed charts below note that the October charts are scaled at 60 minutes, while November and December are at 45. This was done to fit some of the very wide gaps in October into the charts.
Relatively speaking, early December is better behaved with lower SD values and less scatter of headways, but “less” cannot hide gaps of over half an hour and corresponding very short headways indicating bunching. The last week of December is a mess with the averages pulling away from scheduled values because many trips were missing.


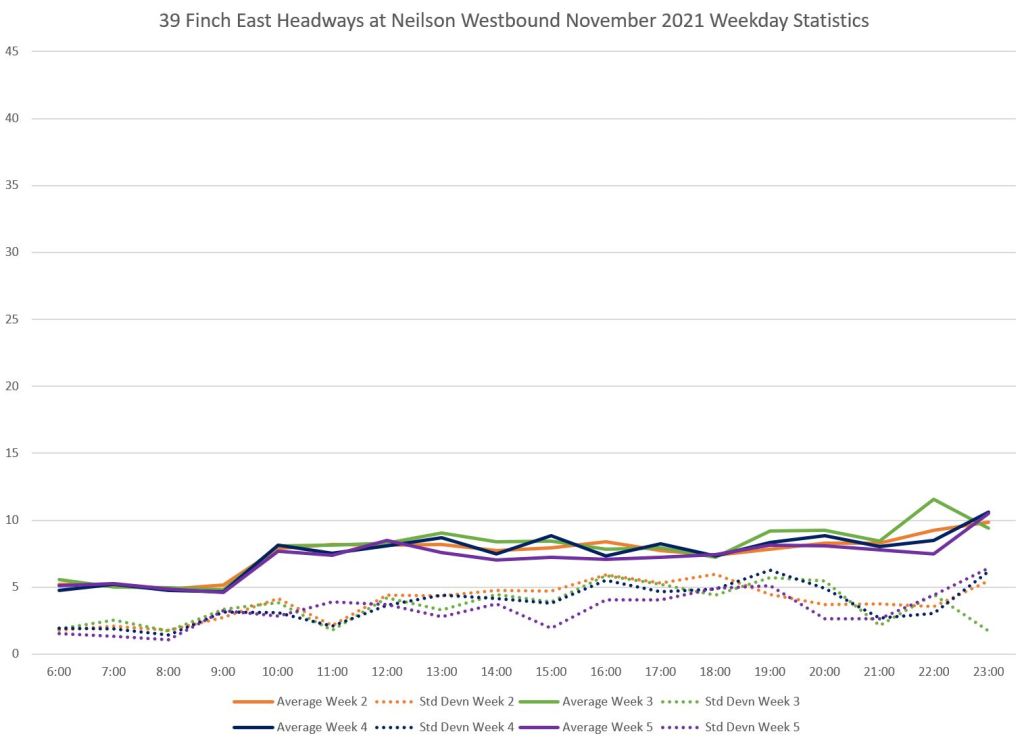
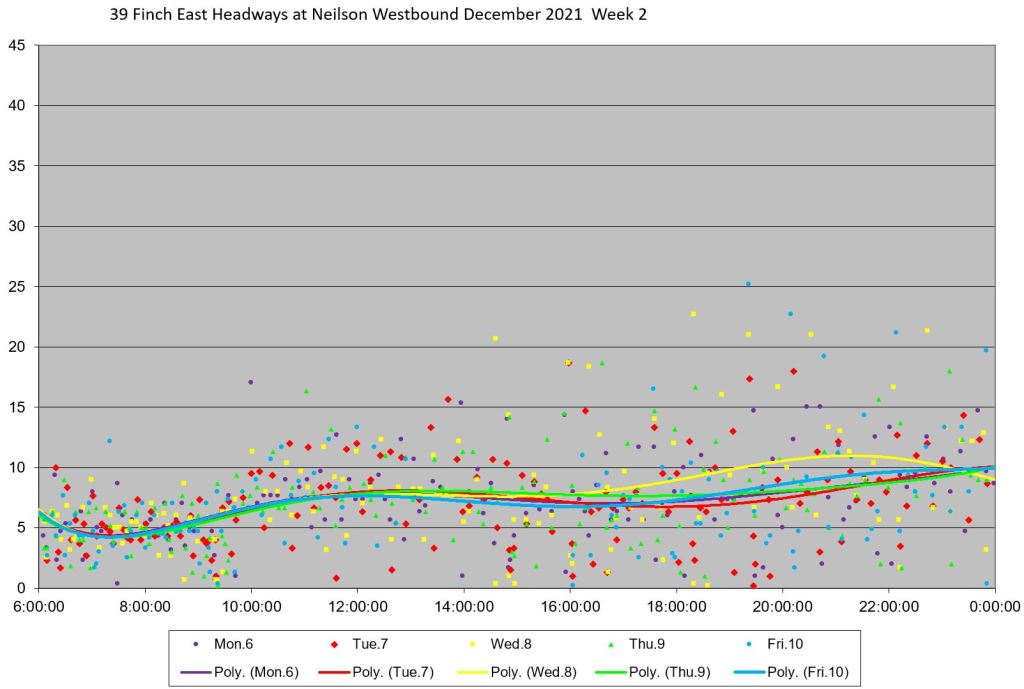
39 Finch East Local from Neilson
At Neilson Road westbound, the other main branch of the service joins in to the route. This shows headways over a wide range with correspondingly high SD values. There is a lot of bunching and corresponding gaps in service even with a “blended” headway below 10 minutes on the schedule.


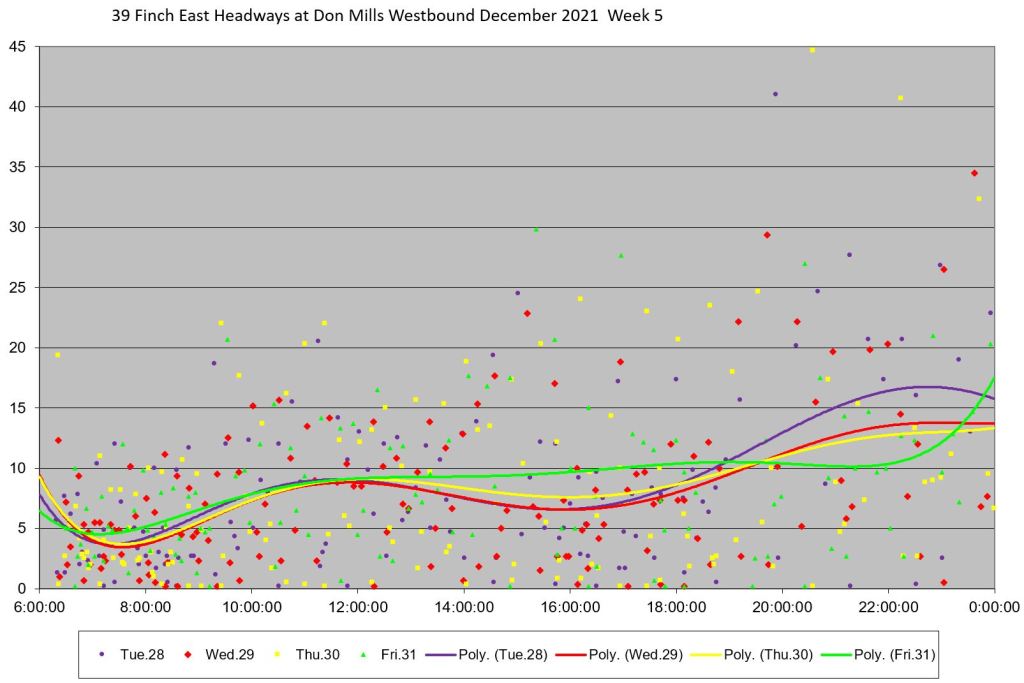
39 Finch East Local from Don Mills
By the time we reach Don Mills Road westbound, the peak period Victoria Park short turns have joined the route. This is visible from the dips in average headways during those periods. However, service operates over a wide range of headways with much bunching.


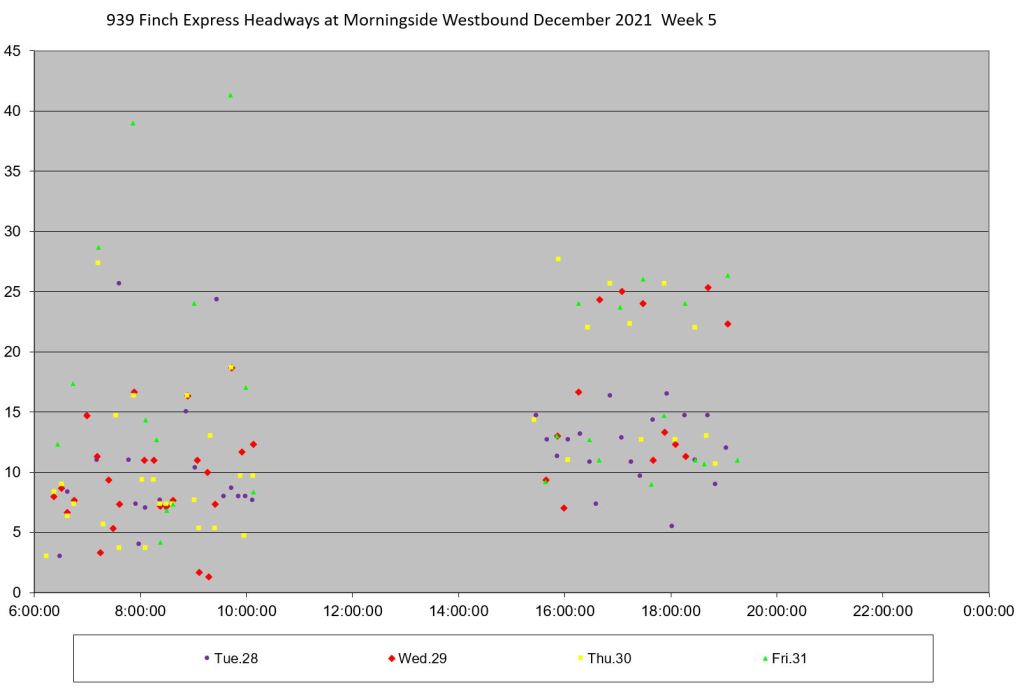
939 Finch Express from Morningside Heights
The express service from Morningside Heights operates only during peak periods. As the charts below show, although the average headways are fairly reliable and close to scheduled values, there is a wide scatter in departure times.


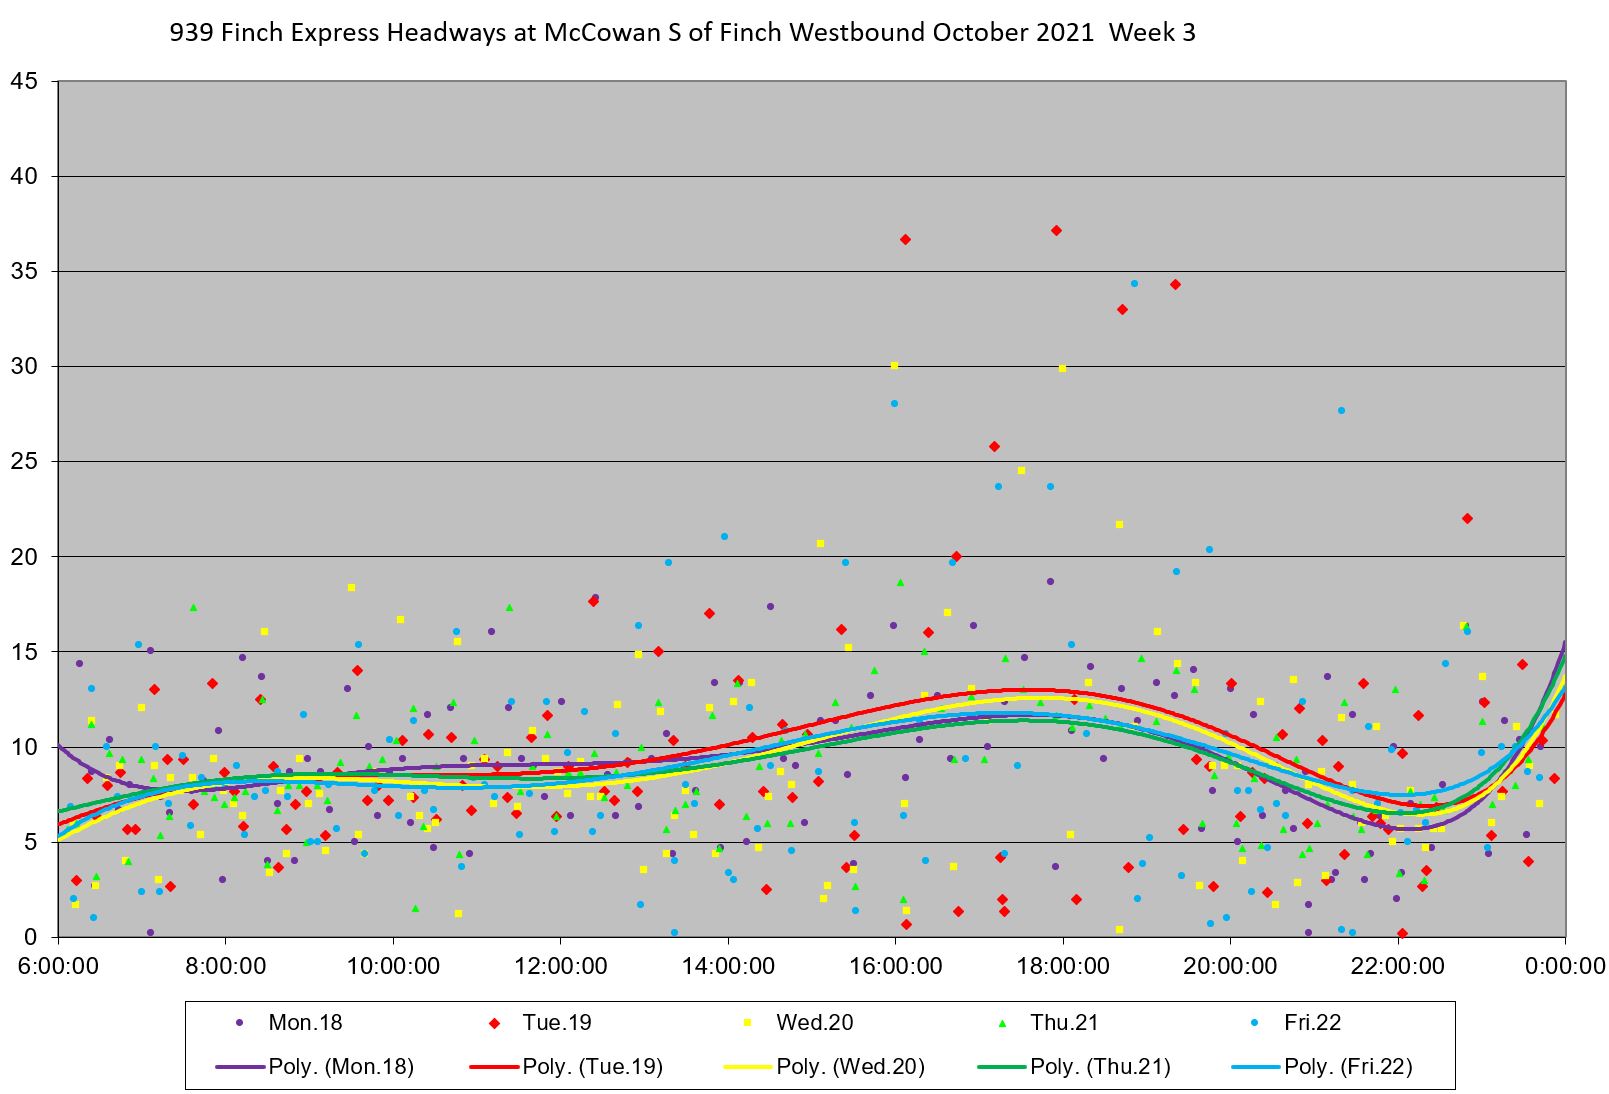
939 Finch Express from STC/McCowan
The main branch of the express service originates westbound from Scarborough Town Centre via McCowan Road. The charts below use a screenline on McCowan south of Finch so that they only include vehicles on the STC branch, not the peak period buses from Morningside (above).
As with other parts of the 39/939 route, there is a scatter in headways with some wide gaps and bunching, although this varies from week to week. The TTC’s “standard” of a six minute window for “on time performance” is rarely met.


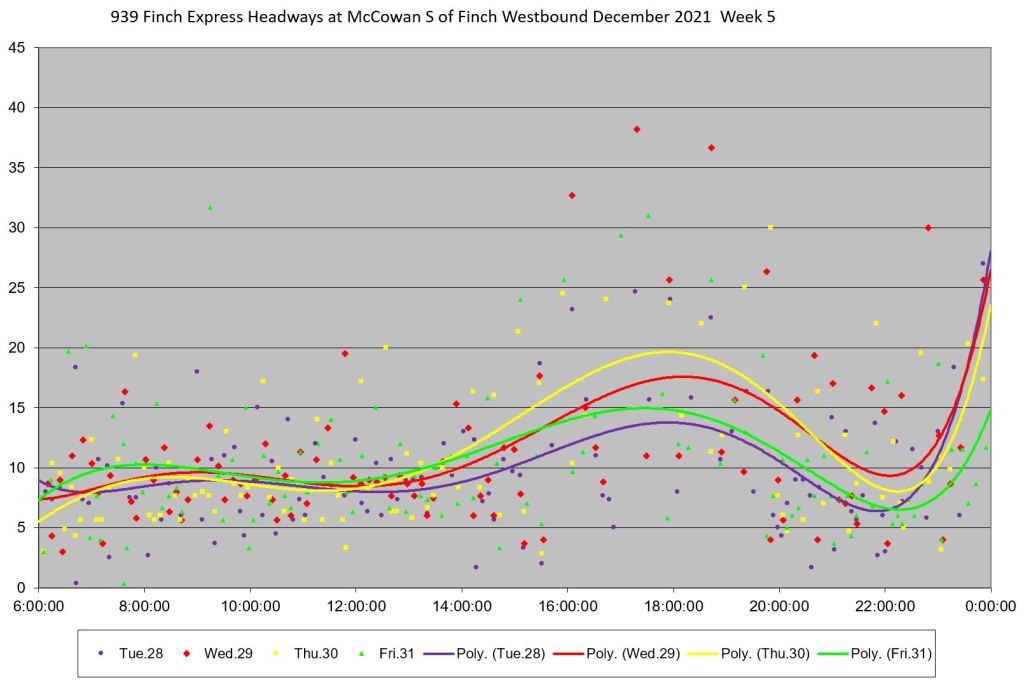
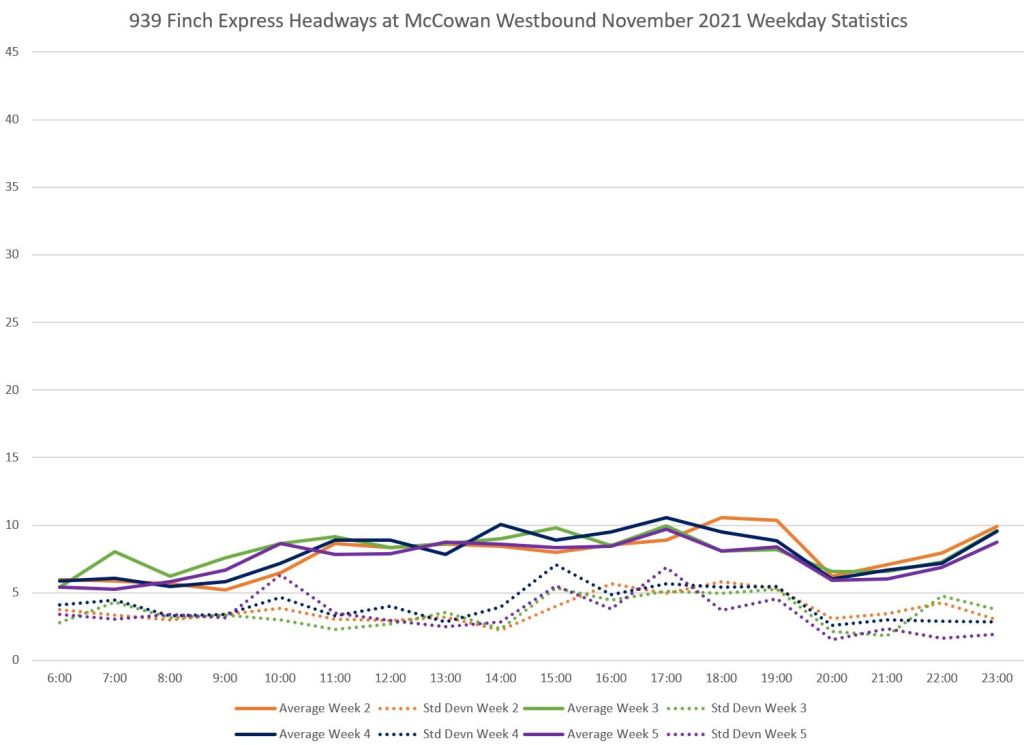
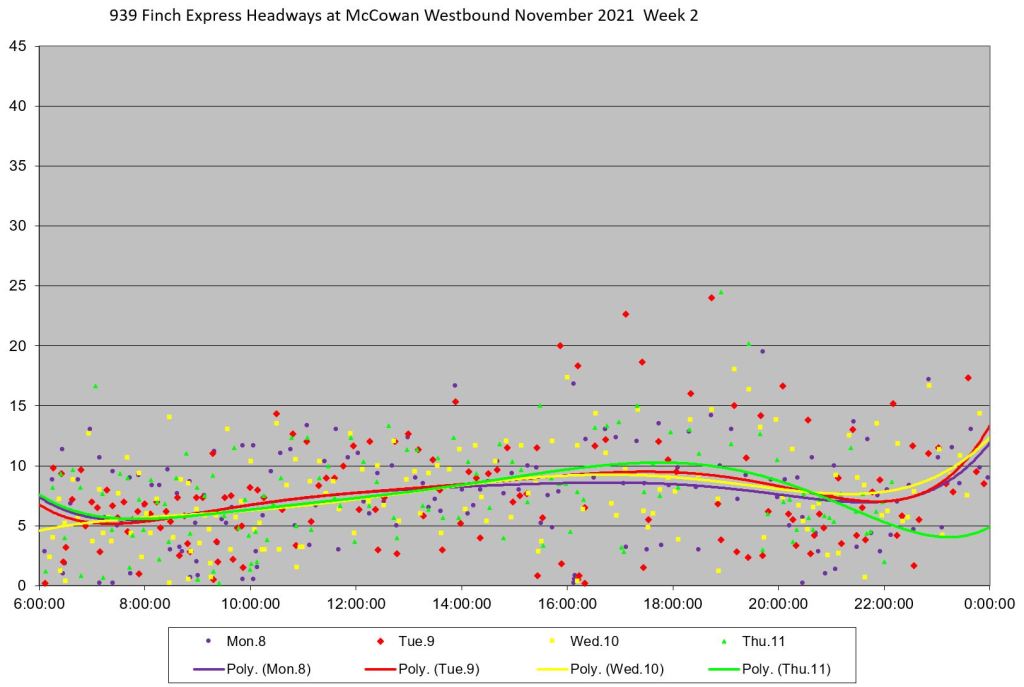
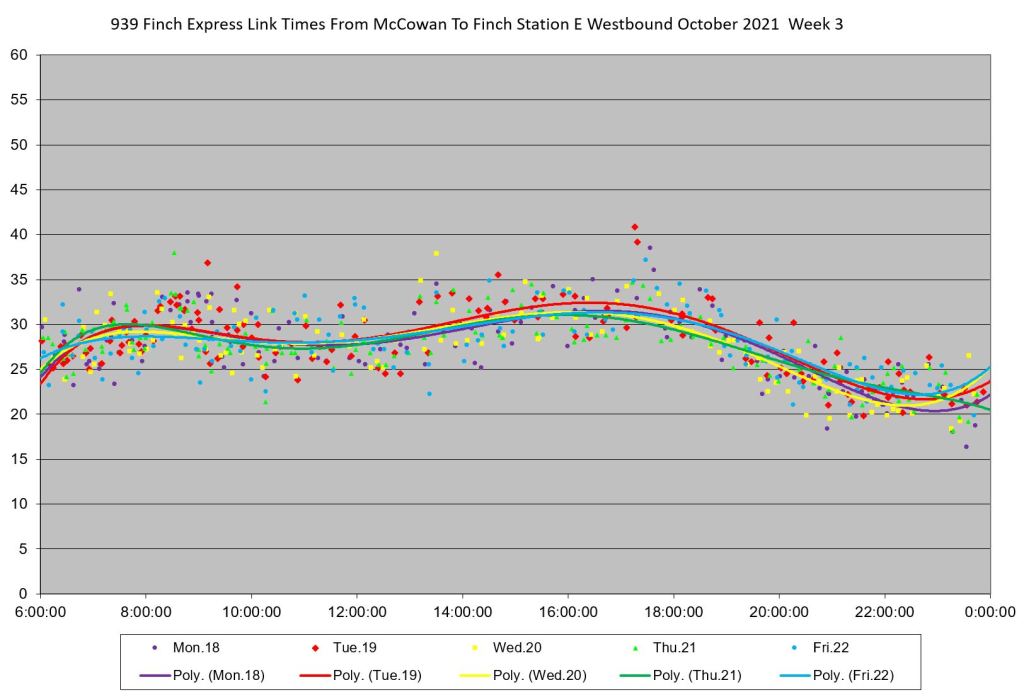
939 Finch Express West of McCowan
West of McCowan there are two “blended” services, although the scatter of headways suggest that many buses run as pairs. As at other locations, service in the latter part of December is more erratic in the evenings, probably due to missing buses.


Weekend Service
Note: Due to the cyber attack on the TTC’s systems and the subsequent recovery efforts, there is little weekend data available for November. Only October and December are shown here for the 39 local service.
Weekend service on the 939 express was suspended from November 25 onward. Only October data are shown here.
39 Finch East Local Eastbound from Finch Station
The scatter of headways on weekends is not as severe as on weekdays although there is some bunching. Maximum headways stay mostly below 15 minutes except during evenings.


39 Finch East Local Westbound from Neilson Road
As with the eastbound service, the westbound headways at Neilson Road are better behaved on weekends although evenings can see wider gaps, and some bunching does occur.


939 Finch Express Eastbound from Finch West Station
Weekend headways eastbound from Finch West Station are better-behaved than their weekday counterparts. Some missing buses are evident from headway values at about double the average with no corresponding low value (Sunday October 10, for example).


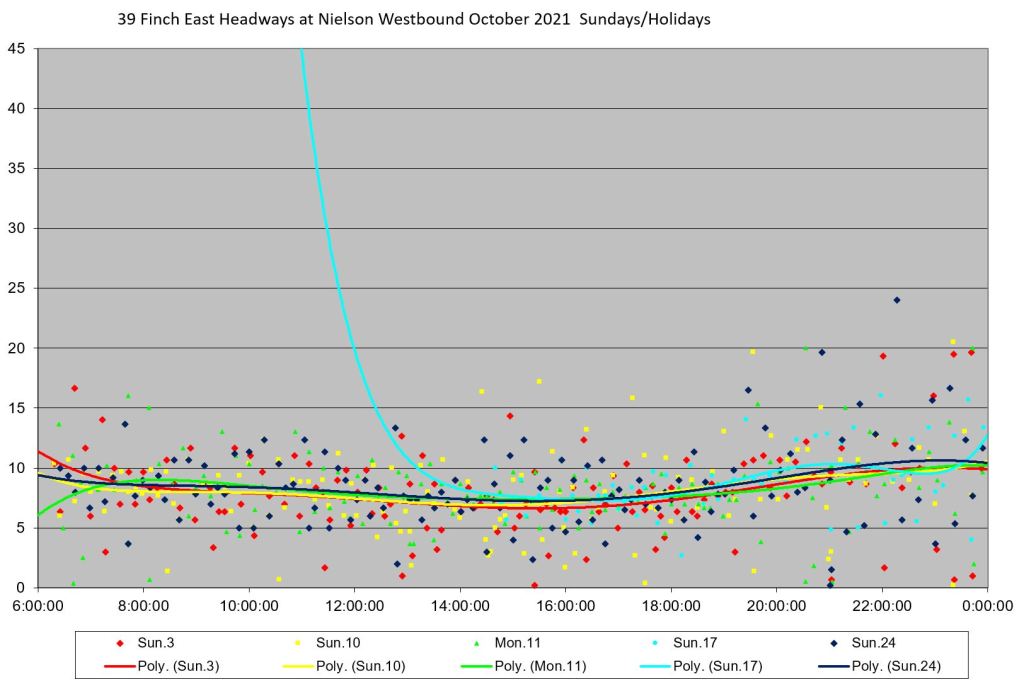
939 Finch Express Westbound from McCowan
Headways westbound at McCowan and Finch are more scattered than the eastbound values shown above with many short headways indicating bunching (for example, Saturday, October 2, and Sunday, October 24). (The oddly shaped trend line for Sunday, October 17 is caused by the absence of data for the first part of that day.)


Local vs Express Travel Times
For riders on long routes like Finch, travel time can be a significant part of their journey. The perception that a vehicle is not moving quicker, that it spends its time stuck in traffic or sitting at stops, especially if one does not have a seat, works against transit as an attractive mode. Various schemes including transit priority at selected locations (signal priority, queue jump lanes) or over an extended portion of a route (express buses, reserved lanes) attempt to address this.
Finch between Yonge and McCowan, the portion where 939 operates “express”, is one of the candidates for “red lane” treatment, although it is not at the top of the priority list.
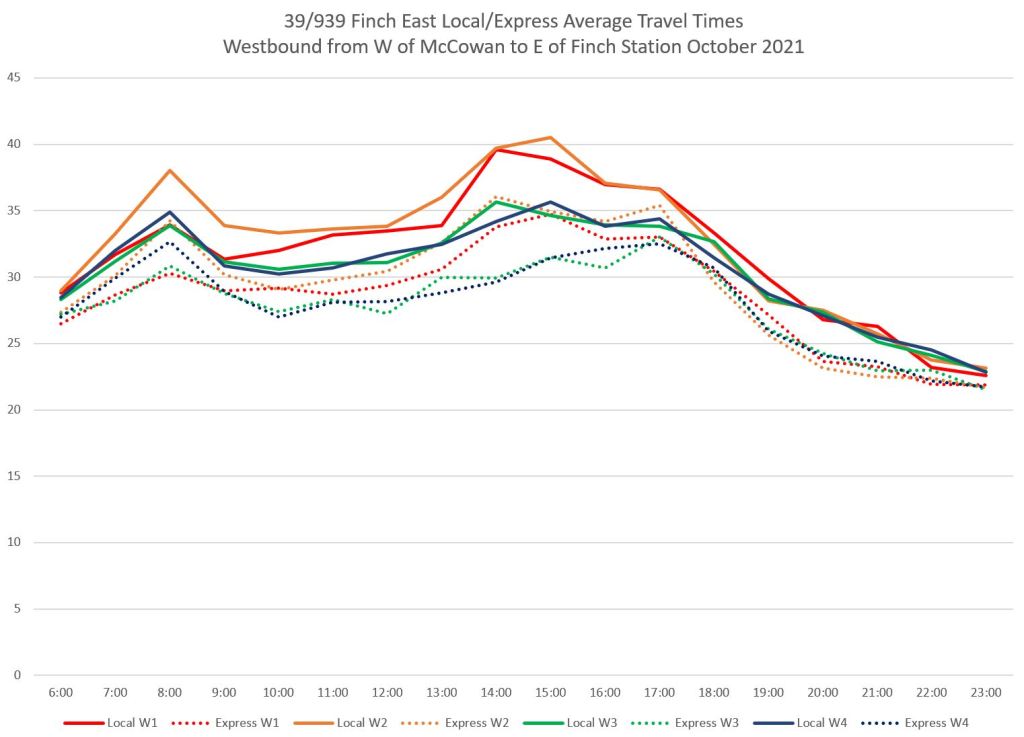
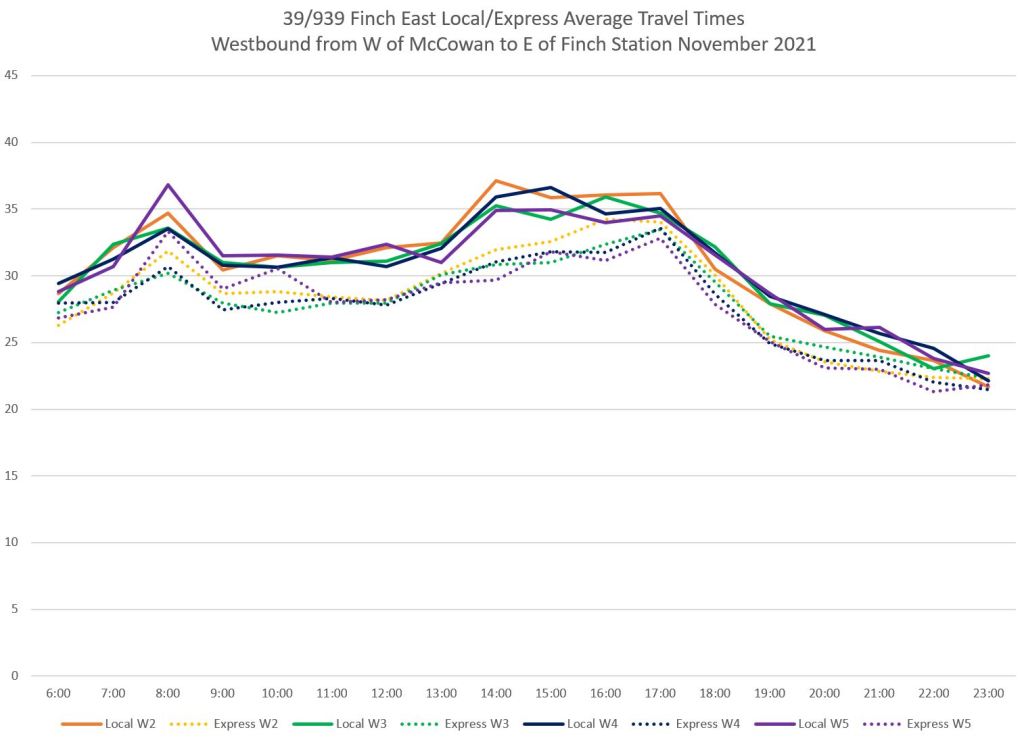
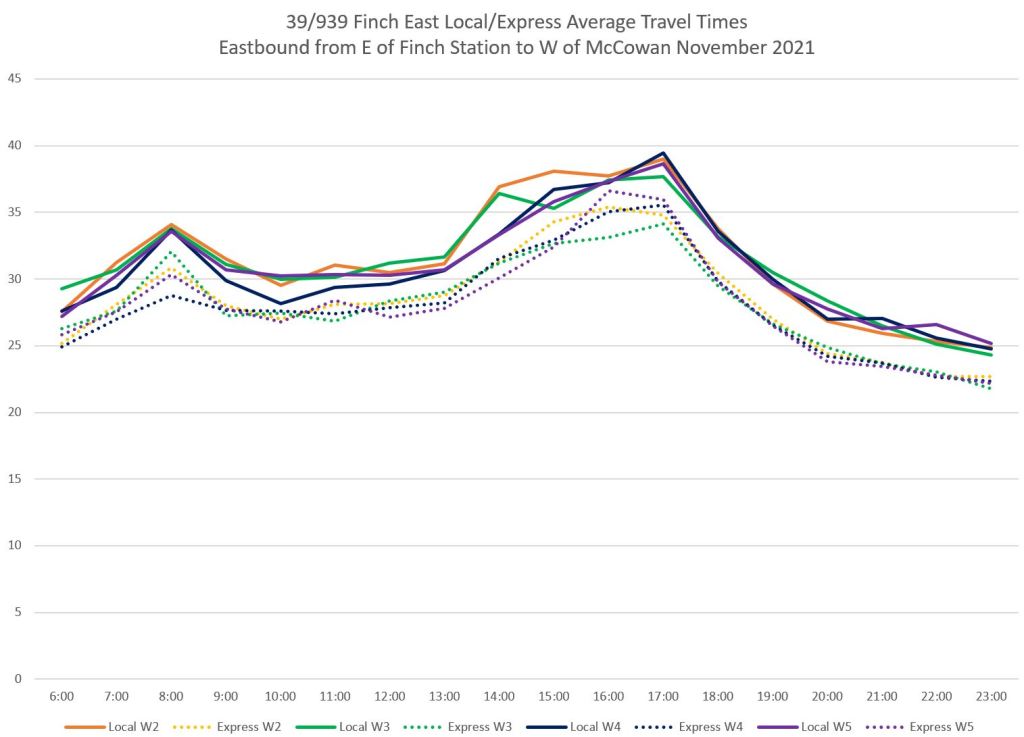
The charts below compare express and local travel time averages over this segment. Local values are shown as solid lines while the express values are dotted. Of note:
- The first two weeks of October show higher values for both express and local trips in both directions. Later in this article, in a detailed review of a few days, we will see that this was primarily caused by chronic delay near Leslie Street. (The problem actually started midway through September and the last two weeks of that month show a similar rise in travel times to the first two weeks of October.)
- Peak effects are stronger eastbound than westbound and in the pm versus the am.
- In the last week of December, much of the eastbound peak disappeared. This corresponds to both the normal holiday decline in traffic and ridership, but also to the onset of the Omicron-related restrictions.
- Express averages were five minutes or less below local values, or about one sixth on a half-hour journey.


Travel Time Reliability
An important lesson from the King Street transit priority scheme was that reliable travel times are important in the own right even on a busy local service. Specifically:
- Reliable travel times reduce the likelihood that service will become badly disorganized and require many short turns simply to stay “on time”. This benefited the whole route, not just the portion with the transit mall.
- In turn, vehicles could be expected to arrive reasonably promptly, without severe bunching and gaps, and get riders to their destinations on a consistent basis. This reduced wait times and crowding caused by gaps.
- Although the actual change in travel time through the core was small (and almost nil in the am peak), the variability in travel times was substantially reduced. Benefits extended beyond the peak periods into midday, evening and weekend service.
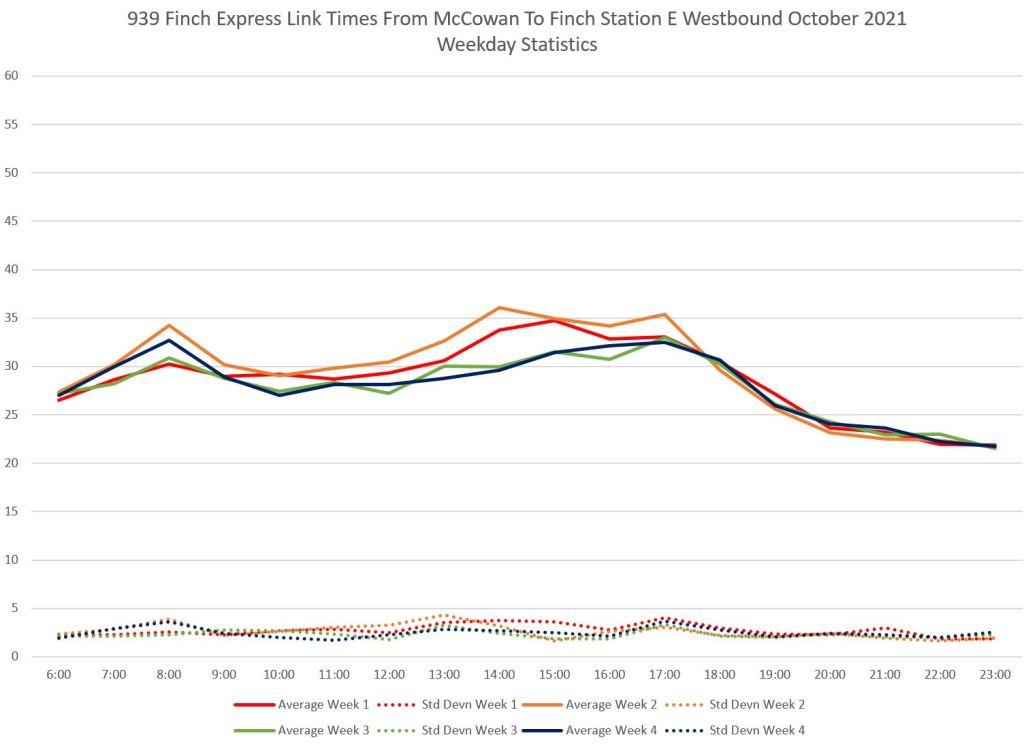
By contrast with the headway charts above, the standard deviation values for travel times are generally low showing that there is less variation especially compared to the much larger values of travel times versus headways. This is an important difference from a route like King where reducing variation played an important role in improving service.
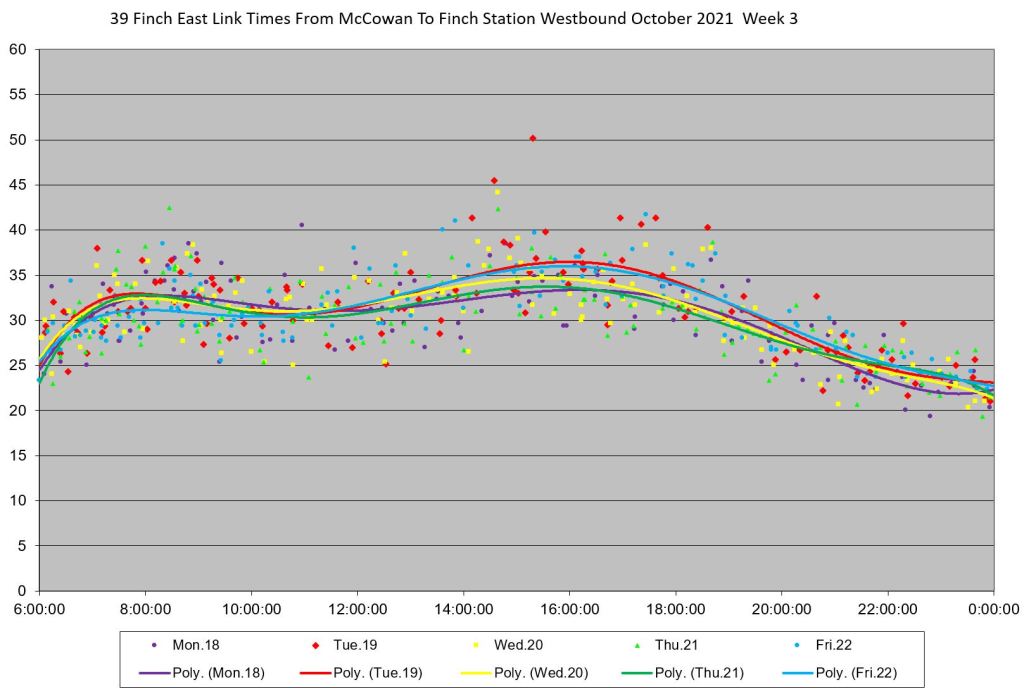
October 2021 saw very different route behaviours in the weeks 1 and 2, versus weeks 3 and 4, due to persistent, all-day delays that both stretched travel times and widened their variability. As noted earlier, this problem actually began in mid-September. The details are examined later in this article.
Weekly Averages October


Week 1 vs Week 3 October
Westbound Local

Eastbound Local


Westbound Express

Eastbound Express


Weekly Averages November
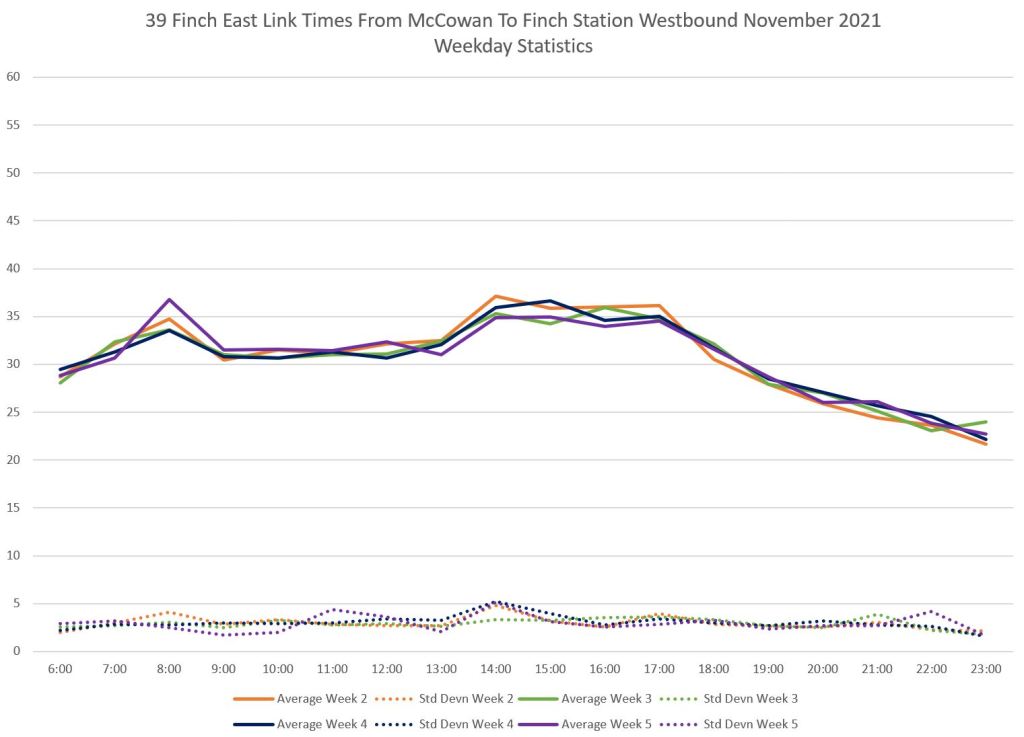
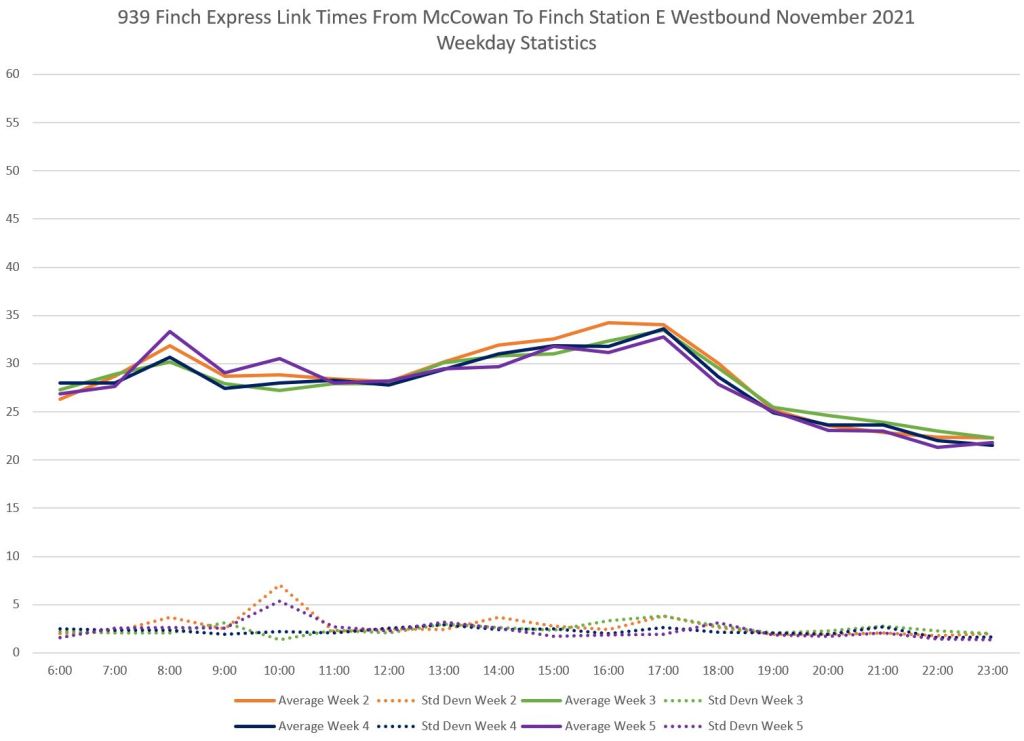
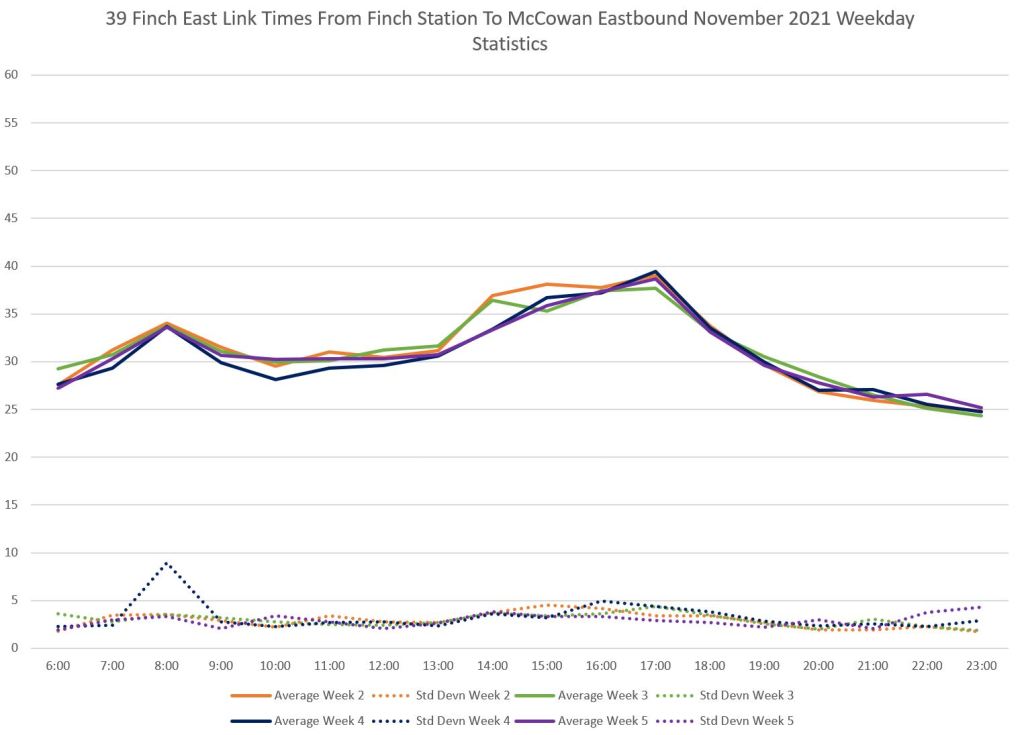
In November, the travel times were quite consistent. There is some rise in averages during peak periods, as one would expect, but not a substantial one. Both the local and express services show similar behaviour separated mainly by the shorter time needed for express trips.
Westbound


Eastbound


Weekly Averages December
Travel times in December were generally well-behaved compared to earlier months. The last two weeks corresponded both to the Omicron-related decline in traffic and ridership, as well as the typical holiday period reduction.
Westbound


Eastbound


Travel Time Evolution From 2020 to 2022
In a previous article, I examined the change in travel times with the onset of the pandemic in March 2020 and the degree to which this lasted over time. The immediate effect was to shave the peaks off of the travel times, notably in the pm peak, but much of this saving has been lost over the ensuing two years as traffic and ridership returned.
In a future article, I will update this review with data to the end of March 2022.
Detailed Operating Charts
This section includes charts showing the movement of all vehicles on routes 39 and 939 for selected days as examples of what can go wrong, and what “ordinary” days look like.
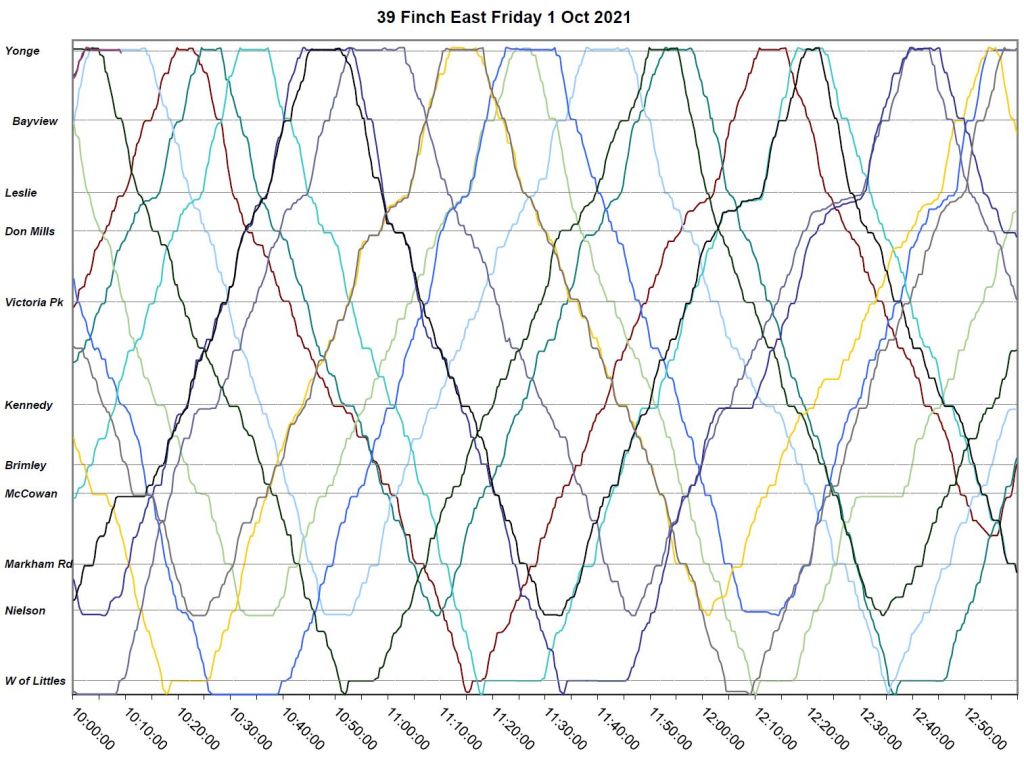
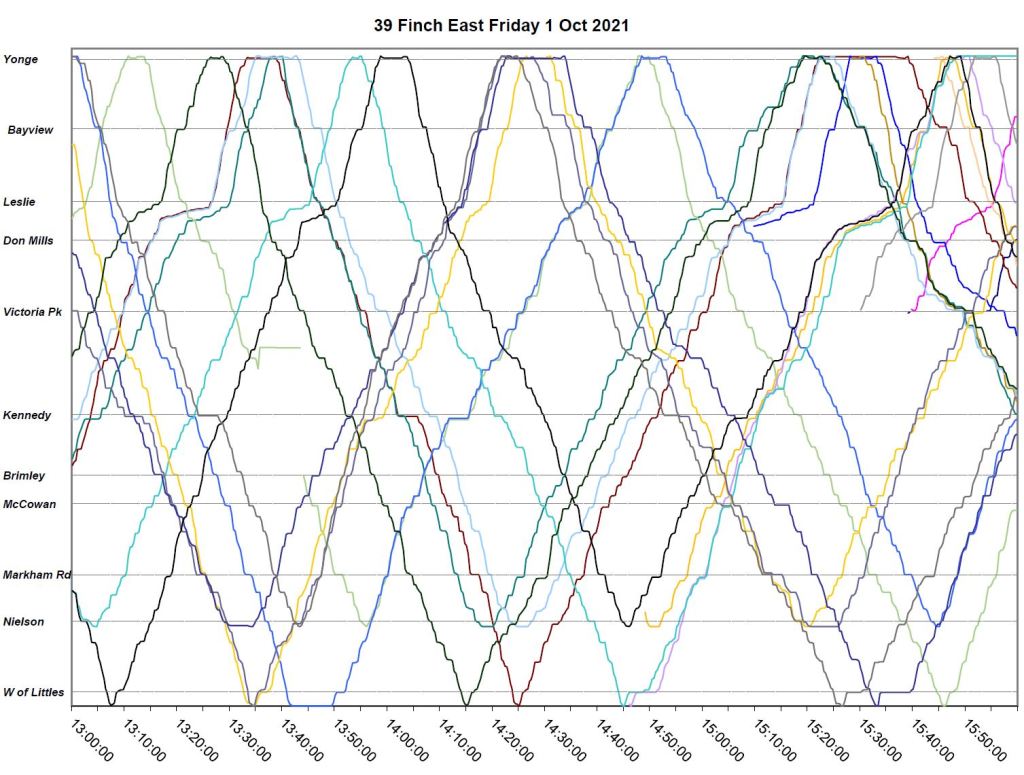
Friday, October 1
39 Finch East
On October 1, the delays westbound at Leslie begin to appear at midday and they continue until early evening. Although they are consistent, they are not as bad as on some other days (see October 7 below). Even with the longer travel time, buses have time for a layover at Finch Station (horizontal lines at the top of the charts).
A much more severe problem is bunching and this starts to develop in the early afternoon with a group of buses travelling west to Finch Station where they arrive at about 2:20pm. They travel east again as a block, and at the same time new westbound bunches are developing.
The pattern continues through the pm peak with a pack of buses running together surrounded by wide gaps in service. There is no pervasive delay, but also no attempt to break up this pack and spread them into the large gap they create. Service resumes a fairly normal pattern in the late evening.


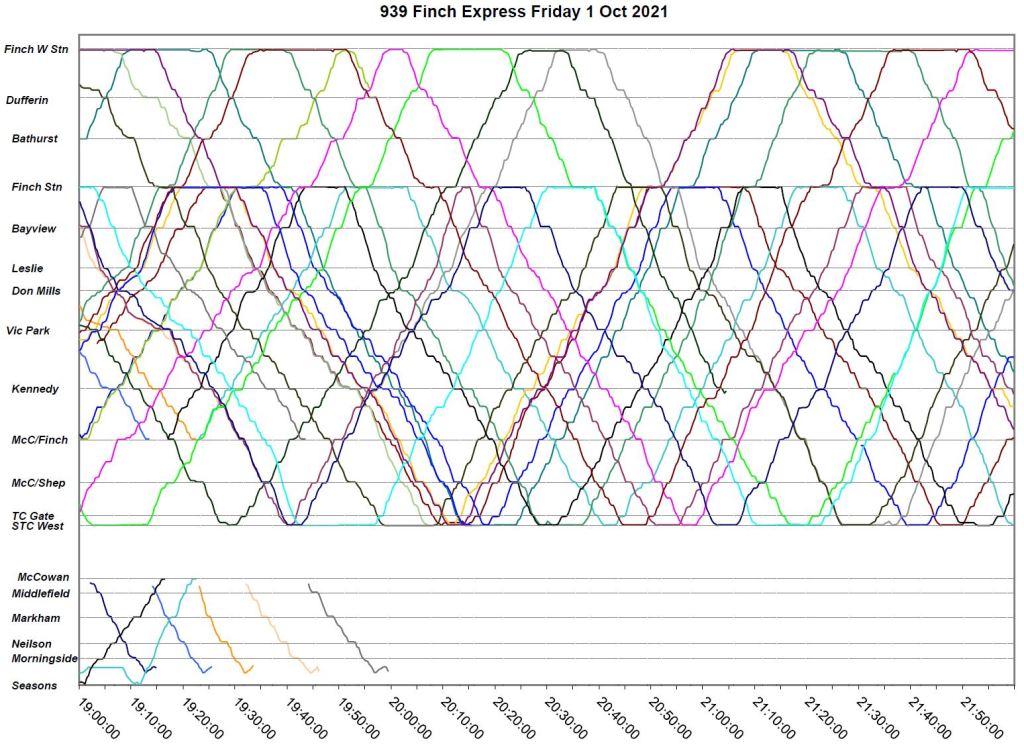
939 Finch Express
For the express service, there are two important differences in the chart layout compared to the local service:
- The top segment maps operation between Yonge Street and Finch West Station.
- There is a separate bottom segment to map buses branching off from the main STC service continuing east on Finch during peak periods.
The same slowdown westbound to Leslie appears here as on the local service, but this does not, in general, prevent buses fro taking layovers at terminals. There is some bunching and gaps, but they are not as severe as on the local service.


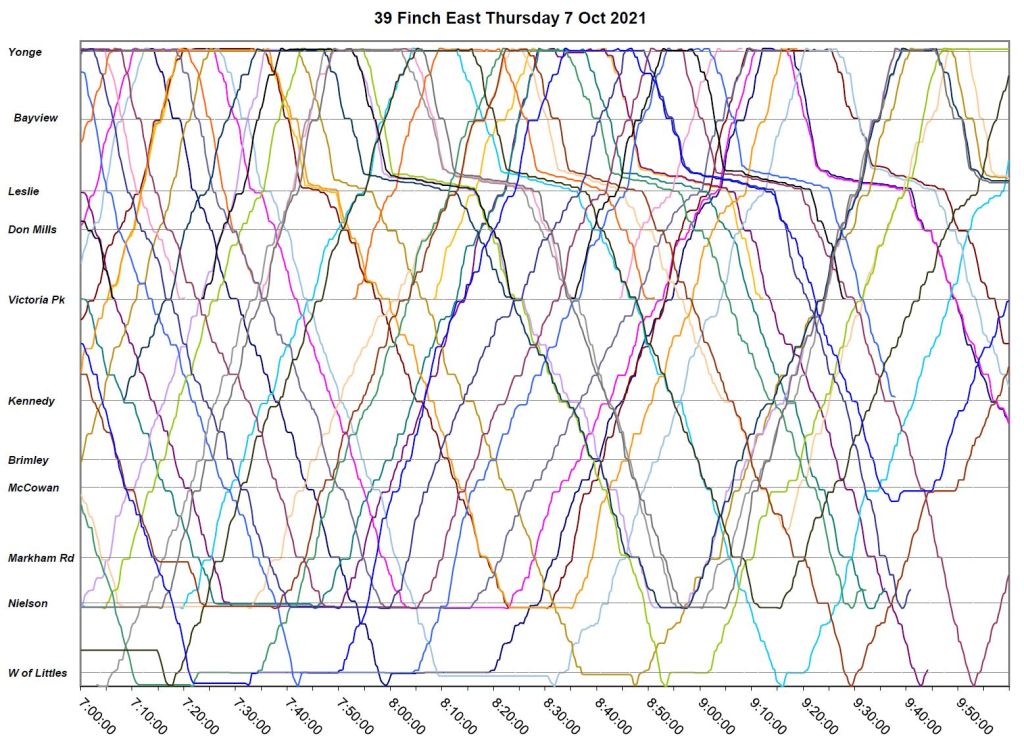
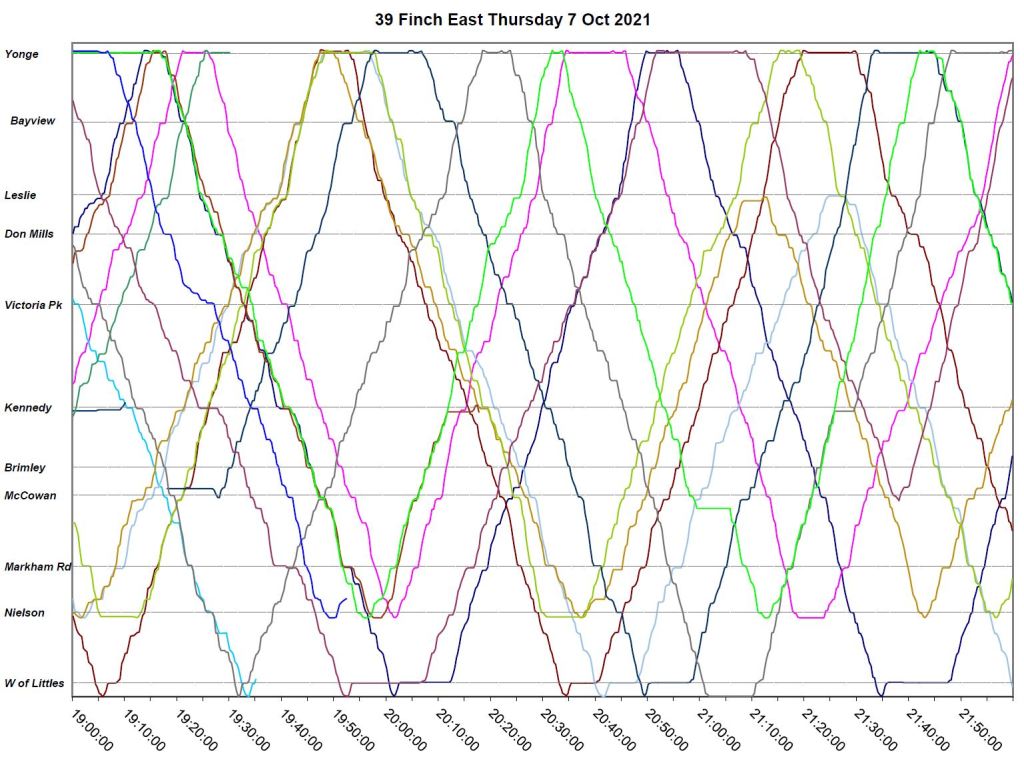
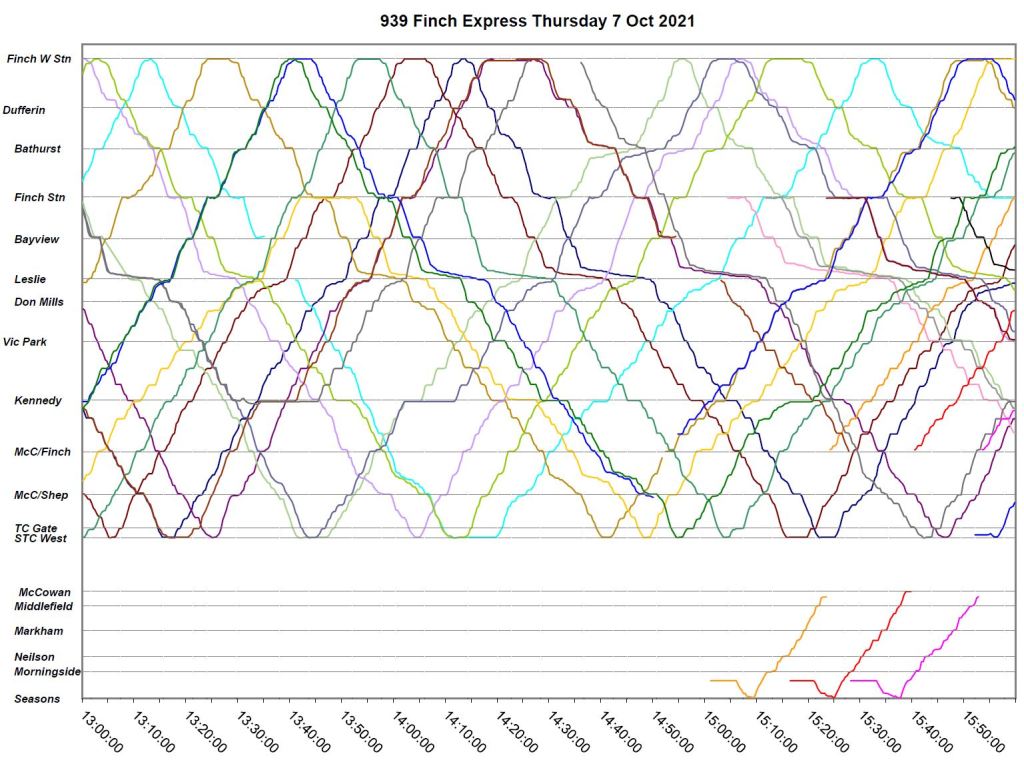
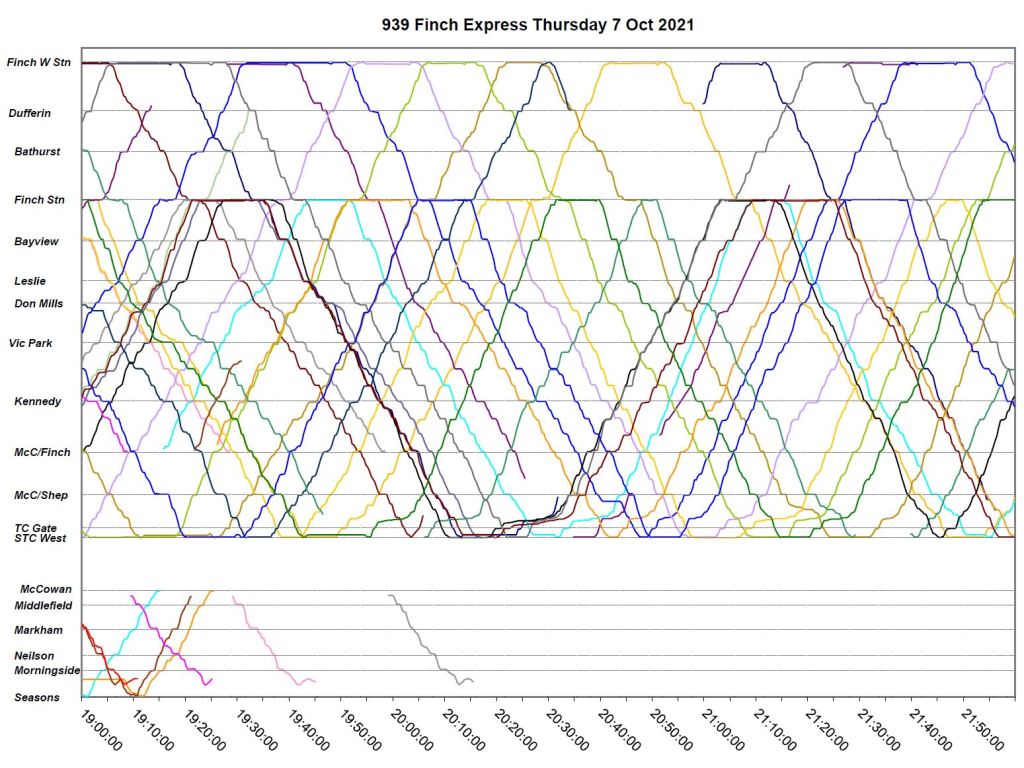
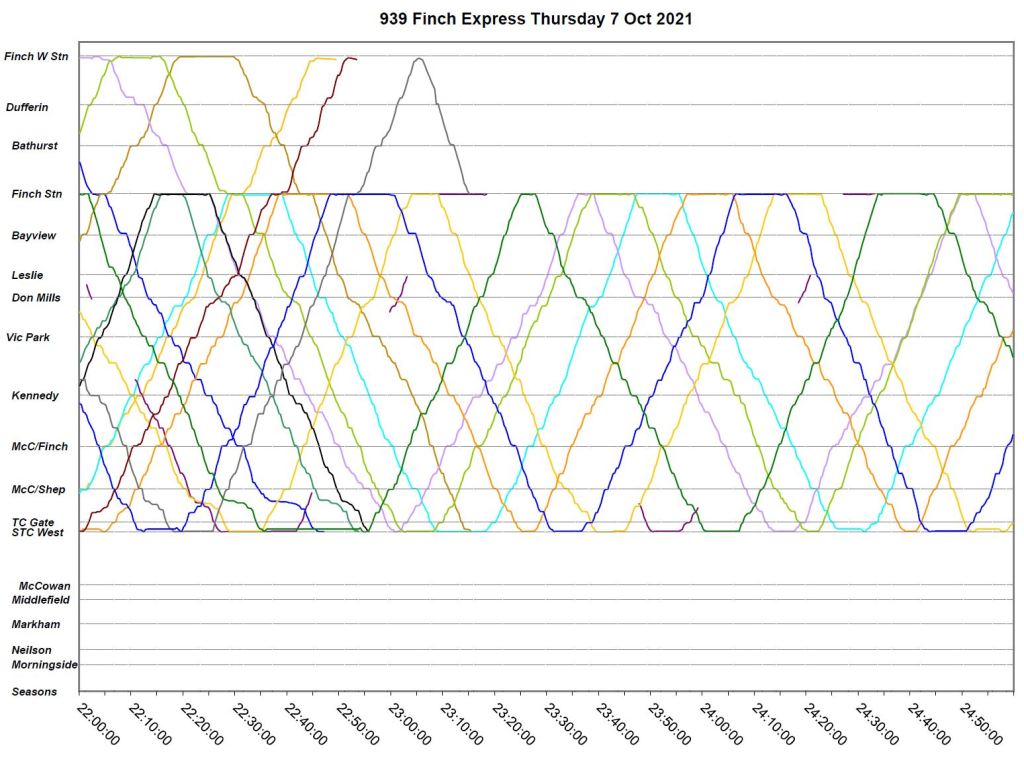
Thursday, October 7
In the second week of October, the delay at Leslie is now eastbound, and it begins early in the day, about 8am, and persists through the early evening. Bunching and associated gaps are common from the late morning onward.
39 Finch East


939 Finch Express
As with the local service, the delay eastbound at Leslie begins during the am peak. There is a wide gap westbound between 8:30 and 9:00am, but this sorted out by the time the service returns eastbound. As on October 1, the gapping and bunching is not as severe on the express service as on the local.


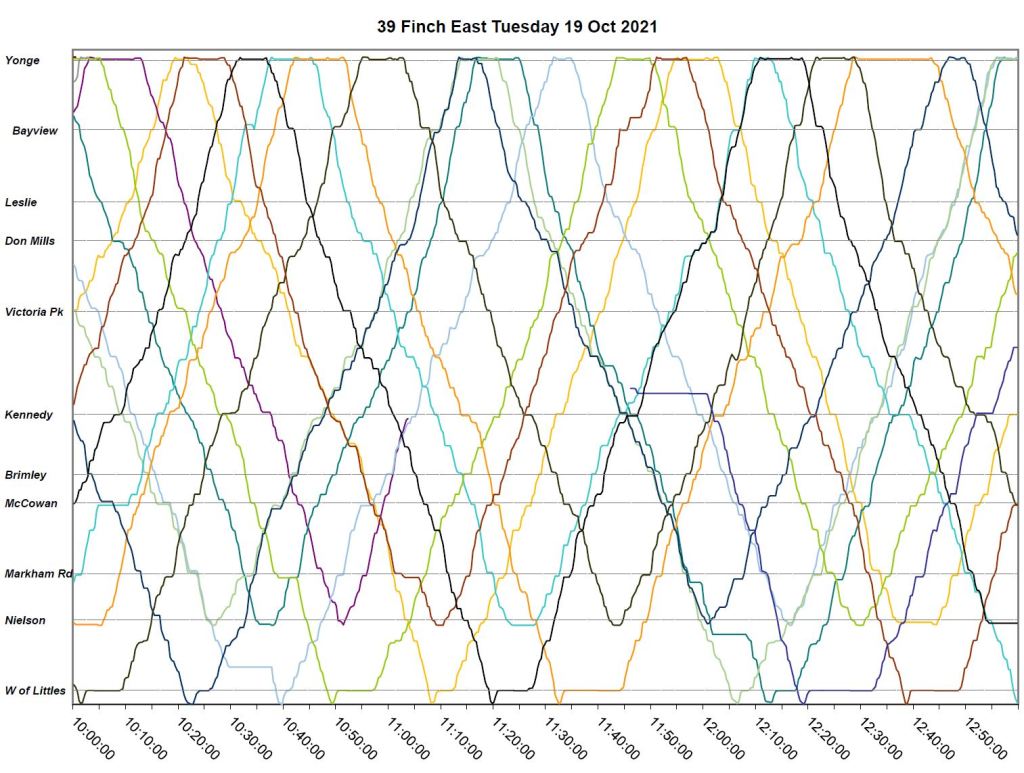
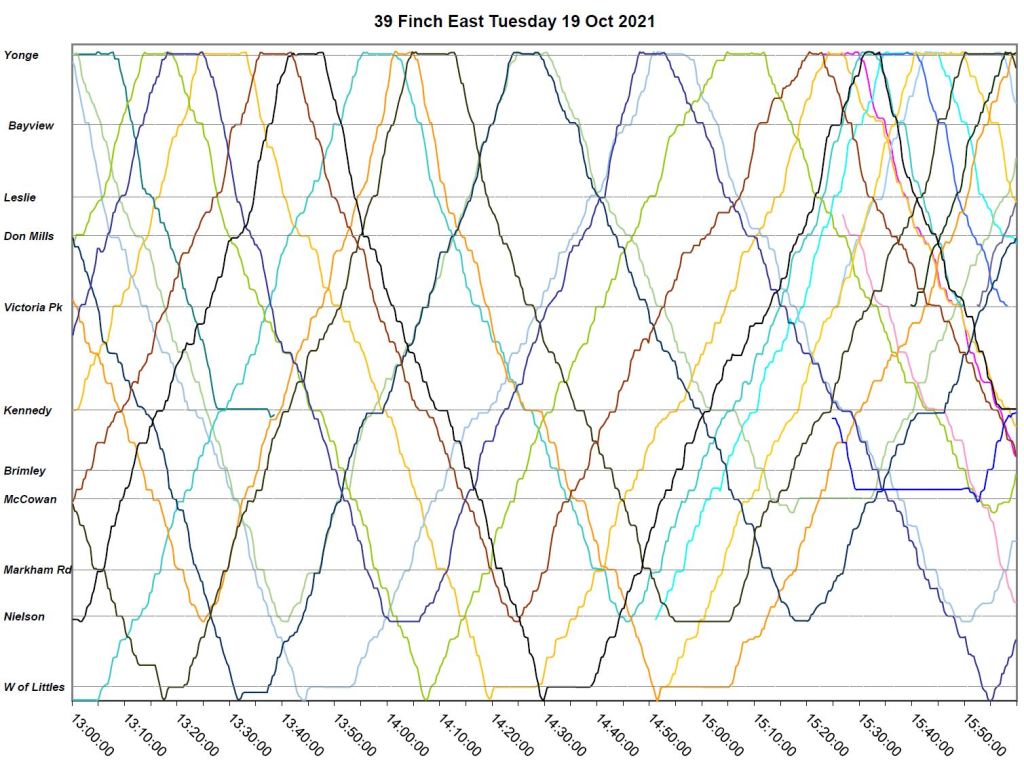
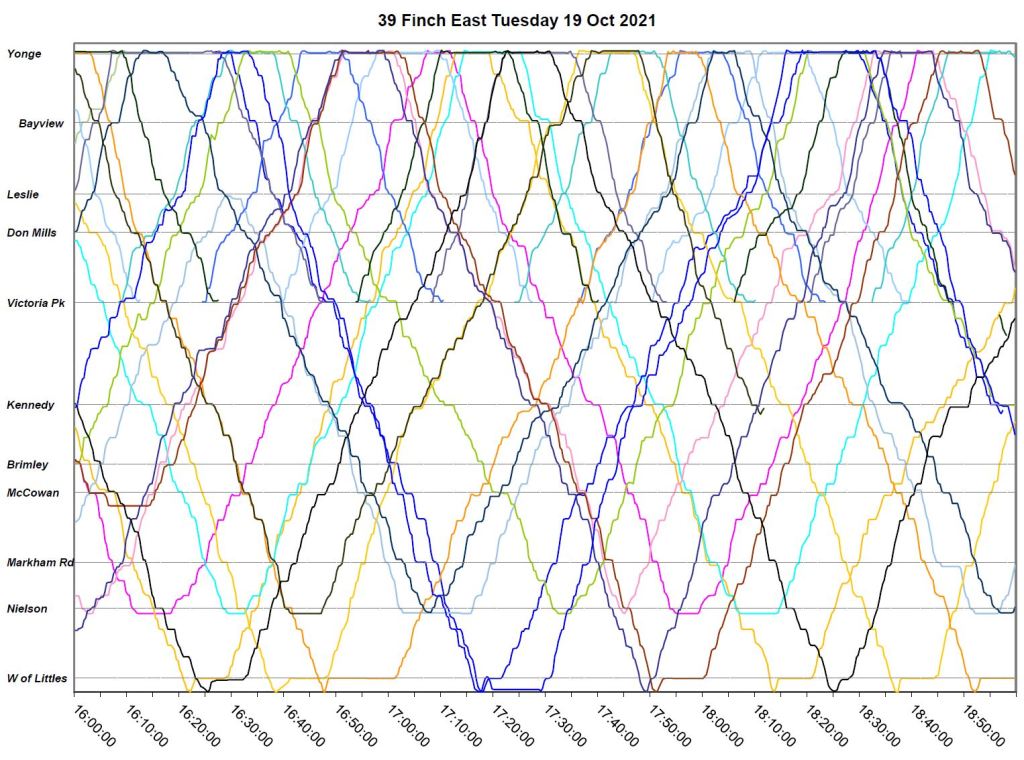
Tuesday, October 19
By mid-October, there were no pervasive delays on Finch East, although they did appear on Finch West at Bathurst affecting the 939 express service.
39 Finch
Local service encountered no major delays. A few short turns are visible in the chart, but the biggest problem is buses running in pairs either eastbound from Finch Station or westbound from the point where two branches merge at Neilson Road.


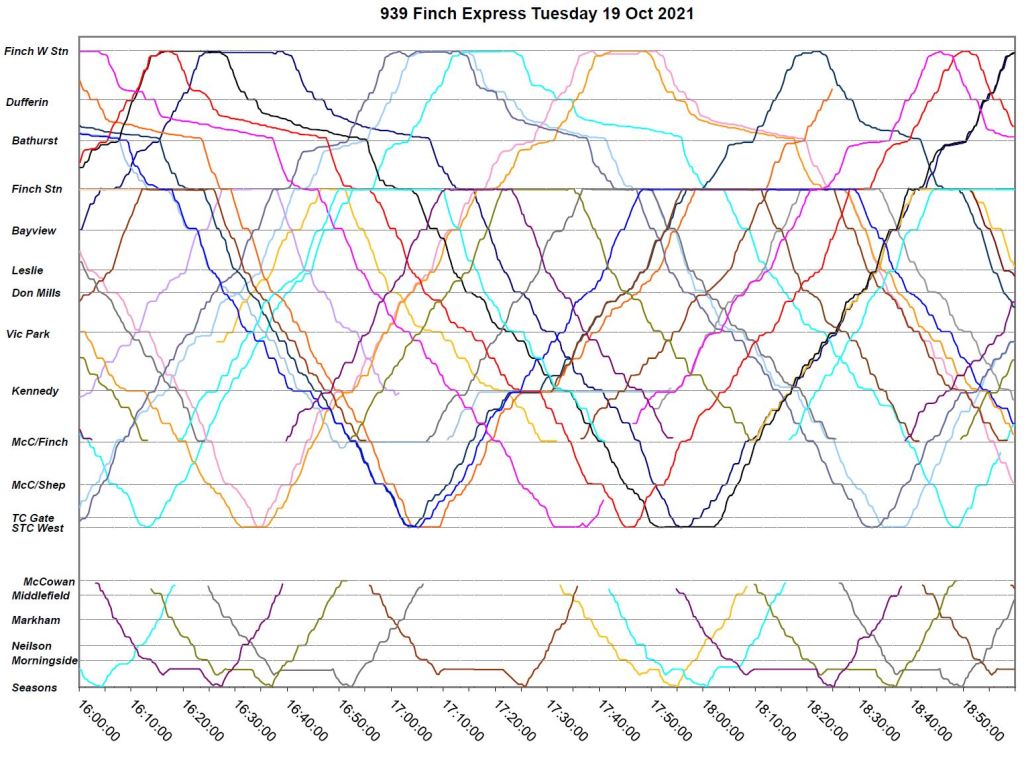
939 Finch Express
Service on the Finch Express ran fairly smoothly except for delays westbound to Bathurst in the morning and eastbound to Bathurst in the afternoon. One bunch of buses develops westbound from STC after 3pm and stays together for a few trips. Some gaps in the service appear to have been caused by Finch West trips short turning at Yonge Street.


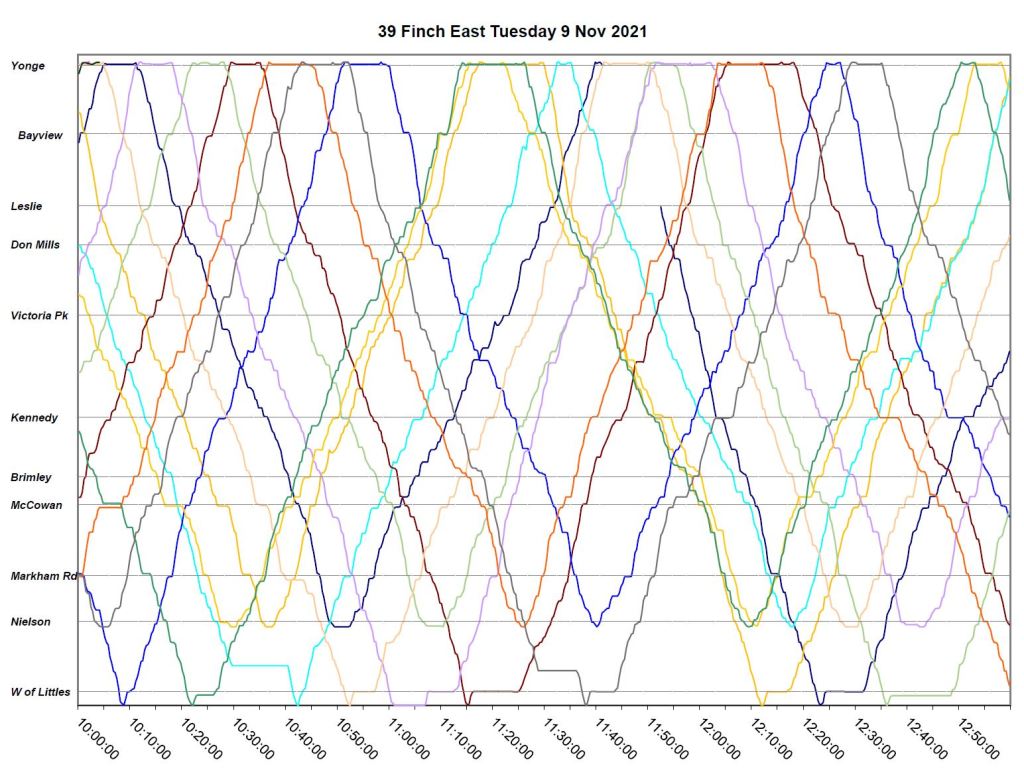
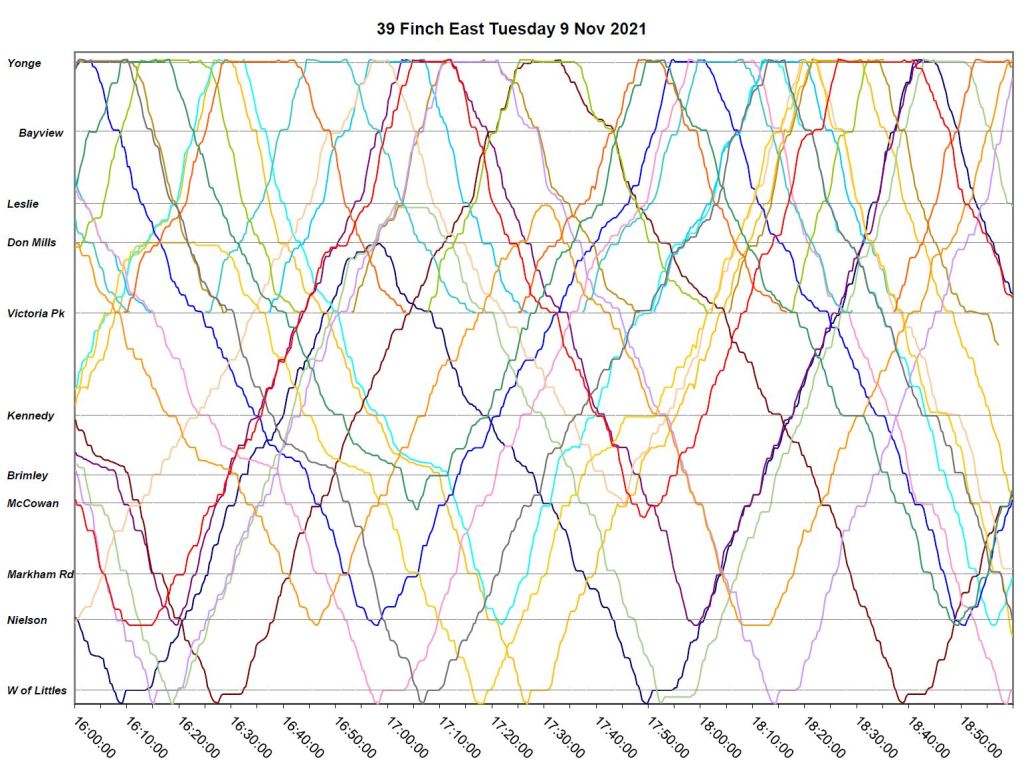
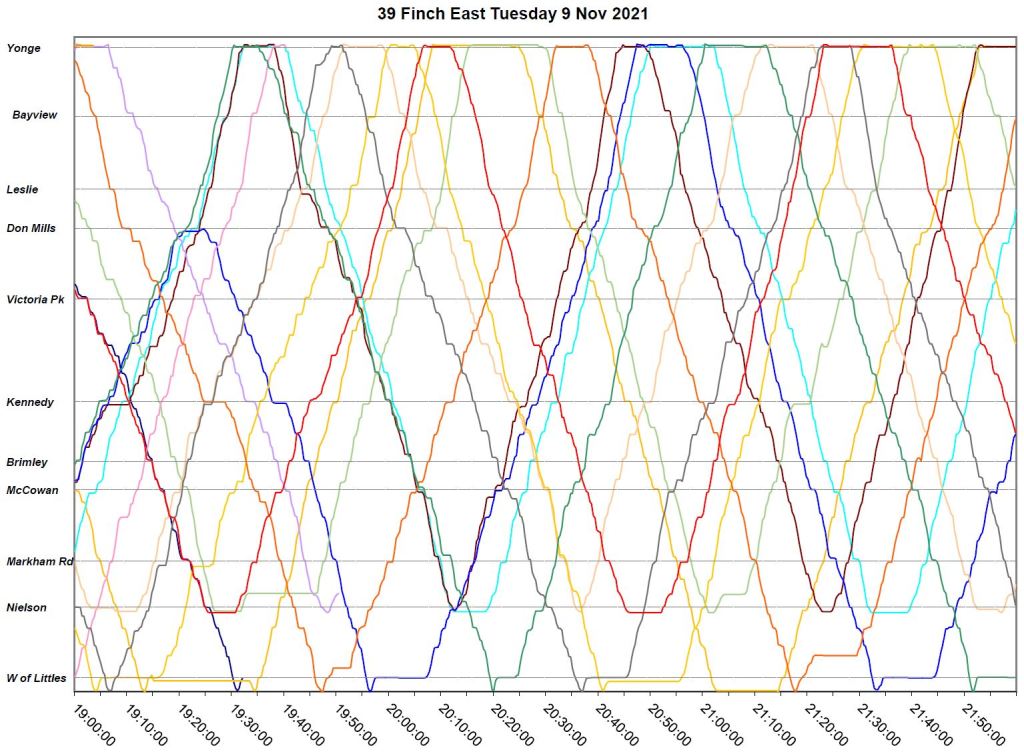
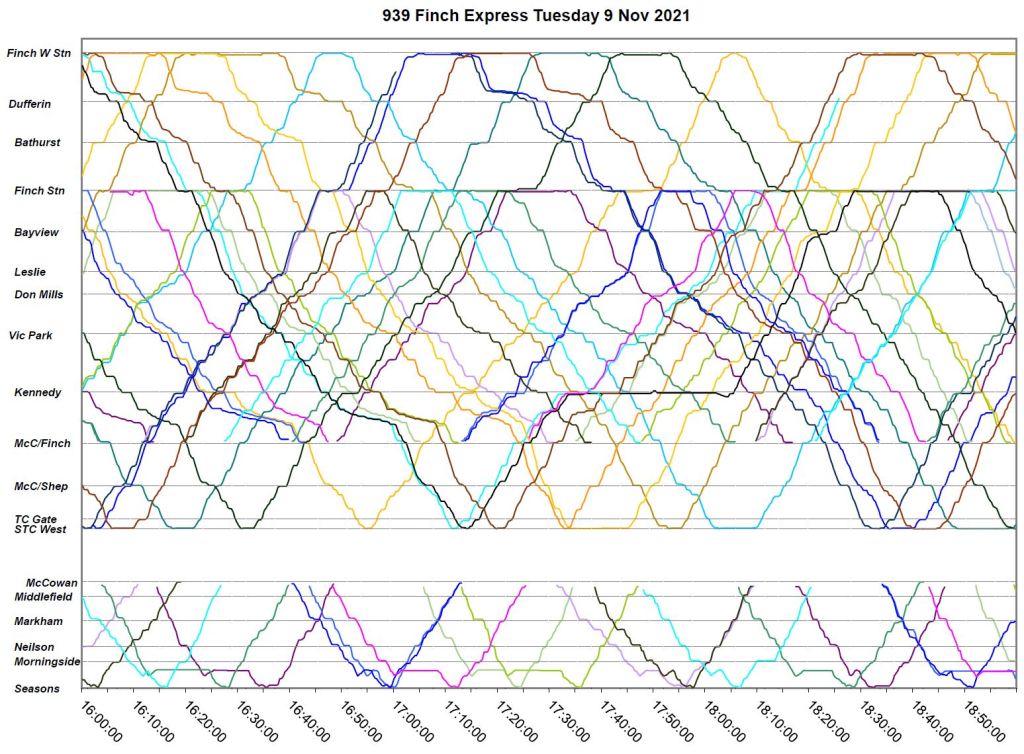
Tuesday, November 9
39 Finch East
November 9th begins with fairly reliable service through the AM peak. There is a small amount of congestion westbound at Bayview and eastbound at Brimley.
As the day goes on, bunching begins to occur in both directions with the most severe problem beginning after 2pm. Buses are running in pairs, and by 3:30pm this culminates in two parades of buses leaving Finch Station eastbound. A parade of five buses runs westbound from Neilson at about 4:40pm. One of these short turns at Don Mills and one at Leslie returning eastbound to fill a wide gap.
Bunching remains a problem through the pm peak and into the early evening.
Most trips have time for terminal layovers suggesting that the erratic behaviour is not a product of inadequate running time in schedules.


939 Finch Express
The express service shows less bunching than the locals, but it is still present. Congestion problems appear at similar locations (Bayview westbound, Brimley eastbound) as well as eastbound from Finch West Station in the pm peak.


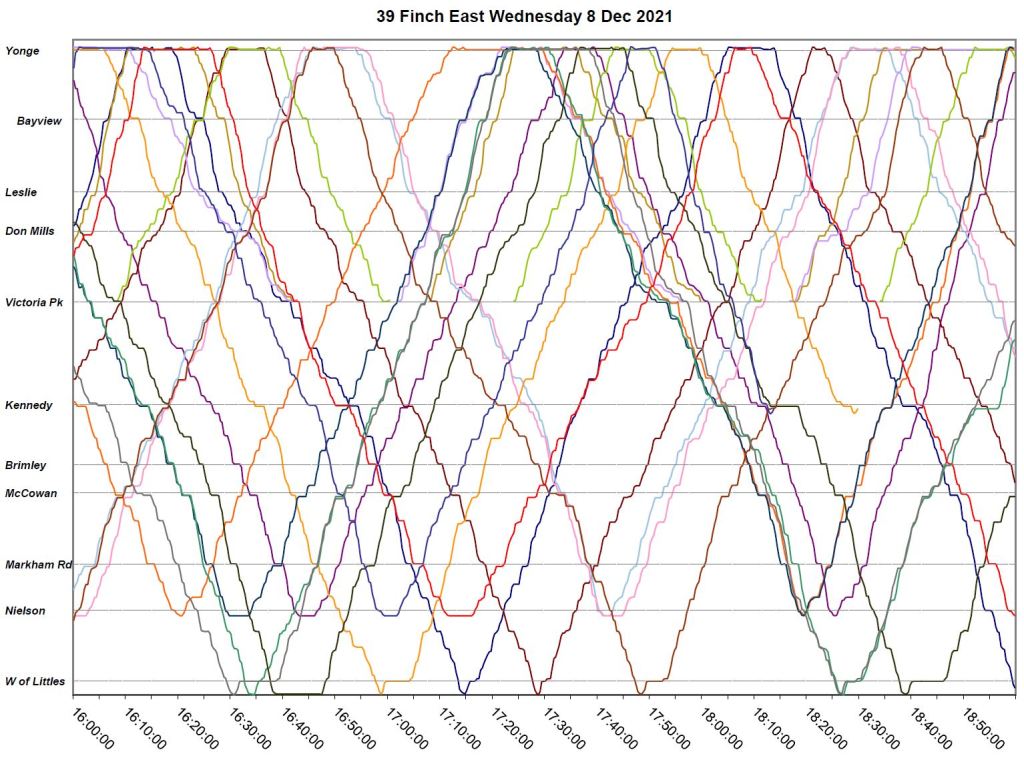
Wednesday, December 8
39 Finch East
Service on December 8 is fairly reliable through the AM peak and midday although bunching does develop through the afternoon and PM peak with a wide eastbound gap at about 5pm. This appears to arise from a westbound gap arriving at Finch Station and buses taking longer-than normal layovers before departing in a bunch eastbound.
A small amount of bunching persists through the evening.
The location of visible slowdowns on this date was westbound to Victoria Park in the am peak.


939 Finch Express
On December 8th, the express service shows the same am peak slowdown westbound to Victoria Park as the local service. A wide gap opens up westbound at about 10:30am due to two buses that appear to go out of service.
- The light green line on the chart shows a bus holding at McCowan and Finch, then heading west to Kennedy, returning to McCowan and then, finally heading west to Finch Station.
- The purple line shows a bus holding at McCowan and Finch between about 10:35 an 11:05 am.
- Two more buses appear in service between 11:00am and noon (purple and mauve).
- This behaviour implies that buses went out of service due to a lack of operators.
As the day goes on, service is fairly regular although some bunching does remain.
A wide gap opens up in the STC to Finch WEst service travelling west at about 4:30pm, and echoing back at 6pm. This is also likely due to a shortage of operators.


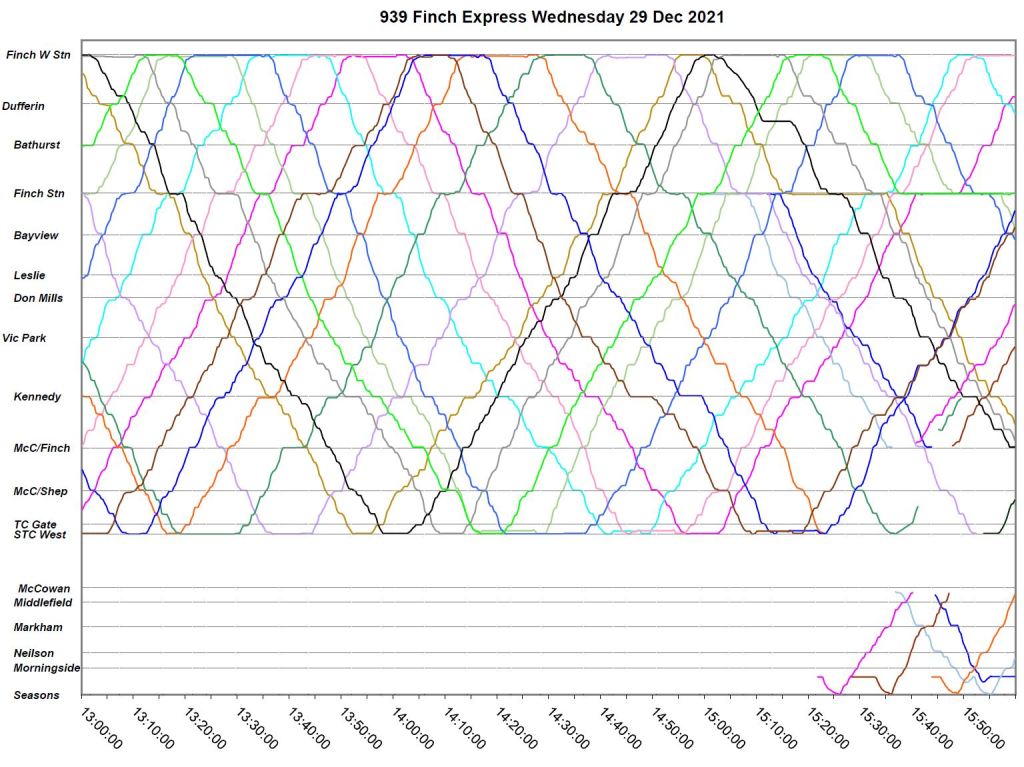
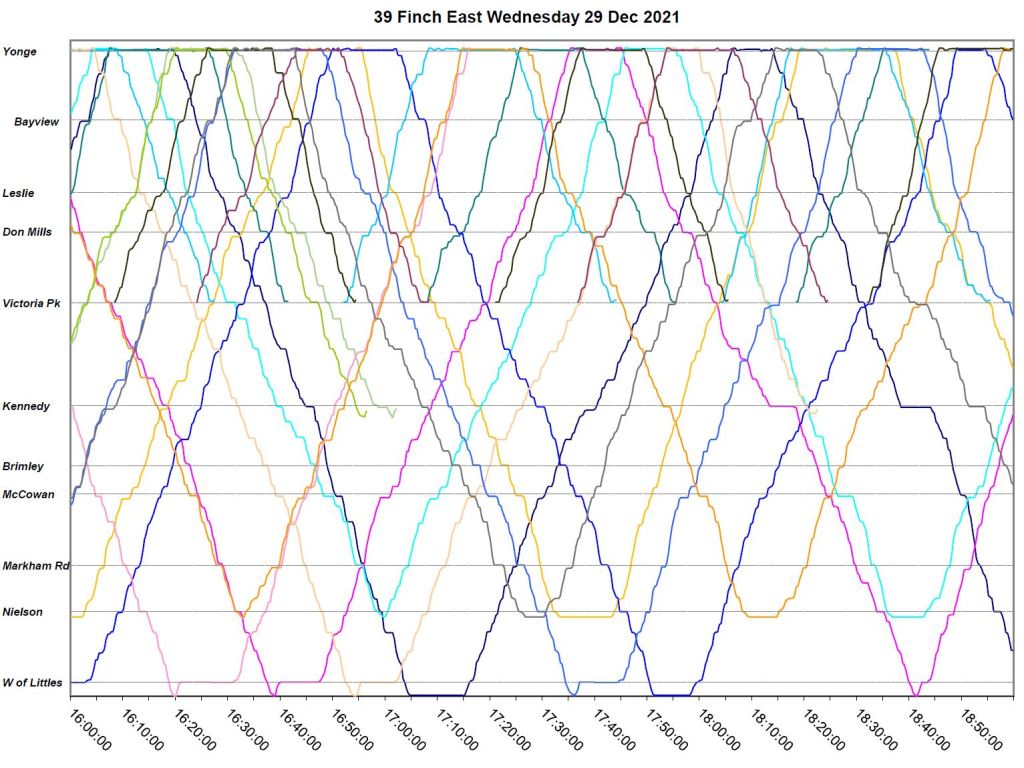
Wednesday, December 29
39 Finch East
On December 29th, although there are no congestion delays, buses commonly travel in pairs right through to the late evening causing wide gaps in service. Terminal layover times show that this is not a problem with inadequate schedules.


939 Finch Express
The express service is better-behaved than the local service on December 29th, but some bunching does develop in the pm peak. Bunching continues through the early evening, and one bus appears to be missing in the late evening.