On Saturday, May 28, 2022, between 10am and 5pm, the TTC will open the lower level of Bay Station as part of Toronto’s Doors Open event.
May 28, 2022: Updated with photos from the event.
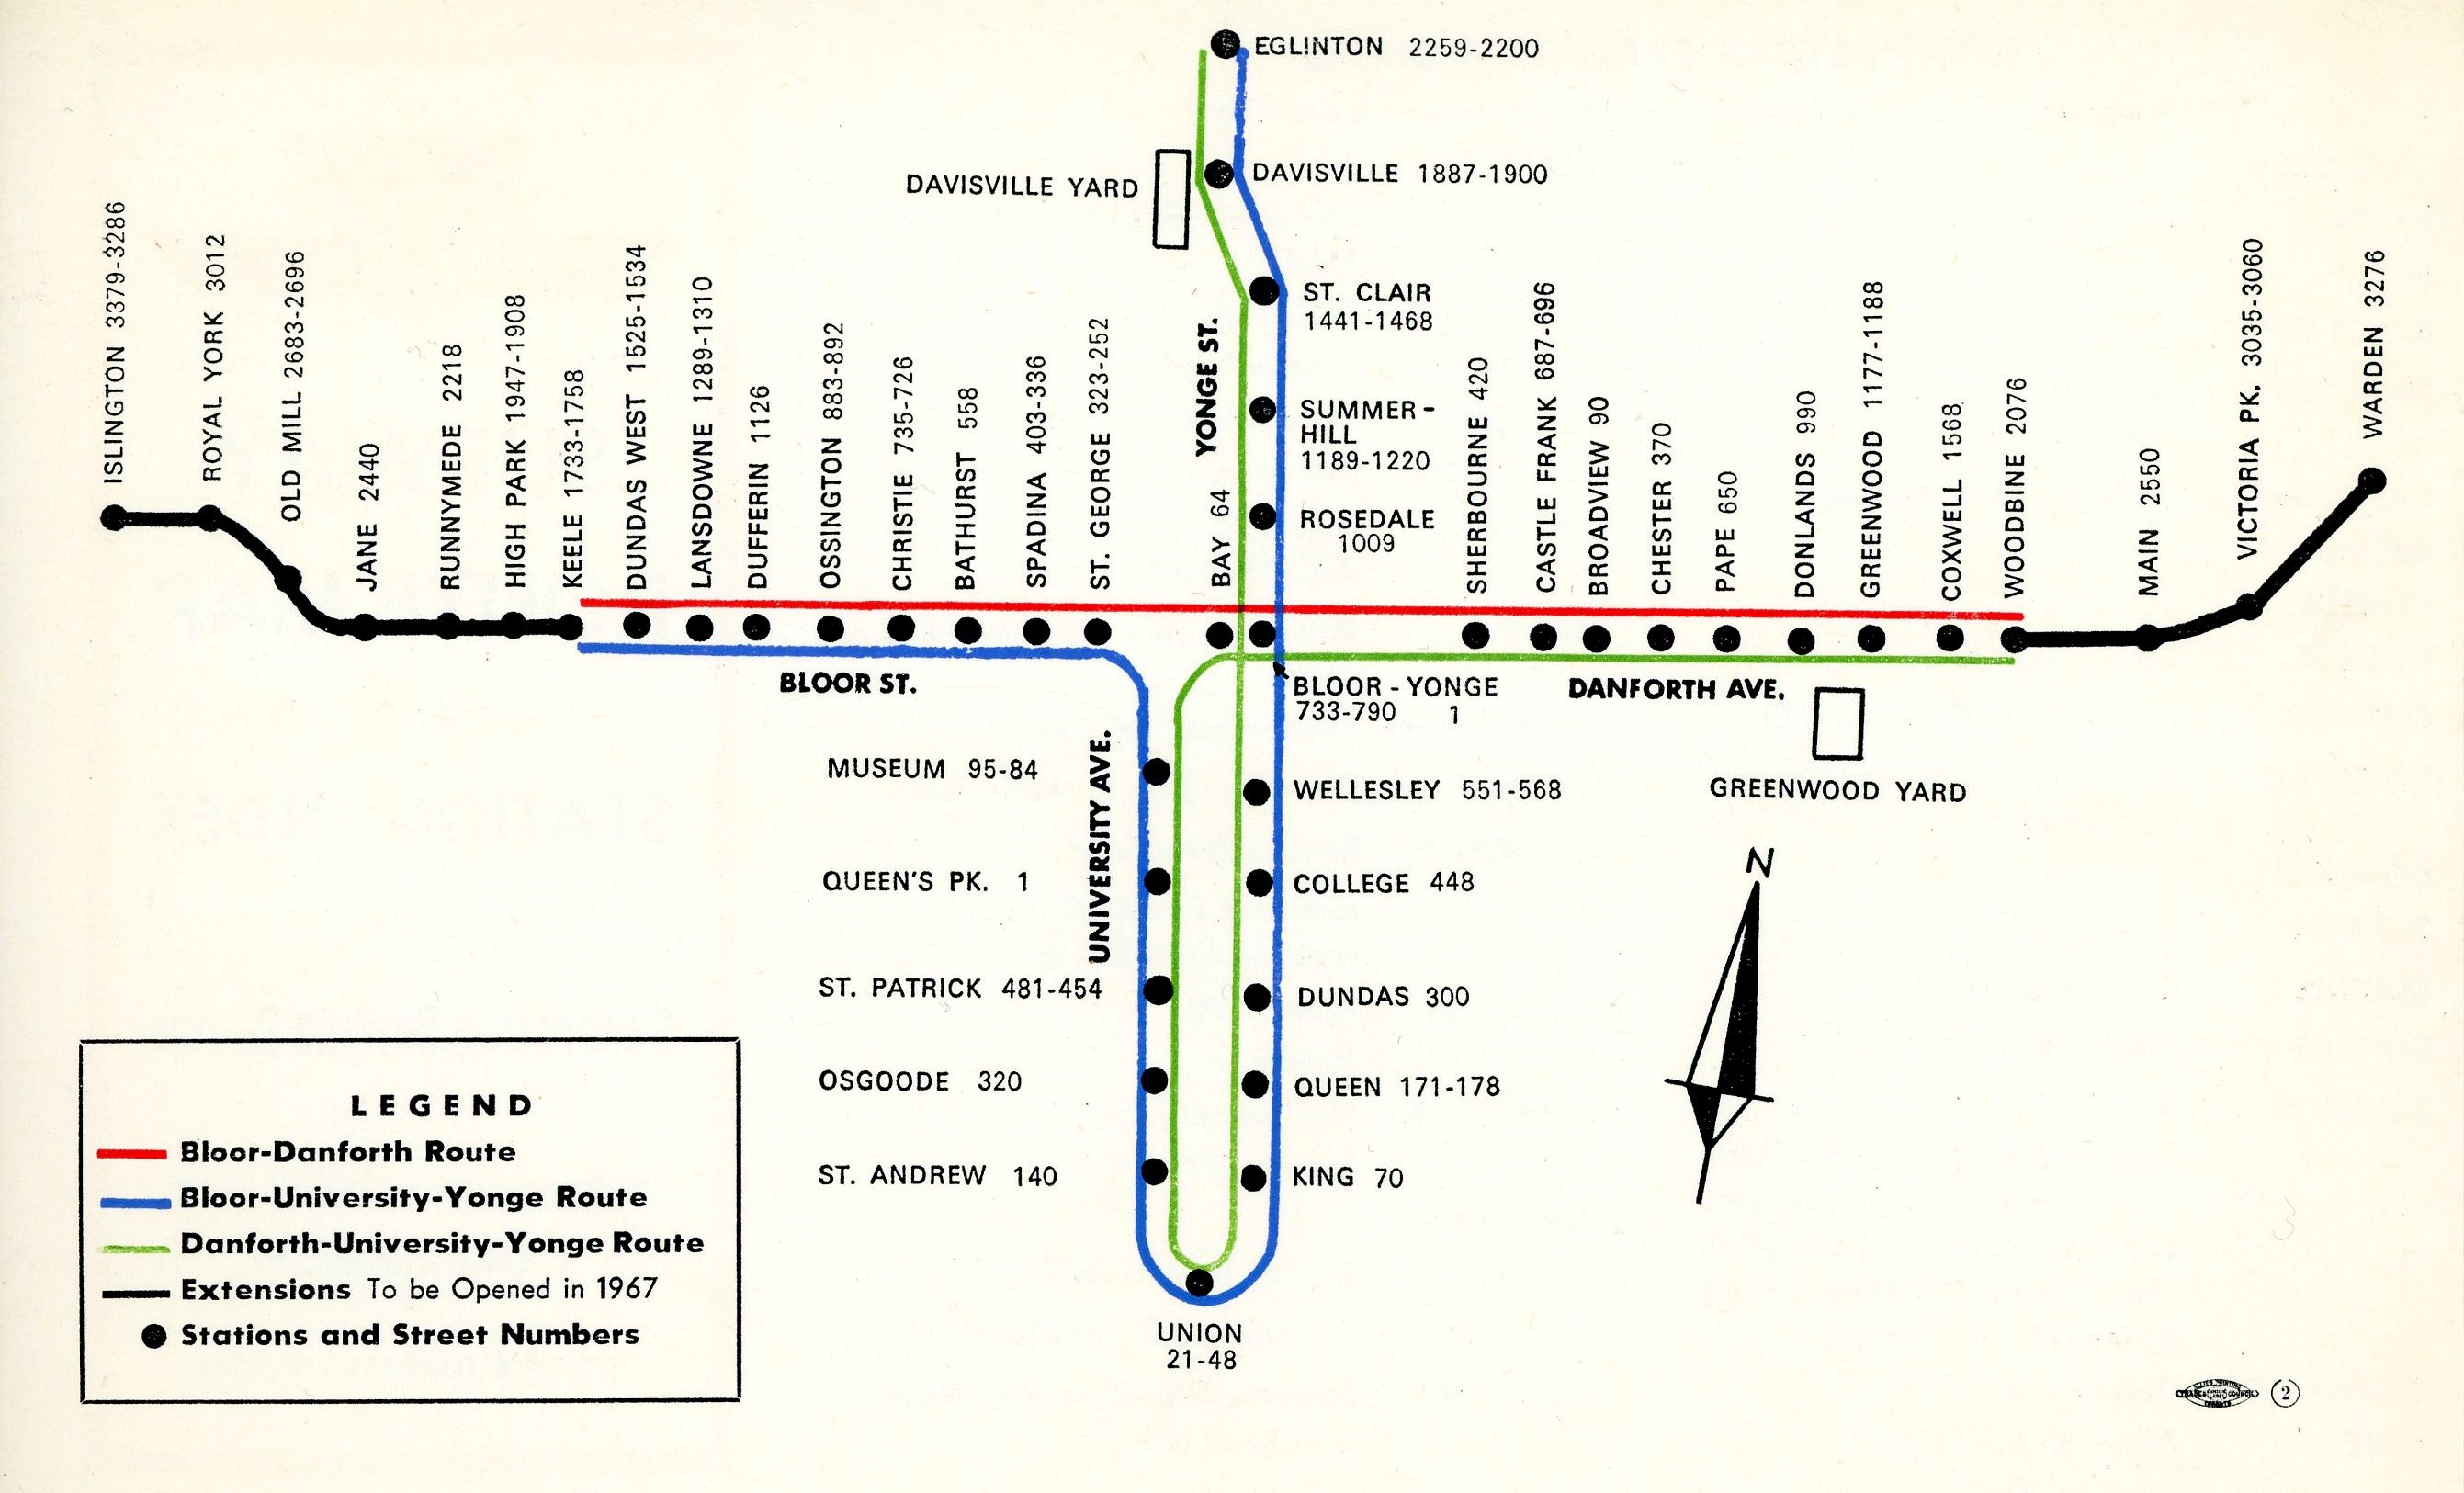
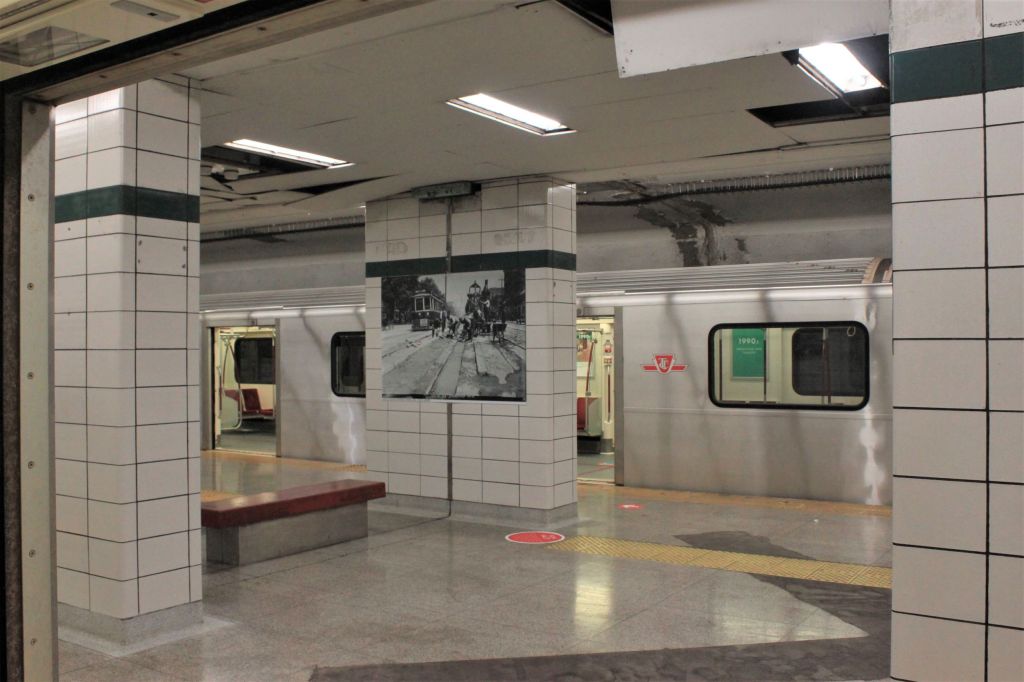
Bay Station is an inverted version of St. George Station with the Bloor line on the upper level (the currently active station) and the University line on the lower level. Tracks connect to Lower Bay from the junctions north of Museum Station and at the west end of Yonge Station. These are regularly used for equipment moves between the two lines as well as by work trains.
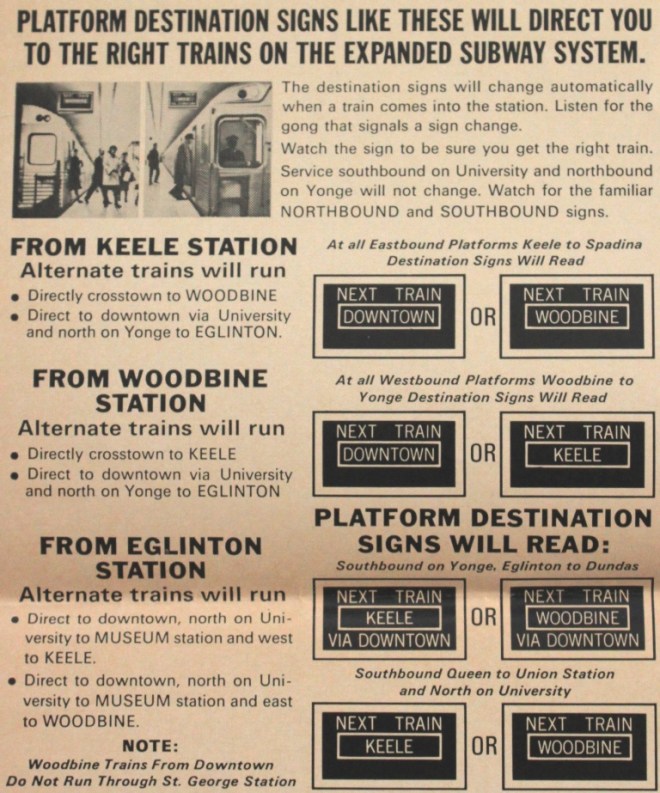
This station has rarely been seen by the train-riding public except for a few construction-related subway diversions. It operated in revenue service for the first six months of the Bloor-Danforth subway during the trial of an integrated service on the Yonge-University and Bloor-Danforth lines. When that ended in September 1966, the station took on various uses including storage, training, testing of platform treatments for wayfinding, and movie shoots.
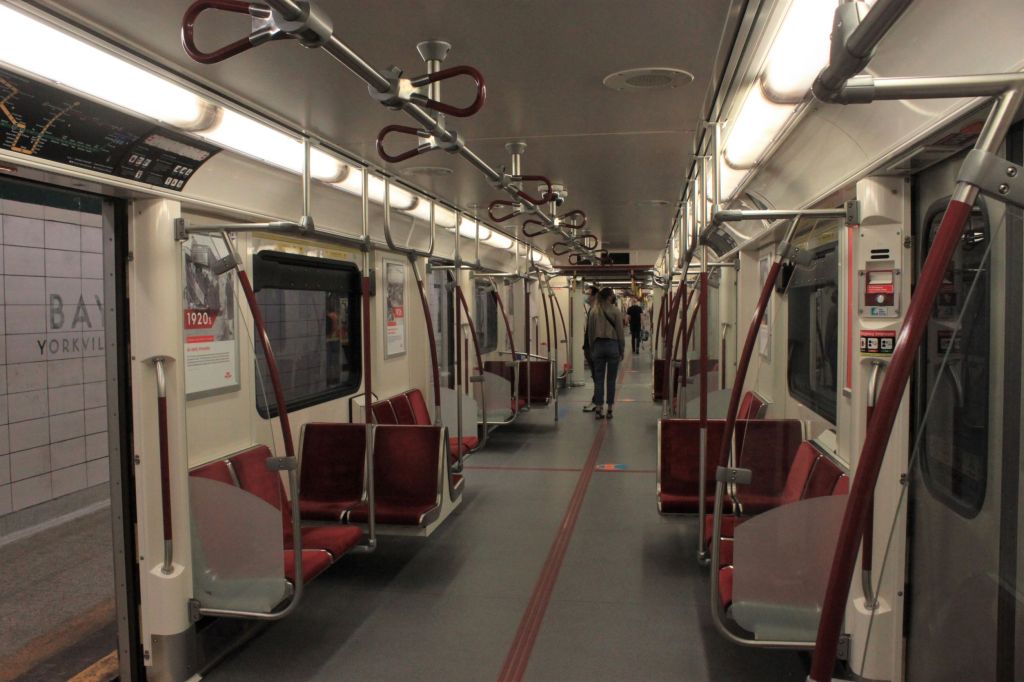
During the event, trains will be parked on the platforms, and there will be displays from the TTC’s centennial book A Century of Moving Toronto.
Access is only by stairway.
Route Map for Integrated Subway Service 1966
Here is a selection of photos from the event.
Lower Bay Station is taller than most because of the alignment of the tunnel which connects to the University line north of Museum by going under the north-to-west track into St. George Station.
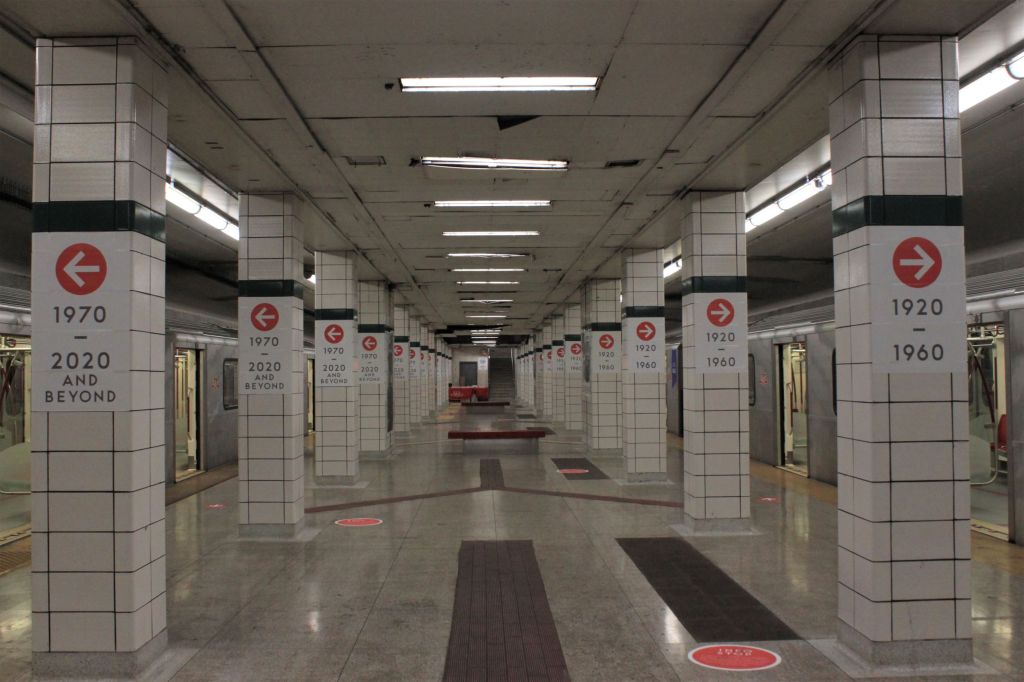
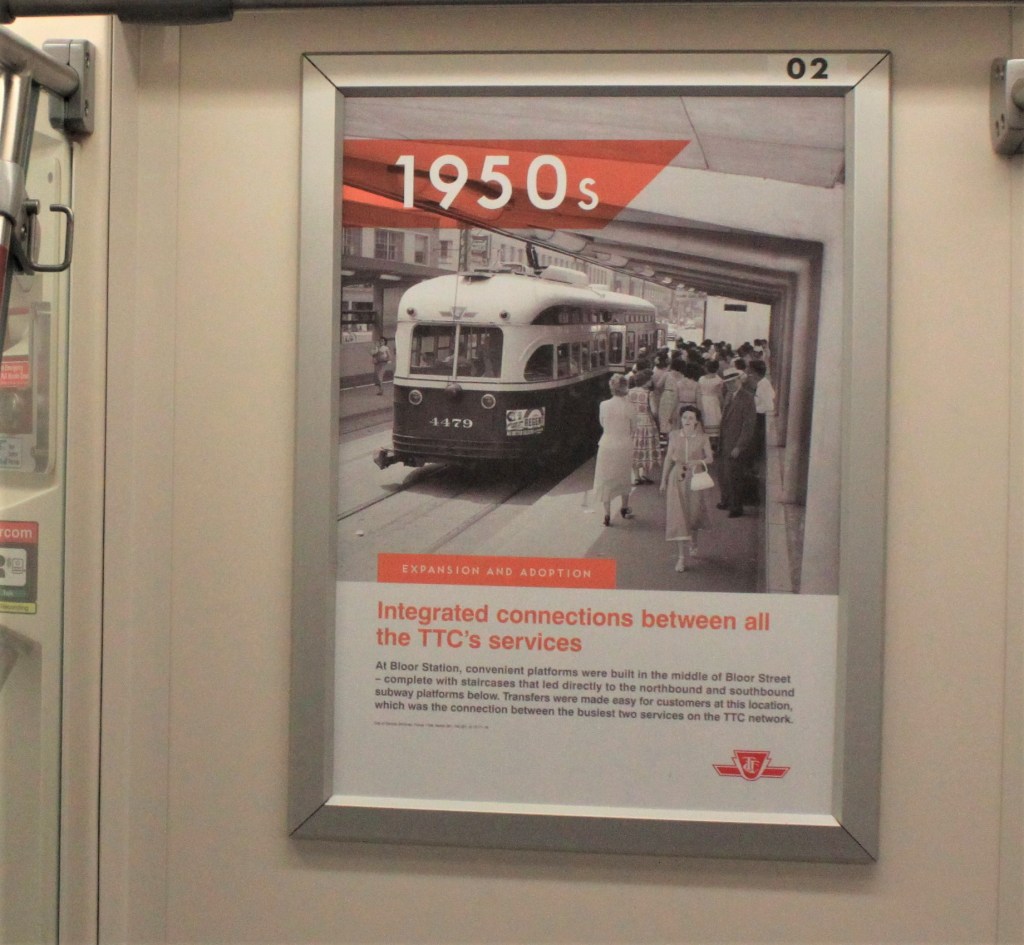
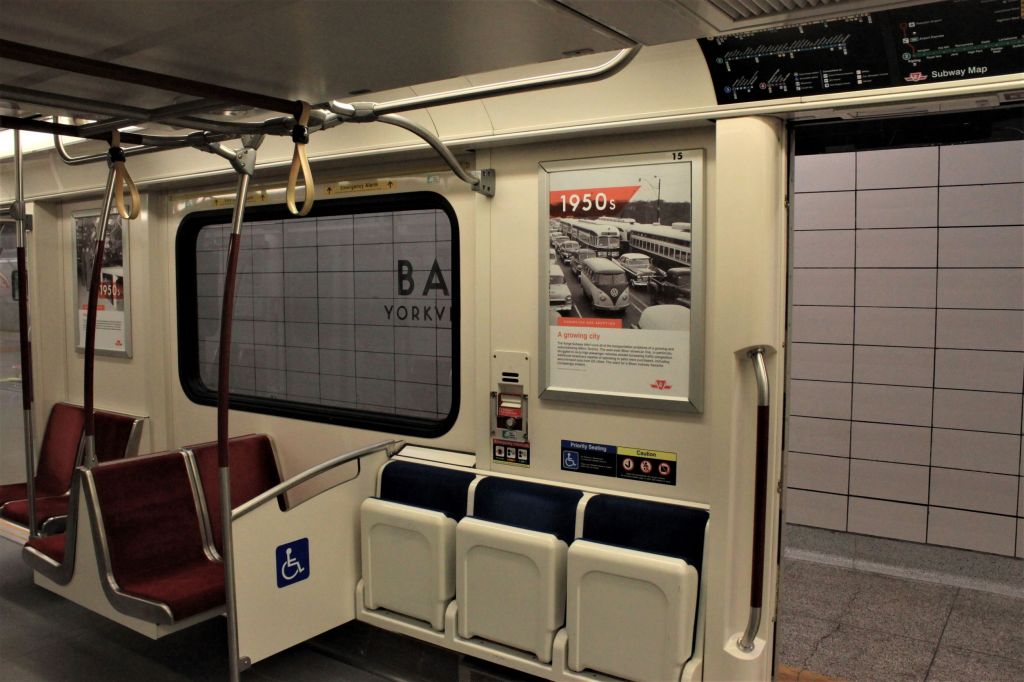
Two trains were set up with photos arranged by decade. The display is adapted from the book TTC100 which is available in hardcover or digital version from the TTCShop.
The streetcar system is a lot smaller than it was in 1949 before any of the subway was built. Streetcar trains with Peter Witt cars served Yonge, and trains of PCCs operated on Bloor-Danforth. Many other parallel routes funnelled riders into downtown.
Lower Bay is a bit worse for wear, not having seen revenue service (at least with stopping trains) since 1966. It has been used, among other things, to test various floor treatments for wayfinding.
Once the Yonge Subway opened in 1954, the major interchange was at Bloor-Yonge with a protected unloading and loading platform in the middle of Bloor Street leading directly to the Bloor Station platforms below. This area will see major reconstruction in coming years as Yonge Station and the link with Bloor Station are expanded to provide a separate eastbound platform for Line 2.
Streetcar traffic to the east end was quite intensive with the combined service Bloor and Danforth trains operating close to once a minute between Bedford Loop (now St. George Station) and Coxwell. The view looks northwest on the Prince Edward Viaduct with the trees of Rosedale in the background.
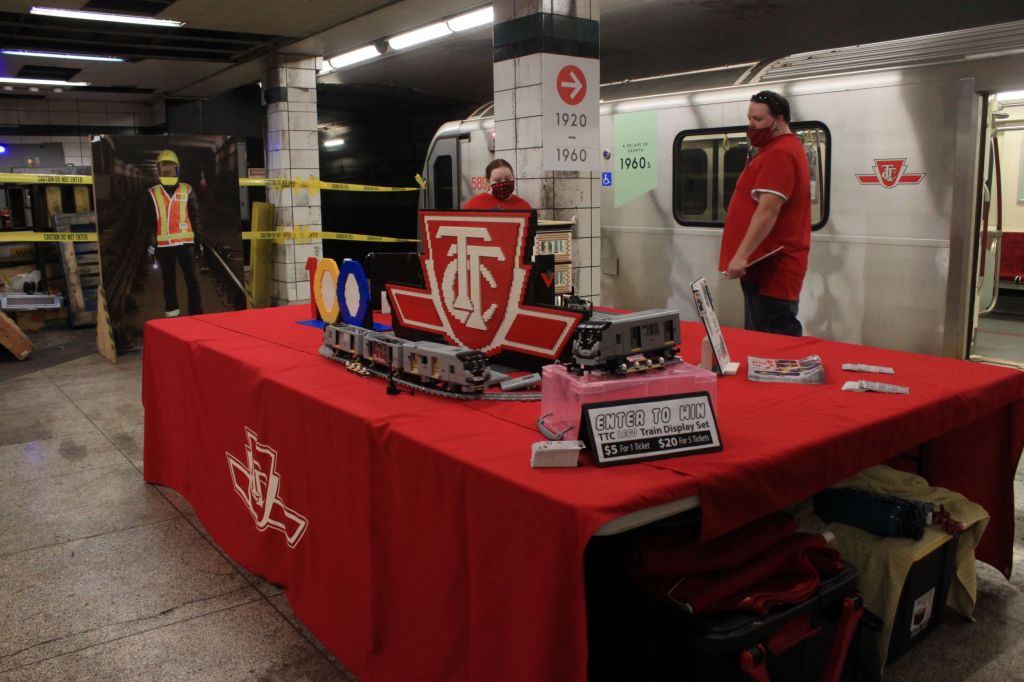
At the east end of Lower Bay, there is a TTC Lego subway train set up which some lucky soul will win in a draw.
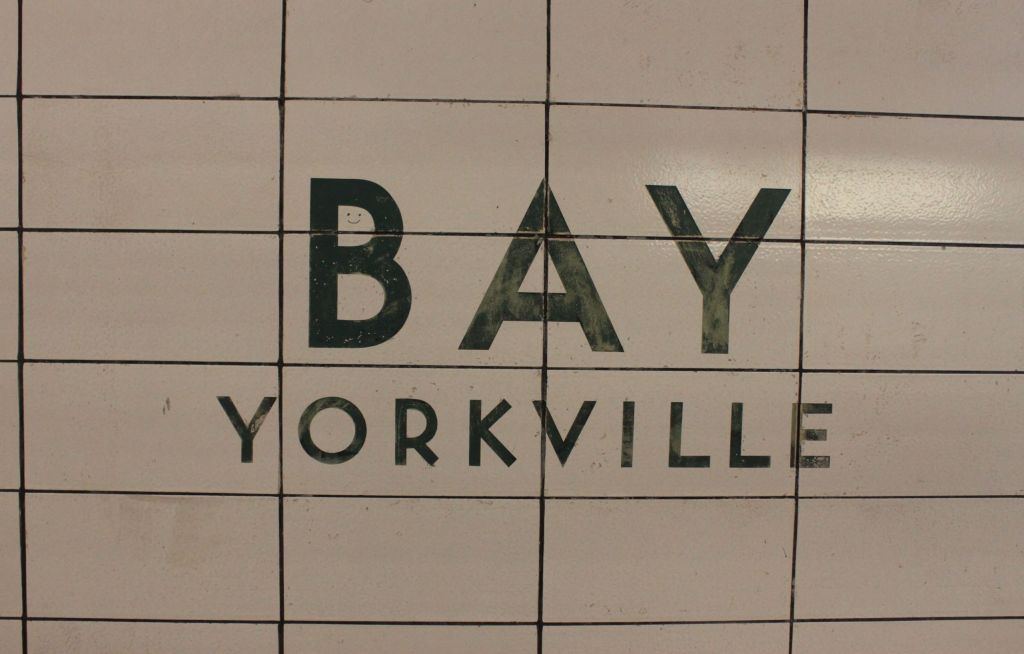
Finally, the station name is “BAY Yorkville”. This is a testimonial to the days when Yorkville was a disreputable neighbourhood full of coffee houses, people with long hair, and smokeables you can now find on any street corner. The station’s original name was to be “Yorkville” after the former town, but this was changed. This is not the only original BD station to get a different name when it was built: “Vincent” became “Dundas West”, and “Willowvale” became “Christie”.
This article is a companion to Part 1 of my update of travel time behaviour on key routes for 2020-2022. That article dealt with routes east of Yonge Street, and this part turns to routes west of Yonge:
29 Dufferin from King to Wilson
35 Jane from Eglinton to Steeles
60 Steeles West from Finch Station to Kipling
These three routes show more variation over time than most of the routes east of Yonge reviewed in the first article. The greater variation implies that they are more sensitive to changes in overall road demand and have less headroom to begin with. They are more likely to benefit from priority measures, but taking road space for transit will be more politically challenging in car-oriented areas.
Any detailed study that purports to establish time savings through red lanes must be careful to be an apples-to-apples comparison avoiding projected savings against conditions (construction projects and future route changes) that will change on their own. Similarly, and by reference to what was done on the Eglinton-Kingston corridor, “savings” due to stop eliminations, if any, should not be counted as a “benefit” of transit priorty.
This article and one to follow is an update of an earlier review of the effect of pandemic-induced changes in traffic levels on the running time of buses. The target routes are those that already have “red lanes”, exclusive lanes for buses at all hours, and on the first group where red lanes were proposed.
Originally, the list of possible routes was shorter, and it is those routes whose vehicle tracking data I have collected over the past years:
Eglinton-Kingston-Morningside (implemented fall 2020)
Lawrence East
Finch East
Steeles West
Dufferin
Jane
A City study is underway to prioritize routes for detailed study and implementation under the RapidTO program.
An important premise behind RapidTO and bus priority is that service can be improved both because travel times are shorter and because they are more reliable leading to more regularly spaced and predictable service. Indeed, on the King Street transit project, the benefit was far more that variation in travel was reduced and reliability was increased, as opposed to reducing the average speed of travel under day-to-day conditions.
Too often, “priority” has been sold on the basis that it would reduce operating costs when the real goal should be to improve service with resources already in place, and to ensure that any additional buses or streetcars do not simply disappear into a “black hole” of unreliable service.
With the pandemic, we have an unexpected chance to see how much time is saved when traffic is, for a period, reduced from normal levels. This gives an indication of what we might expect from red lanes, or putting it another way, the best we are likely to achieve.
Revised May 21, 2022: The original tables in this article were based on headway data that was rounded to minutes. This produced distortions in comparison of 2020 and 2022 service especially on routes with frequent service where rounding substantially altered values, proportionately.
The TTC regularly reports that it is running service at “x” percent of pre-covid levels. They aim to be back at close to full service and 80% of pre-covid demand by the end of 2022 with hopes for 100% in 2023.
Like so much of the info TTC publishes, this is a system average, and the actual ratio of pre-pandemic to current-day service varies from route to route and by time of day.
The charts in this article map the ratio of old and new service by percentages, and by the change in scheduled headway (time between vehicles). The data are taken from the Scheduled Service Summaries published by the TTC.
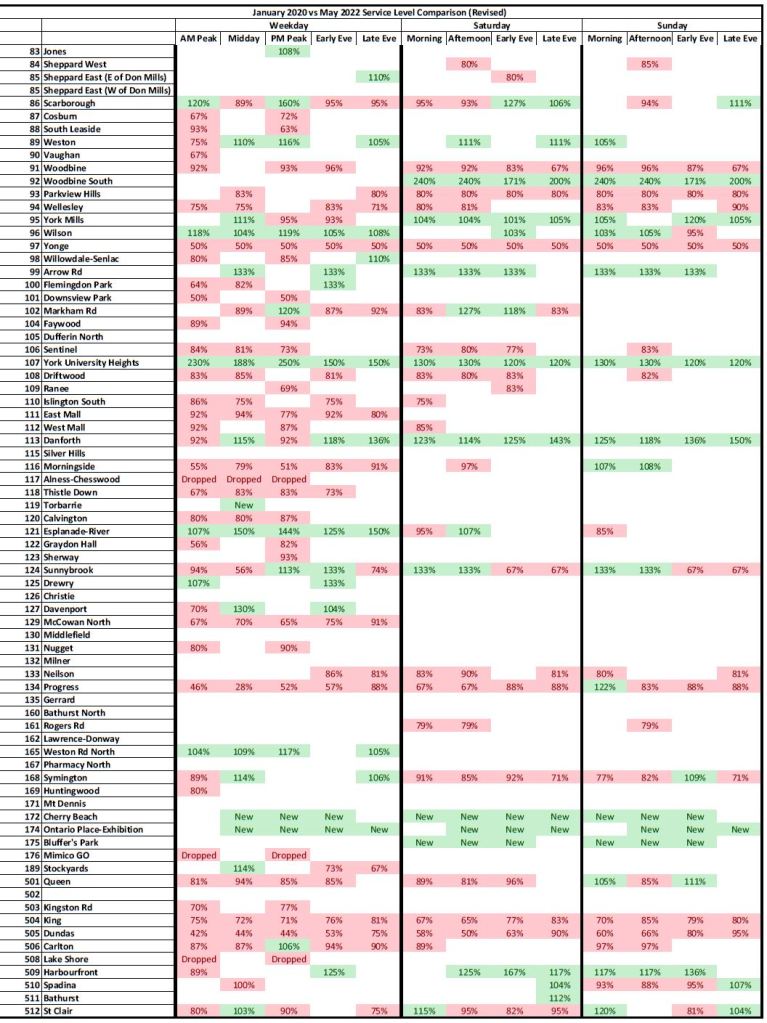
The pages below (click to open in a larger format) show which time periods and routes are operating less service today than in January 2020 (red) or more (green). Cells that are white indicate that the service is unchanged.
The key point here is that there are routes operating with considerably less service compared to January 2020 than implied by TTC claims of service recovery. It is no surprise that riders on many routes complain of less frequent service. This is compounded by the TTC’s inability to operate reliable headways making waits for buses and streetcars both longer and less predictable.
In a few cases there have been vehicle type changes on a route such as the restoration of streetcar service on 505 Dundas. The percentages are relative to the scheduled vehicles per hour with no adjustment for capacity. Similarly, a few bus routes have changed between regular sized and articulated vehicles.
This set of charts shows the percentage change in service from January 2020 to May 2022. A table at the end lists the major route changes affecting headway comparisons.
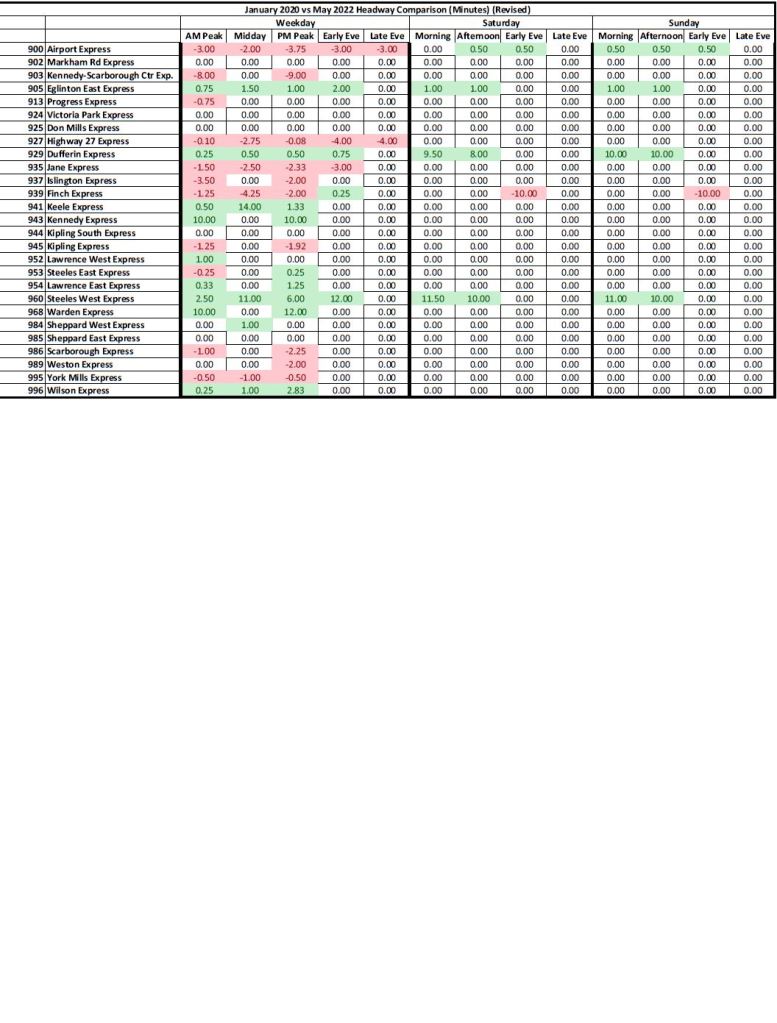
The charts below show the difference in headways (in minutes) between January 2020 and May 2022. Negative values (red) indicate vehicles that arrive less frequently while positive ones (green) show more frequent service. For example, Line 1 Yonge-University now operates every 3’36” in the AM peak compared to 2″21″ pre-pandemic, a difference of 1’15”.
The TTC Board’s May 18, 2022 agenda contained many routine items, but of interest were:
CEO’s Report
Advancing Analytics at the TTC
Establishment of a Human Resources Committee
CEO’s Report
The CEO’s Report contains the usual statistics about system performance, and there were few substantial changes from past months. These metrics deserve to be revisited along with the TTC’s Service Standards, and I will deal with them a separate article.
A frustrating problem with the CEO’s Report is that information in it is usually a month or more out of date. For example, ridership numbers are reported to the beginning of April even though it is now mid-May. In an environment where day-to-day changes in transit’s recovery from the pandemic have implications for service and budgets, more recent information should routinely be presented to the Board. It should not be up to Board members to ask staff for more recent figures.
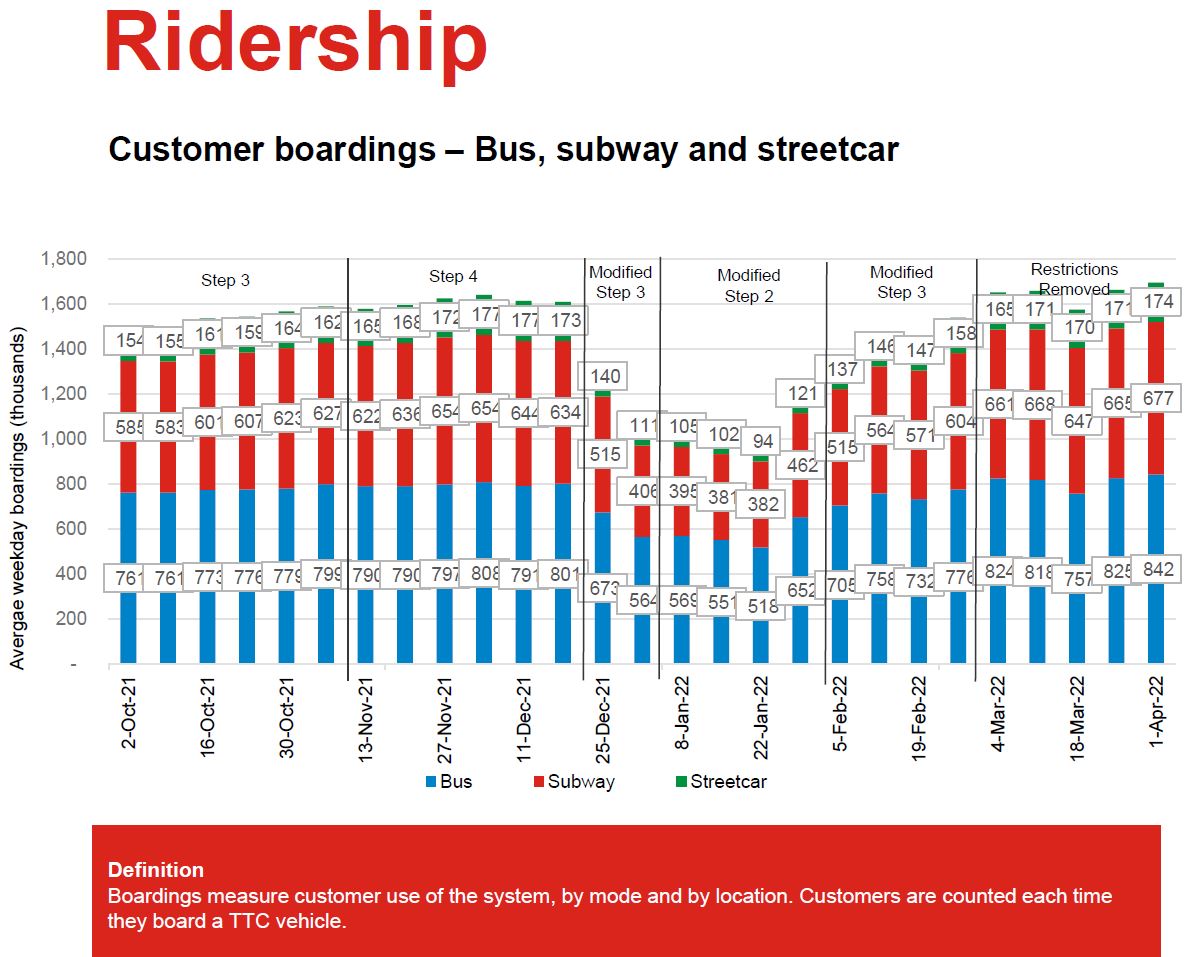
The chart of recovery by mode takes us to April 1. The effect of the omicron surge in December/January was quite substantial, and the system has only now built back to a level above the peak in late November 2021.
The values in the report are over a month old, and they were verbally updated at the meeting in response to a question.
Pre-Pandemic Recovery Level
April 1, 2022 (Report)
May 7, 2022 (Verbal Update)
System
53%
59%
Bus
61%
63%
Streetcar
50%
55%
Subway
45%
48%
Further details appear in the Advancing Analytics presention later in this article.
Revenue rides are running ahead of the budgeted level after a poor start in January. The TTC expects that on an overall basis through the year, the budget and actual numbers will balance out although the actuals are currently running ahead. Much depends on the rate of growth of in person office work and post-secondary attendance.
The actual revenue from fares for the first quarter was $140 million compared to the budget estimate of $107 million. The pre-covid normal value was $313 million, and so there is some distance yet to travel in the recovery.
The overall TTC and City budgets have not yet been made whole by extra provincial and federal covid relief funding, and the City faces a gap of about $800 million in its operating budget. To counteract this, there is a proposal to cut back on capital-from-current spending so that capital projects will not weigh as heavily on the operating budget. However, this will defer some projects planned for 2022 and can add to future costs if more work is paid for by borrowing than by current revenue.
The TTC is currently studying how to cut $87 million out of its 2022 Capital Plan as an offset to the City’s shortfall. The need for this work does not vanish. It is simply pushed further into the future and adds to the unfunded deficit in the overall capital plan.
An important presentation in the meeting dealt with the analysis of TTC data. They have a wealth of information, but much of it is hard to get, and what should be routine stats on system operations are simply not available.
The TTC has now set up a group to pull together their vast collection of data and assist departments in making use of this under the name of a Centre of Excellence for Data Innovation. Examples of some of its work are included in the presentation deck, and the TTC intends to make much more publicly available soon. They also intend to provide access through an open data portal so that those outside of the TTC can make use of the data. (No details have been provided yet.)
Readers of this site will know of my long-running series of analyses of route operations, and these depend on access to vehicle tracking data that the TTC has provided since 2008. However, that is an ad hoc arrangement as opposed to one that makes data available to any who want it.
Here are some examples.
Access to Transit Modelling
Using origin-destination data for various types of trips, the TTC has mapped the effect of Line 5 Crosstown’s opening and the associated surface route changes. The map below shows changes in the 60-minute range for job access. The improvements are, understandably, concentrated along the Eglinton corridor, but they also affect feeder corridors where the faster Eglinton segment brings more trips under the cutoff level. Areas where access falls arise from route changes that impose longer routes or transfers that do not exist in the “before” network.
Demand Modelling
TTC ridership has been reported on aggregated, averaged values across all routes and times of day. This masks issues with specific routes, times and locations where service does not meet the demand or the standards TTC aims for in an era when people still want some degree of social distancing.
The table below shows several major corridors and the differences both in time-of-day values and in individual routes versus averages. Hot spots that are invisible in consolidated numbers jump out in this table. The slide below notes that this information can be used for deployment of demand responsive service, although the TTC still is not reporting exactly where and when that service operates.
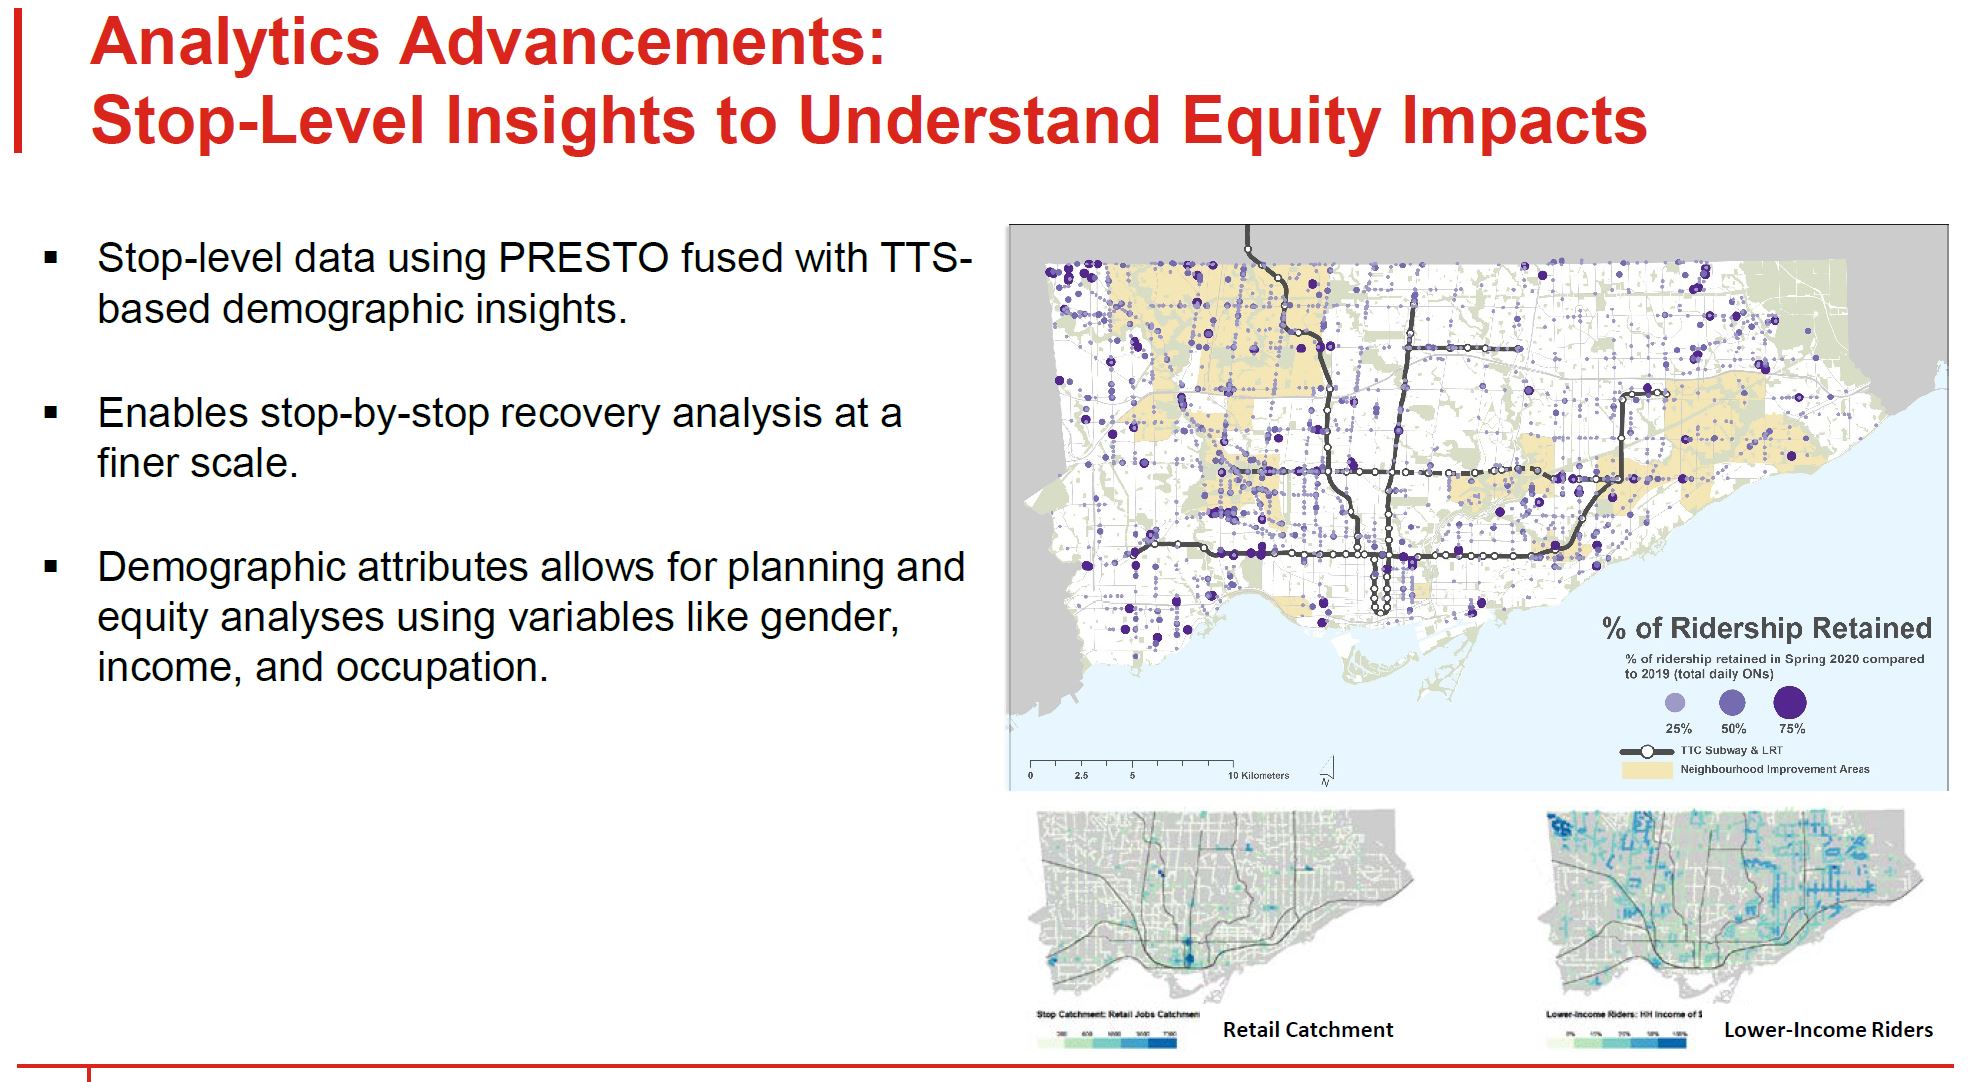
Stop Level Analysis
The chart below shows the percentages of ridership recovered on a stop-by-stop basis. Note that there are no data for streetcar lines because these vehicles do not yet have automatic passenger counters installed.
Many stops, particularly in the outer suburbs, show a strong rebound in demand as of Spring 2020, a year ago, with a 75% level. This is well above the overall system averages reported at the time, and shows how averages can mask behaviour at the local level.
Route-by-Route Analysis
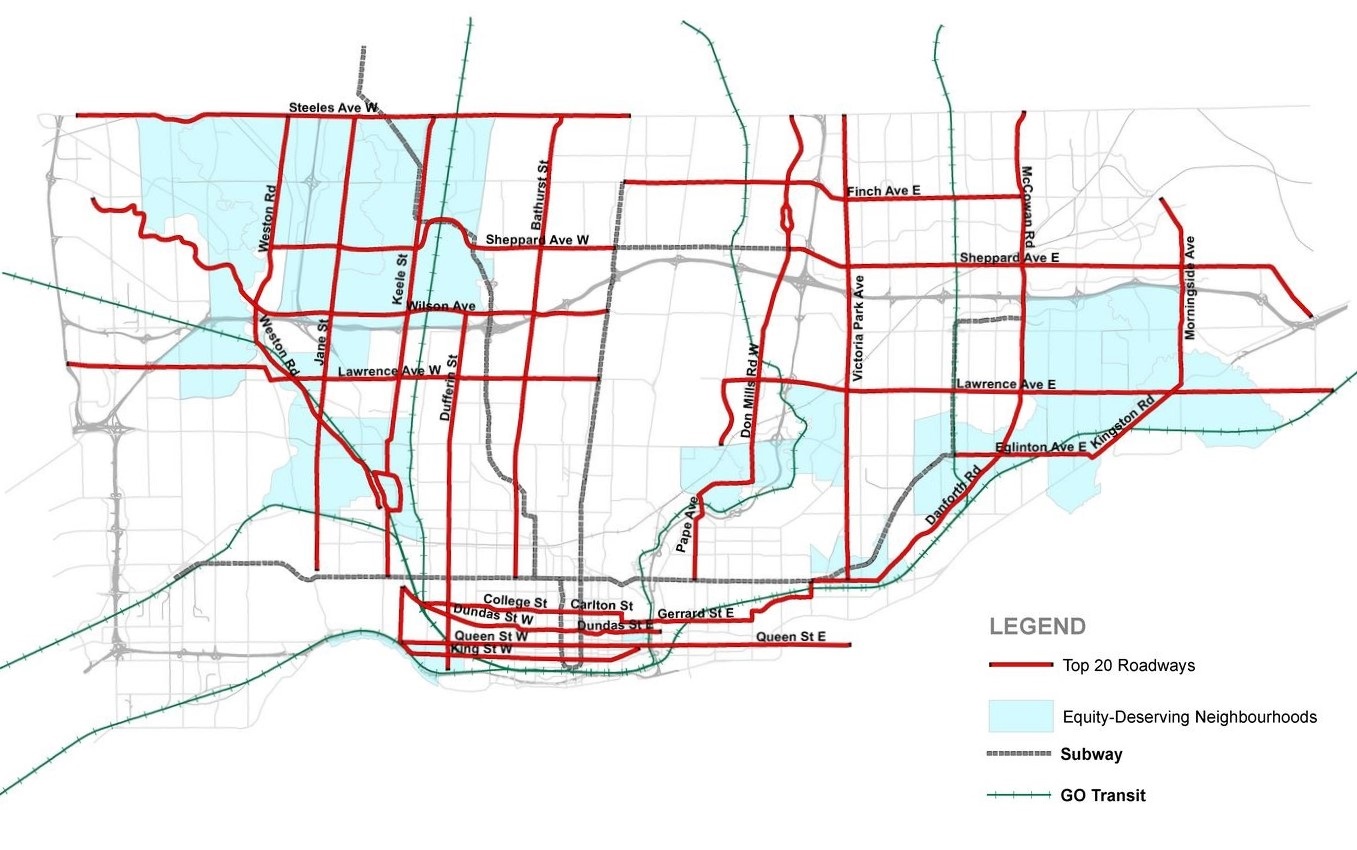
The map below shows the bus routes where recovery of ridership has been strongest including a “top 10” that collectively achieved 69% of former boardings by April 2022.
One problem with this map is that how a route becomes part of the “top 20” is unclear. According to the legend, this is by boardings, and that should eliminate relatively minor routes. If the real ranking is by percentage recovery, this might make more sense. A route could be short and have few customers in absolute terms, but do well measured against pre-covid performance.
By Mode and Time of Day
The charts below show how ridership has returned to different parts of the system at different rates.
In the bus chart (left), the percentages give the ratio of Spring 2022 values (yellow) to Fall 2019 (light blue). The degree of recovery is not uniform across the day. For streetcar and subway routes, the relatively low peak period recovery is quite clear, but off-peak demand is stronger.
Anyone who rides the subway knows that it can be crowded in the off-peak, particularly evenings, because service is less frequent but ridership is returning. According to the TTC, subway service will be restored over the summer and fall, but they provided no details of quantity or timing. Like so many aspects of TTC service, this will be subject to “resource availability” (for which read staffing and budget headroom).
Use of WiFi Data for Ridership and Origin-Destination Surveys
The TTC is working with the provider of WiFi services in the subway to collect origin-destination data on an anonymized basis, and hopes to extend this to surface routes as WiFi is rolled out there. This has an advantage over Presto data in that entire trips are captured, not just points where passengers “tap in” to the system.
Continuing the Masking Mandate
CEO Rick Leary reported that the province was has established a date of June 11 for a possible change in the masking mandate. This was done in consultation with transit agencies.
Mask usage has started to fall, but surveys show that 94% of riders are masking, with 88% doing so correctly. Commissioner Carroll asked whether surveys are conducted across the system because adherence varies by time and location.
Whether anything more will come of this remains to be seen considering the possibility that the province will drop the mandate, and that TTC prefers to be non-confrontational on the issue.
Human Resources Committee
The Board, in private session, approved a proposal to re-establish its Human Resources Committee for reasons not stated in the public report. It will consist of Chair Jaye Robinson, Vice-Chair Joanne De Laurentiis, and one additional member to be chosen by the Chair from among Council members on the Board.
It is unclear why the Board would make such a move so close to the end of its mandate, and this implies that there are events behind the scenes serious enough to warrant Board oversight.
As a general note, the TTC Board has been lax compared to those in previous terms in its oversight of management because Councillors are so pre-occupied with covid effects on the city.
Postscript: Performance Data From Other Cities
Two examples of the type of data available in other cities are linked below. Note how the level of detail substantially exceeds what the TTC has produced over the past two years. This should be an inspiration for what Toronto could have. A hat tip on this to Jarrett Walker (@humantransit), Jeffrey Tumlin (@jeffreytumlin) and Ari Ofsevit (@ofsevit) on Twitter.
Updated May 11: The schedule for completion of the final phase of the work at KQQR has slipped to fall 2022 according to the project website:
Previous delays, combined with some periods of adverse fall/winter weather, COVID-19 related labour shortages and supply chain issues have deferred completion of Stage 2 work (KQQR intersection, The Queensway and King Street West) to September 3, 2022.
Work on Stage 3 (the final stage) will start on Roncesvalles Avenue from the KQQR intersection to Harvard Avenue on September 4, 2022, and will be completed by the end of December 2022.
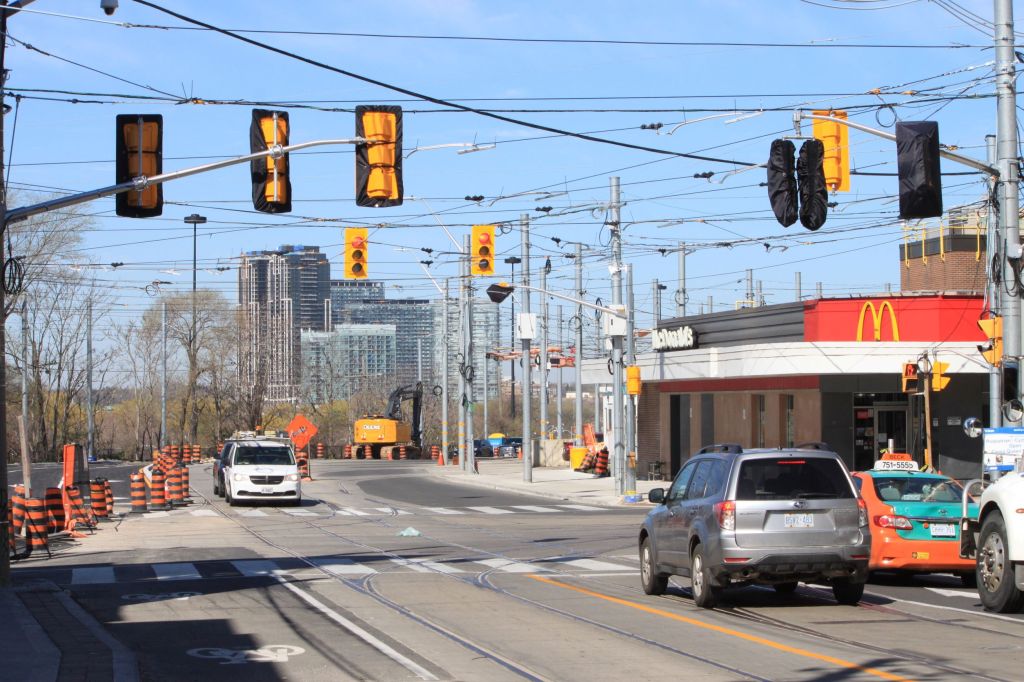
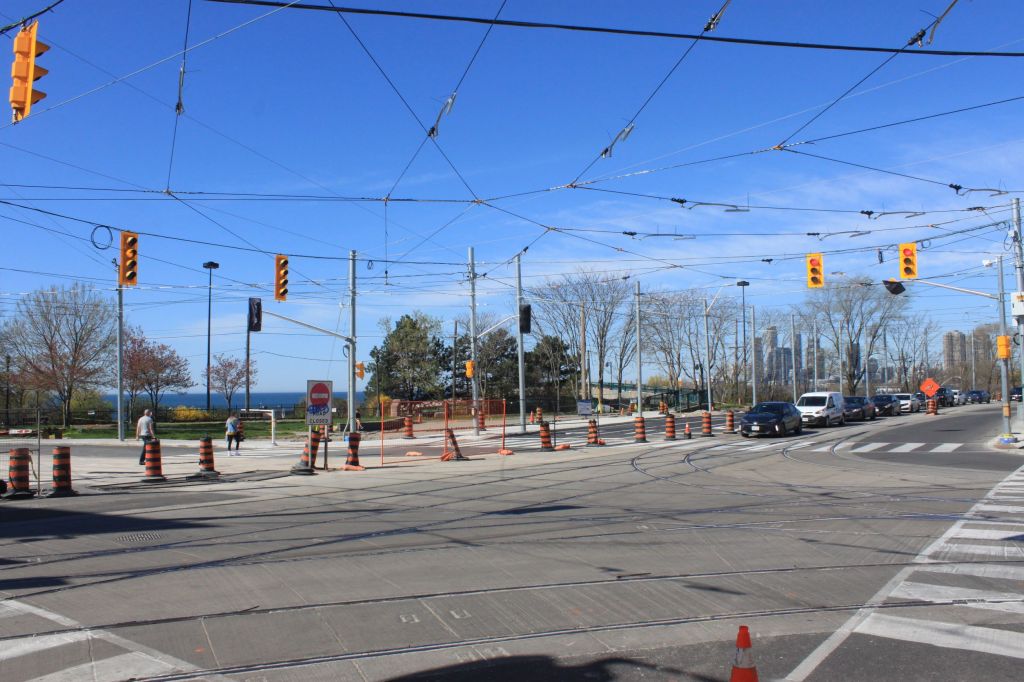
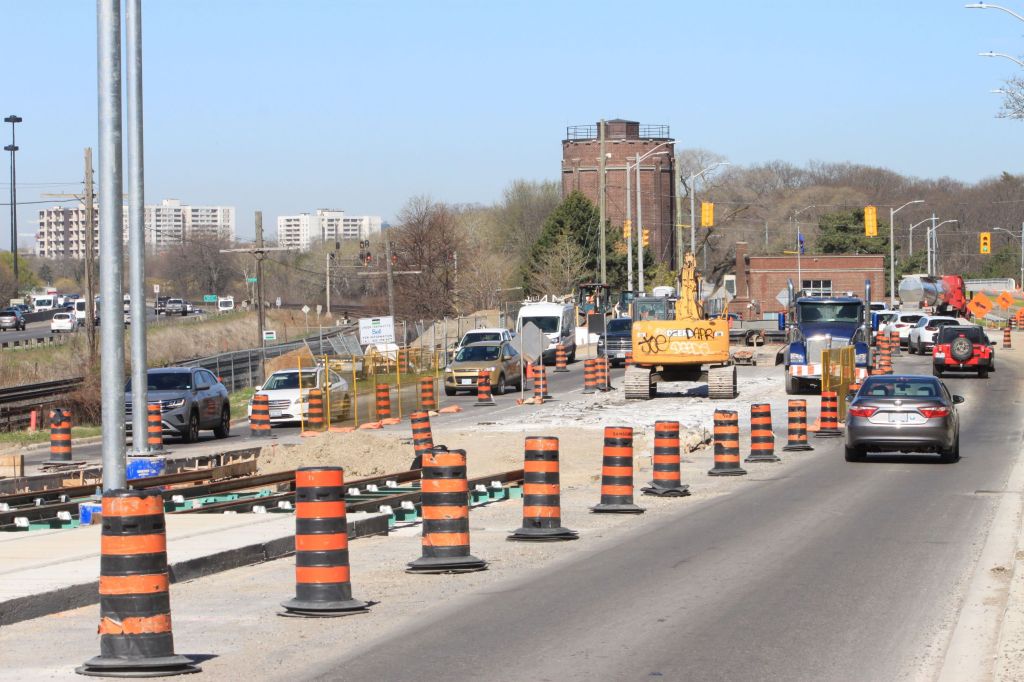
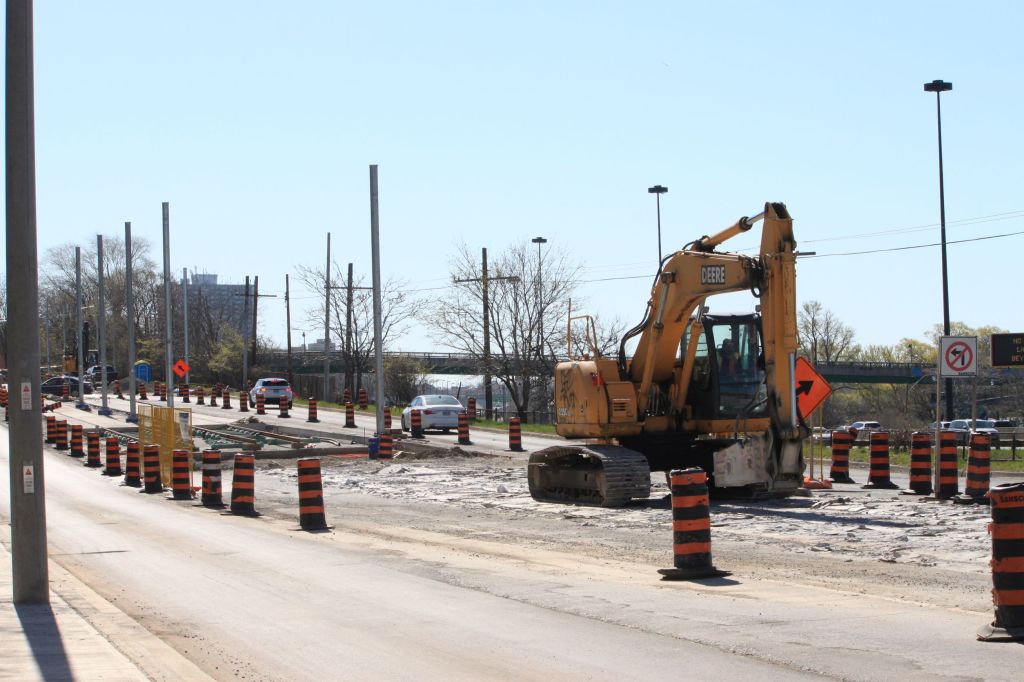
Work on the King-Queen-Queensway-Roncesvalles project continues with installation of new overhead at the intersection, completion of some new lane layouts, and utility work along the Queensway. Track construction is moving, albeit slowly, west from Sunnyside Loop toward the end of the existing right-of-way east of Parkside Drive.
At Dundas West Station, the road has just been closed north of Bloor except for a single northbound lane, and on Edna from Dundas to the west end of the loop for special work replacement. (As of May 9/22)
Traffic in the area is quite snarled because there are also minor track repairs underway on Dundas south of Bloor, and reconstruction of Bloor Street continues westward in the area to which much traffic has diverted.
Bus diversions are not the same as originally advertised.
40 Junction operates eastbound to Dufferin Station via Dupont and Dufferin returning westbound via Bloor, Lansdowne and Dupont.
168 Symington eastbound turns east rather than west on Bloor to Dufferin, returning westbound via Dufferin, Dupont, Lansdowne and Bloor.
504C King is supposed to be diverting southbound via Parkside Drive and Howard Park to Roncesvalles, but was running via Bloor and Dundas.
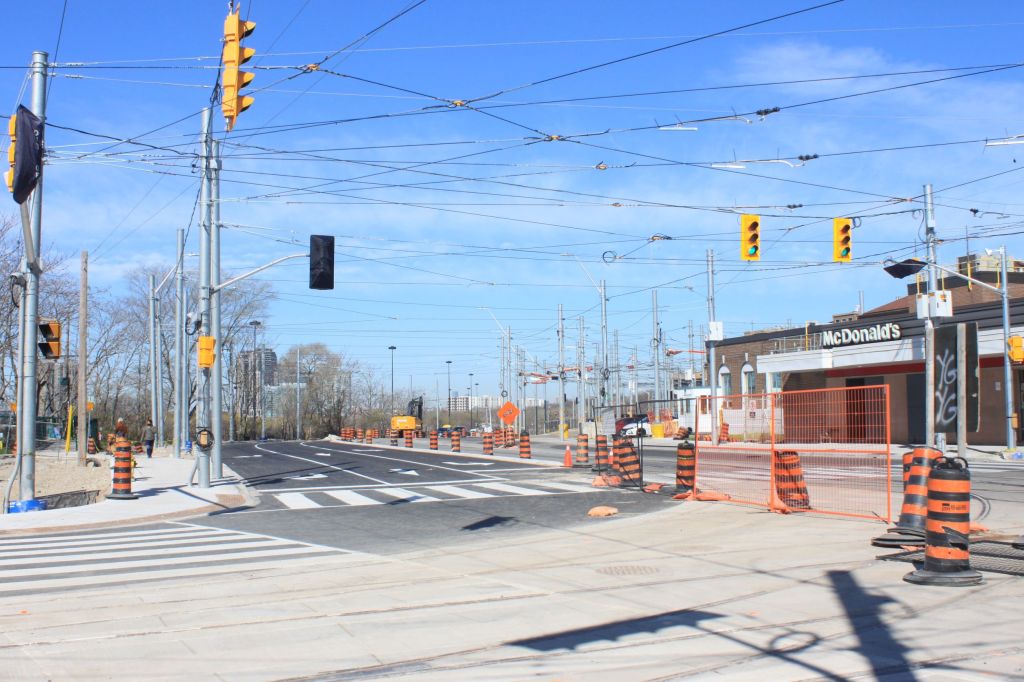
King-Queen-Queensway-Roncesvalles
May 9, 2022
Eastbound road traffic is now using the streetcar lane, but the new lane arrangement and the curb separating the streetcar lane are now in place. The King Street leg of the intersection is complete, but not yet open.
Looking W across Roncesvalles on QueenLooking W across King to The QueenswayLooking SW
On The Queensway west from Sunnyside, road rebuilding and track installation proceeds in bite-sized segments. It has now reached the point of blocking eastbound access from The Queensway to St. Joseph’s Hospital’s main driveway, and there is still a “slalom” where traffic shifts from the regular curb lanes to the streetcar lanes for a short distance.
Along the south side of The Queensway, utility work is still underway.
Looking W from SunnysideLooking E toward Sunnyside
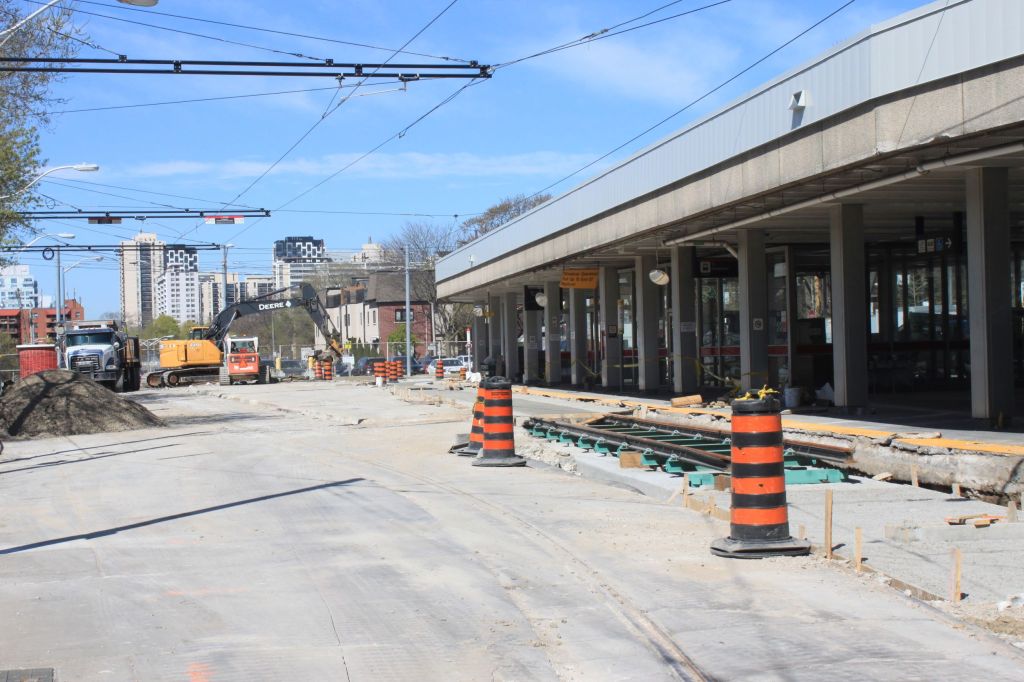
Dundas West Station
May 9, 2022
At Dundas West Station, the rebuilt track for the 504 King platform and the exit to Edna Avenue are in place, and excavation for the new 505 Dundas track is underway.
Dundas Street is blocked off except for one northbound lane, and Edna Avenue is closed in anticipation of track replacement for the north and east sides of the loop.
Today the Liberal Party of Ontario announced that it would cut all, yes, all transit fares in Ontario to just $1 if they are elected. The cut would apply through to 2023-24 (the provincial fiscal year end is March 31), and is sold as a way to get 400,000 cars off of the road every day.
This is a plan so simplistic, so poorly-thought-out, that even Doug Ford could have authored it, possibly after a few of his short-lived one dollar beers from the last campaign.
Regular readers here will know that I view across-the-board fare reductions as little better than snake oil because they benefit people who do not require more subsidy while doing nothing to improve what they actually use, transit service. The Liberal plan goes even further by giving massive fare reductions to regional transit riders who now pay double-digits for a one-way ticket.
They show the monthly saving for a commuter from Barrie’s Allendale GO station as $434.30. In other words, this plan would see a Barrie commuter subsidized by over $5,000/year.
In a separate pledge, the Liberals promise $375 million in annual transit funding to support existing systems, more service and “more intercity connections”.
Let’s check the math:
Assuming that:
Each car represents at least two trips (fares) for a round trip (single occupancy)
The saving/trip is at least $2 based on local transit fares
The trip only uses one transit system (e.g. TTC, YRT)
There are 250 commuting days per year
This gets us up to $400 million per year.
But don’t forget that we’re giving a break to all of the existing riders, and just for the TTC that would be around 300 million rides per year, or another $600 million and change.
We have not even talked about other transit systems, or the much larger savings GO Transit riders would see.
The big problem, however, is that all this money will not buy one more bus trip’s worth of service. That forlorn display in transit’s shop window will not improve one bit even with a big sign “Sale, Only $1!”.
Buck-a-ride will not deal with the last mile problem of getting people who now drive to their transit trip be it a local bus stop or a parking lot.
Already, the TTC reports that it is increasing service on some routes because of crowding. Where will it put a large influx of new riders, assuming that they appear?
In the short term covered by this proposal, the TTC has some surplus vehicles (albeit no operators to drive them) because they are not yet back to full service across the system. Even at full pre-pandemic service, they had a generous number of spare buses.
Systems elsewhere in Ontario do not have the robust demand we see in Toronto and could have more headroom for growth within existing operations, but the ability to carry all of those new riders without extra operating costs should not be assumed.
With this announcement, the Liberals have side-stepped commenting on the really big issues like the scope of transit expansion they would fund and their vision for planning that doesn’t start and end with subway tunnels.
When they get around to publishing a platform, we might see how transit fits in their wider scheme of spending and priorities across the many government portfolios. For the moment, this is a cheap, ill-conceived piece of campaigning from the man who turned Metrolinx into his own photo-op generator, the Minister for Kirby Station.
Several of the service cuts implemented in November 2021 will be restored with the May 2022 schedules. This includes express service on several routes. Although planned service will be 6.2% lower than the original budget for this period, the TTC intends to resume restoration of full service through the fall to the end of the year.
Information in this article is taken from the May 8, 2022 Scheduled Service Summary and from a copy of the detailed memo on service changes which was provided by a source. Normally the TTC sends these to various people in advance, but for some unknown reason, the document has not officially been sent to the normal external recipients.
There are some conflicts between information in the two documents and I have tried to reconcile these with my own judgement about which is correct because it is not unusual for there to be discrepancies in descriptions of service changes.
Rapid Transit Services
There are no changes in rapid transit services.
Streetcar Services
The 501H/501L Queen replacement buses for service on the west end of the route will be shortened to turn back downtown via University Avenue, Adelaide Street and York Street rather than operating to Broadview & Gerrard or Broadview Station.
Eastbound buses will operate as 501U.
Bus service will be provided from Birchmount, Queensway and Eglinton divisions.
There is no change to the existing 501 Queen streetcar service between Neville Loop and Bathurst Street (Wolseley Loop), nor to the 301 Blue Night Bus operation.
Headways on 505 Dundas and 506 Carlton will be blended to allow for the shared terminal at High Park Loop.
The 505 Dundas routing change to High Park Loop will be officially recognized in the schedules.
Service will be reduced during most periods on both routes as a seasonal change.
306 Carlton Blue Night will operate with buses to Dundas West Station.
509 Harbourfront: Seasonal service increase evenings and weekends.
512 St. Clair: Service increase on weekdays.
Bus Services
Routes With Express Service Changes/Restorations
29/929 Dufferin:
Local service improved during most periods on weekdays.
Weekend service rescheduled for articulated buses.
Weekend express service restored using artics.
939 Finch East Express:
Weekend service restored.
41/941 Keele:
Local service changed from articulated to standard buses on weekdays with improved frequency of service.
Midday express service restored.
Express operation changed to articulated buses.
43/943 Kennedy:
Minor service reallocation on weekday local service.
Peak period express service restored.
52/952 Lawrence West:
Service reliability adjustments weekdays
Express peak period service improvements
60/960 Steeles West:
Seasonal service reductions
Reliability changes
68/968 Warden:
Reliability changes and some weekend service improvements.
Peak period express service restored.
85/985 Sheppard East:
All 85 local service on weekends will now operate with standard sized buses rather than with artics.
Weekend 985 express service restored.
Diversions
Note: These diversions are described in the service memo, but are not reflected in the scheduled service summary.
31 Greenwood:
Effective approximately May 18, service will be diverted to Coxwell Station while the loop at Greenwood Station is closed for Easier Access construction. This work will last about one year.
57 Midland
Service reliability adjustments.
Northern terminus shifted to the Redlea cul-de-sac via Steeles and Redlea.
Other Changes
365 Parliament Blue Night Bus:
Weekend service that was removed in error in fall 2021 will be restored.
73 Royal York and 76 Royal York South:
Service reliability improvements
During some periods, the 73B Eglinton service will interline with the 76B Queensway service.
83 Jones
Recovery time reallocated to the south end of the route to reduce conflicts near Donlands Station.
95 York Mills:
Stops added on Durnford Road and Rylander Blvd for the 95A Port Union extension. These will be reviewed in advance of the September 2022 schedule changes.
Service reallocation affecting some periods on the following routes:
16 McCowan (peak periods)
17 Birchmount (peak periods)
36B Finch West (am peak and early evening)
81 Thorncliffe Park (peak periods)
Service reliability changes which generally widen headways during most or all periods:
30 High Park
31 Greenwood
57 Midland
62 Mortimer
77 Swansea
93 Parkview Hills
Service reliability changes rebalancing driving/recovery time with no change in service level:
33 Forest Hill
101 Downsview
Service improvements:
31 Greenwood (peak periods)
33 Forest Hill (peak and weekday midday)
83 Jones PM (peak periods)
86 Scarborough early evening Zoo shuttle (restored, seasonal)
92 Woodbine South (weekends, seasonal)
996 Wilson Express (weekday midday and pm peak)
175 Bluffer’s Park (restored, seasonal)
Service reductions:
75 Sherbourne: AM peak and midday (seasonal)
600 Run As Directed: The number of crews/buses assigned to RAD service will be reduced by about one third as full scheduled service returns.
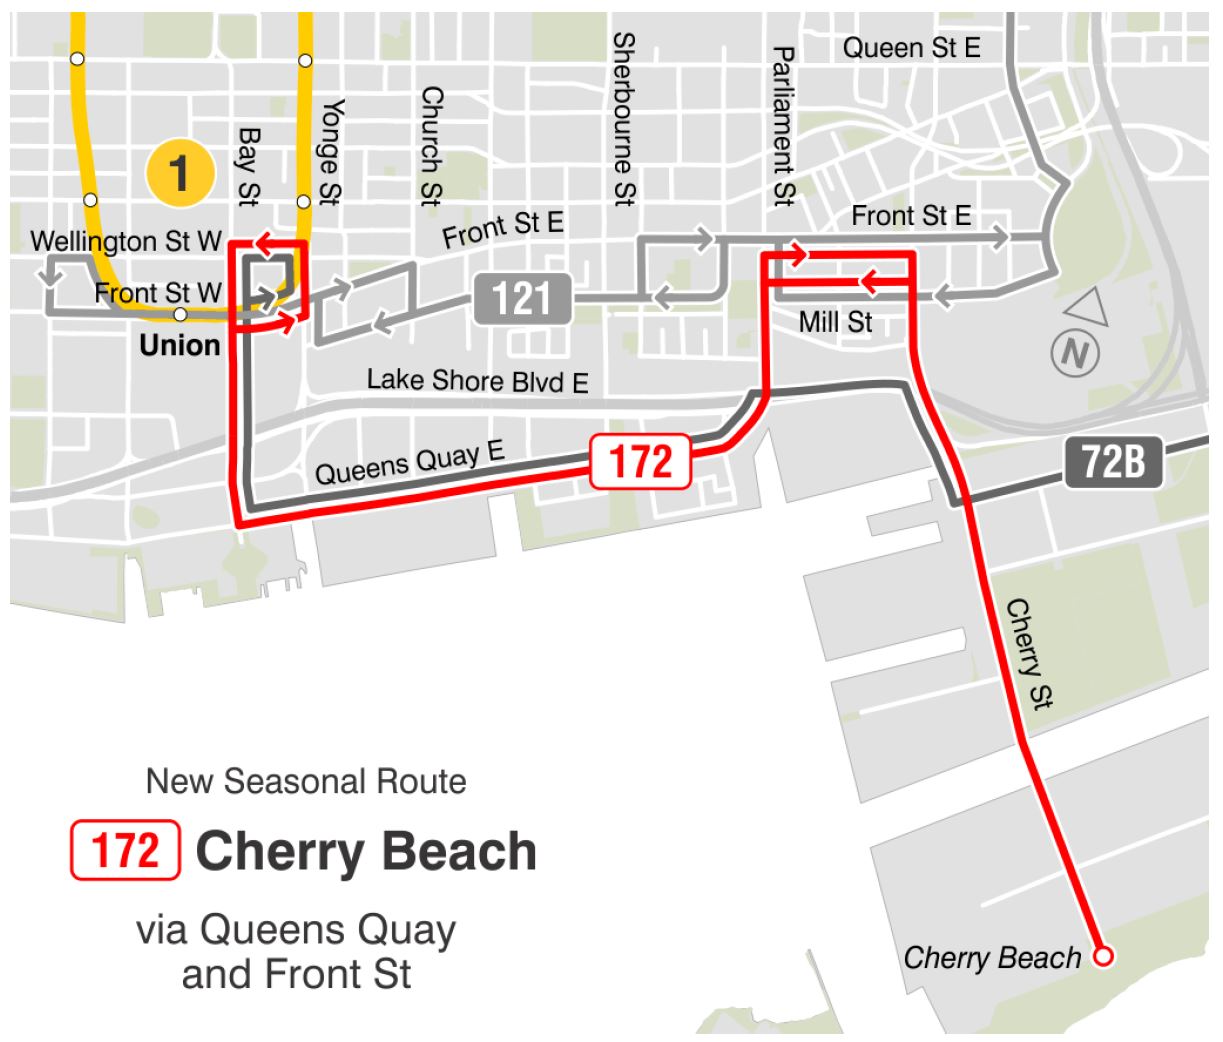
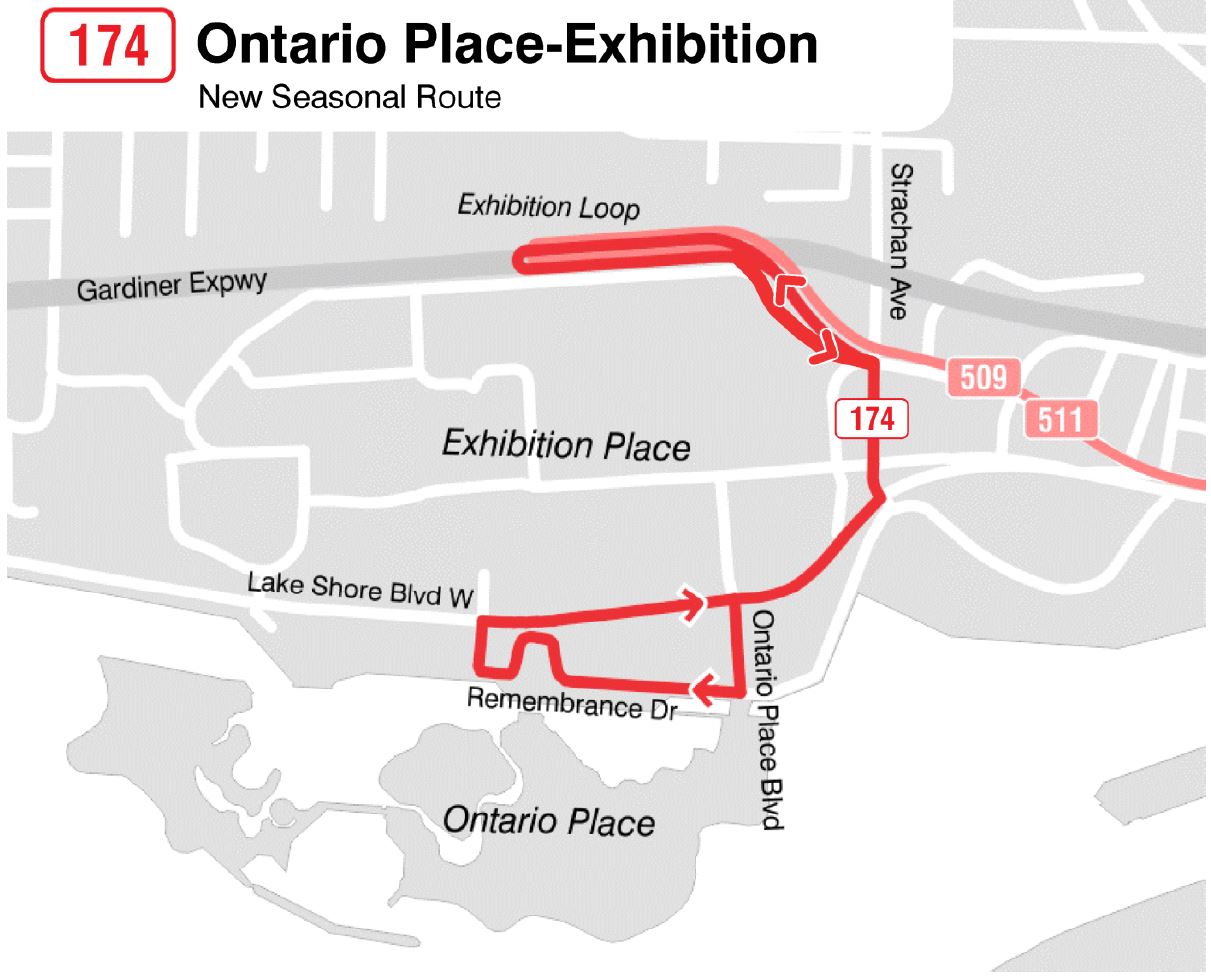
With the restructuring of bus service in the waterfront and the creation of the 121 Esplanade-River route, there is no existing route to provide seasonal service to Cherry Beach or Ontario Place. Two new routes, 172 Cherry Beach and 174 Ontario Place-Exhibition will operate instead.
172 Cherry links Union Station to Cherry Beach. It will operate from Eglinton Division.
174 Ontario Place links Exhibition Loop to Ontario Place. It will operate from Mount Dennis Division.
Details of the changes are in the spreadsheet linked below.