
This article continues a series reviewing major east-west routes in Scarborough. Previous articles are:
- Service Analysis of 95/995 York Mills, October-December 2021
- Service Analysis of 39/939 Finch East, October-December 2021
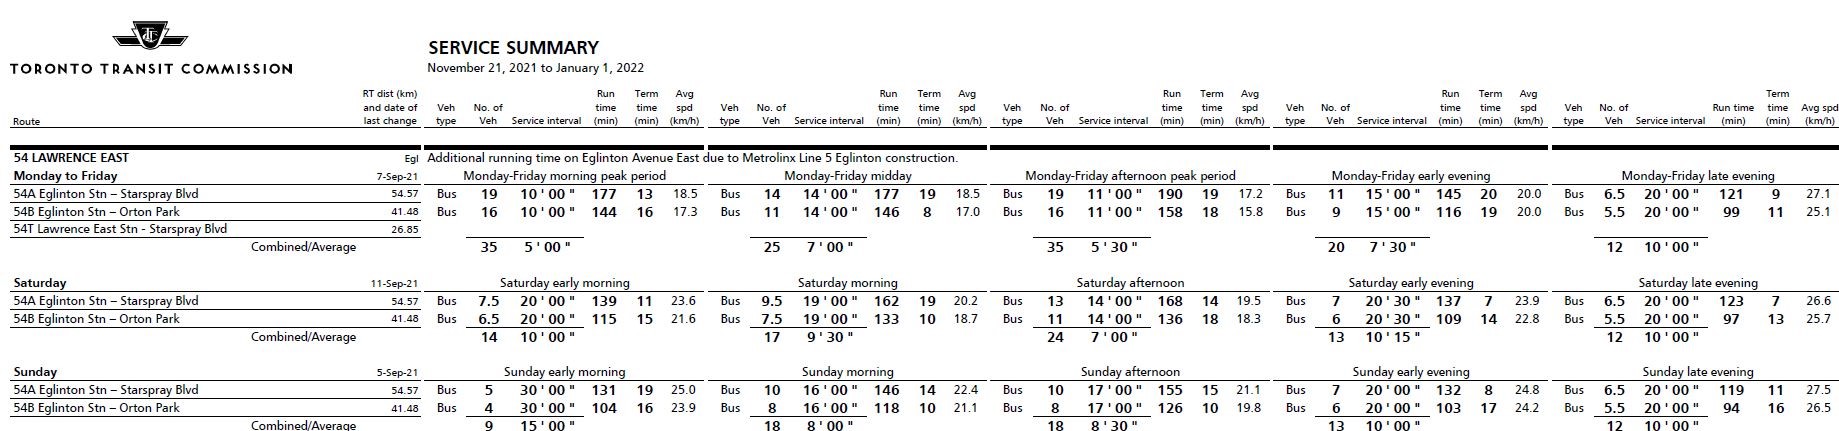
Service on Lawrence East is provided by two routes:
- 54 Lawrence East local service operates from Eglinton Station east via Eglinton and Leslie to Lawrence, then east to two destinations:
- 54A runs to Starspray Loop near the eastern boundary of Toronto.
- 54B runs to an on-street loop via Scarborough Golf Club Road, Brimorton Drive and Orton Park Road. The direction of this loop reverses after 3pm.
- 954 Lawrence East express service operates during peak periods between Lawrence East Station and Starspray Loop.
As part of a proposed route reorganization in Scarborough, the TTC proposed splitting off a separate Brimorton service, but this scheme is on hold.
Following opening of Line 5 Crosstown, the 54 and 954 services will be rerouted to Science Centre Station at Don Mills & Eglinton. As part of the RapidTO scheme, red lanes are proposed on Lawrence between Don Mills and Starspray Loop. This article reviews running service quality and travel times on three segments of the route:
- Port Union to Midland: Port Union is used as a screen line at the east end of the route because buses lay over at various places and in both directions making measurements right at Starspray Loop unreliable. Midland is the western screen line because it is just east of Lawrence East Station where buses might layover for various periods unrelated to traffic conditions.
- Kennedy to Victoria Park: Kennedy is the eastern screen line because it lies just west of Lawrence East Station. Victoria Park is the western screen line because this was the originally proposed western end of the red lanes.
- Don Mills to VictoriaPark: This section was added to the red lane proposals.
The schedules for both the local and express services are unchanged since September 2021.

Note that as in previous articles, data are missing for some days at the end of October and through November due to the cyber-attack on TTC systems.
In Brief
- As on other routes reviewed in this series, the distribution of actual headways is well beyond what is contemplated in schedules or even in the TTC’s Service Standards which aim to keep most service within a six-minute wide band of “on time” performance.
- Bunching and wide gaps are very common, even on comparatively “quiet” days like weekends and holidays.
- Severe congestion effects appear rarely and typically show up as bulges in average travel times for specific weeks and days pulling them away from normal levels.
- Headways on the express service 954 can be quite variable and the range of values exceeds the typical 5-minute difference in travel times between local and express operation between Port Union and Midland.
- Some improvement in service is possible with reserved transit lanes to make travel times more reliable, but this must be accompanied by dispatching service so that buses are regularly spaced.
Weekday Headway Reliability
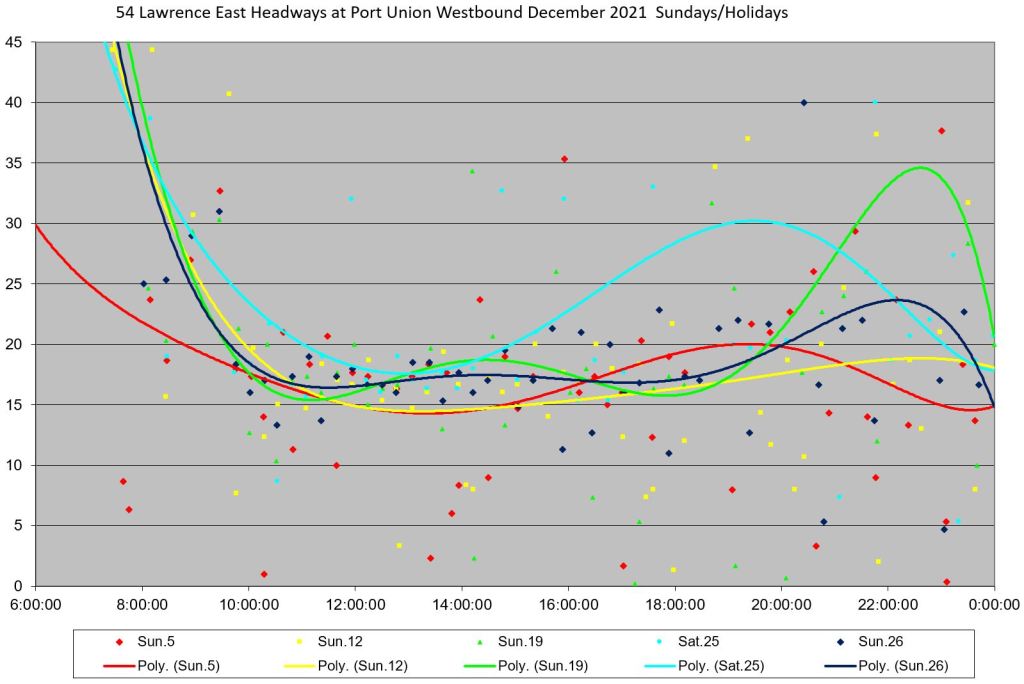
Service Westbound at Port Union
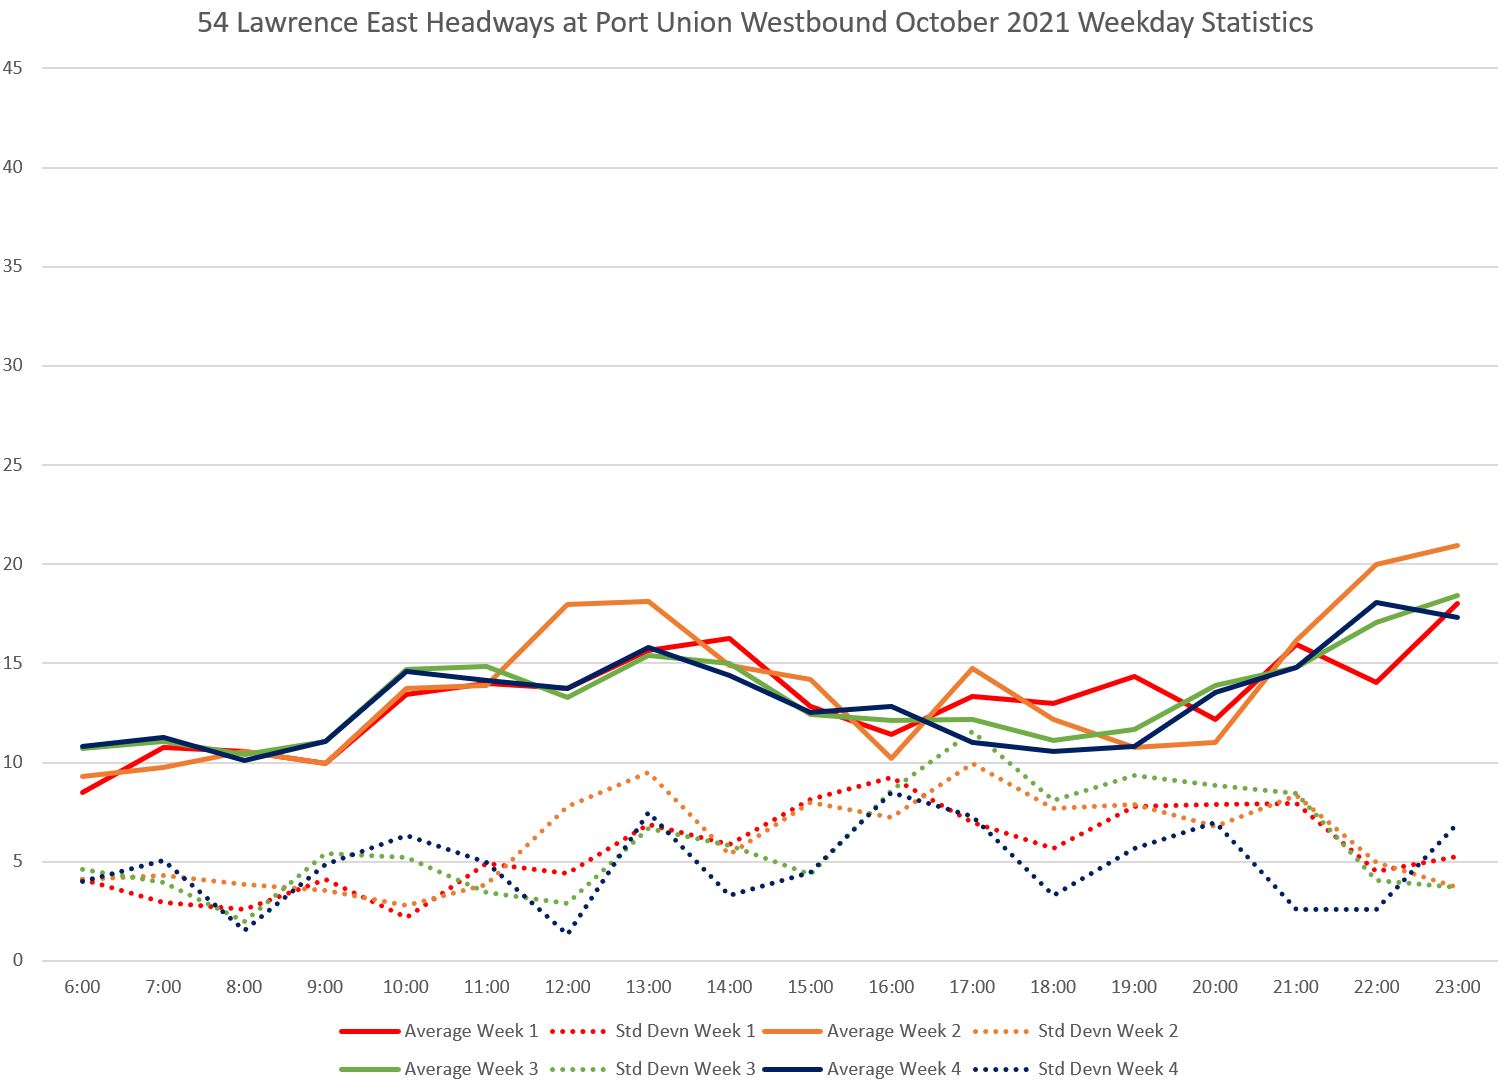
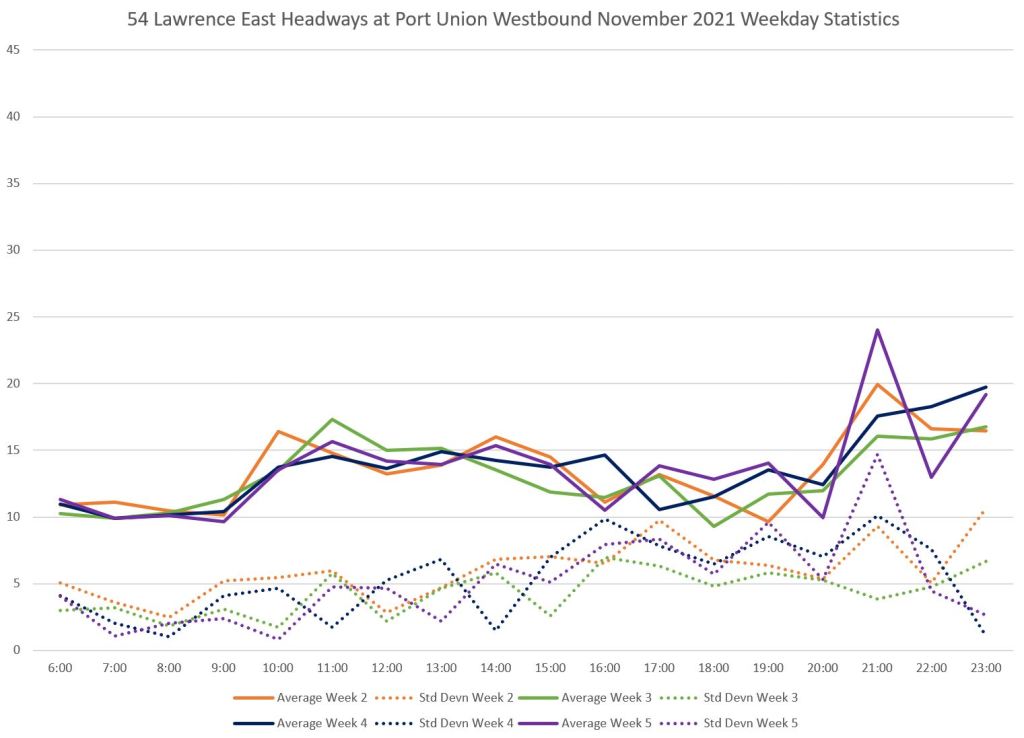
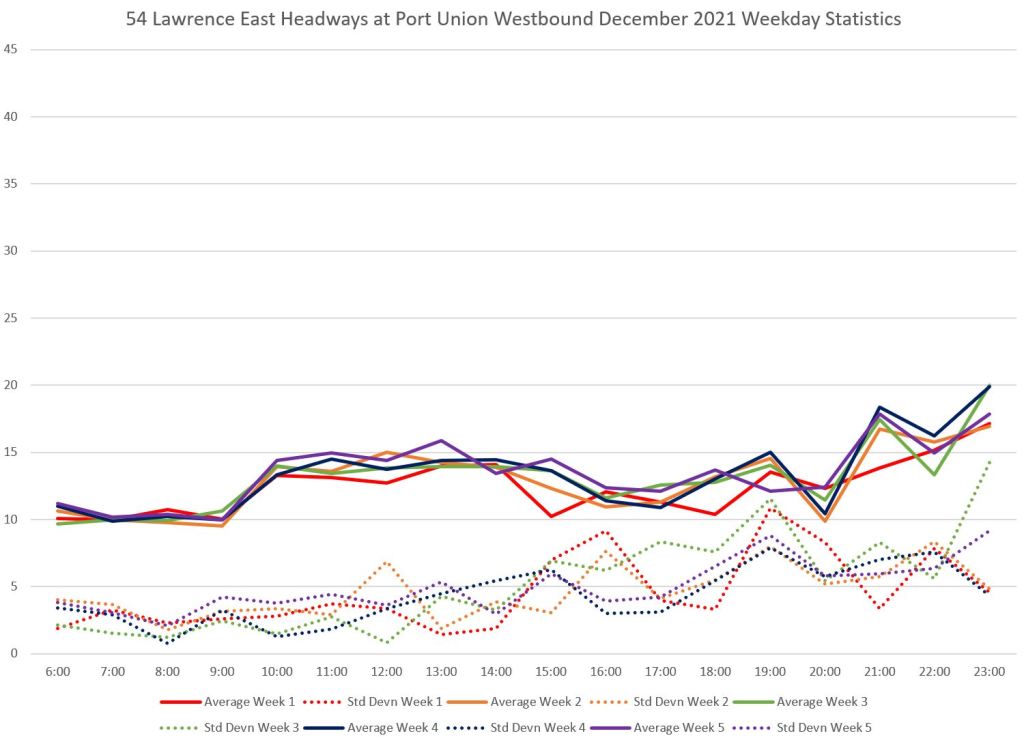
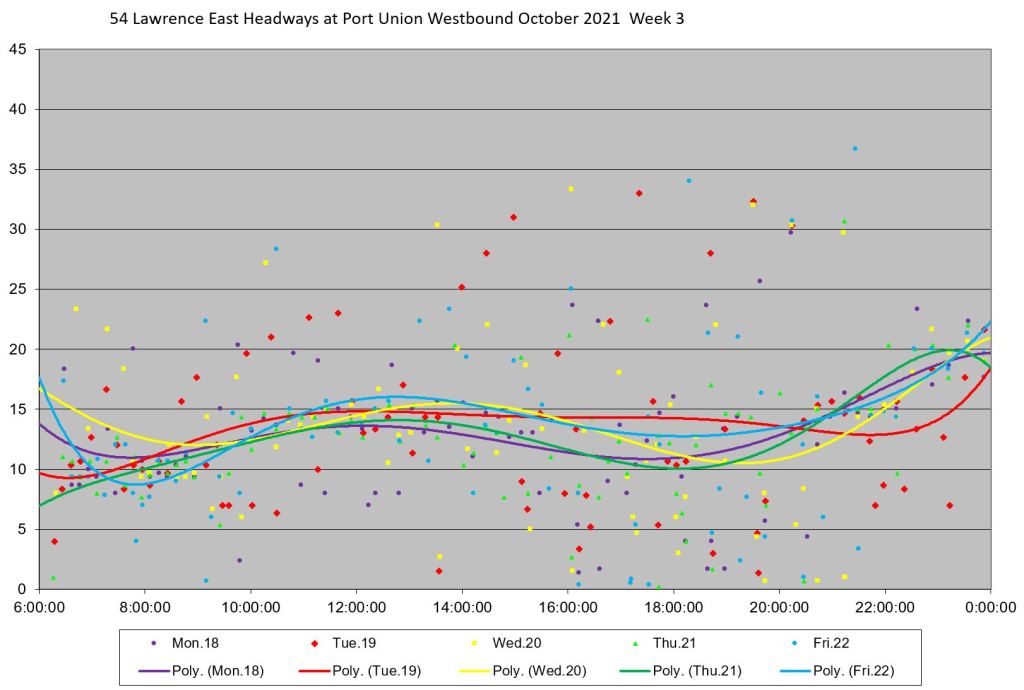
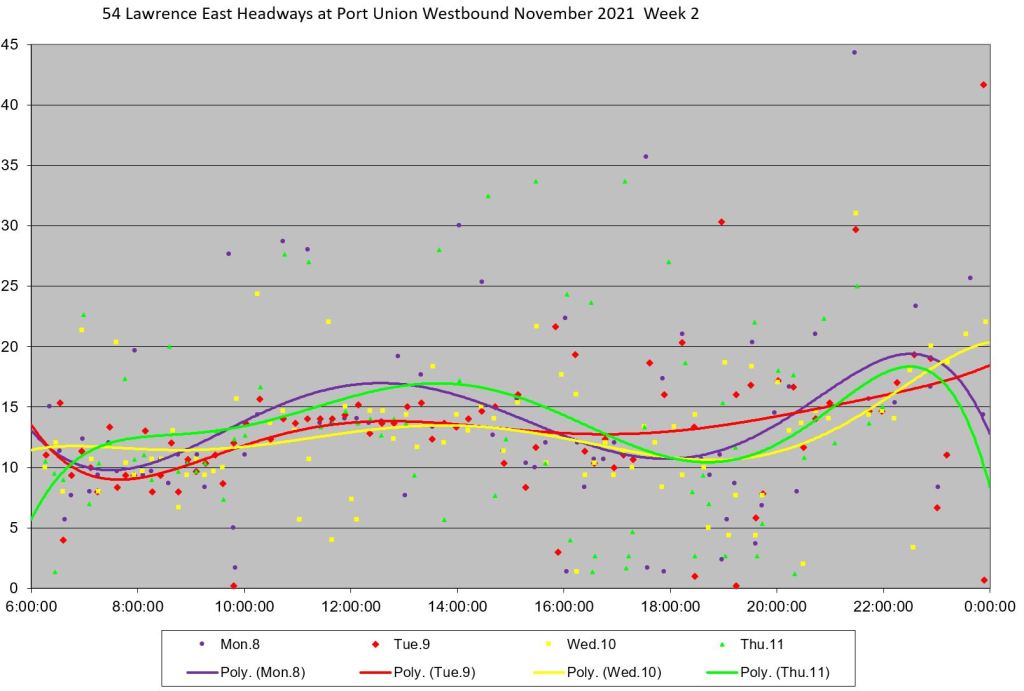
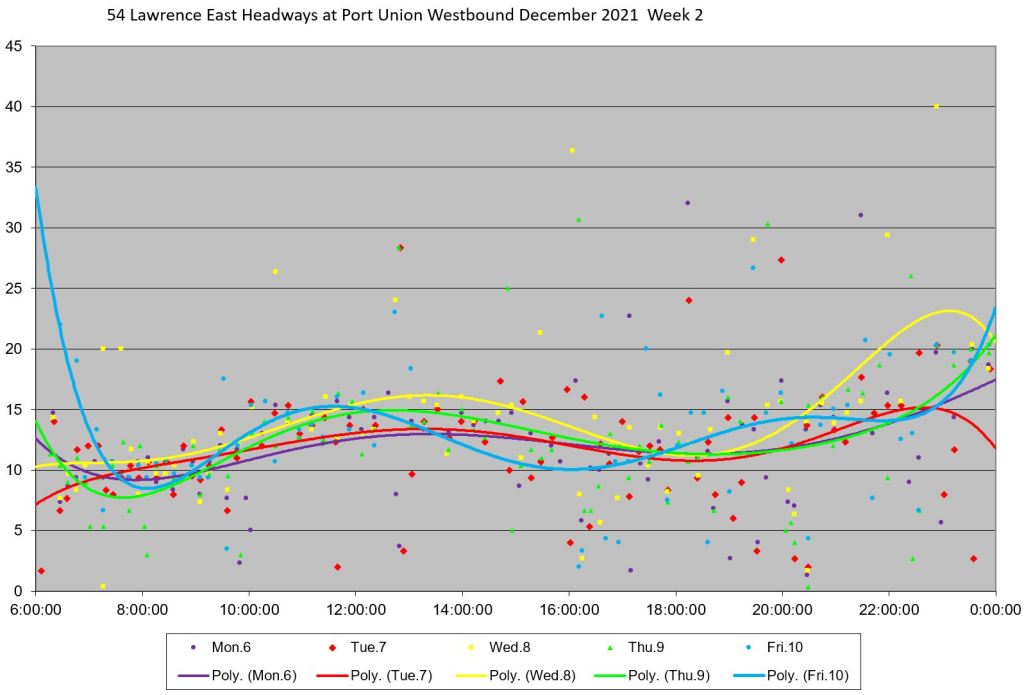
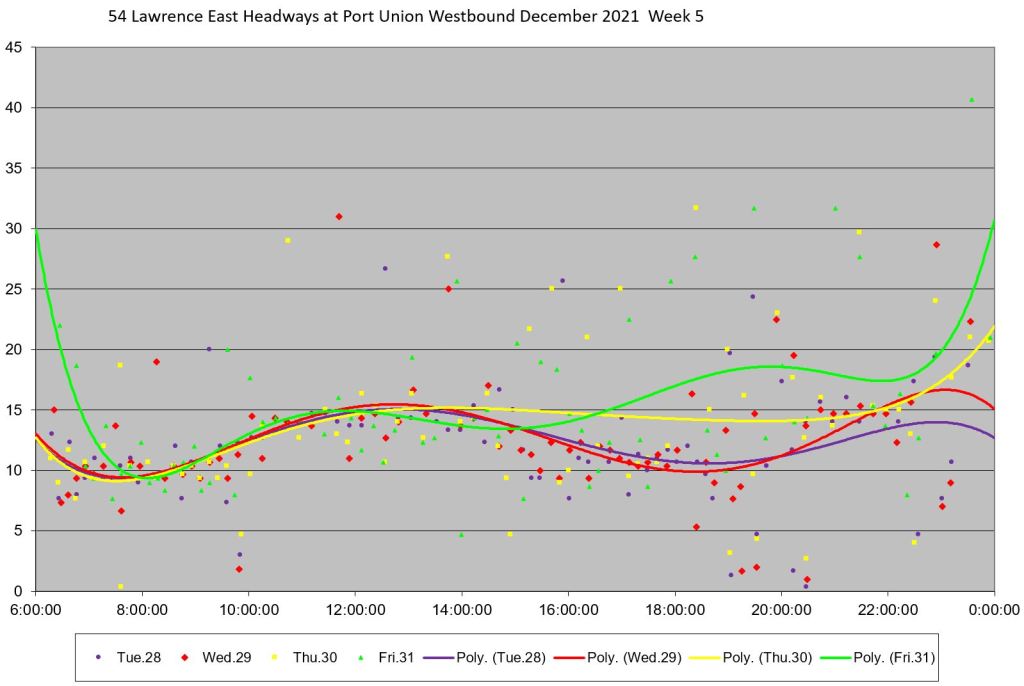
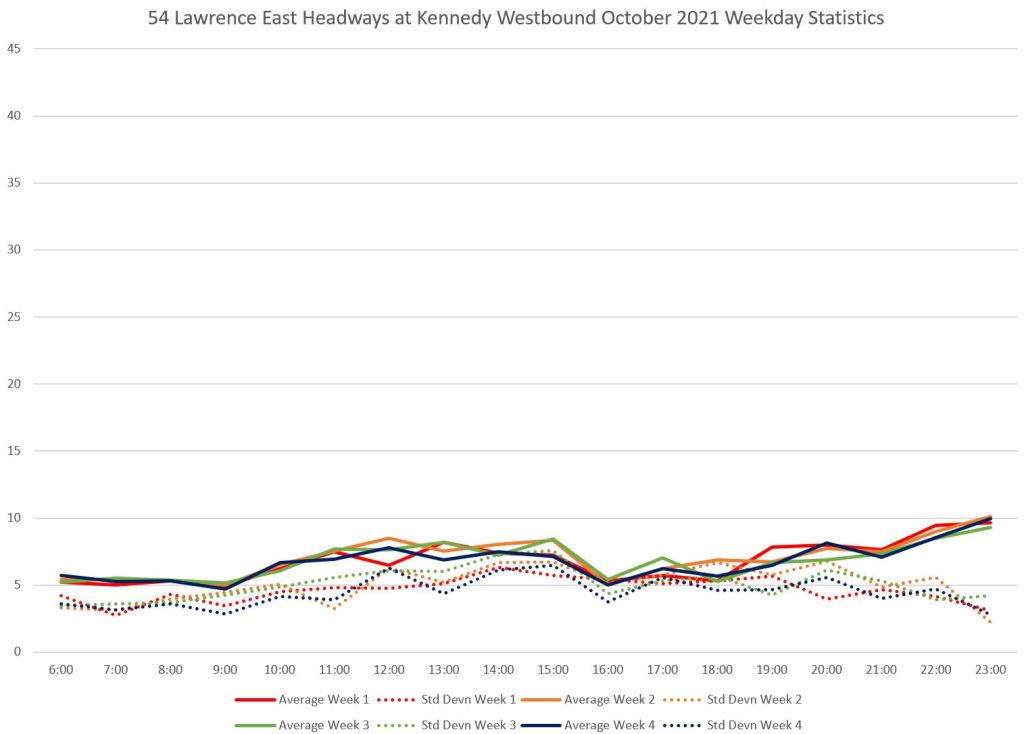
The first trio of chart shows the averages and standard deviations for headways westbound at Port Union Road. This is used here as the screenline because the location and direction of bus layovers at and near Starspray loop varies, and a screenline near the loop would not reflect service as riders see it.
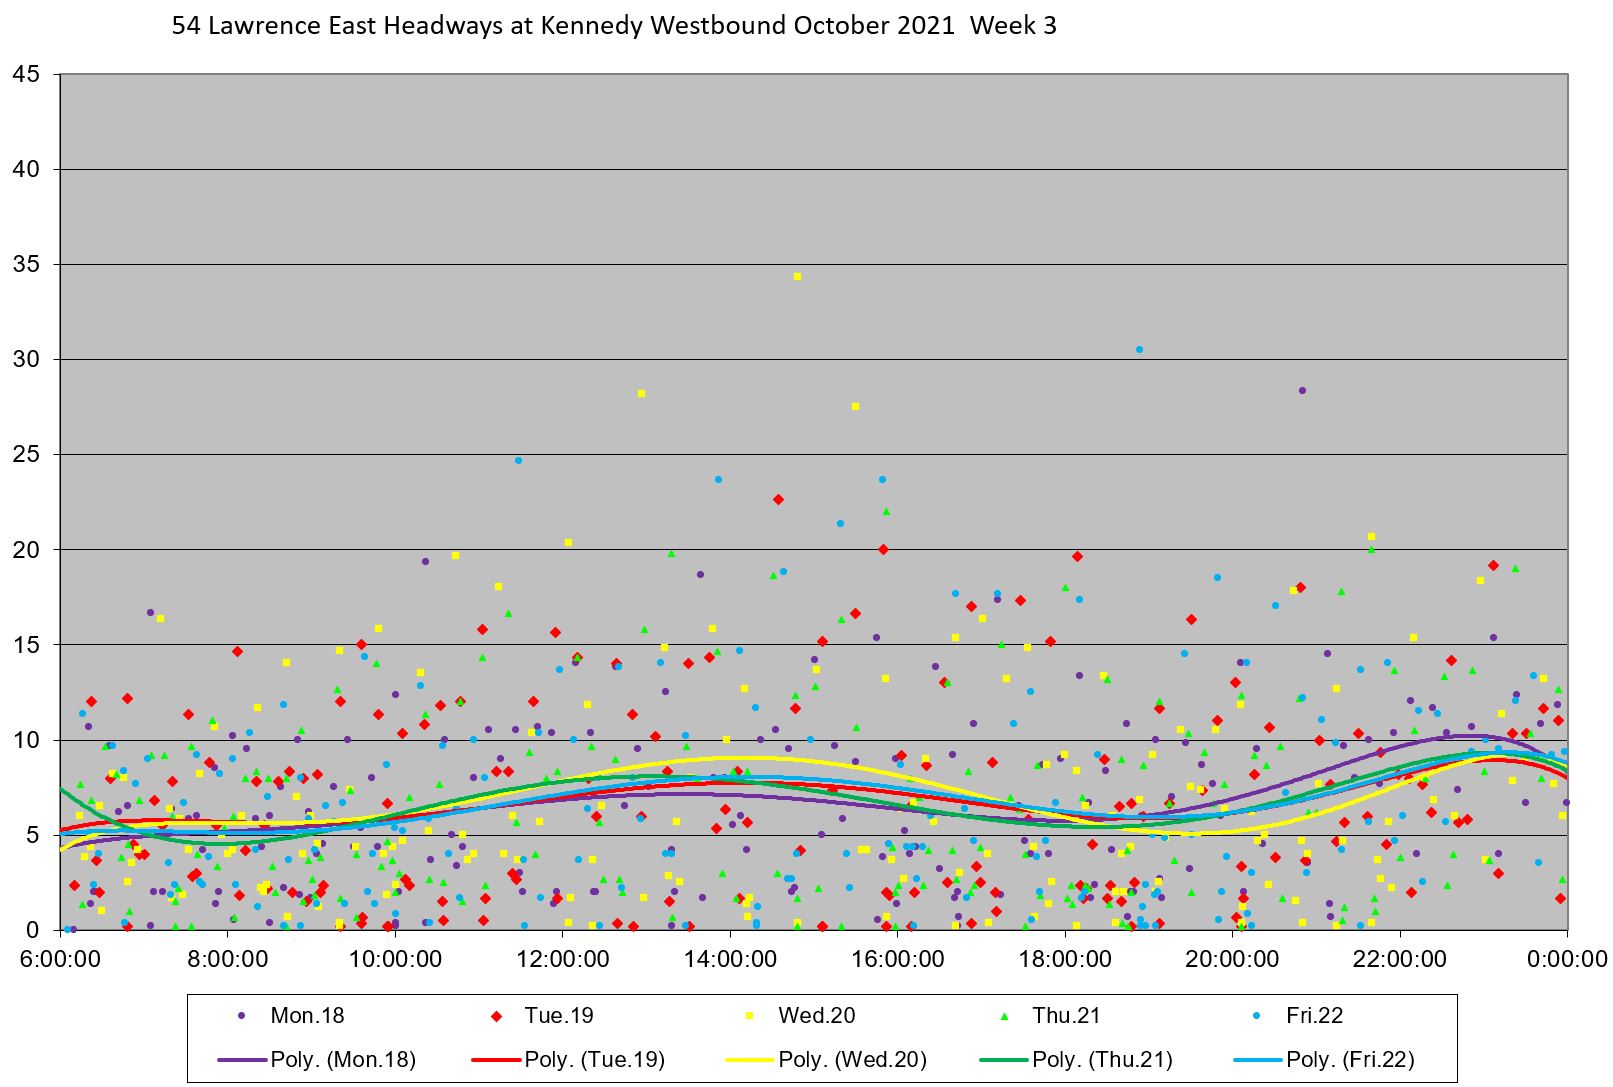
The shape of the averages follows the same general path, but the high values of the SD lines (dotted) indicates that there is substantial variation in the values. This shows up in the width, the scatter, of the “clouds” of data points in sample charts below.
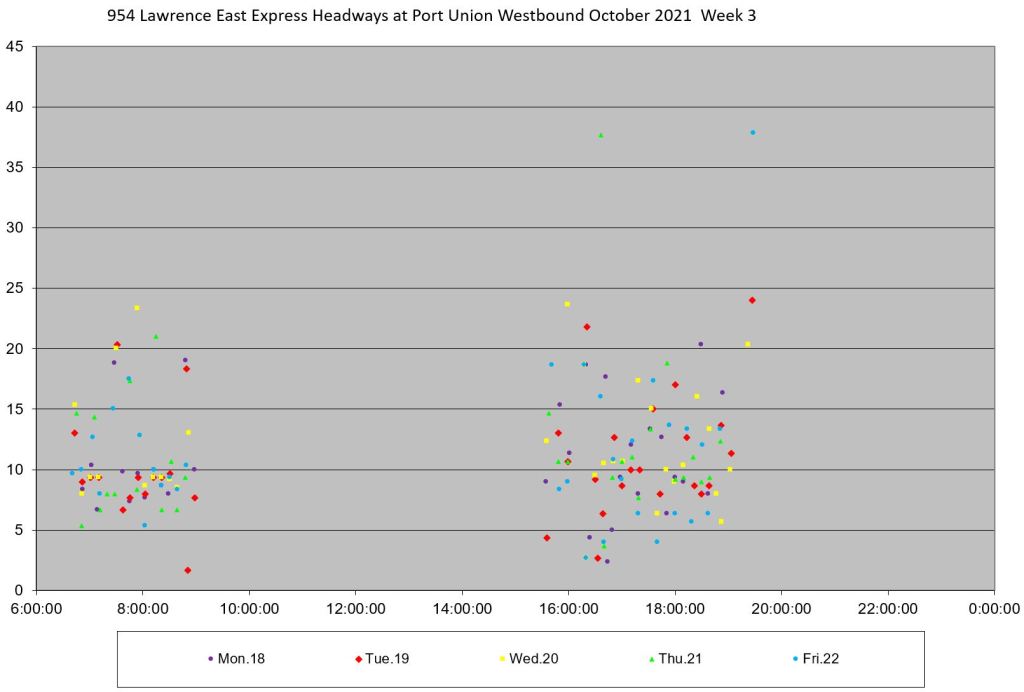
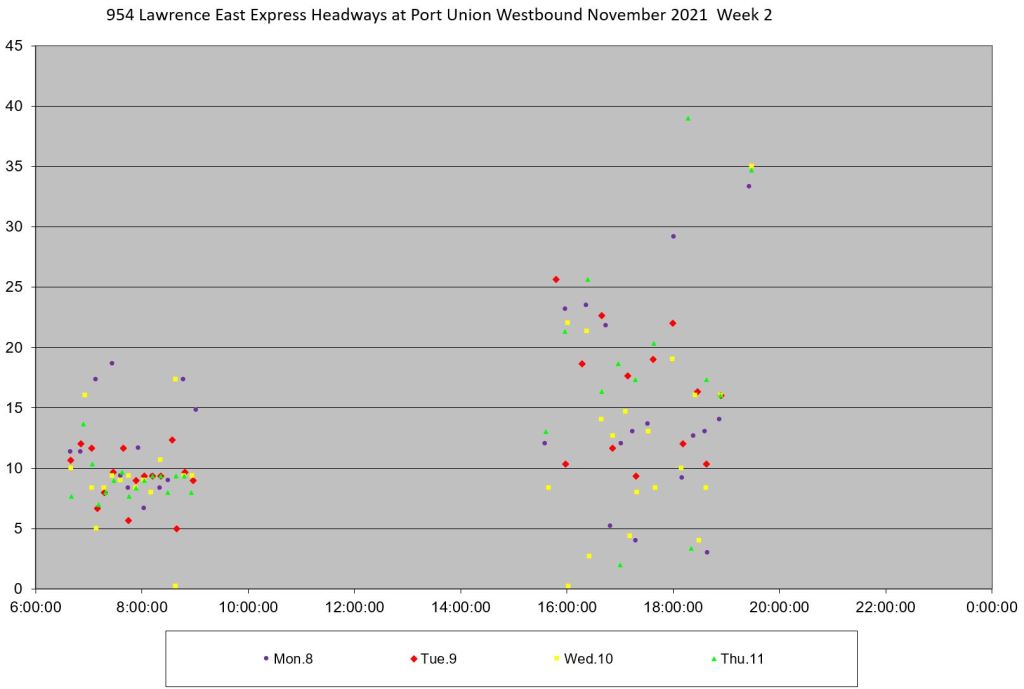
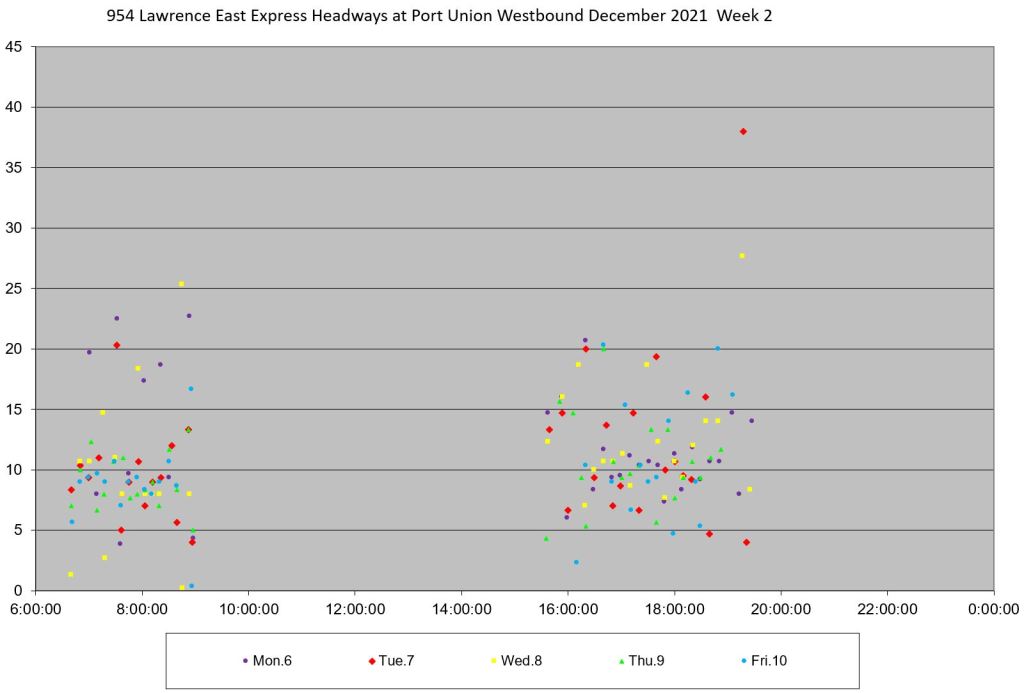
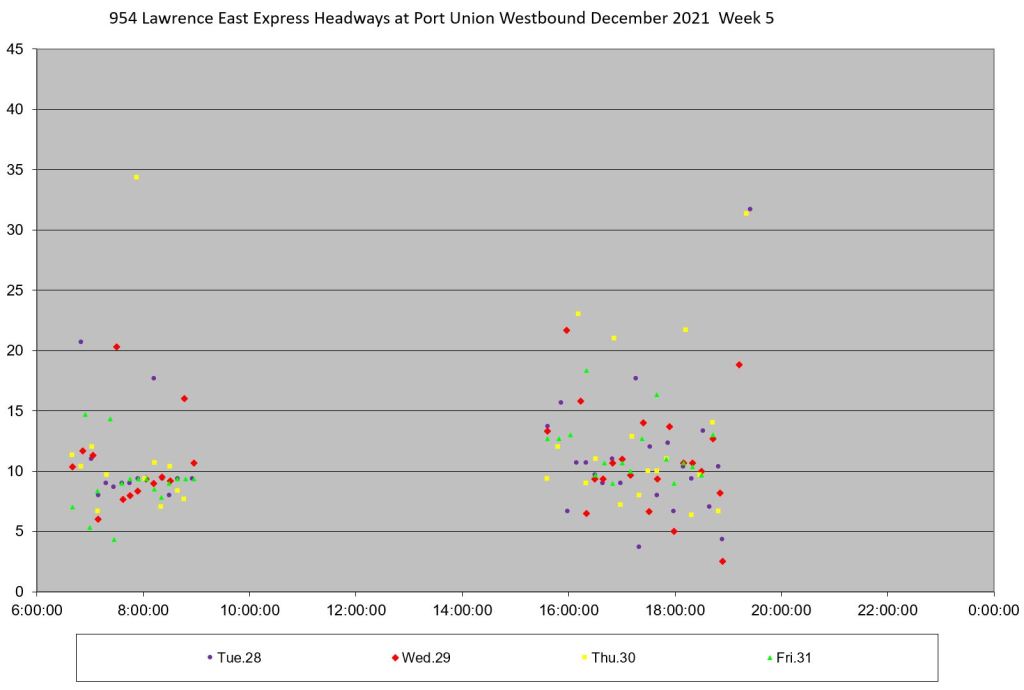
In this set of charts, the left column contains data for the 54 local service, while the right column contains data for the 954 express service. Both originate from Starspray Loop and are measured at the same screenline.
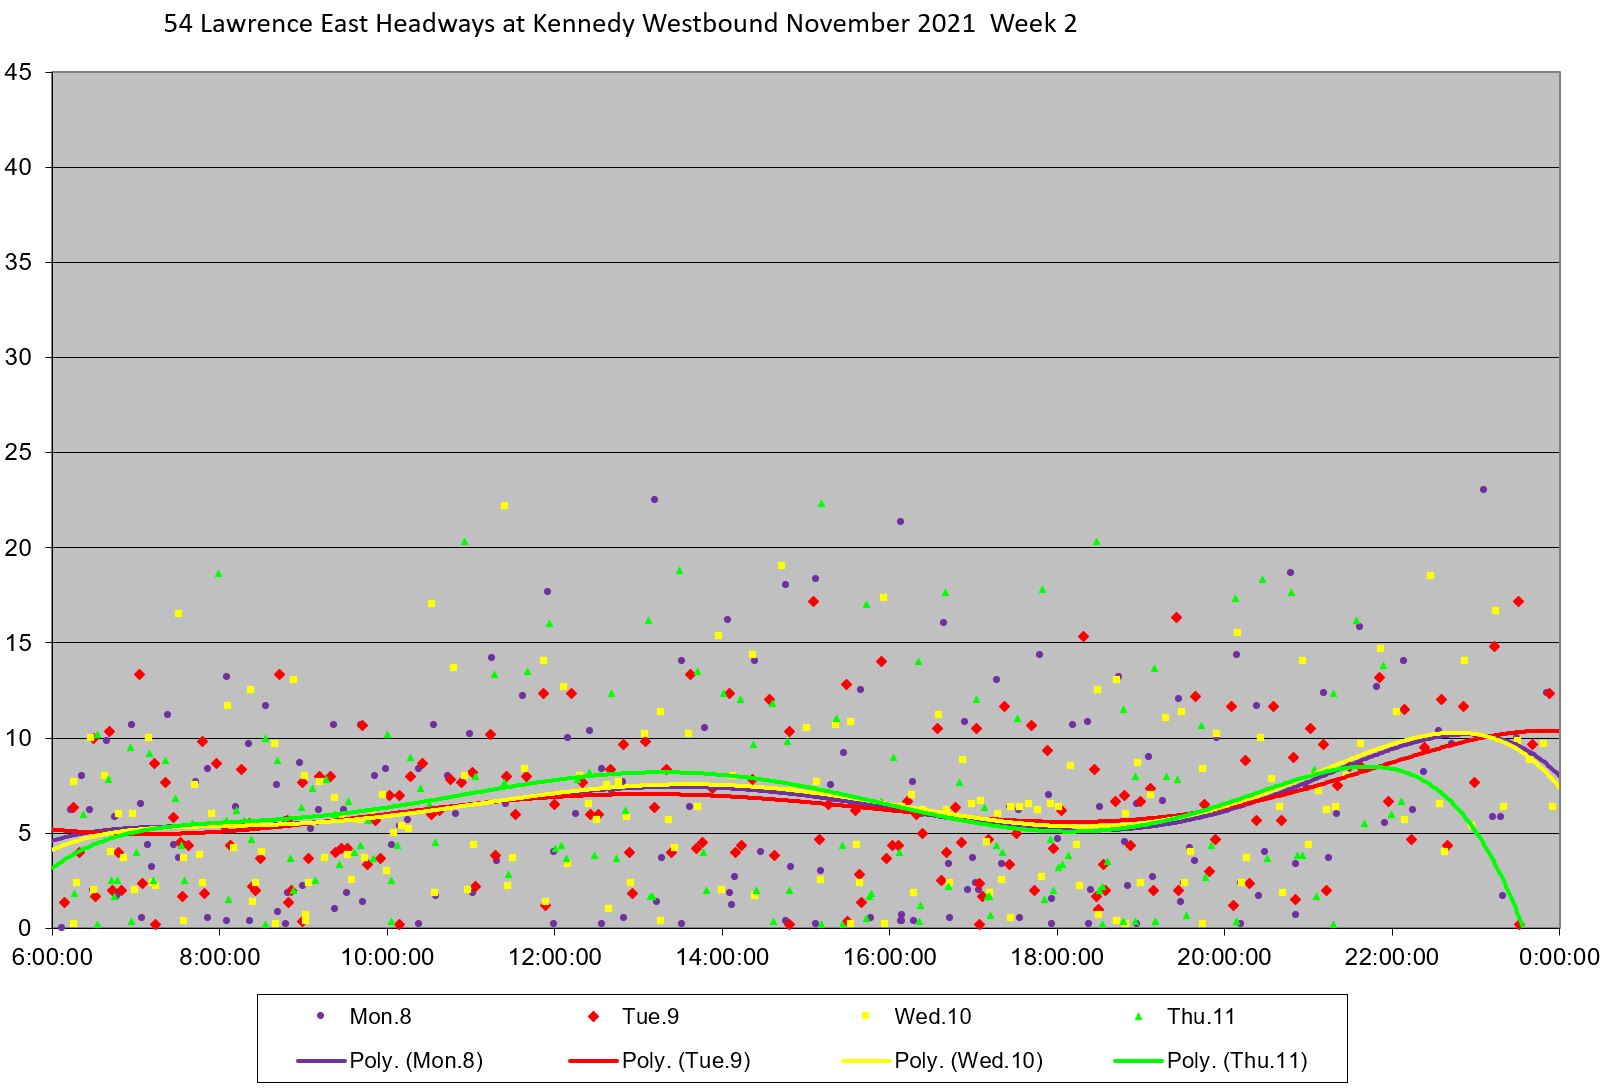
Very wide gaps in service do occur, and these are generally mirrored by very short headways indicating that buses are travelling together. This is the inbound service from a point where departures could be regulated. On certain days, notably Tuesday, November 9, the actual headways lie together along lines that roughly match the scheduled value, but this pattern ends after 2pm suggesting a change in line management technique.
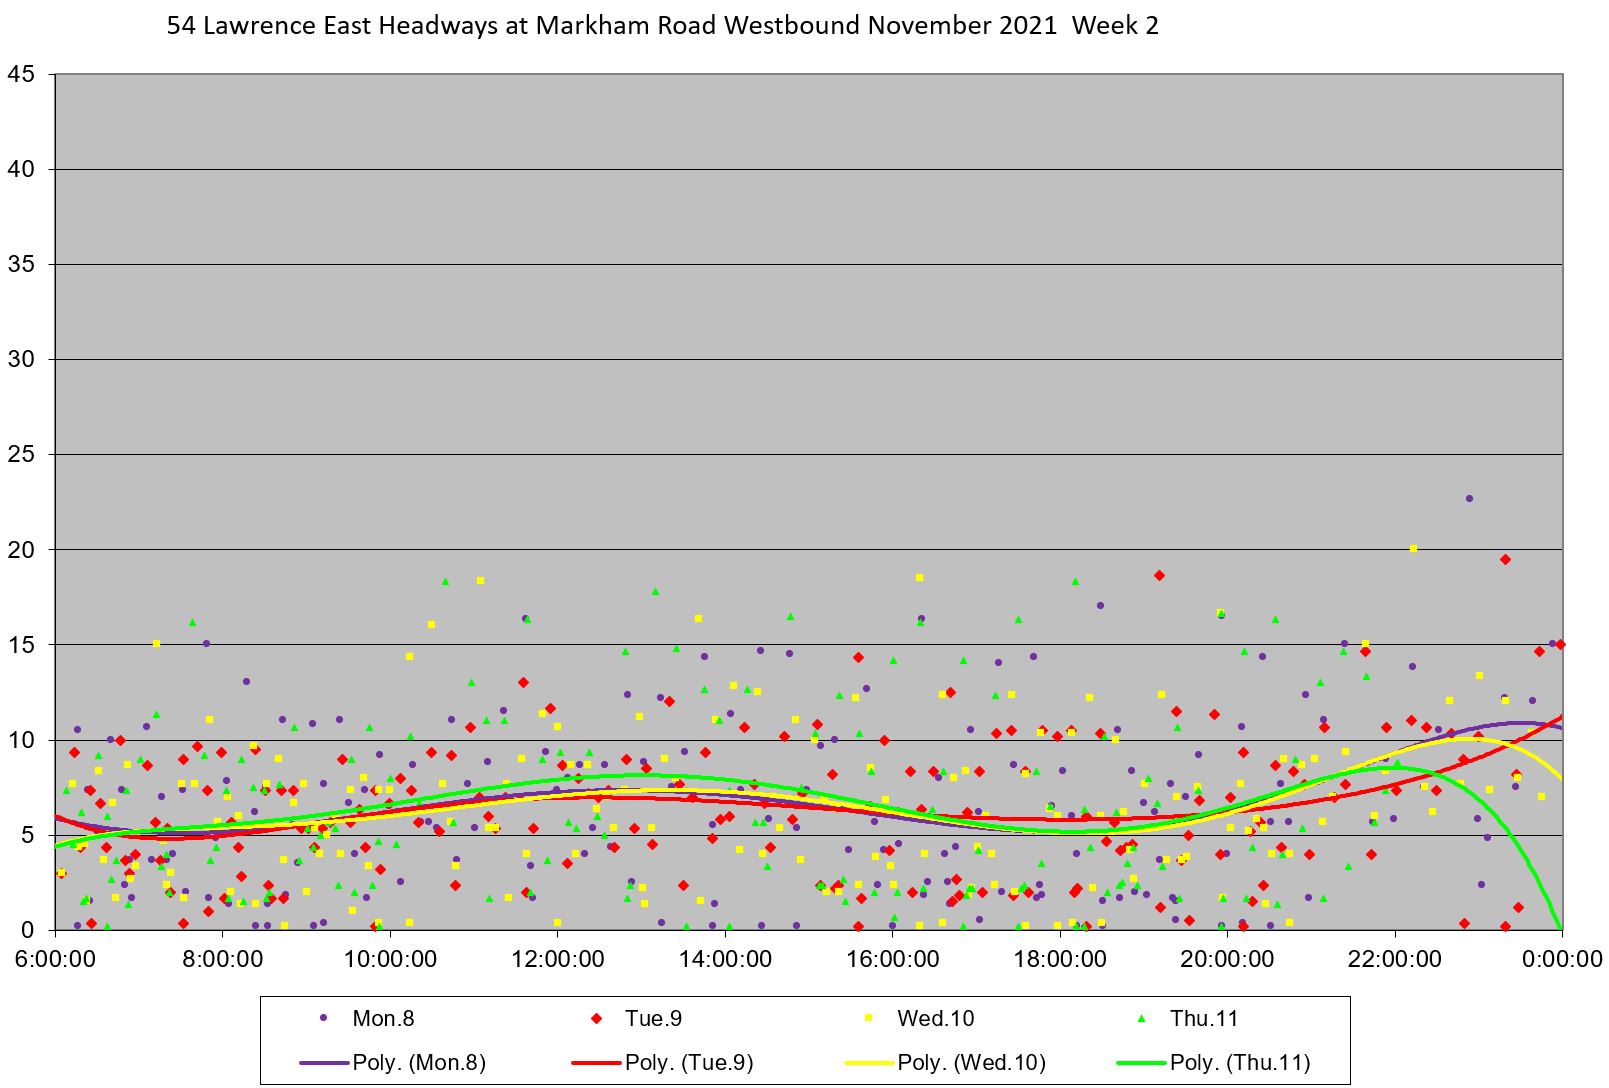
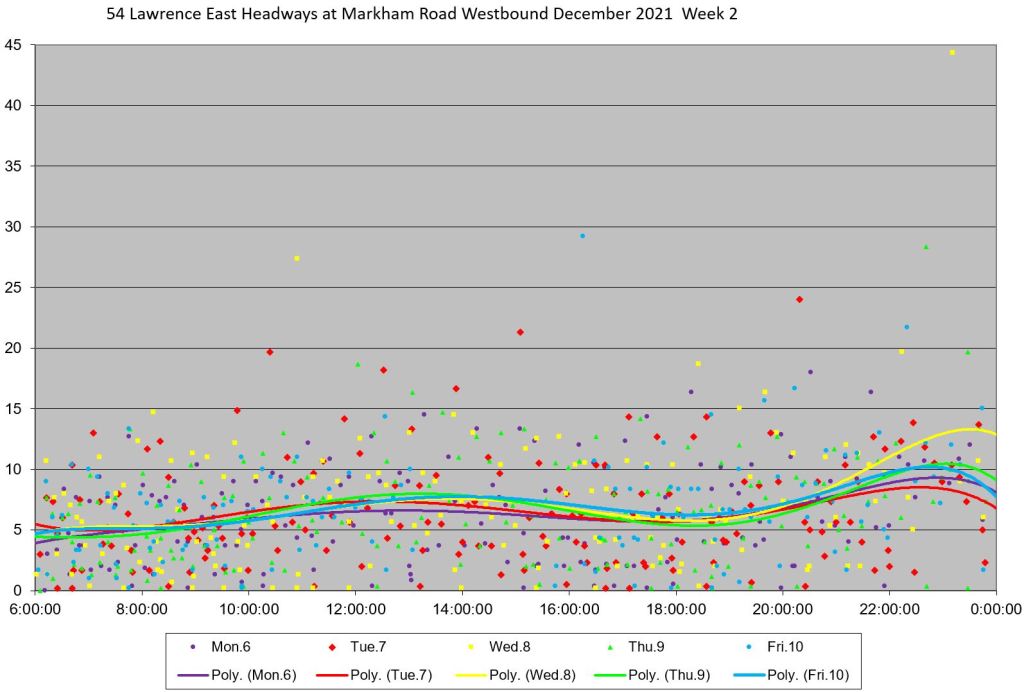
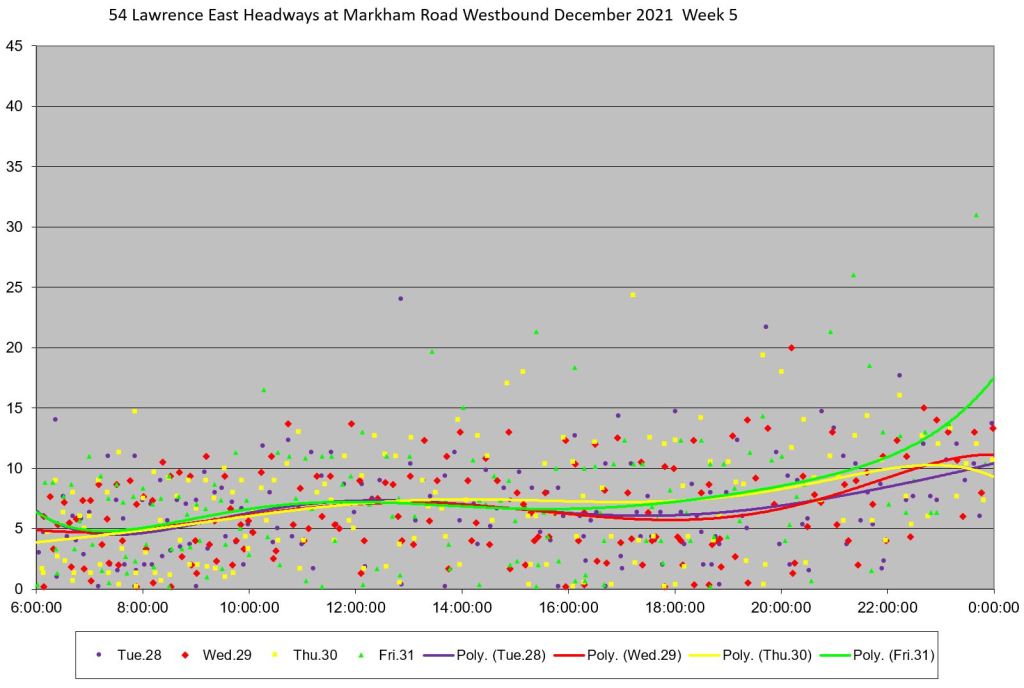
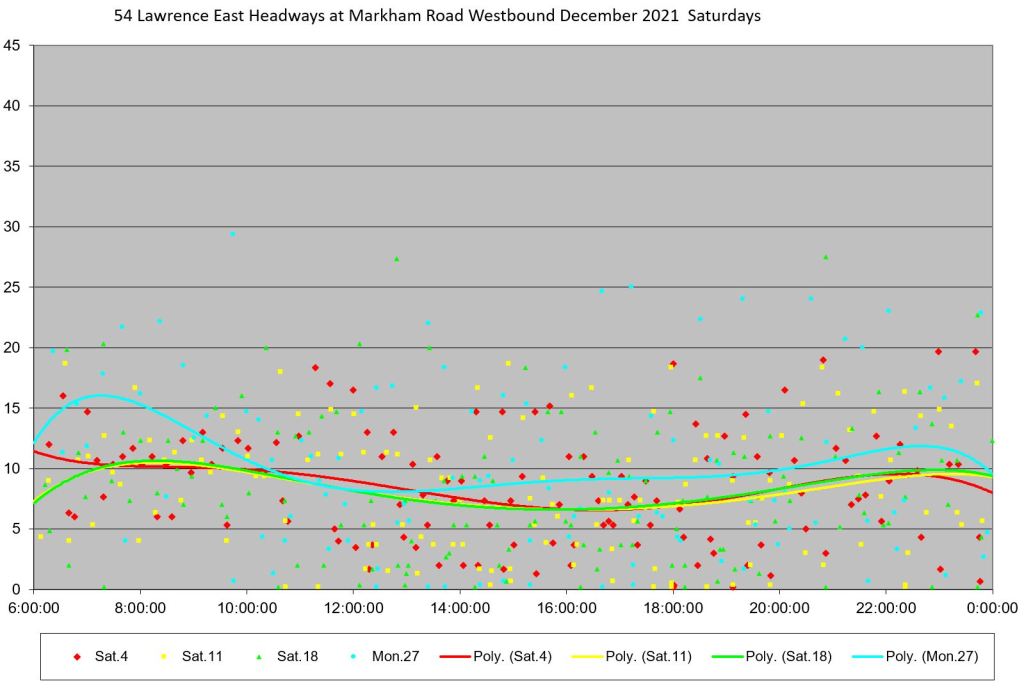
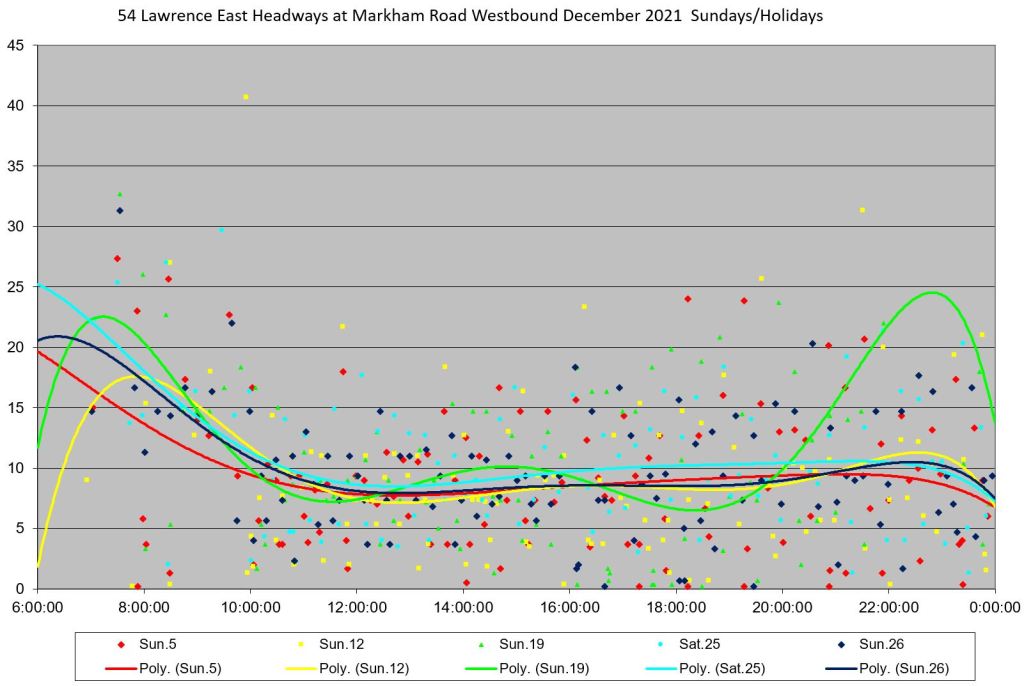
Service Westbound at Markham Road
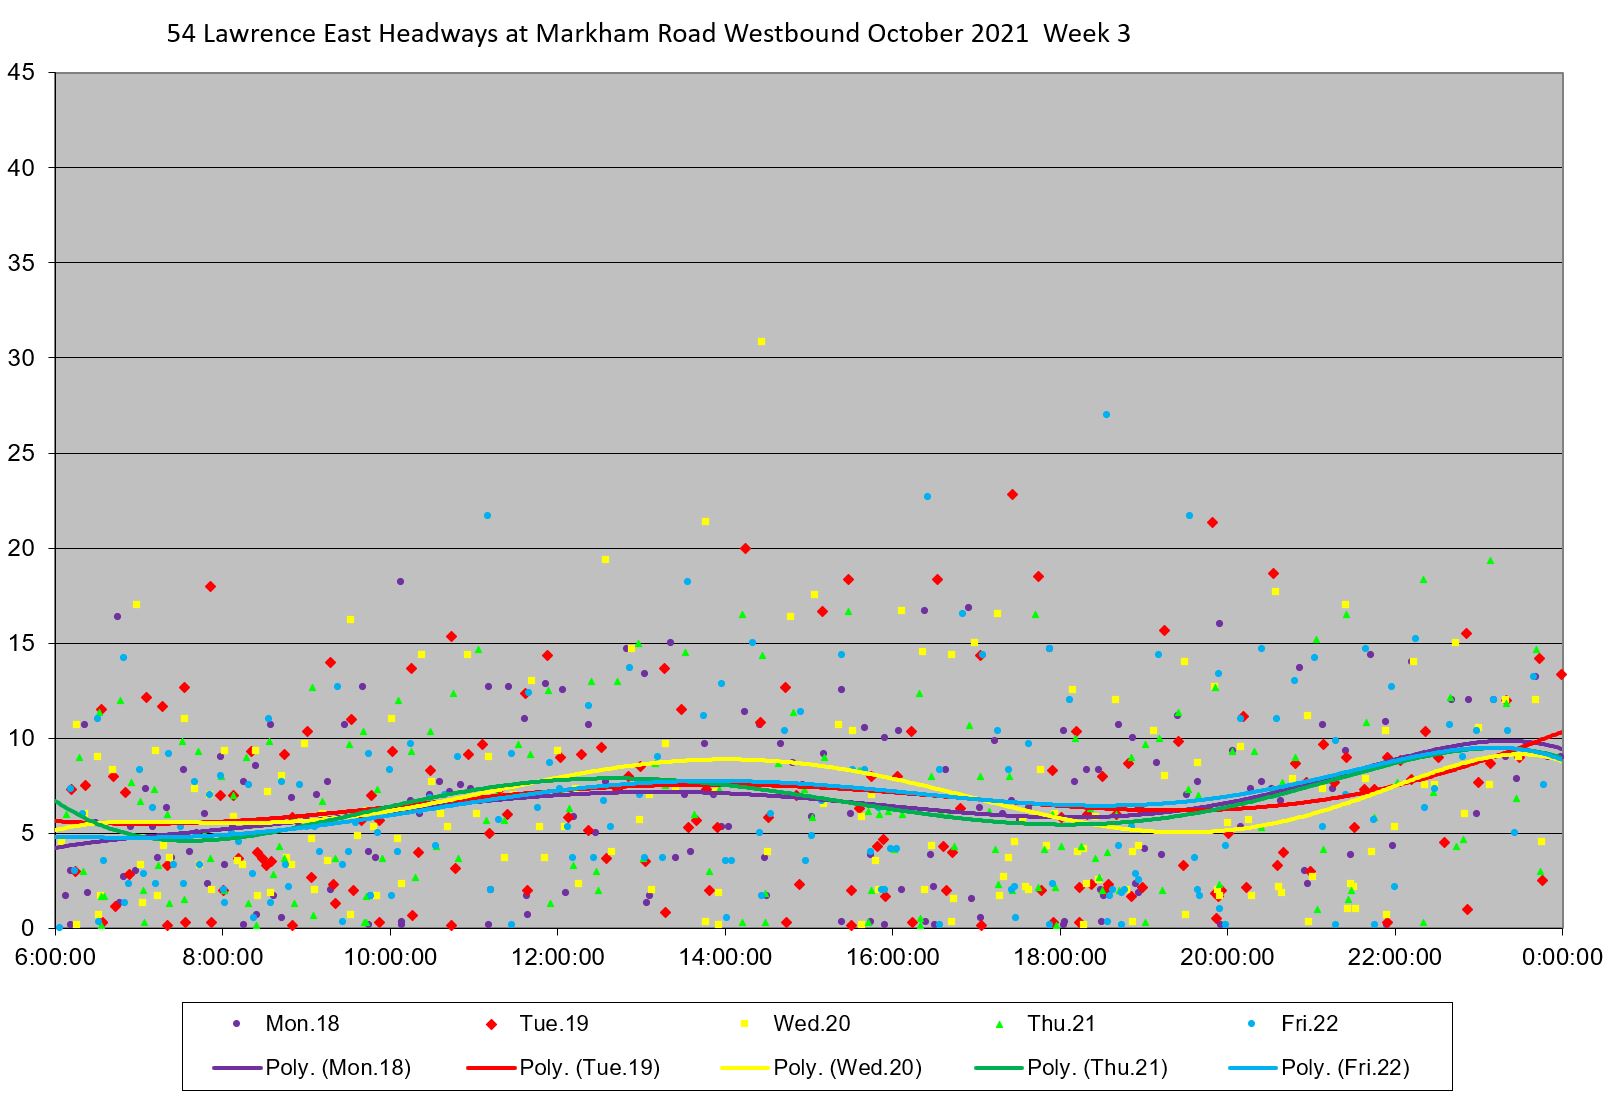
By the time we reach Markham Road, the Orton Park branch has merged with the through service from Starspray. The average headways follow the pattern set down by the schedule, but the SD values are close to the averages. This indicates that there is a lot of bunching, something that can be seen by the many very short headways in the detailed charts below.
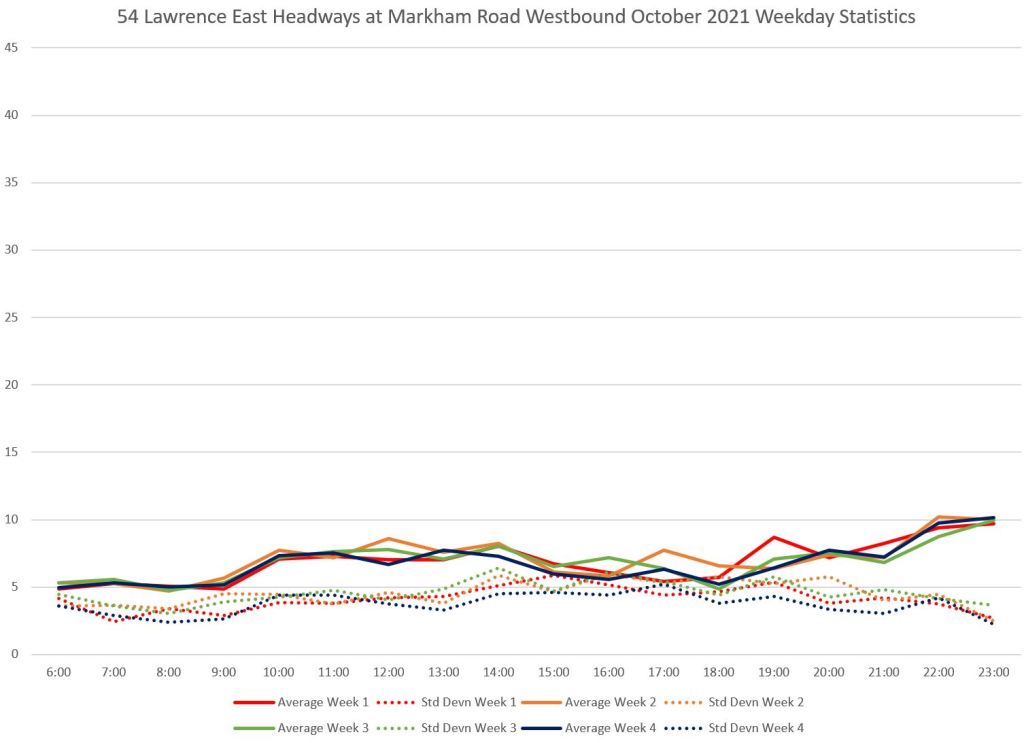
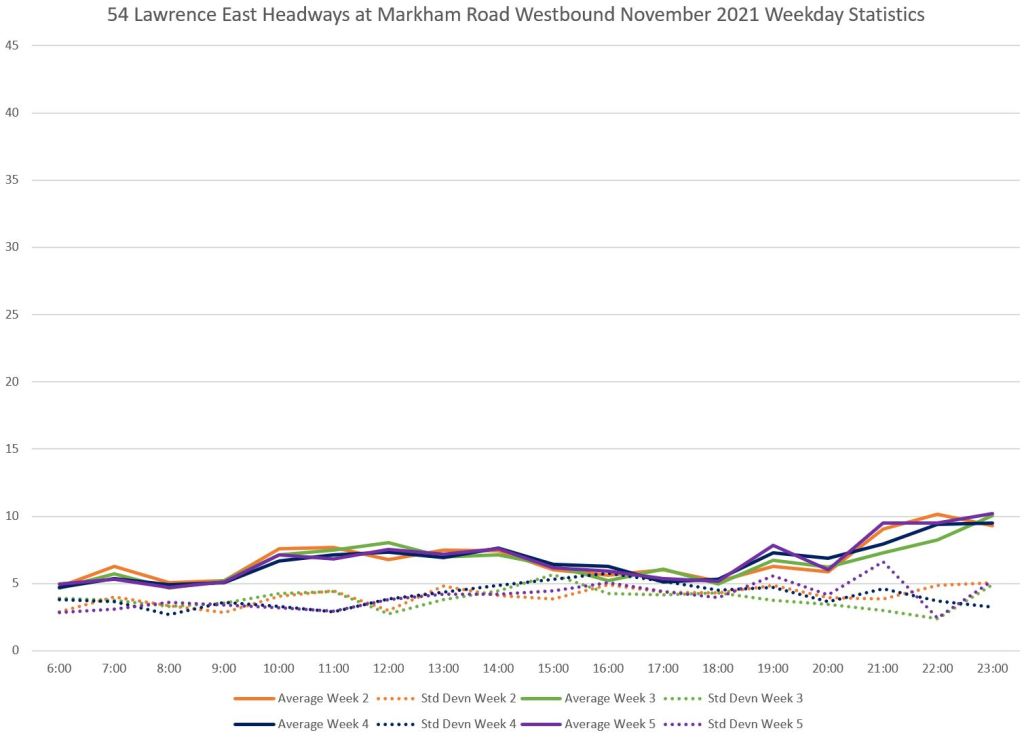
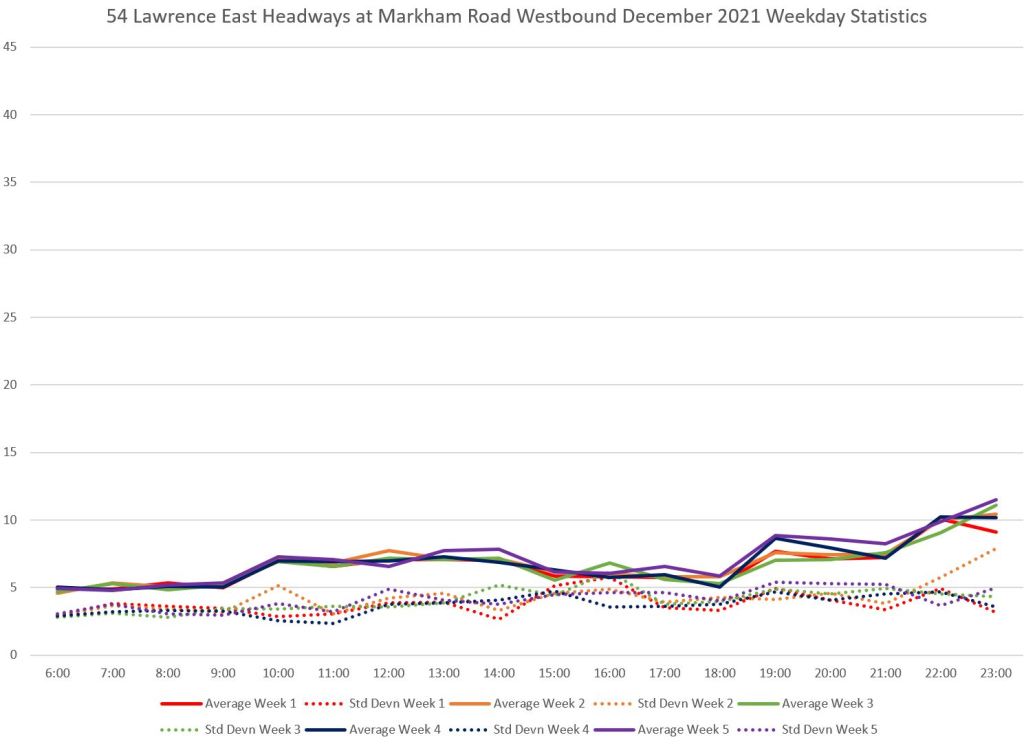
Note that for this location, only the local service is shown.
In the last week of December, the scatter of data points is a bit less than other weeks and stays mainly below 15 minutes, However, the overall pattern of many buses running close to each other remains.
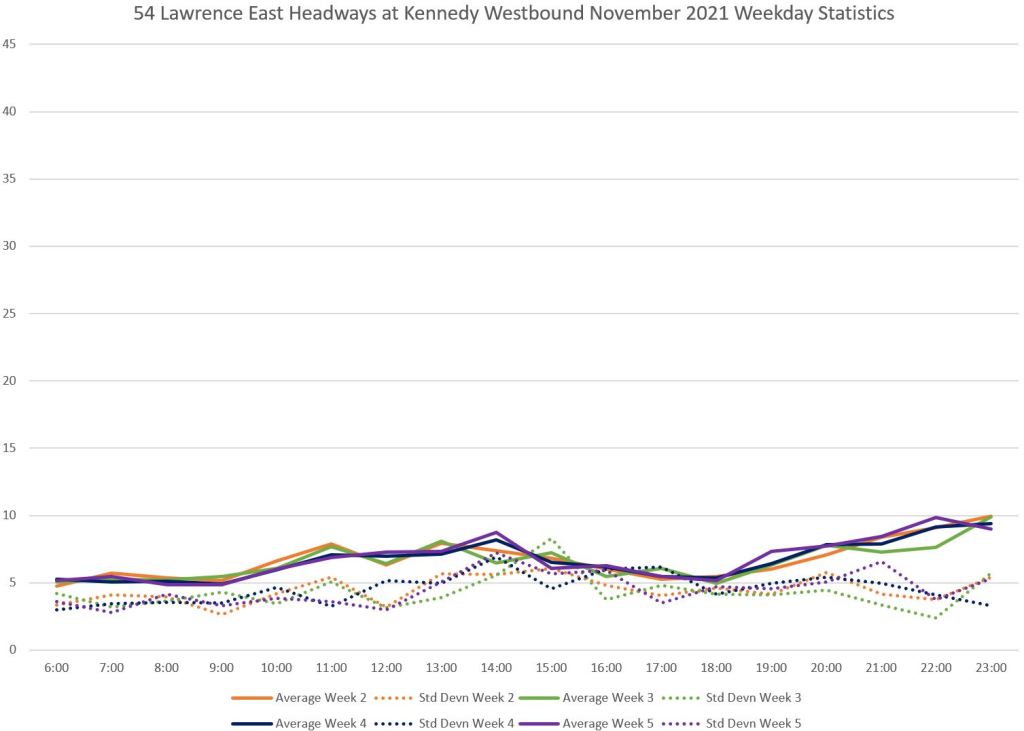
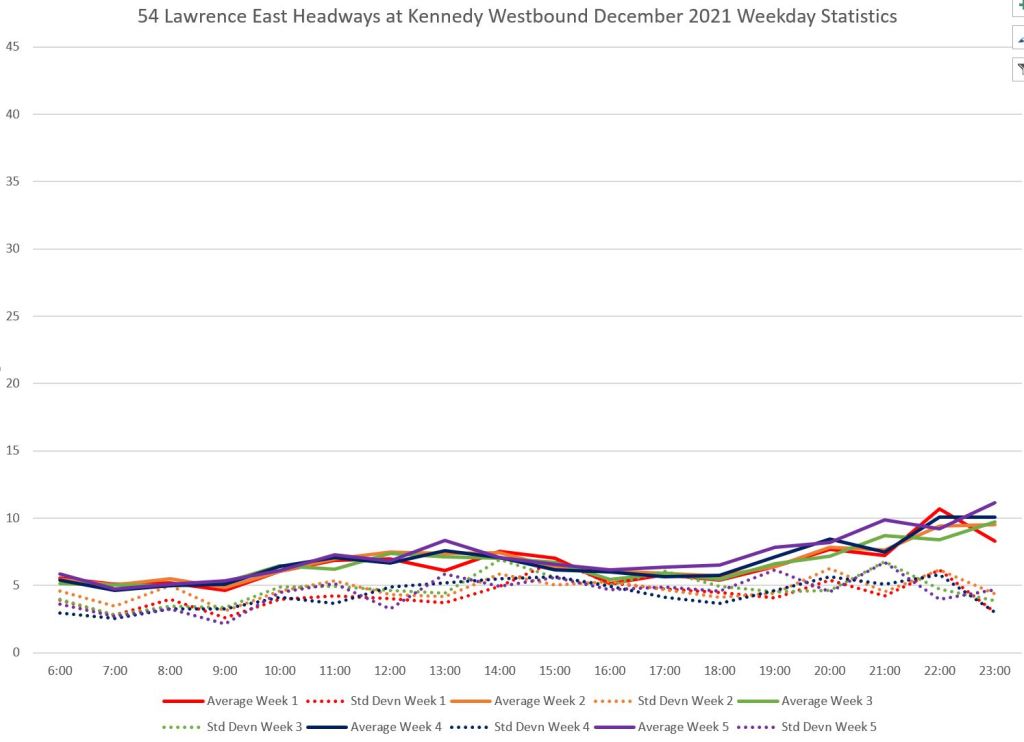
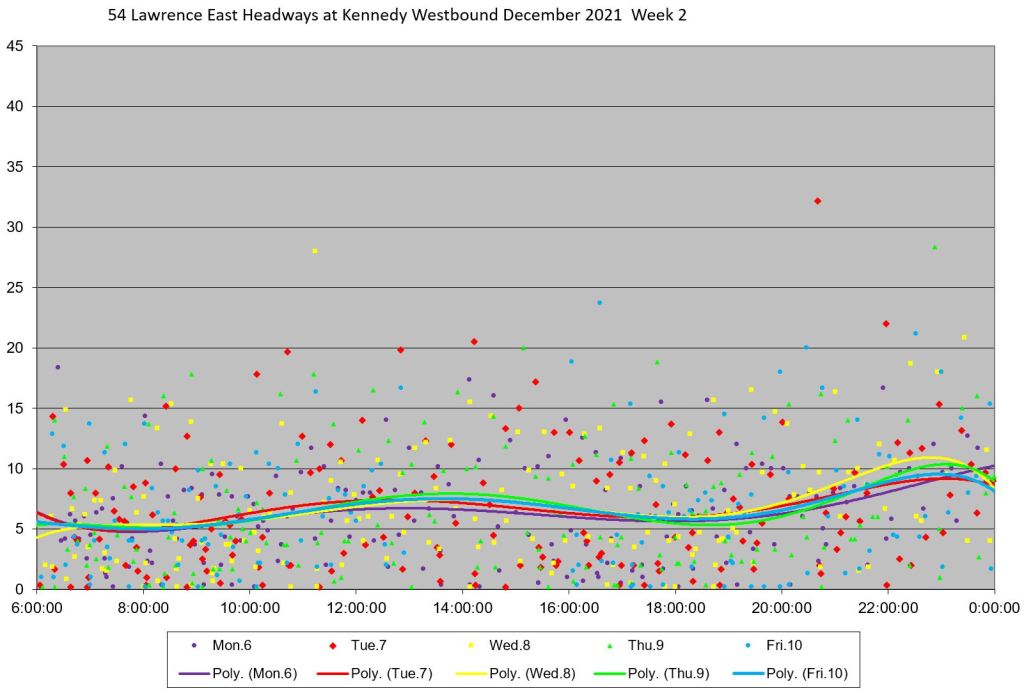
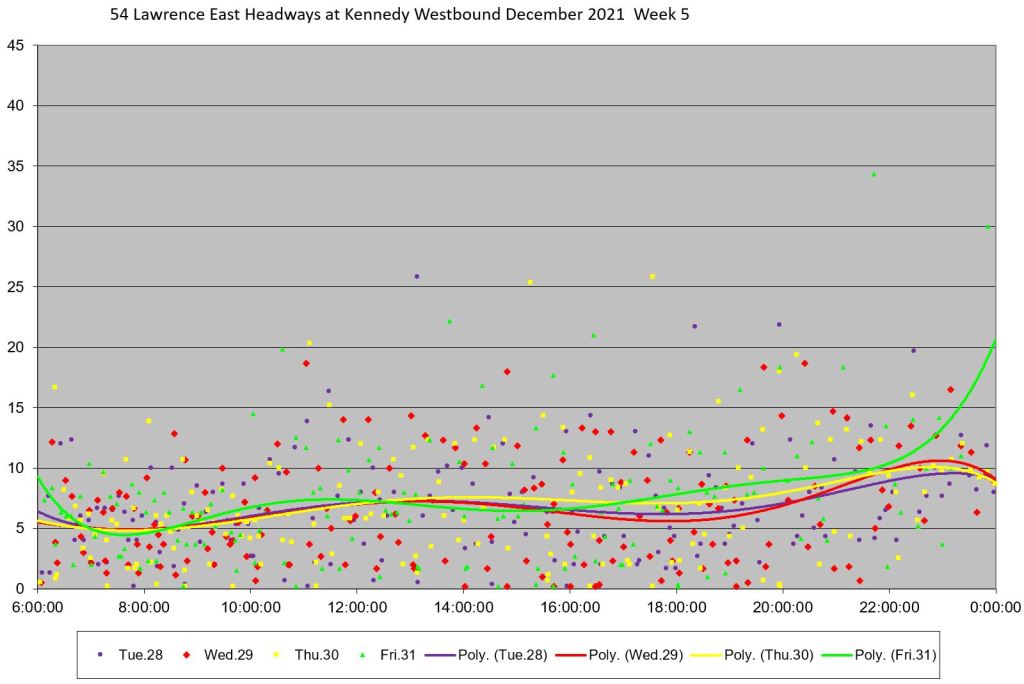
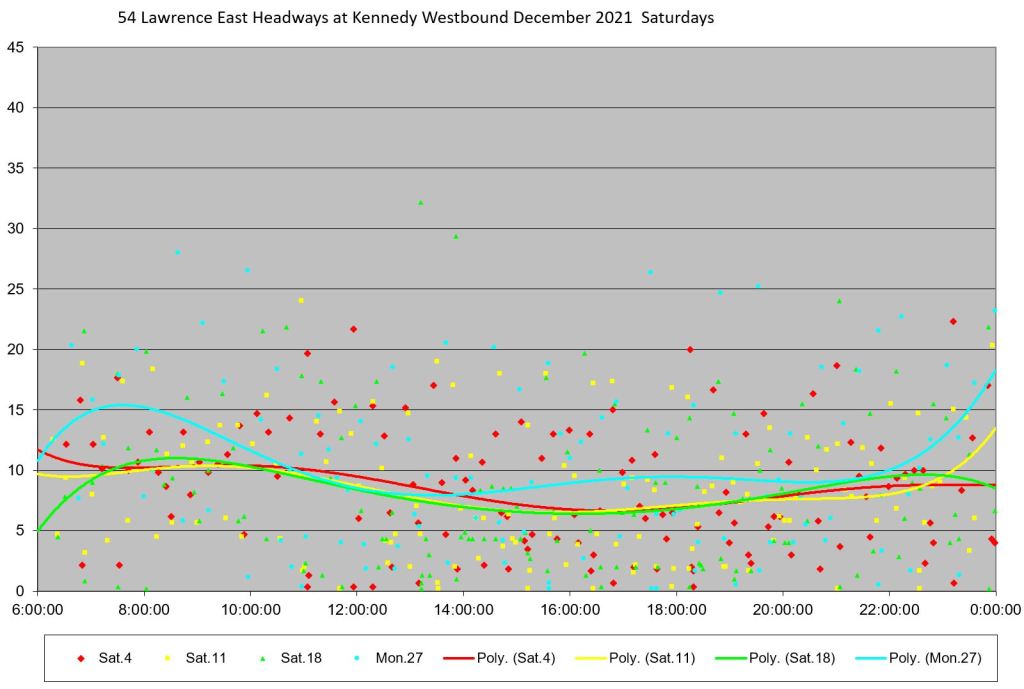
Service Westbound at Kennedy
Westbound from Kennedy, the data behave similarly to the values shown above for Markham Road. The significant difference here is that this is just west of Lawrence East Station, a point where regular headways could be re-established by spacing bus departures. Clearly this is not happening.
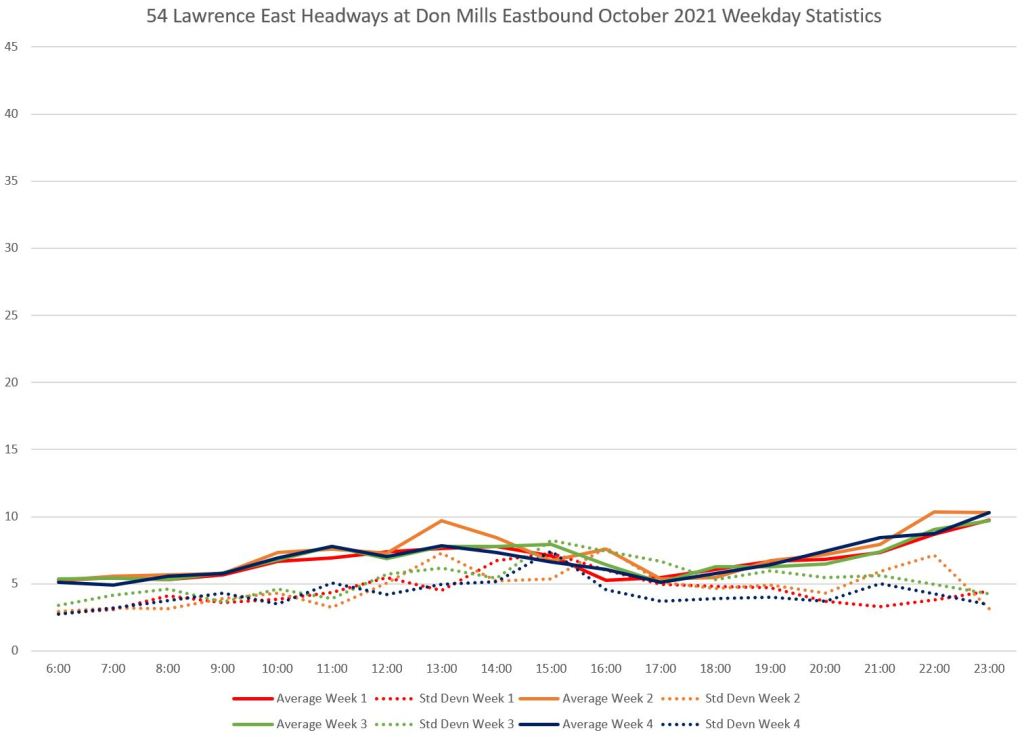
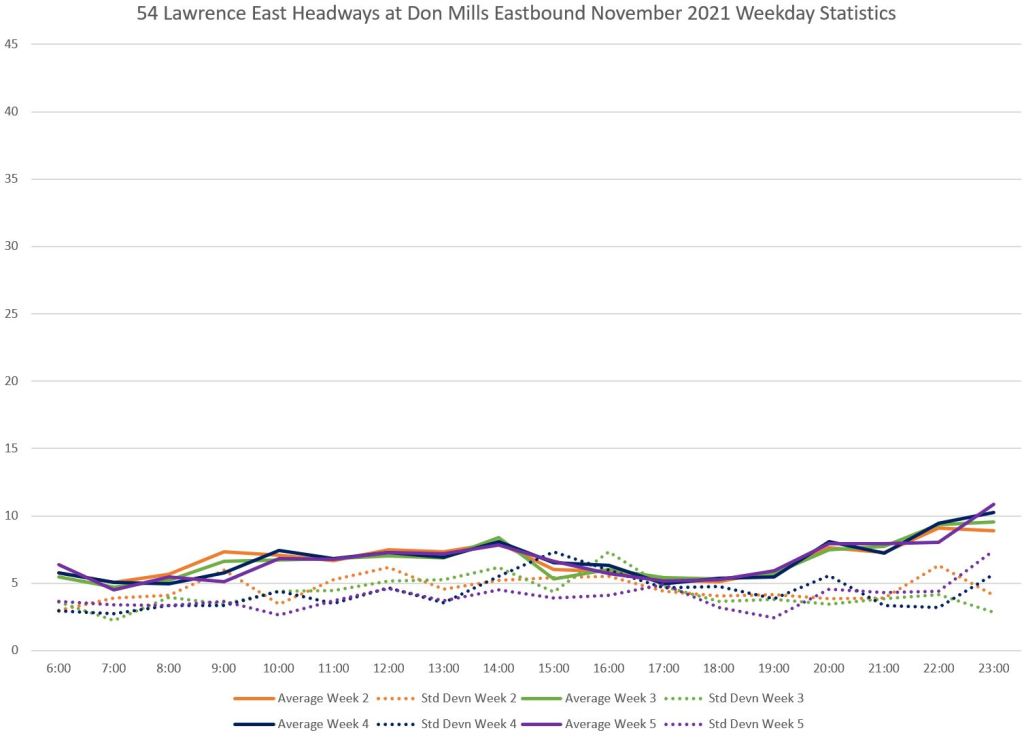
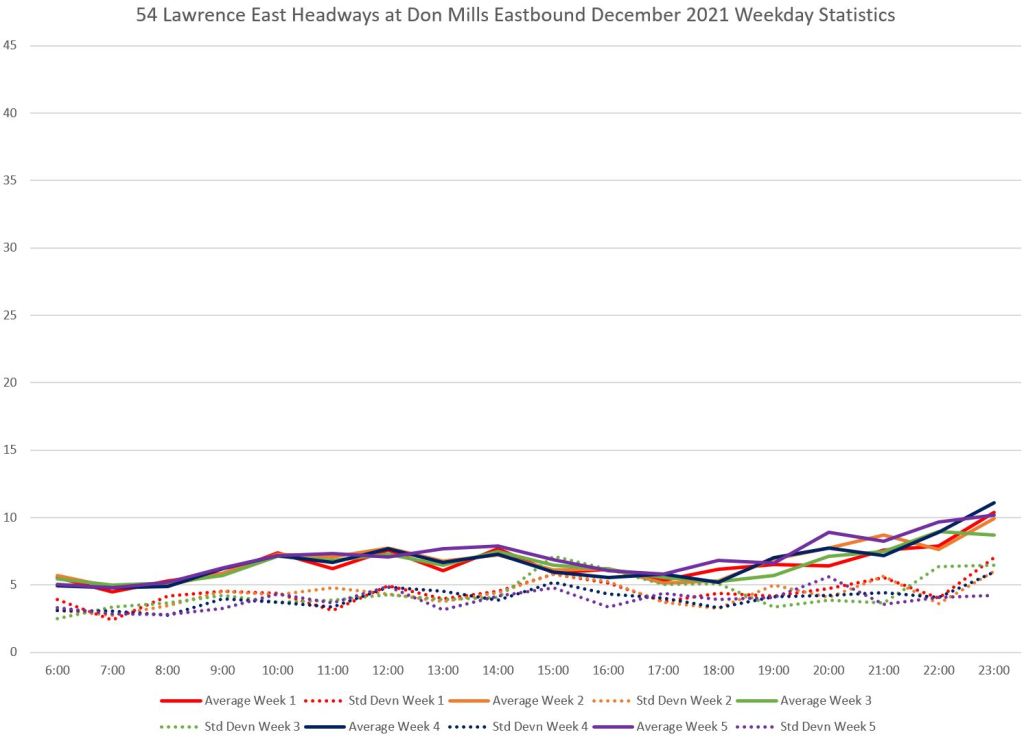
Service Eastbound at Don Mills
Don Mills would be the start of the red lanes as proposed in the original list of RapidTO projects. When the 54/954 services are restructured for the opening of Line 5 Crosstown, this will be the westerly point of these routes on Lawrence itself before they turn south to Science Centre Station.
Service arriving eastbound at Don Mills today has travelled roughly seven kilometres from Eglinton Station running through an area strongly affected by construction of Line 5. This is not necessarily what we would see for the new route, but it shows the challenge of implementing transit priority at a point after the service has become badly disorganized.
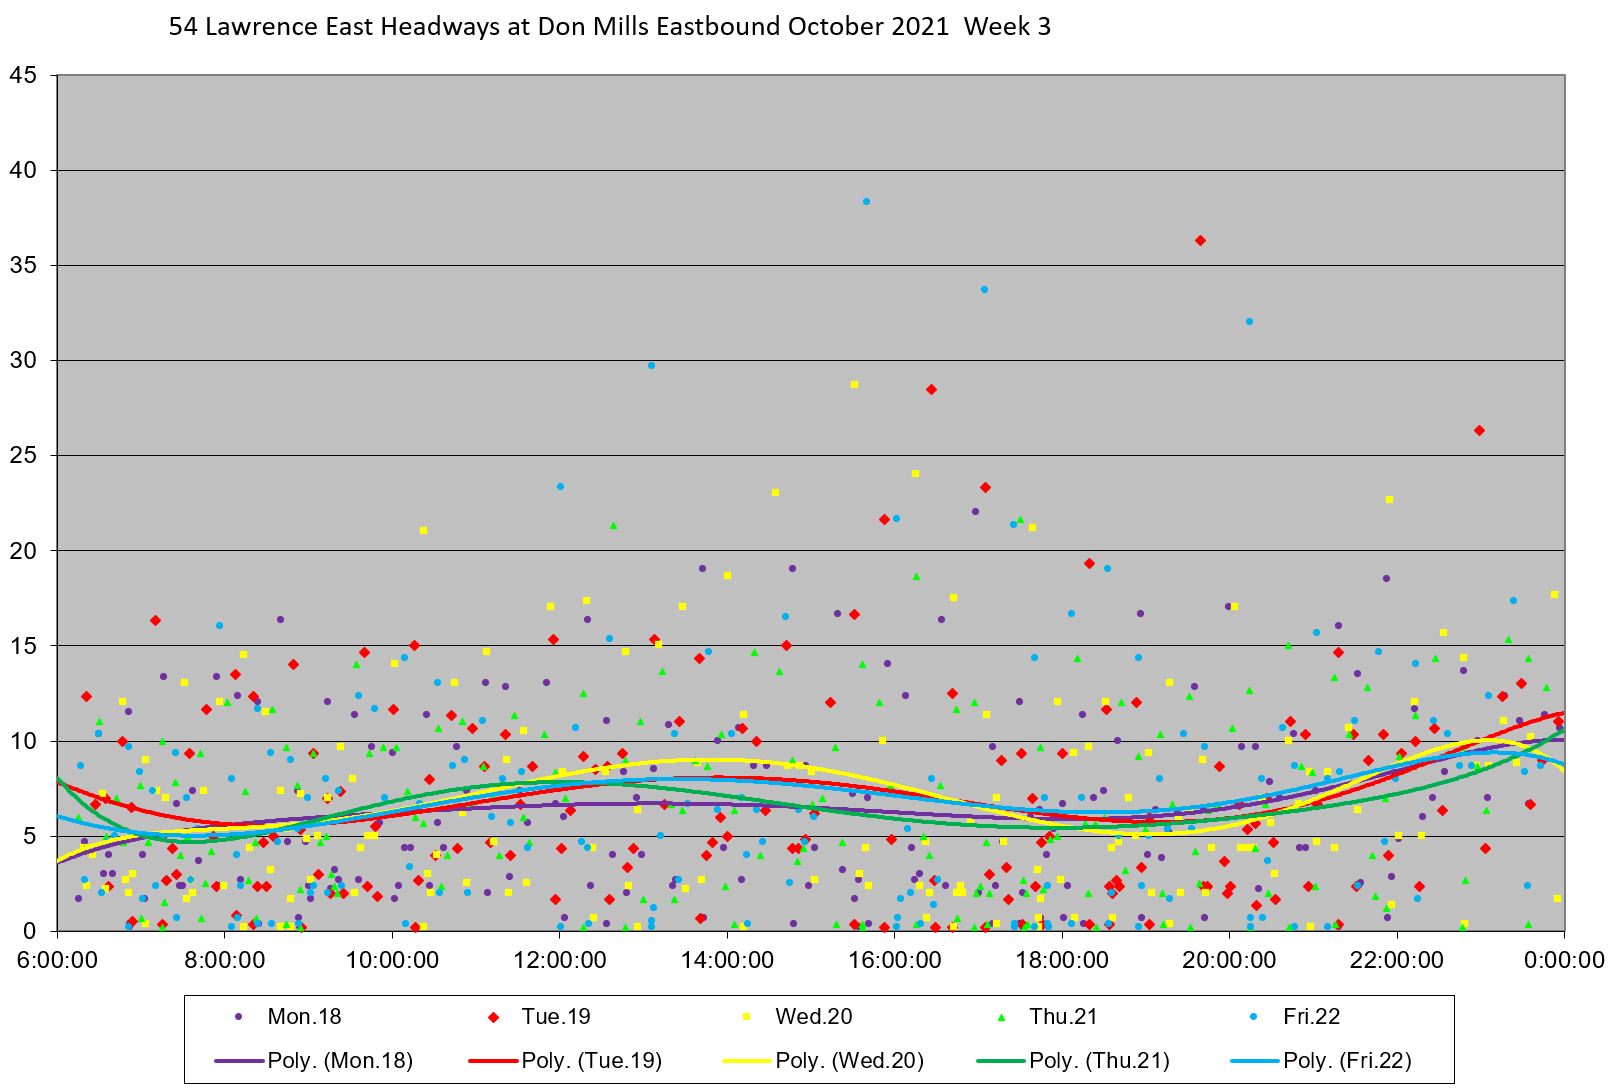
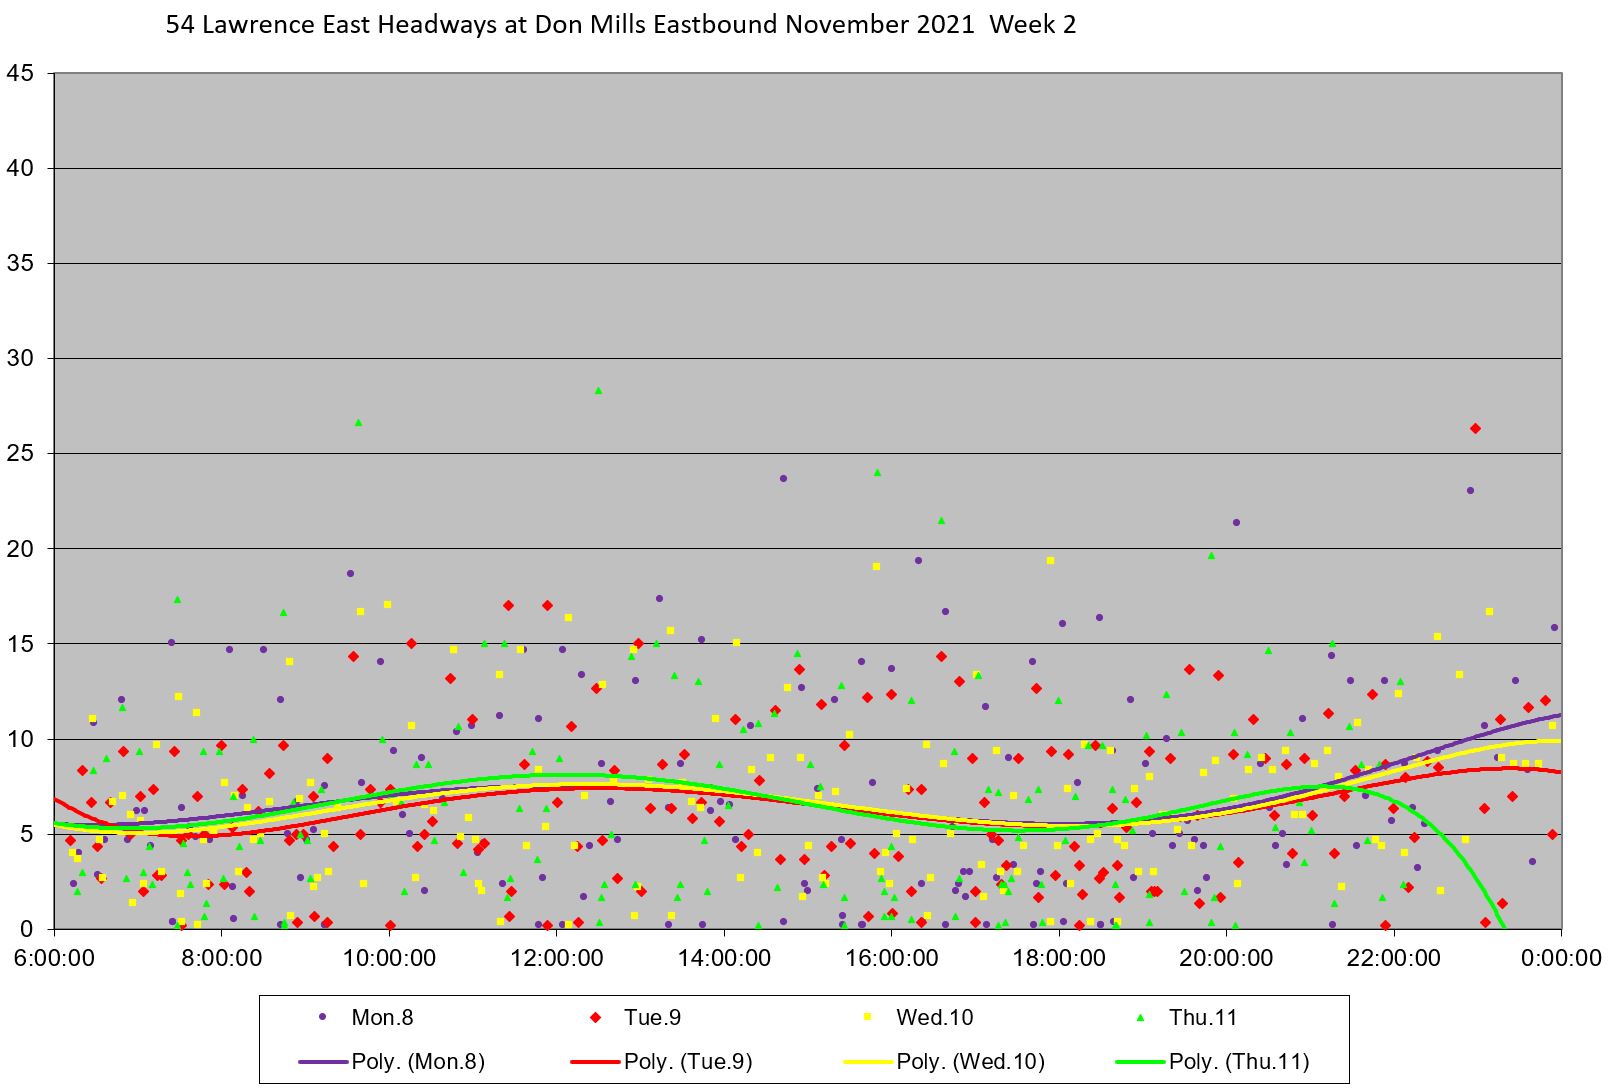
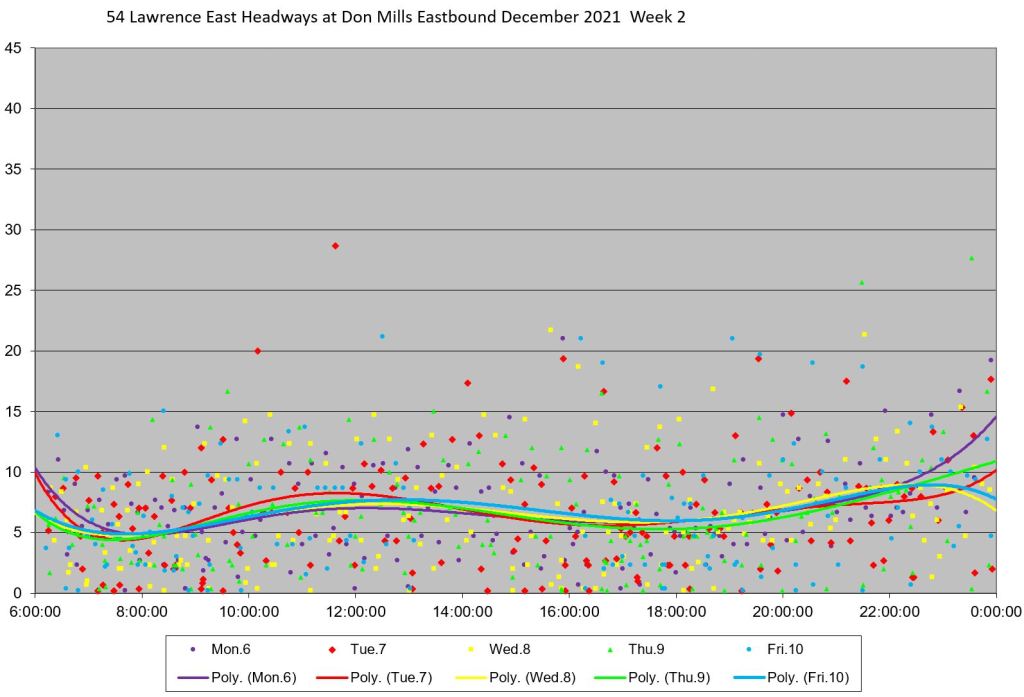
As with data at previous screenlines, the averages generally track scheduled values, but the SD values are close to and sometimes overlap the averages indicating a severe problem with bunching. This is reflected in the detailed charts for selected weeks below. Gaps over 15 minutes long are common, and many buses run on headways at or close to zero.
With the new route layout, one might hope for more reliable service leaving Science Centre Station and travelling north on Don Mills to Lawrence especially with Don Mills itself being a proposed RapidTO corridor. A key element will be to ensure reliable service from the terminal.
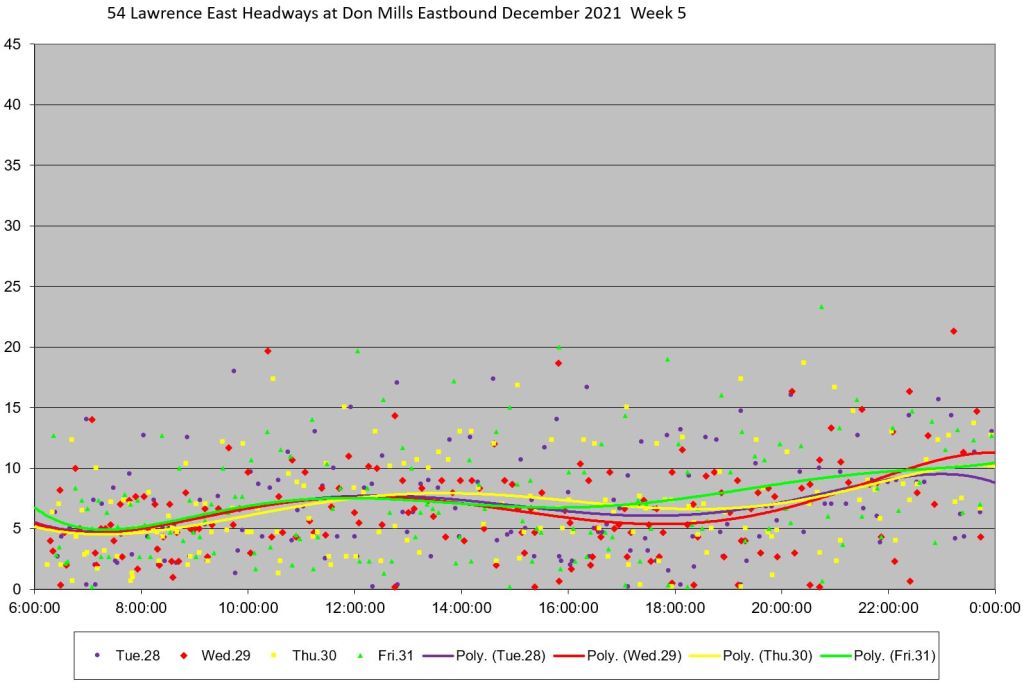
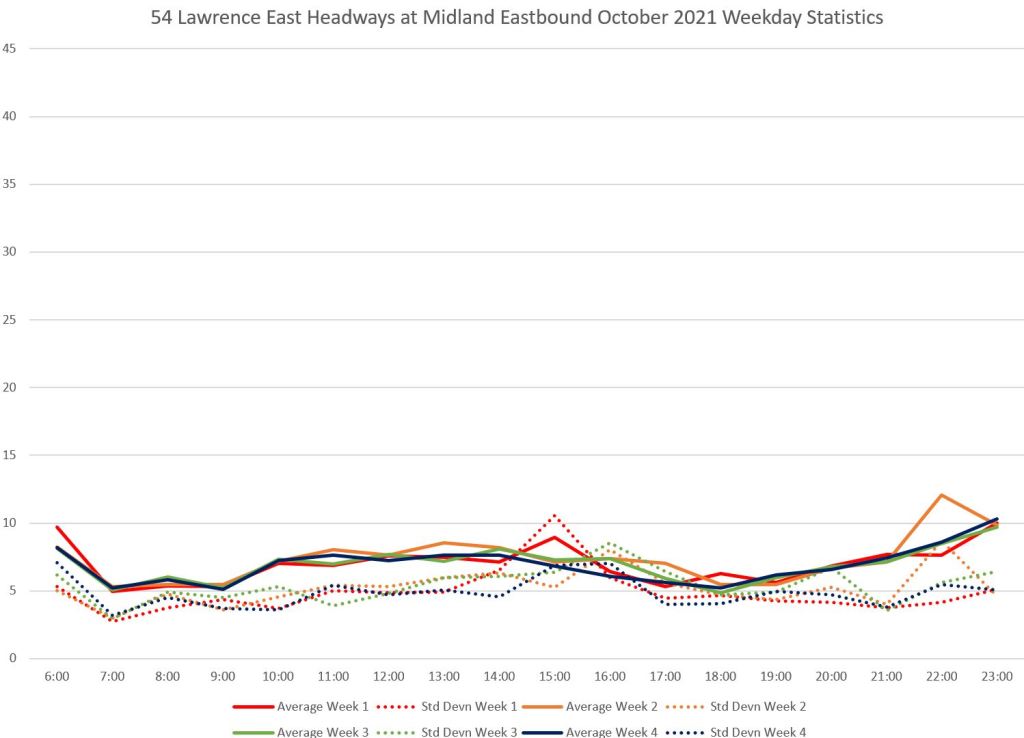
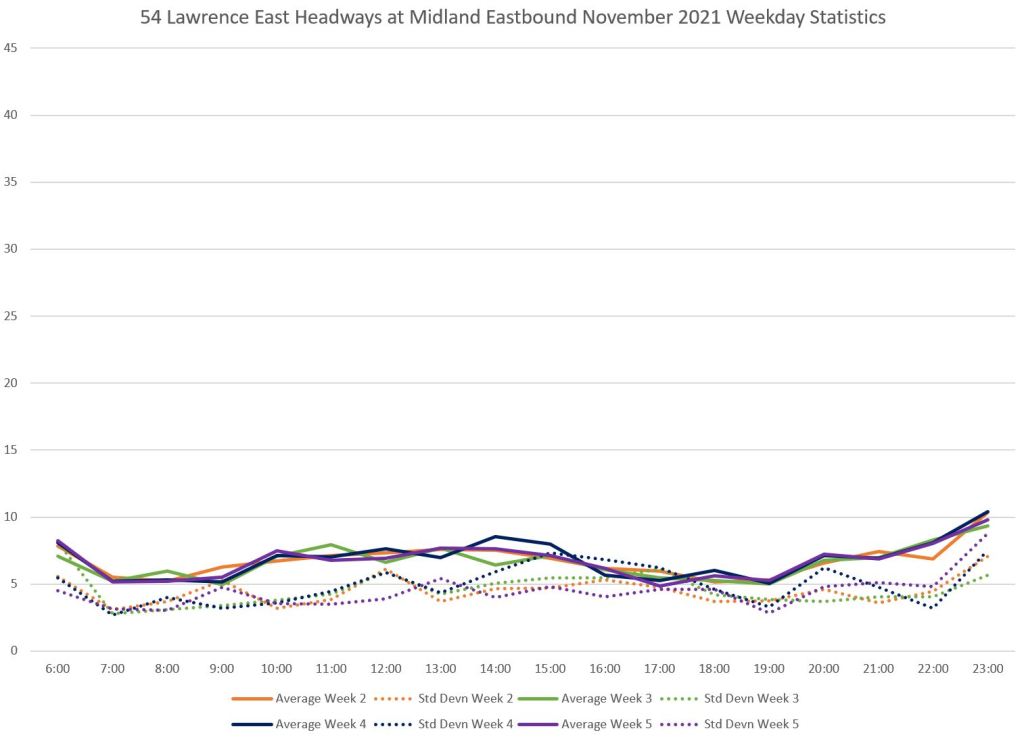
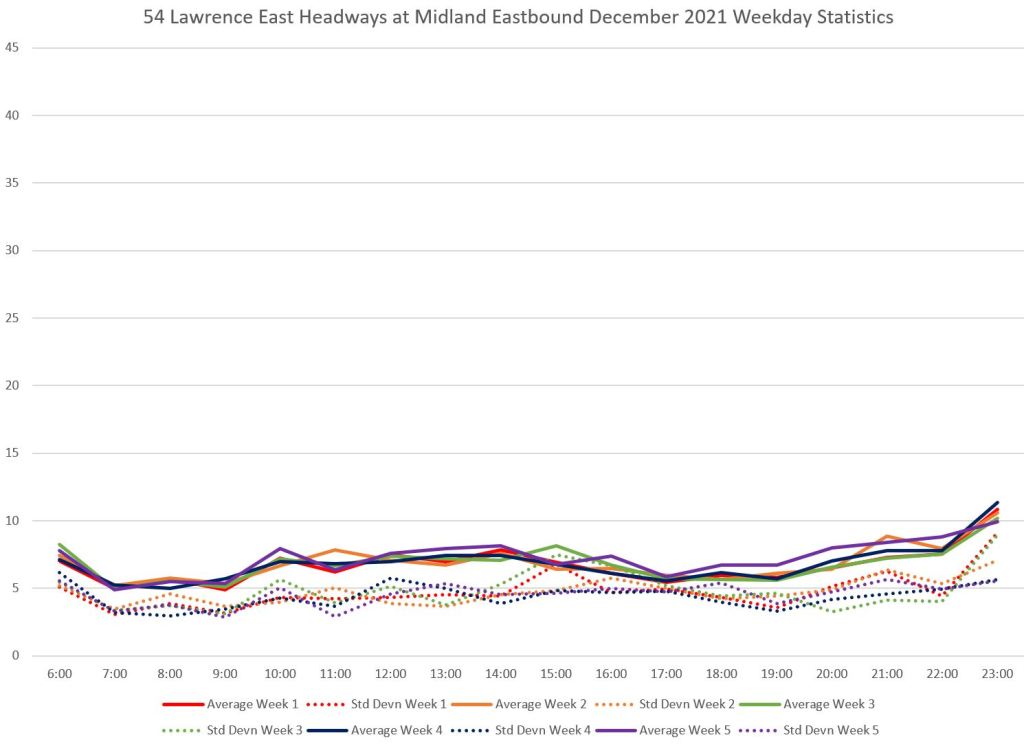
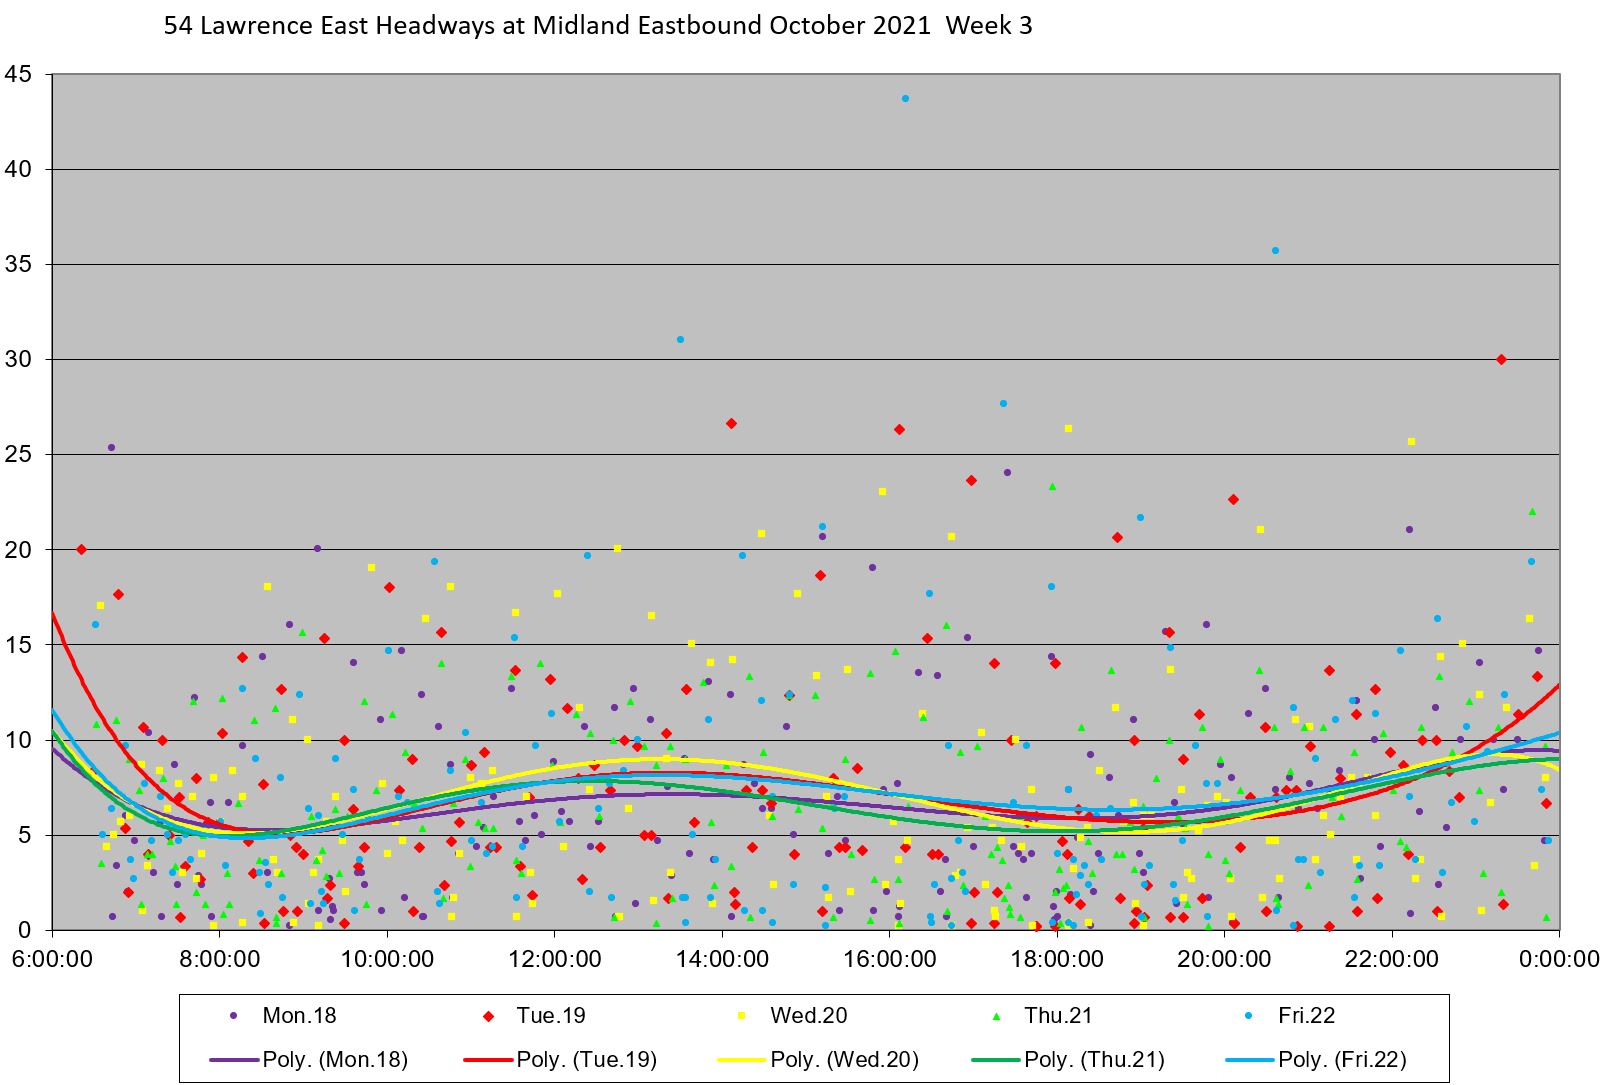
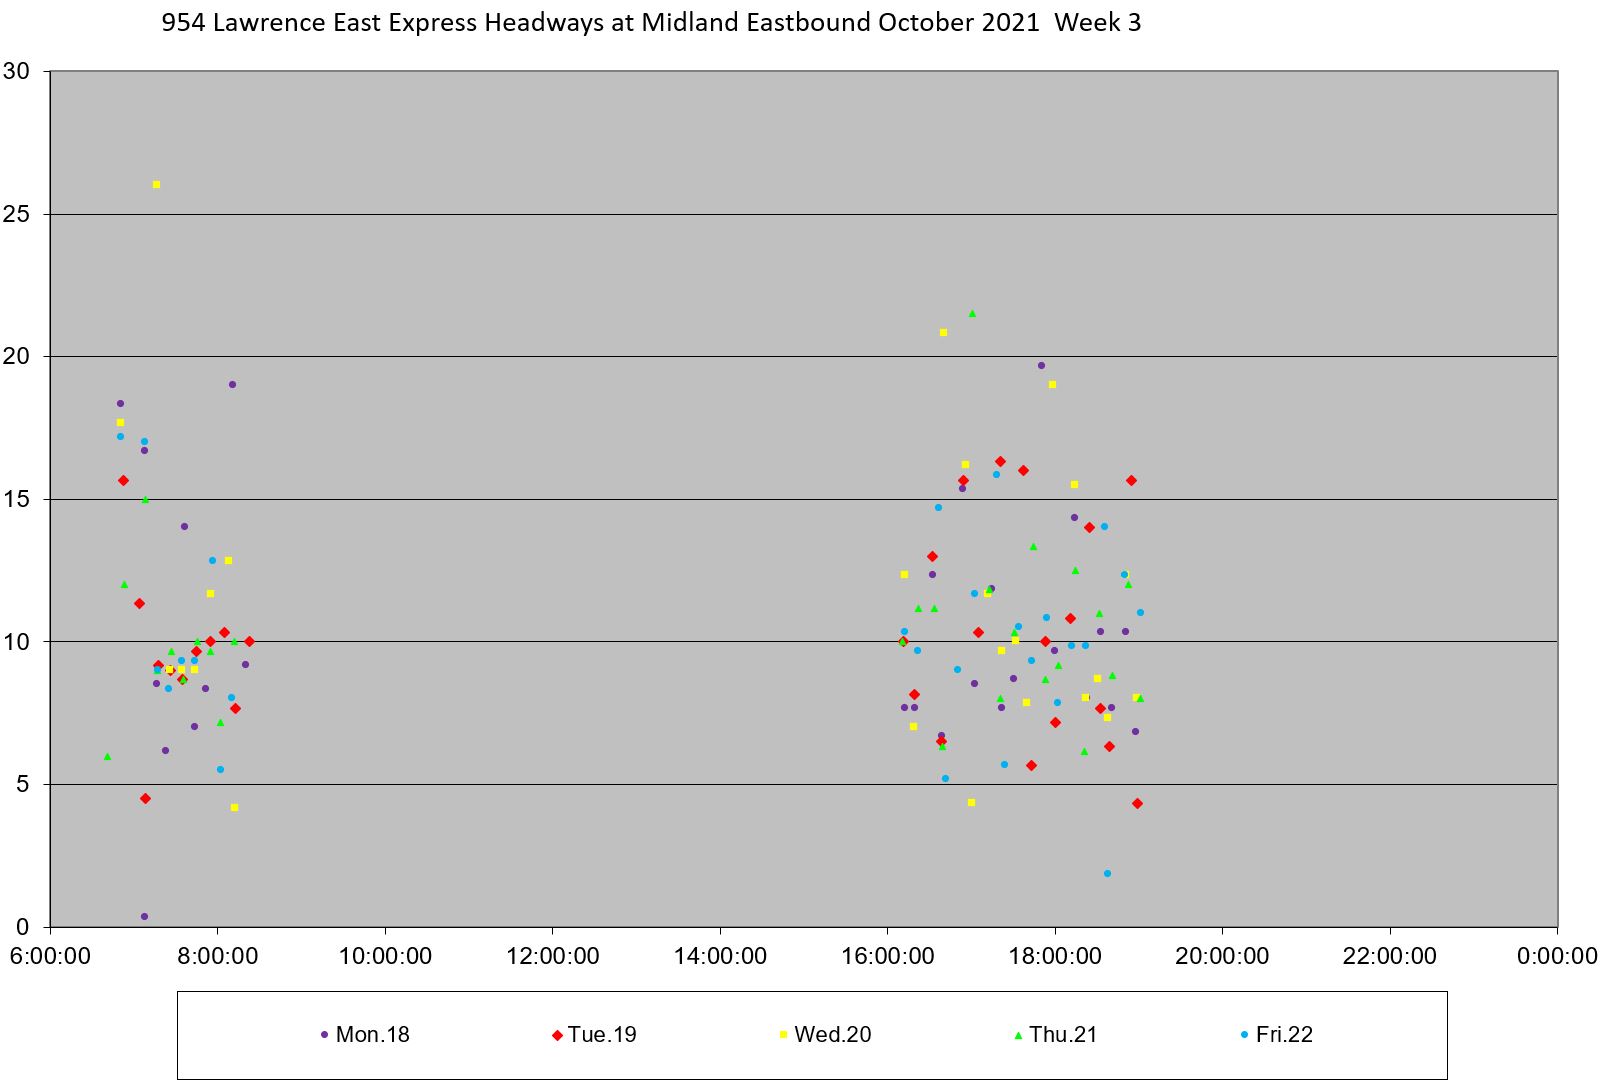
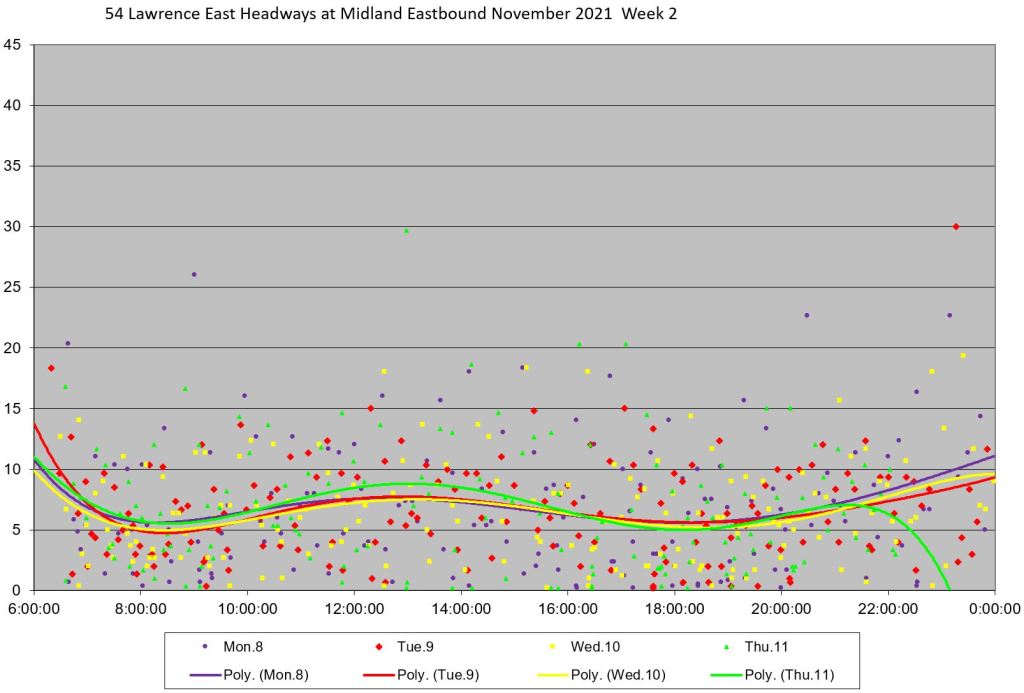
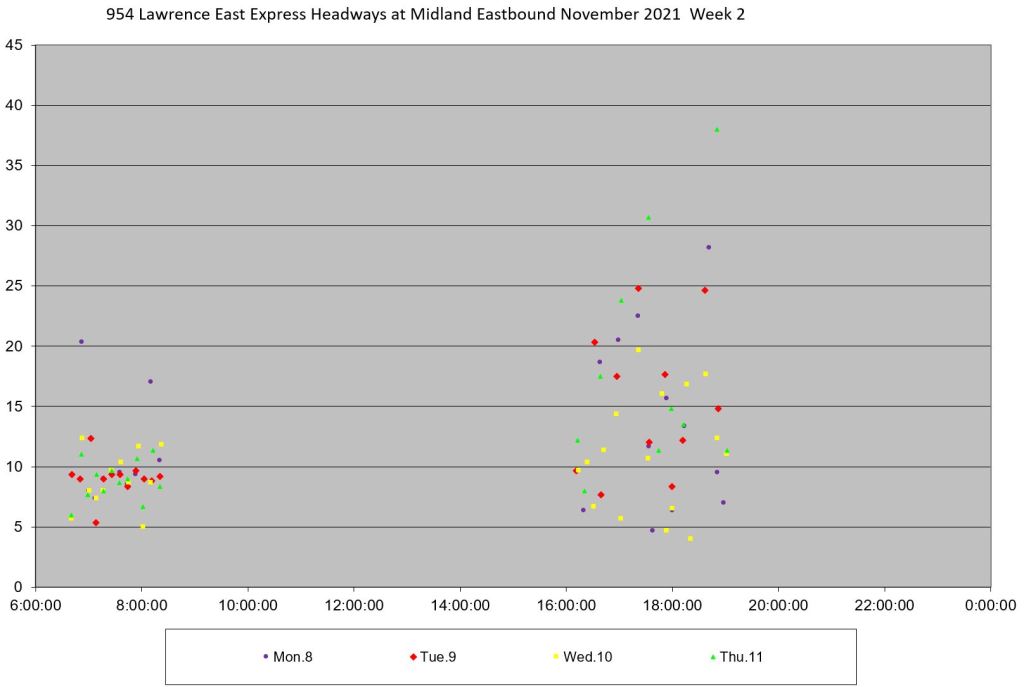
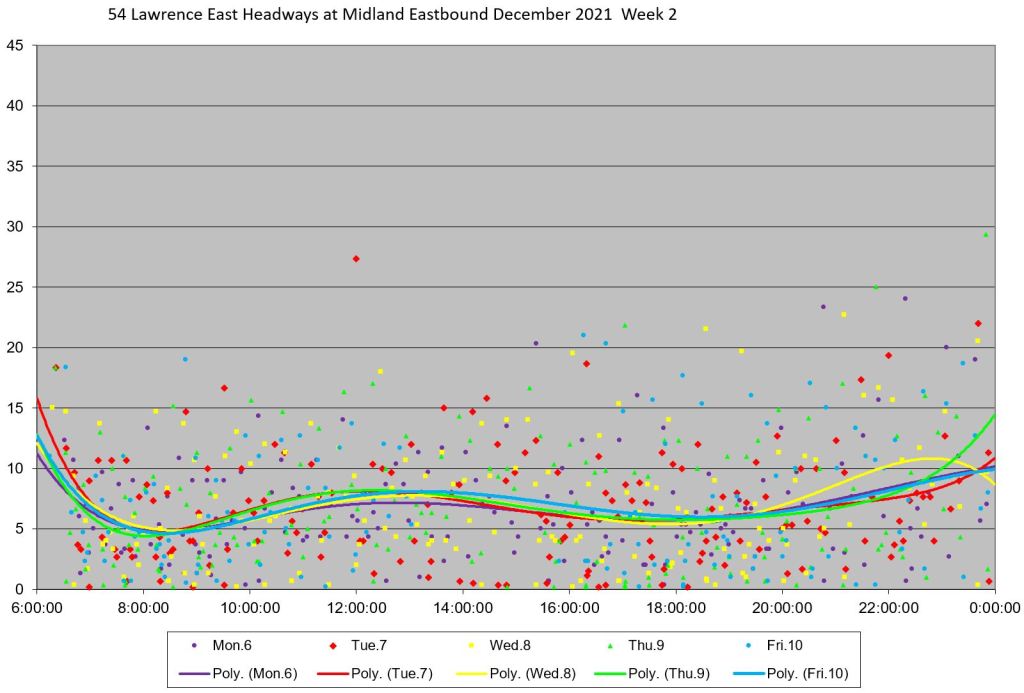
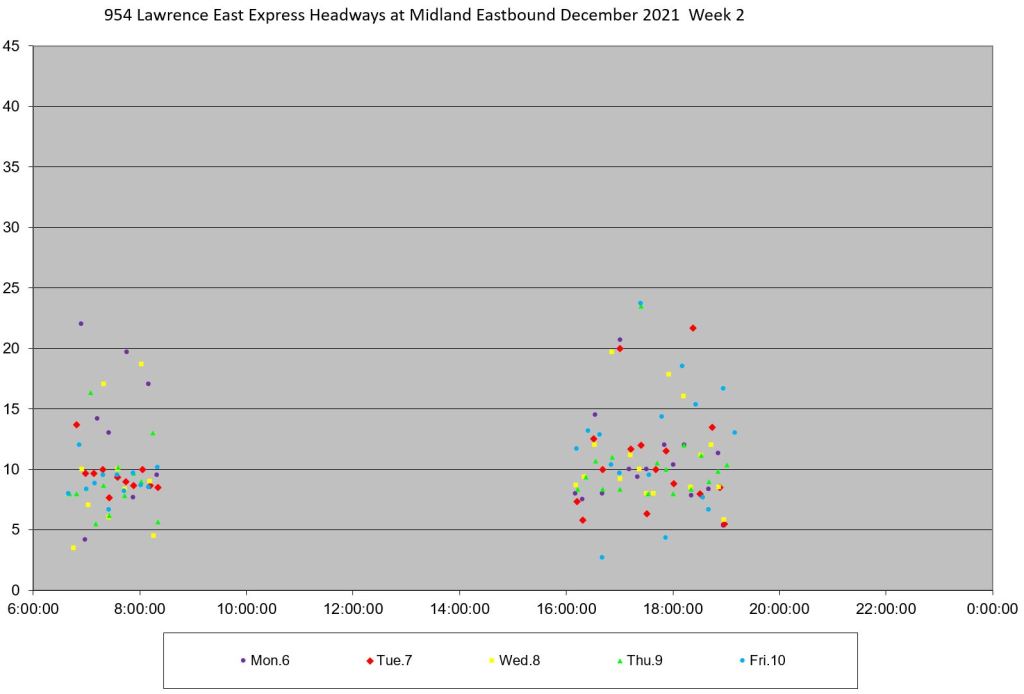
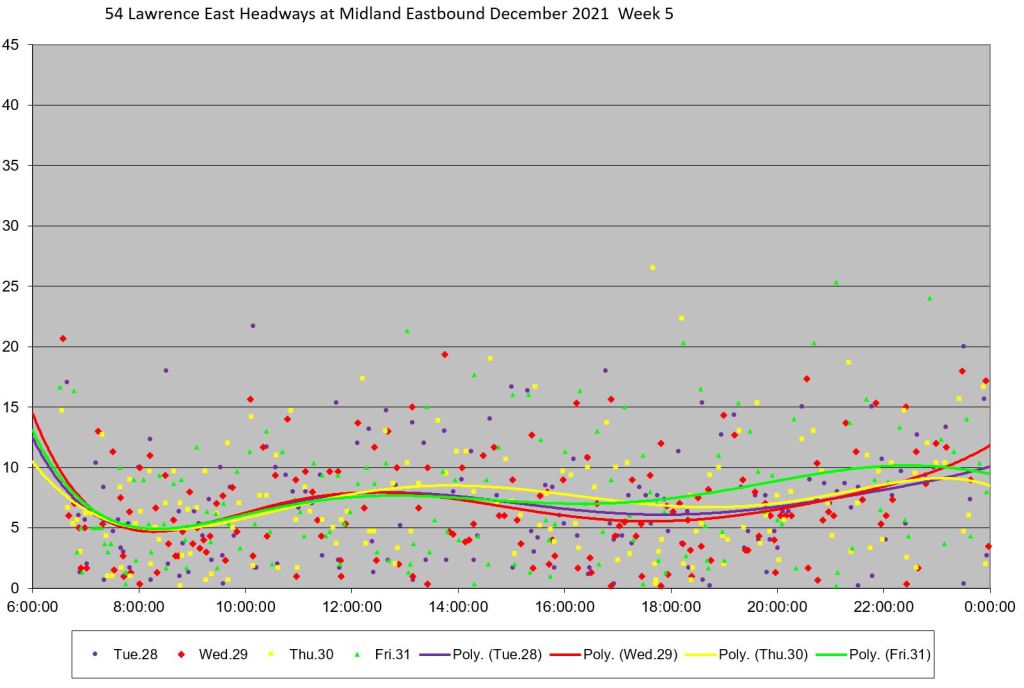
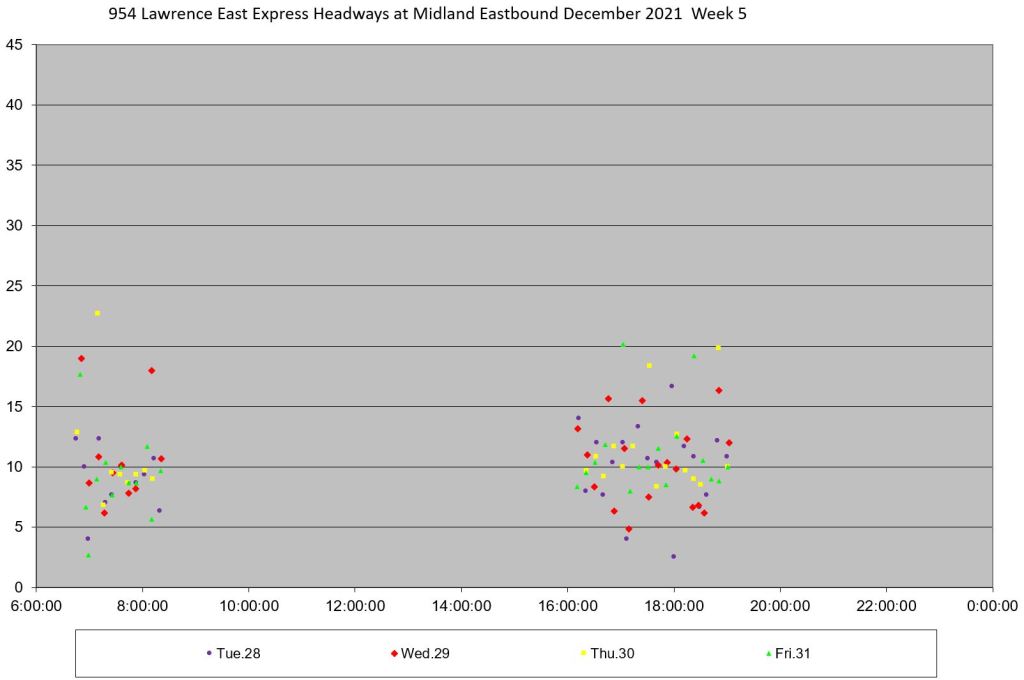
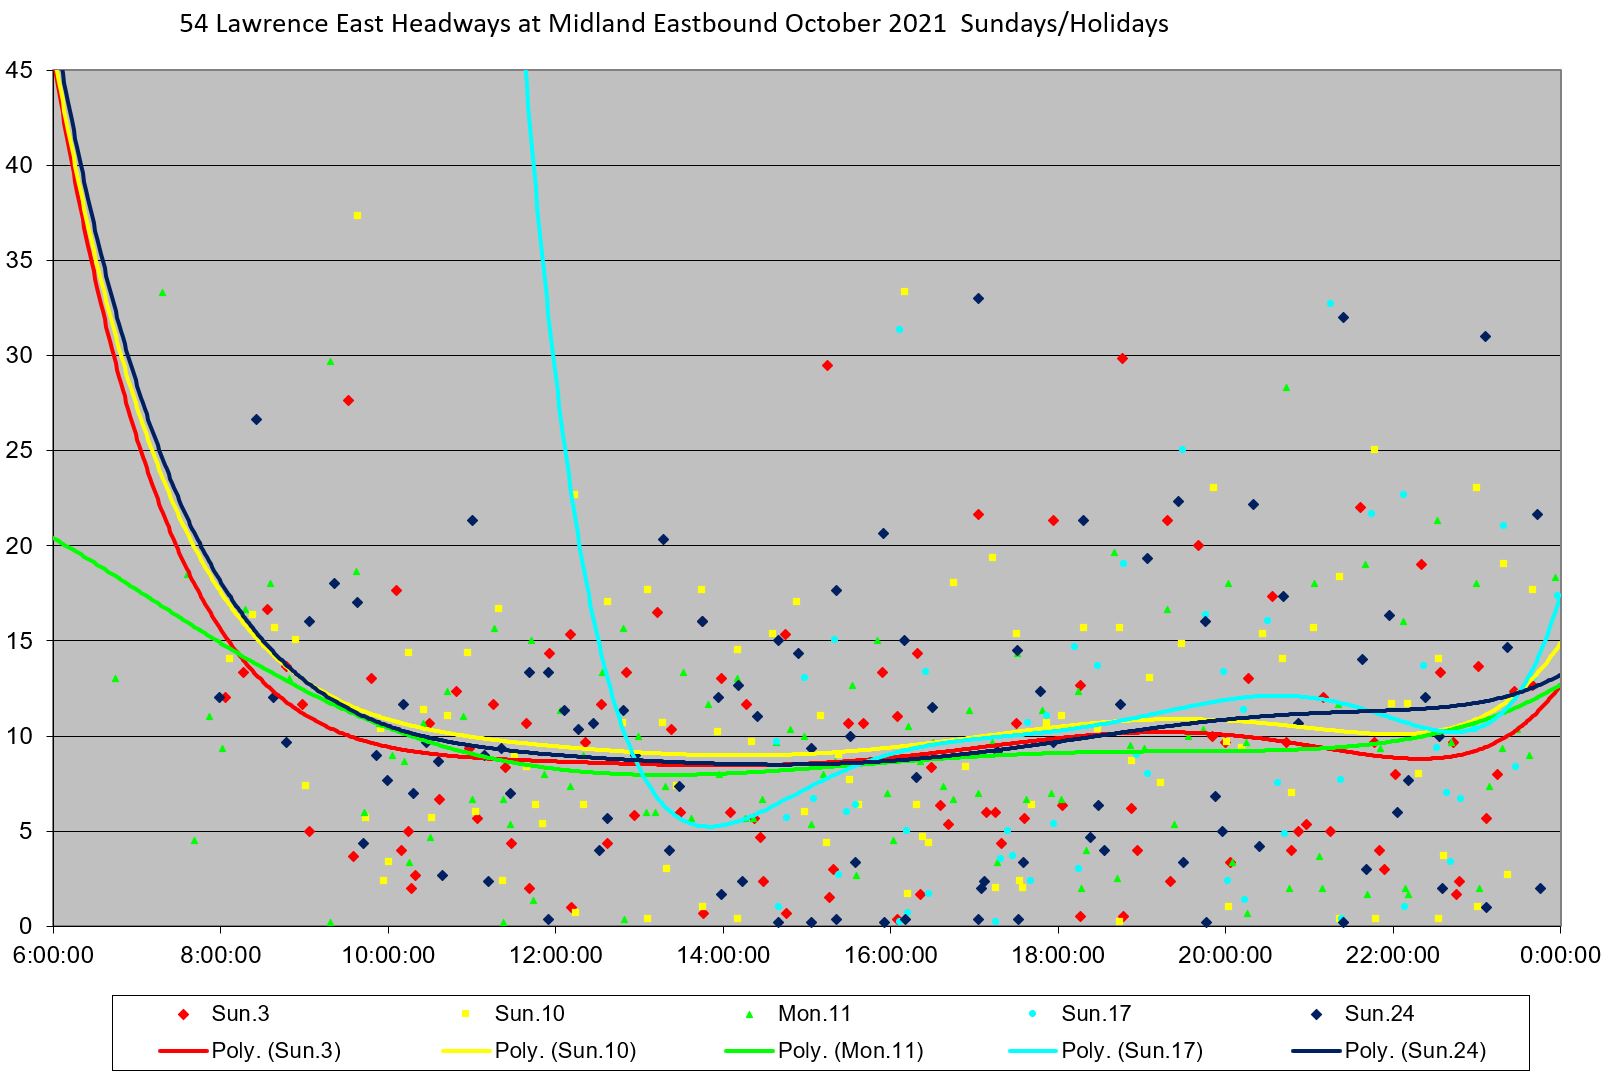
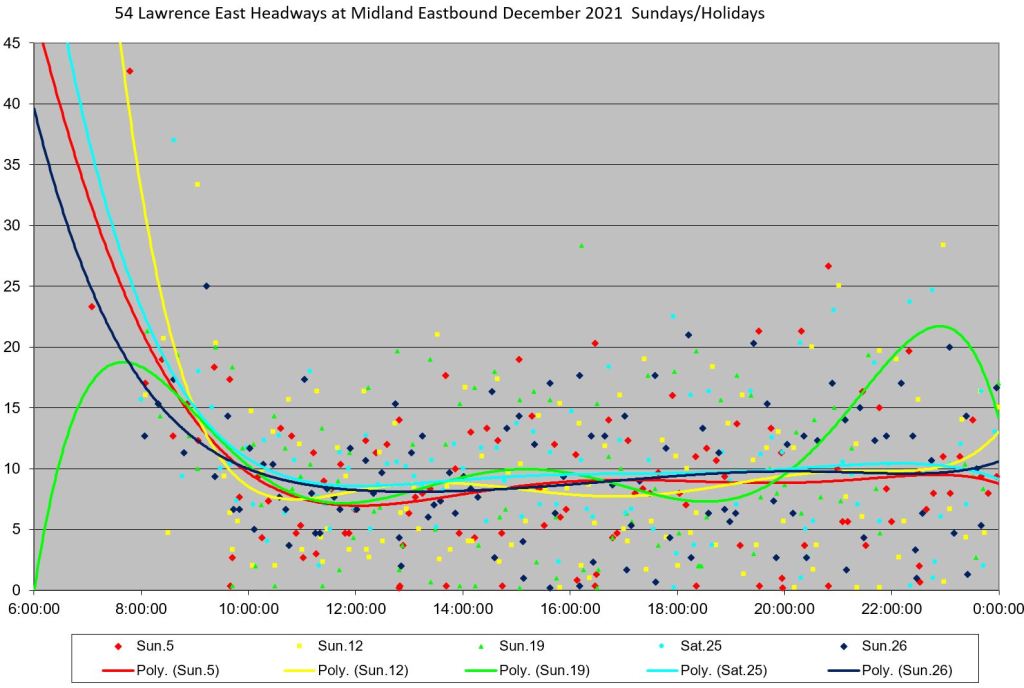
Service Eastbound at Midland
Midland is the first major street east of Lawrence East Station. This is a point where, as with the westbound service shown earlier, there would be a chance to regulate headways and even out the spacing of buses. Quite clearly, this does not occur.
As at other locations, the SD values track closely with the averages showing that there is much bunching, and this behaviour is clear in the distribution of the detailed data.
In the charts below, the detailed values for the local service are on the left and for the express service on the right. Note that during some AM peaks, the express service departs on quite reliable headways, but this is an exception to the overall pattern. Moreover, on the same days, the local service headways are not as reliable as for the express service.
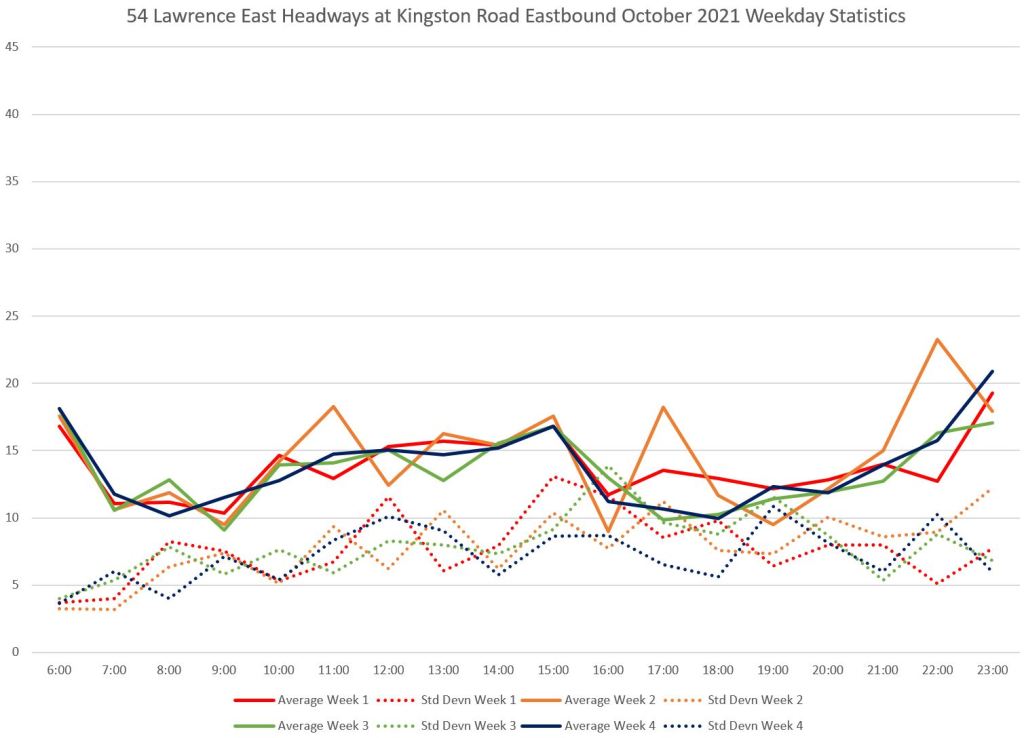
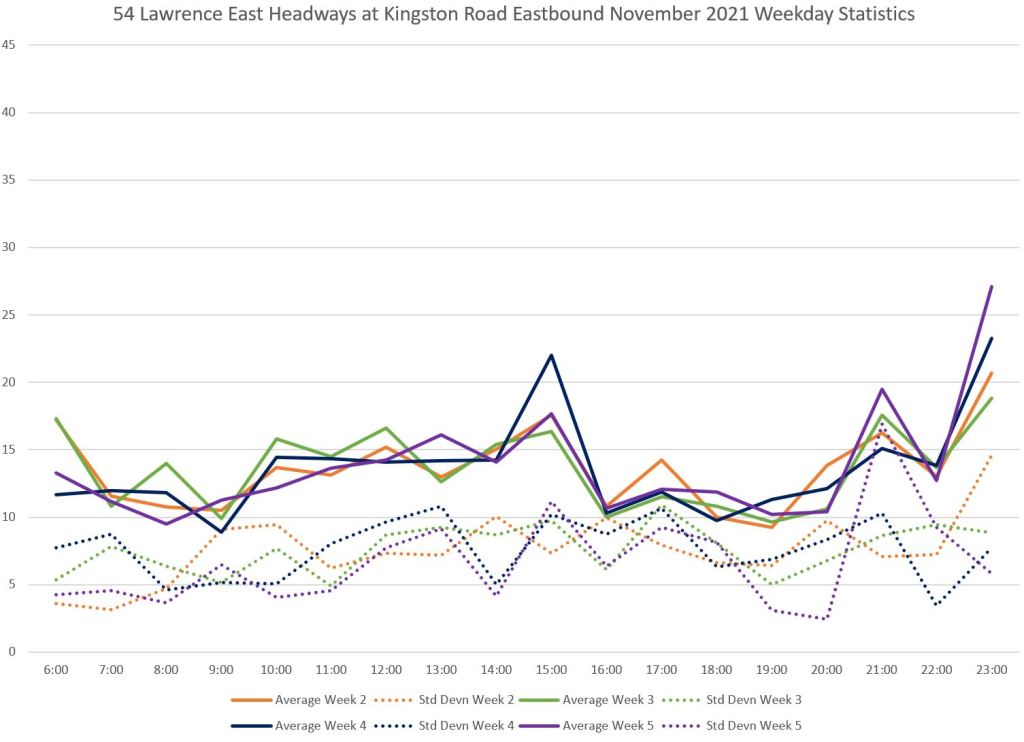
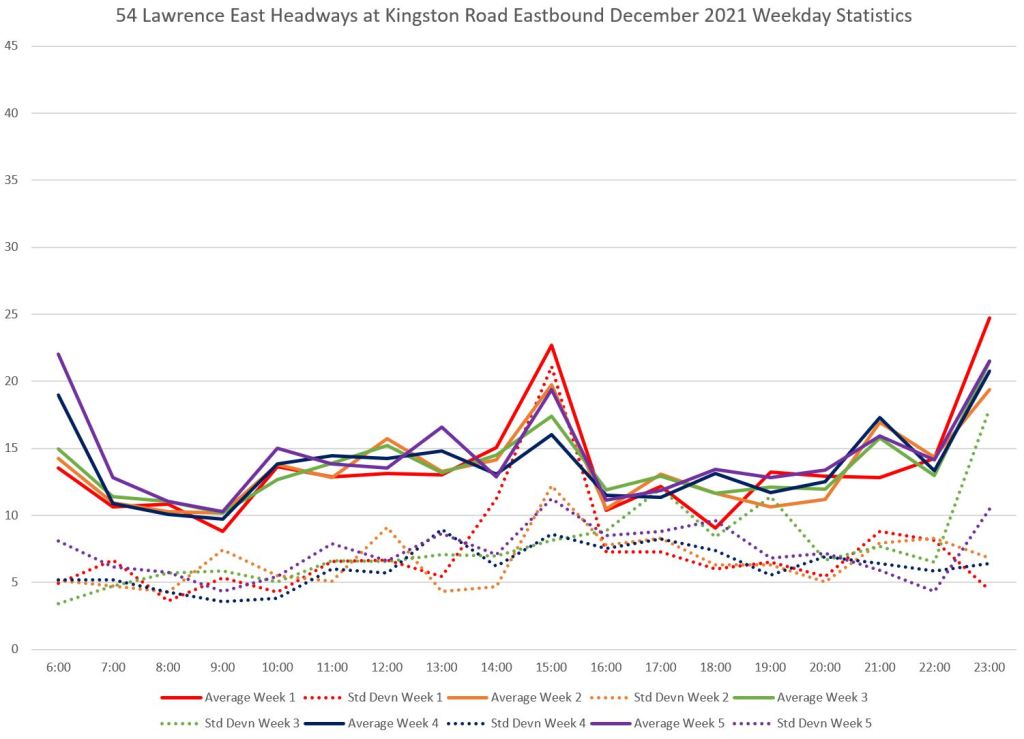
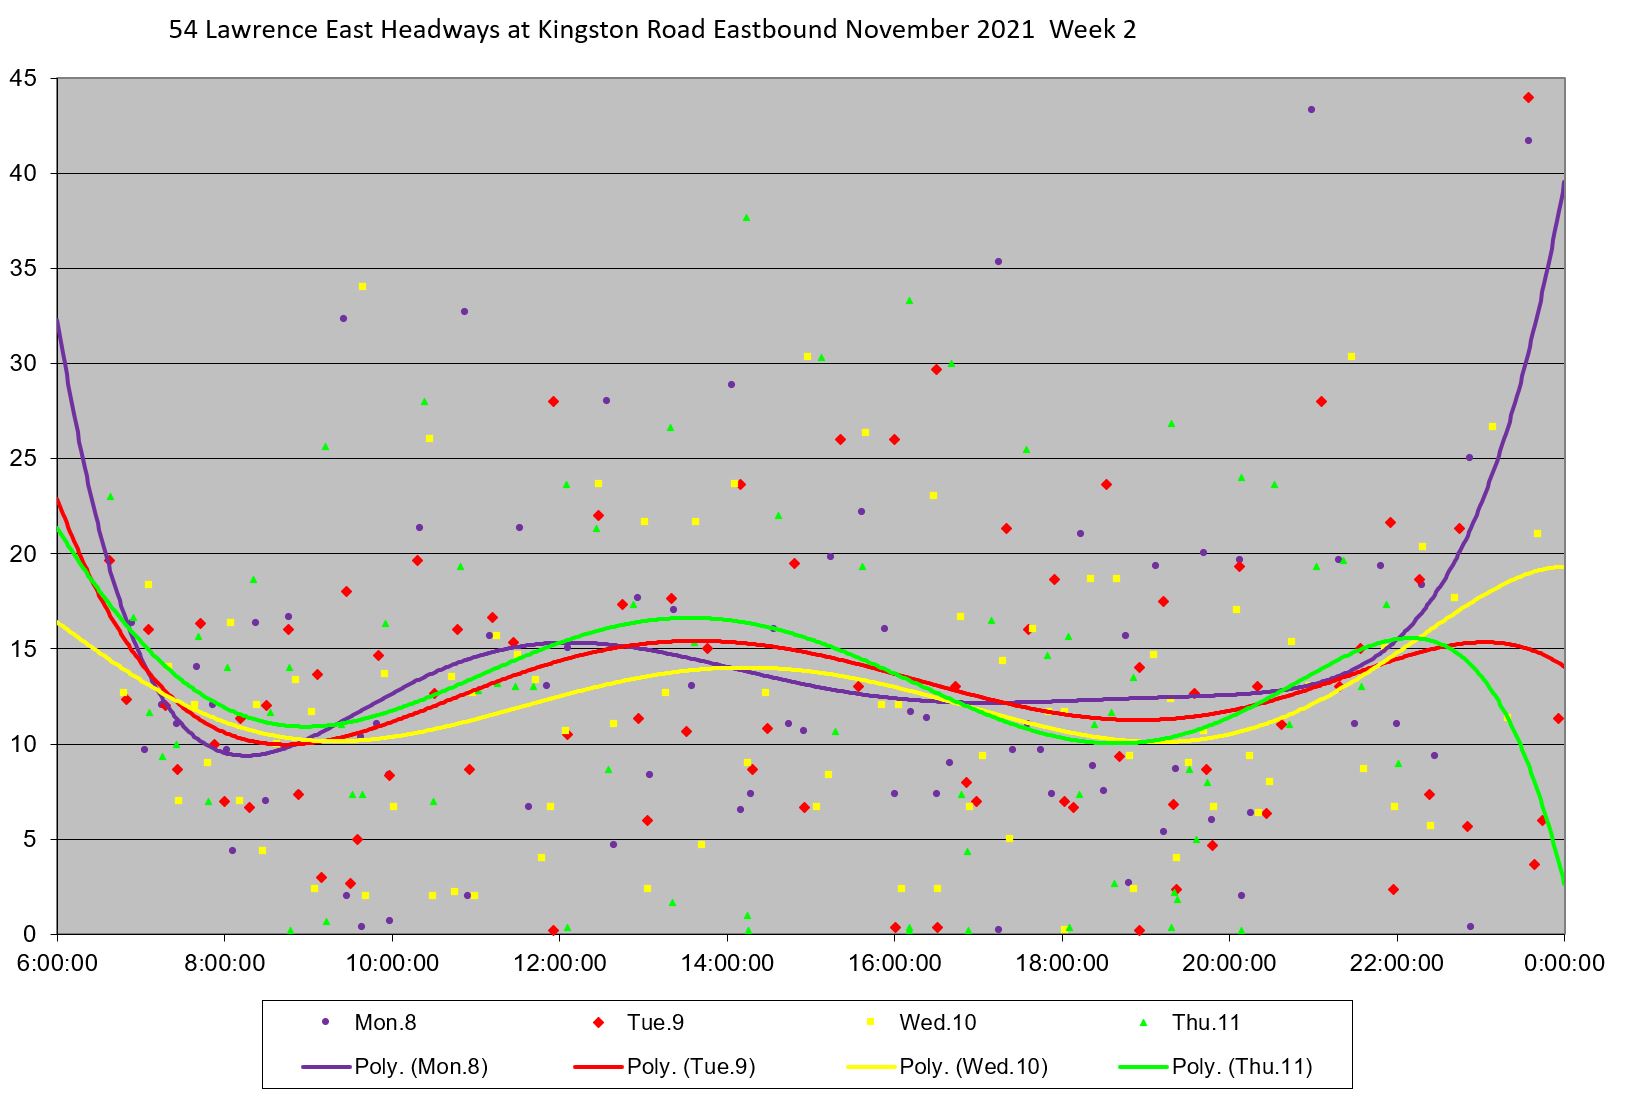
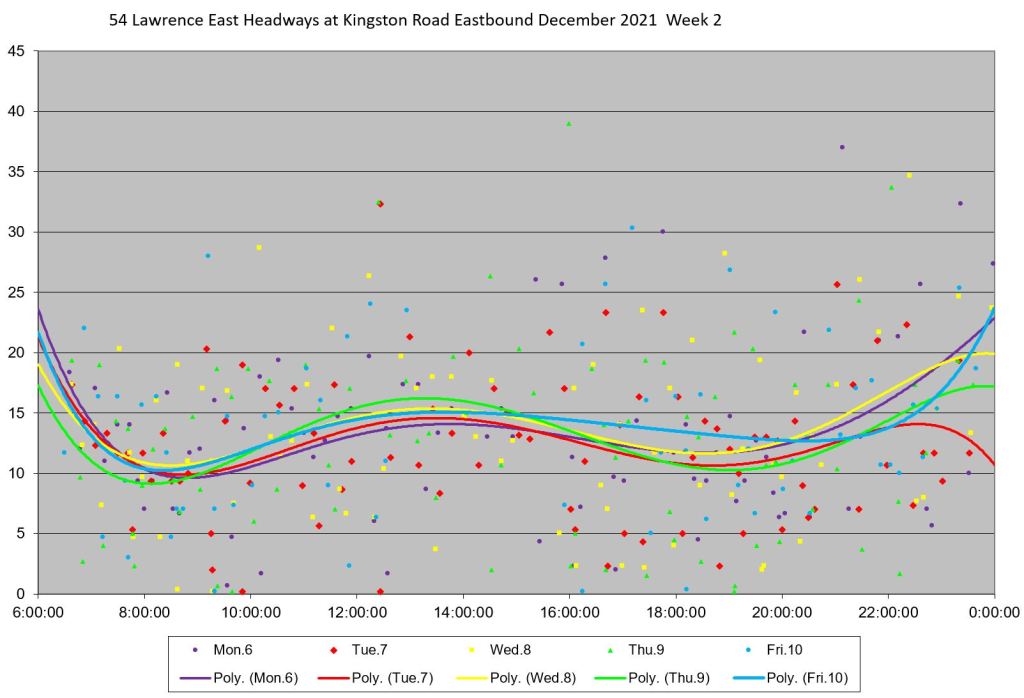
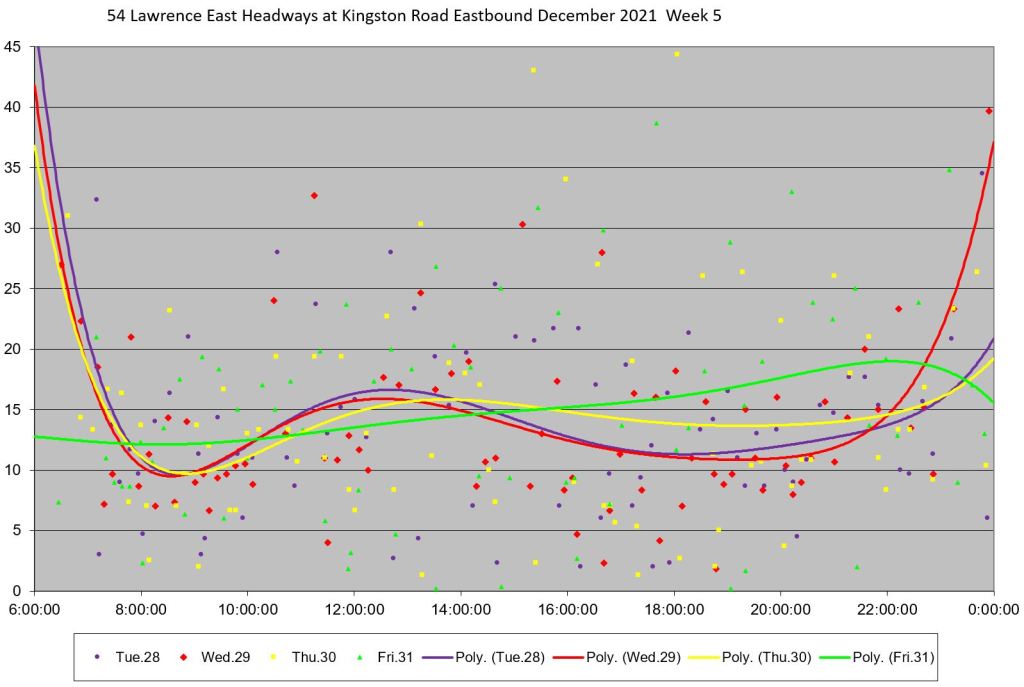
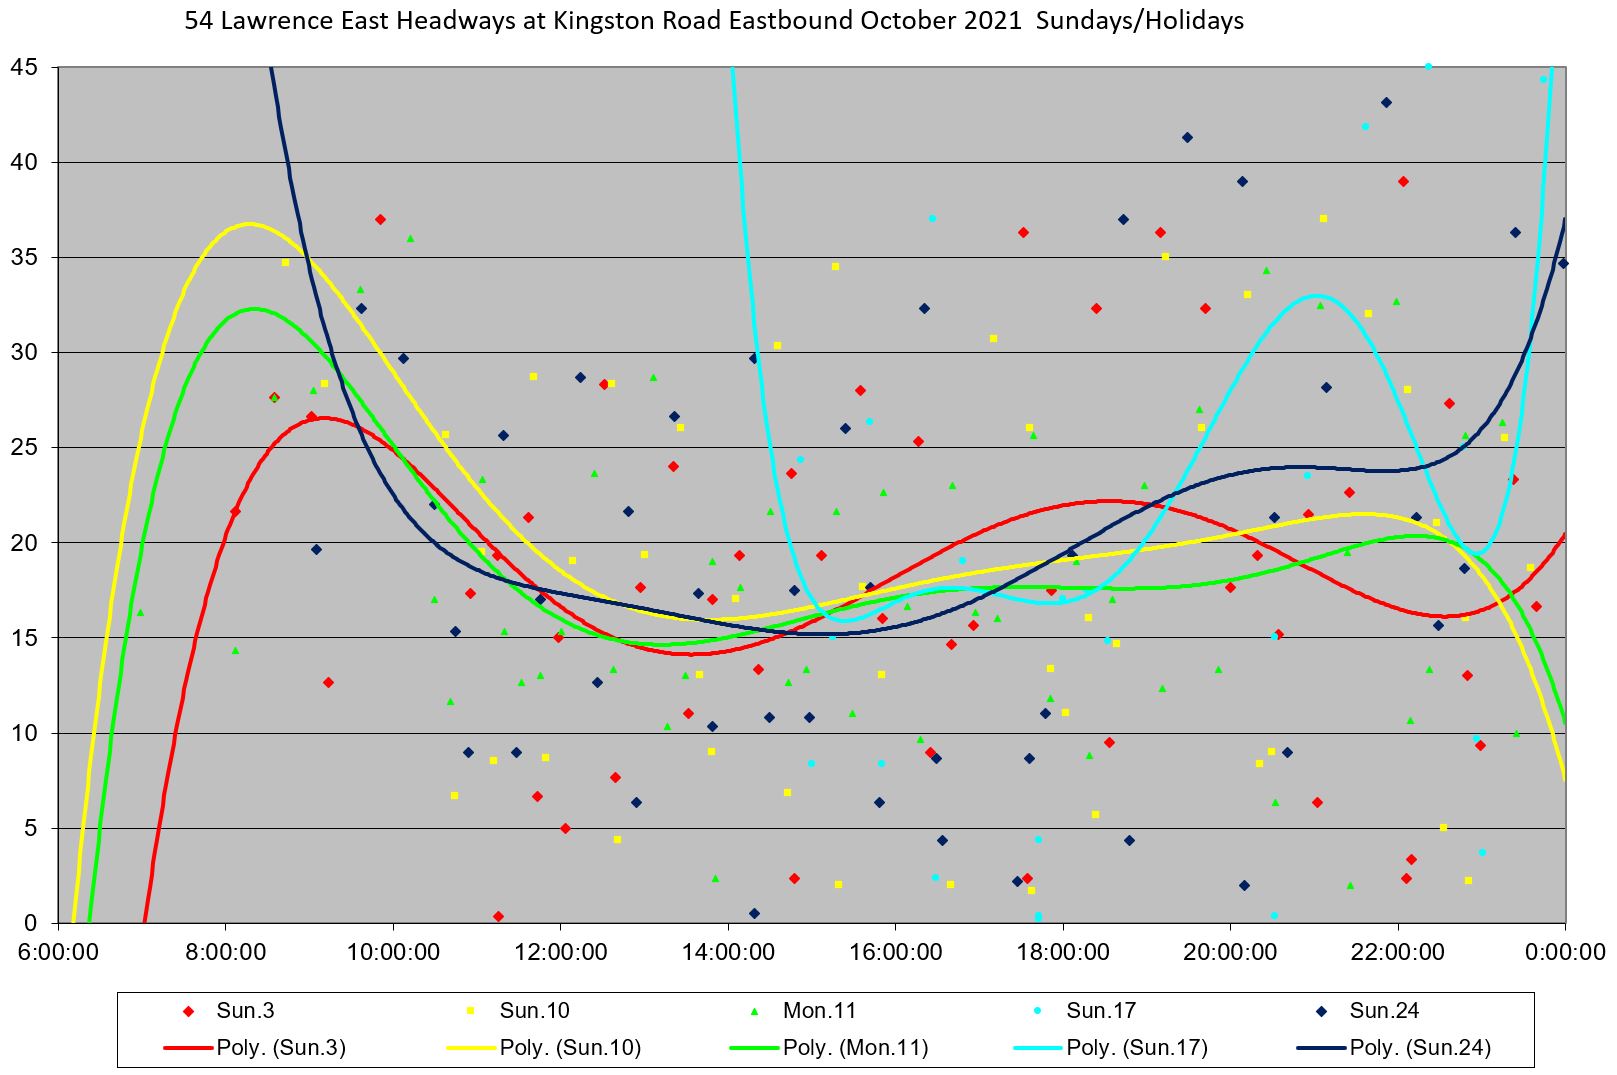
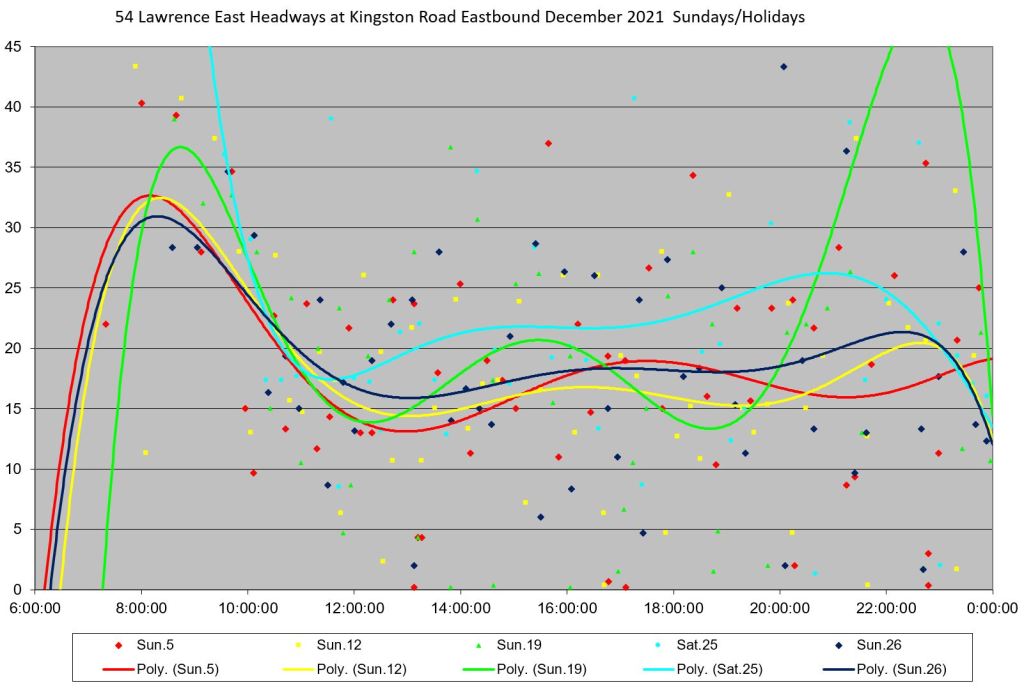
Service Eastbound at Kingston Road
At Kingston Road, only the 54A branch to Starspray Loop remains. The charts below show how disorganized the service is at the outer end of a very long line. The weekly averages bounce around a lot, and do not lie as clustered as other locations indicating that the total service reaching this point varies. Moreover, the SD values are routinely above five minutes, sometimes as high as ten, indicating that there is a very wide scatter of headway values.
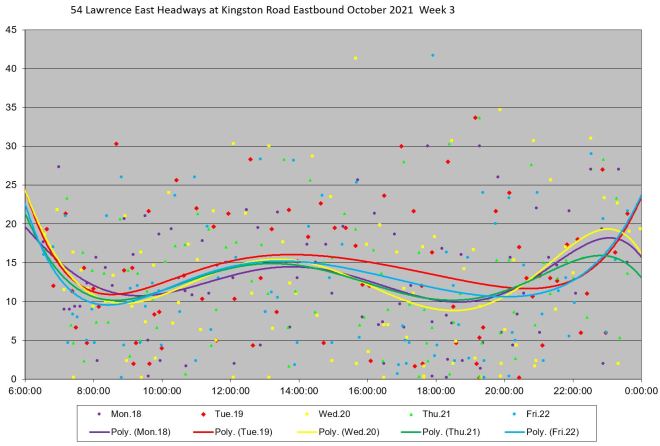
This is clear in the detailed charts where gaps of over twenty minutes are common, but headways of zero to two minutes show bunching.
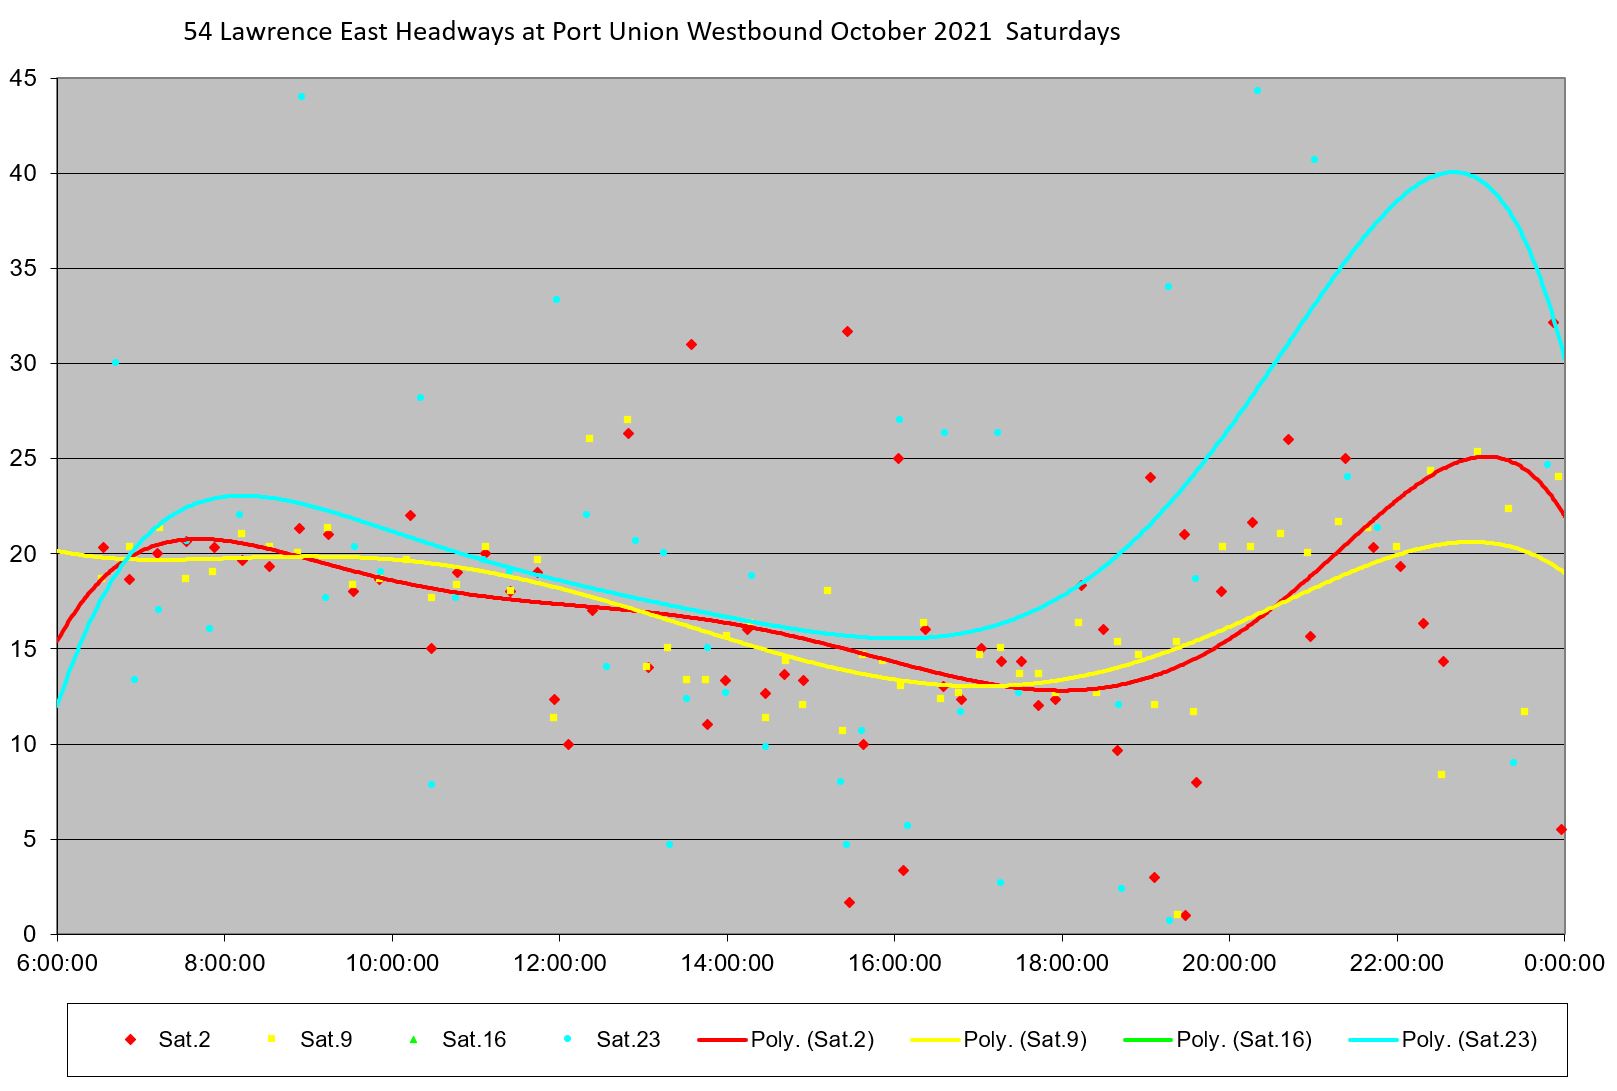
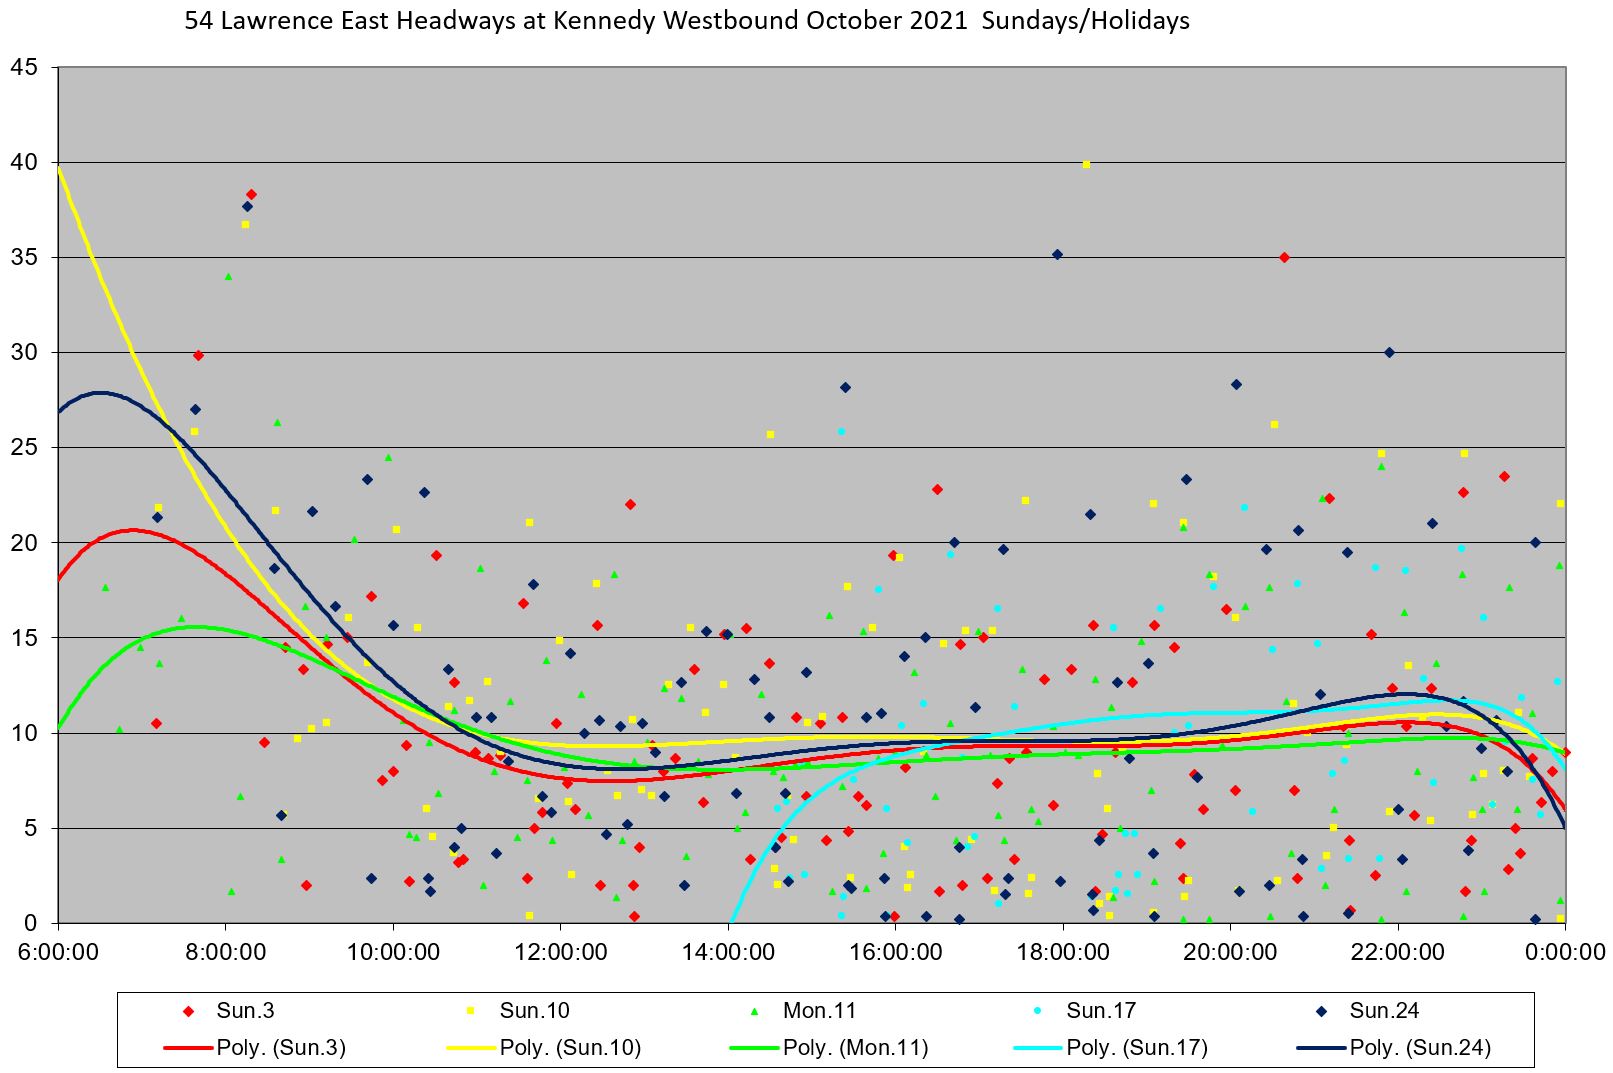
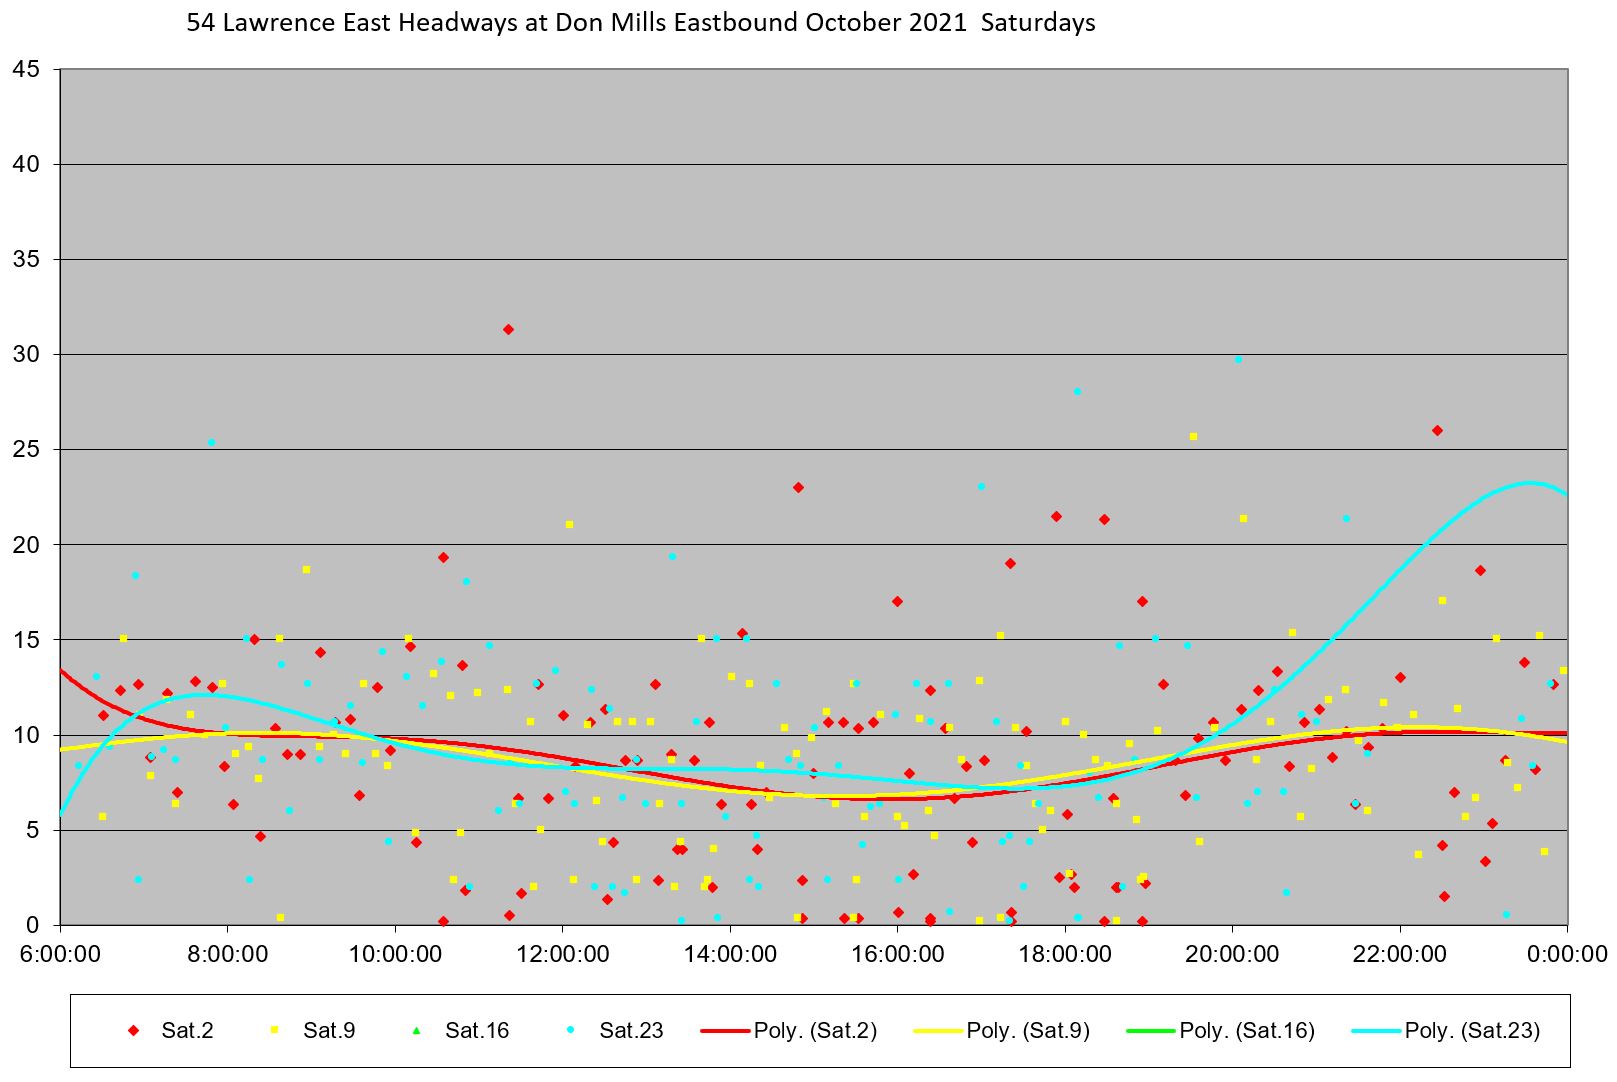
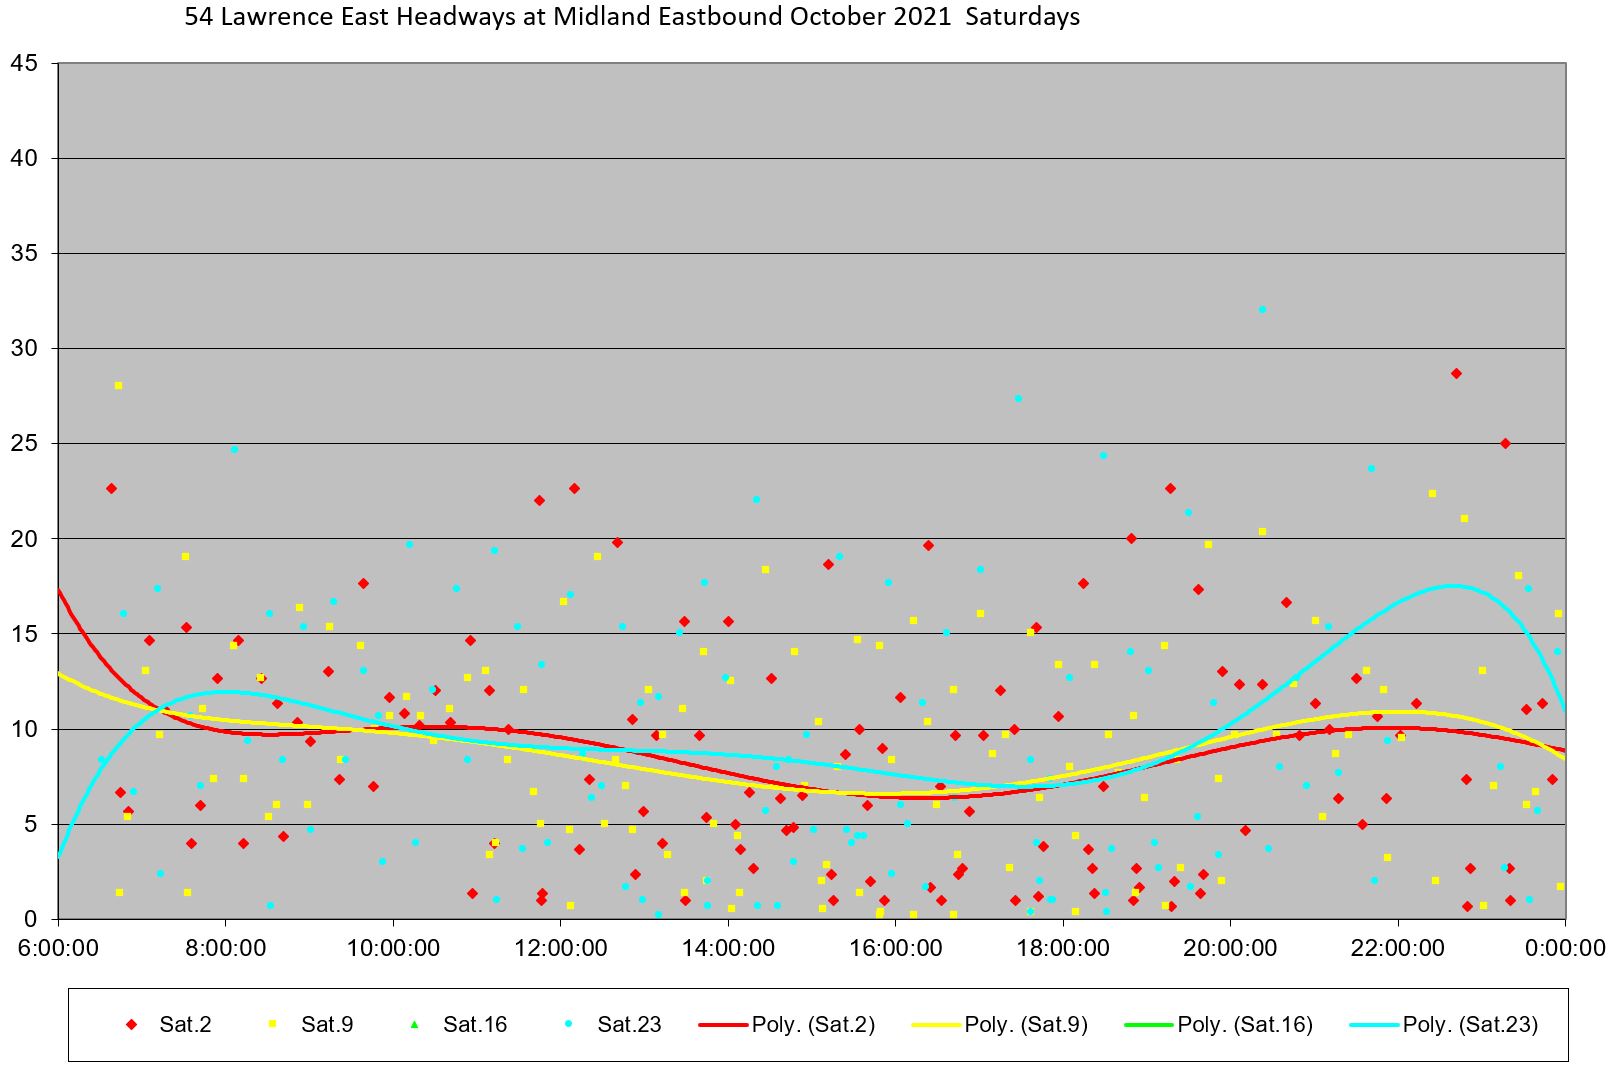
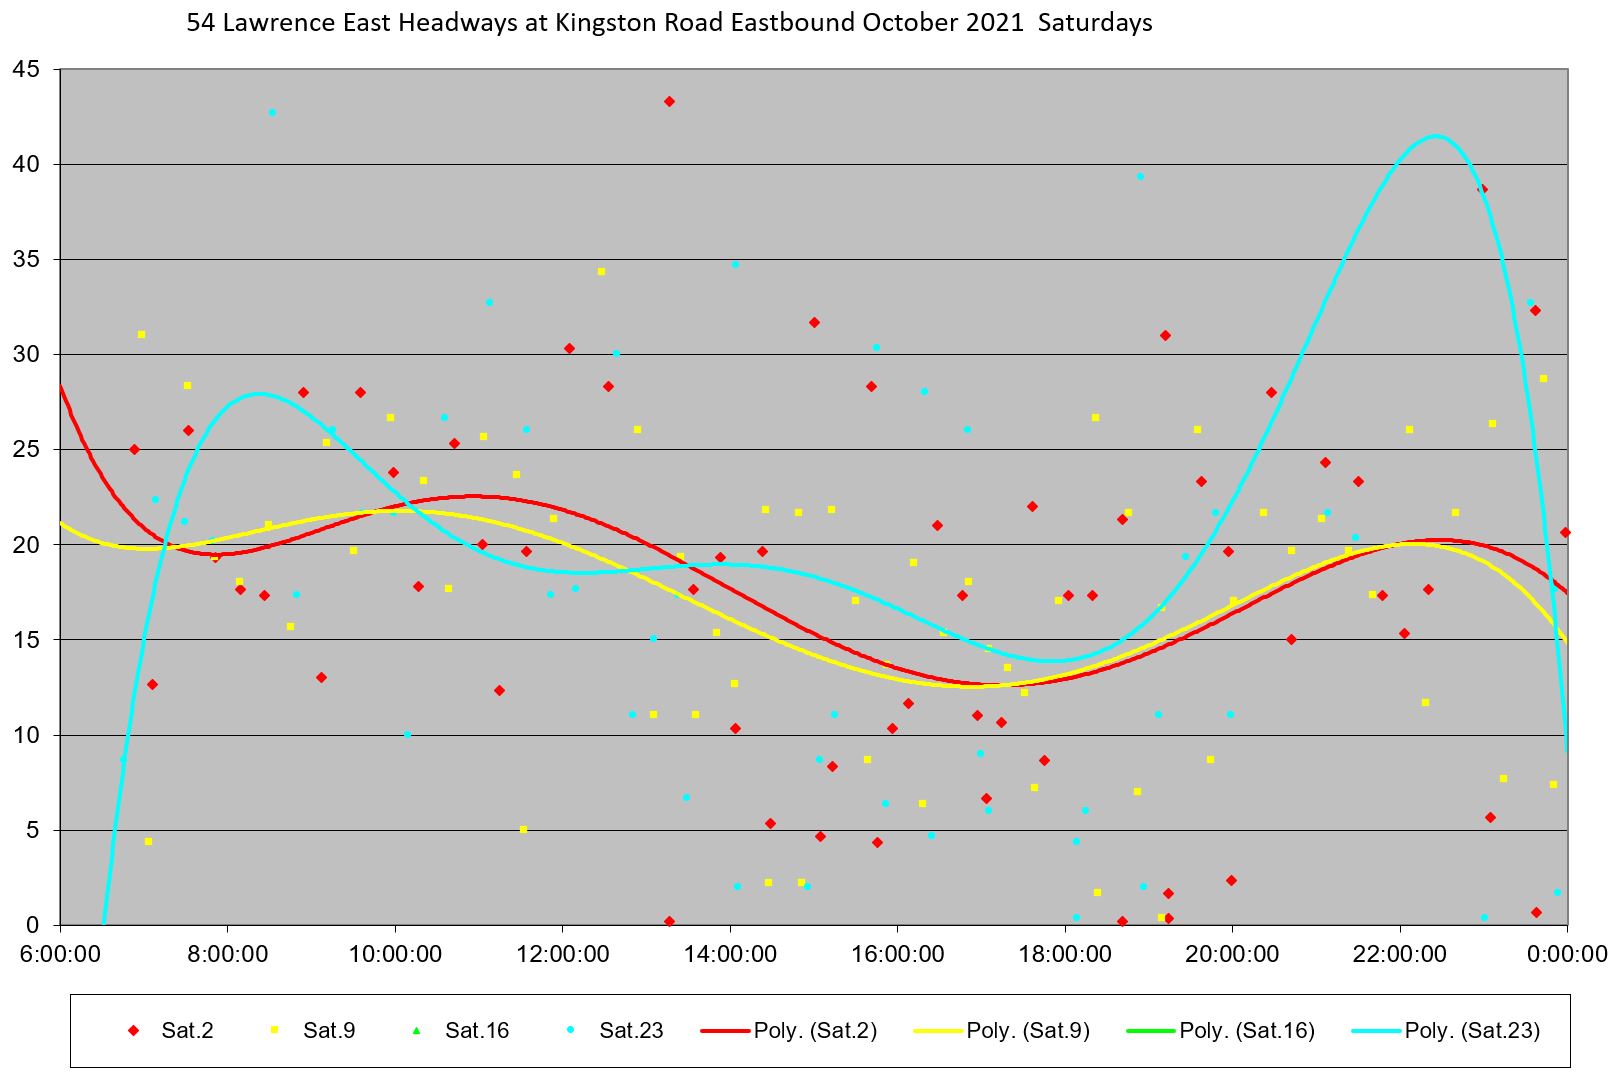
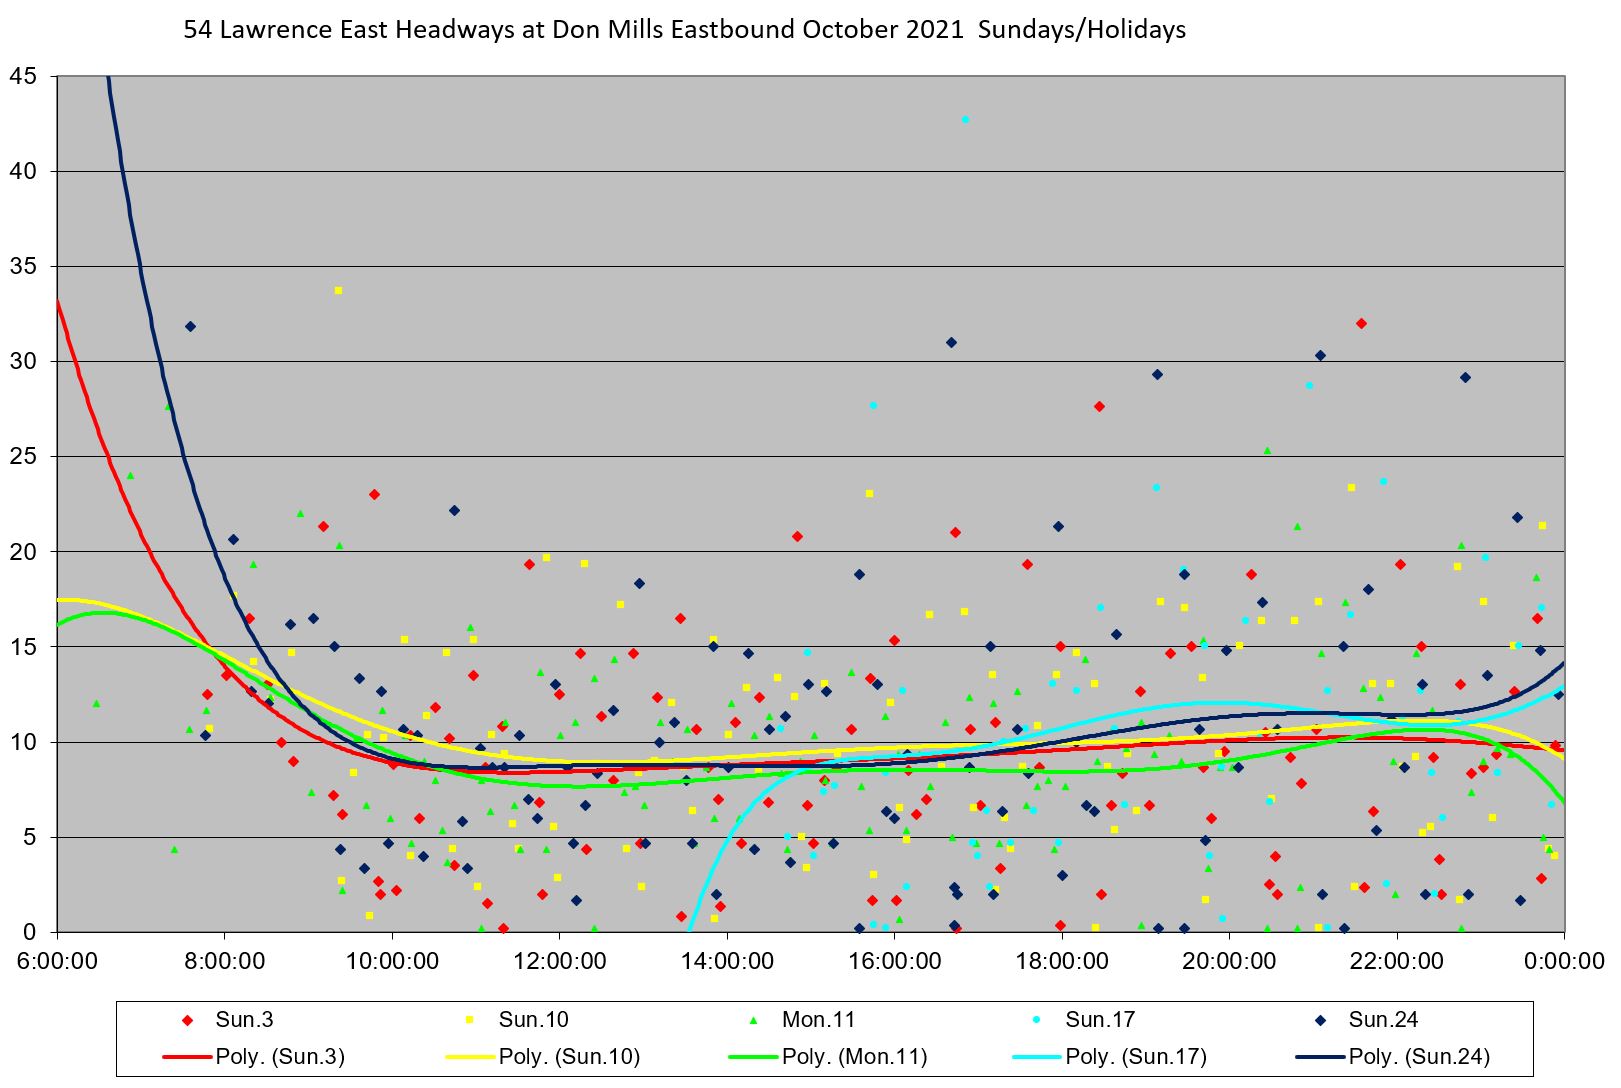
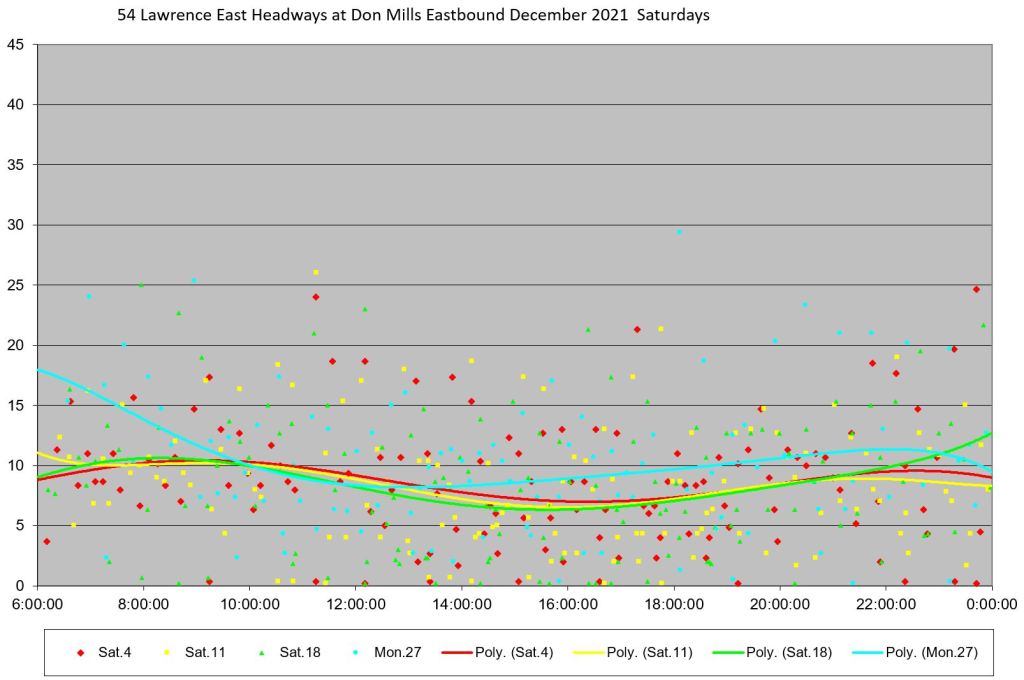
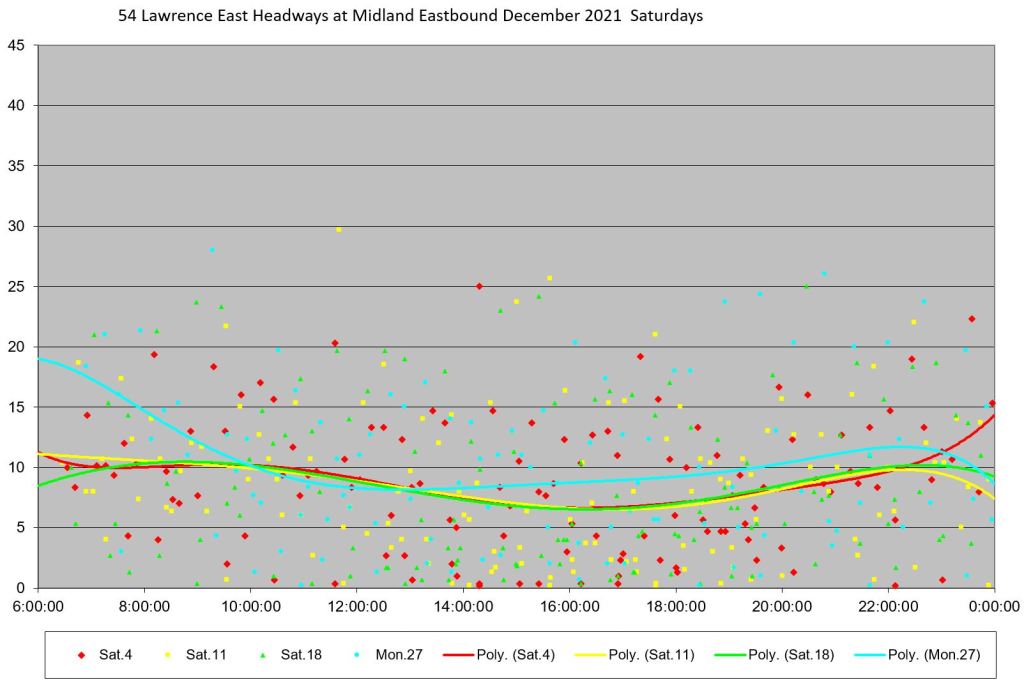
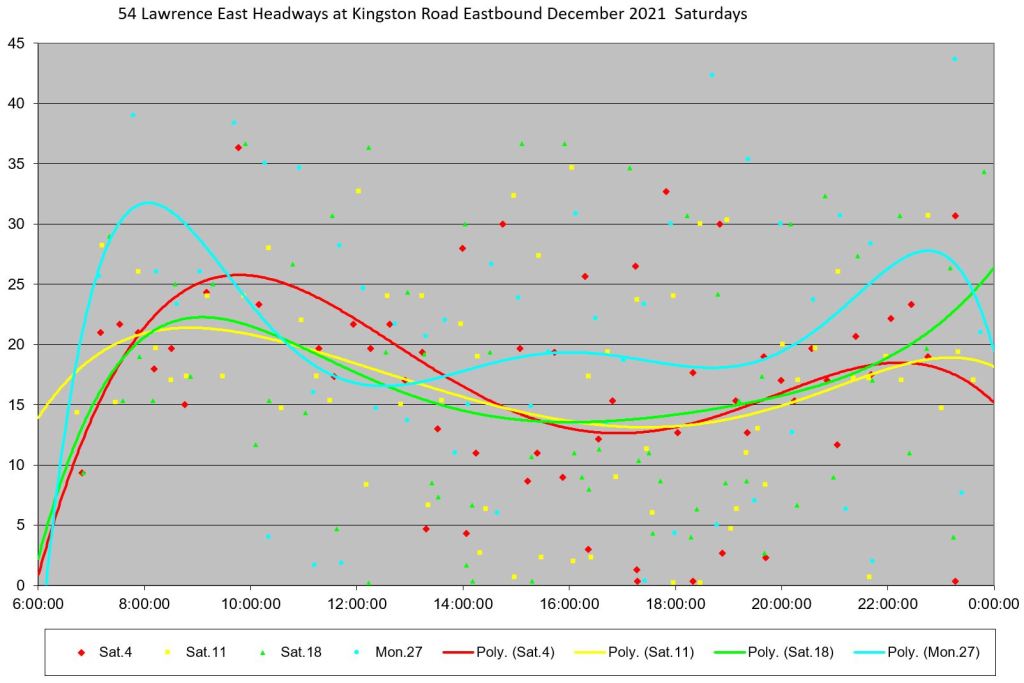
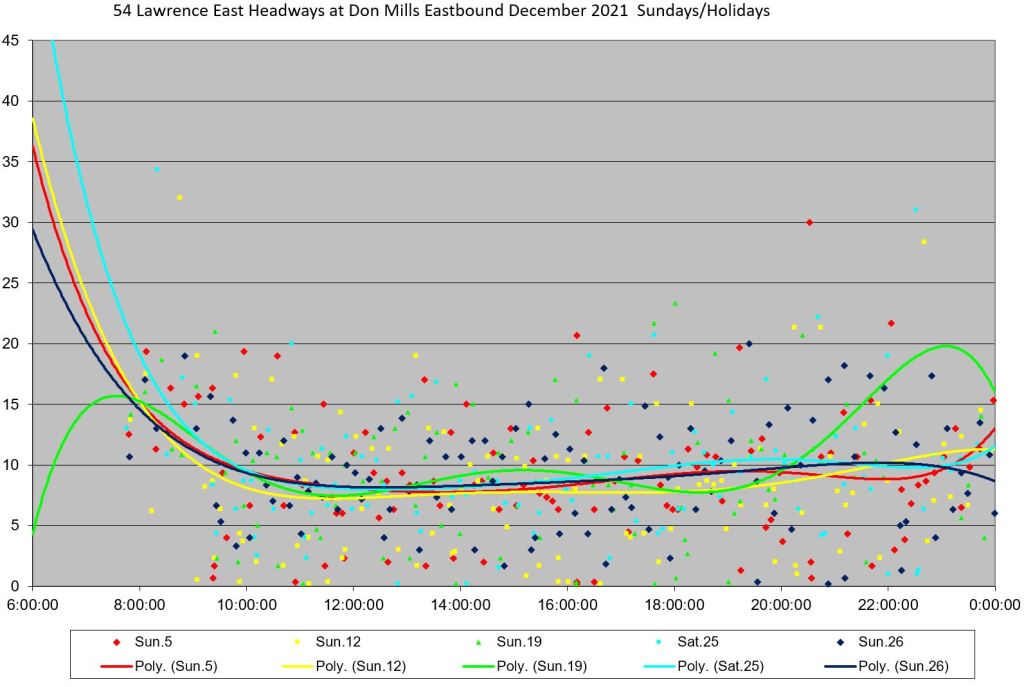
Weekend Headway Reliability
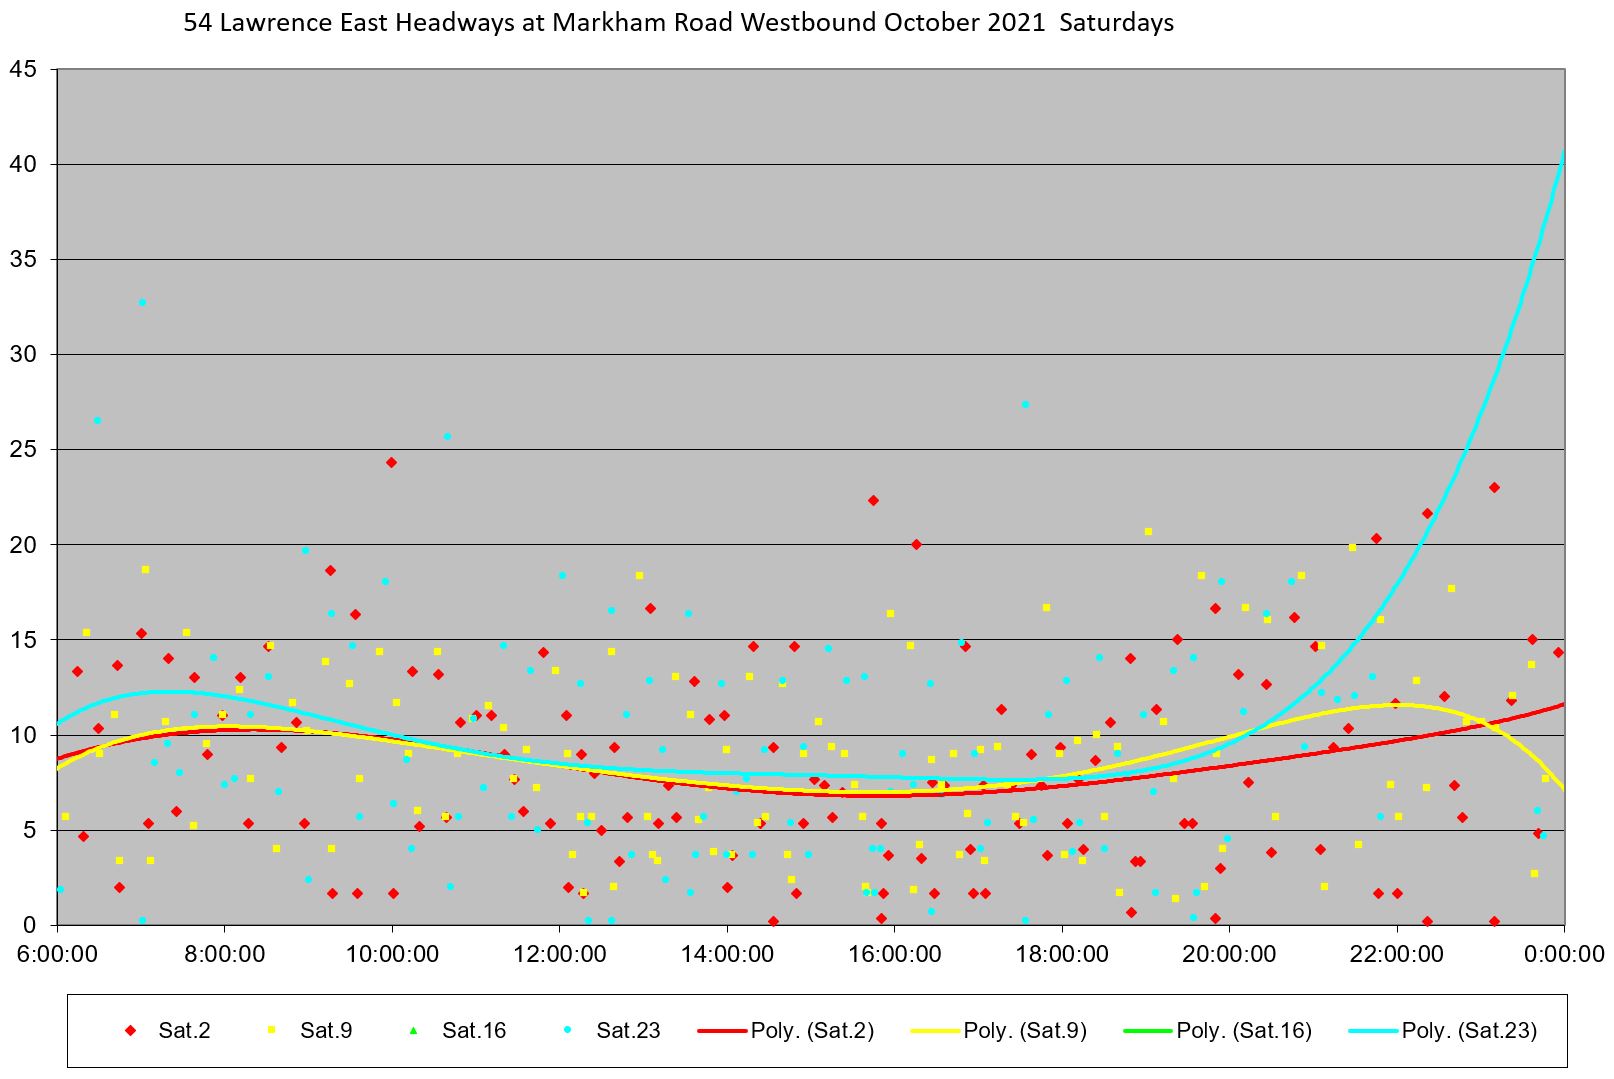
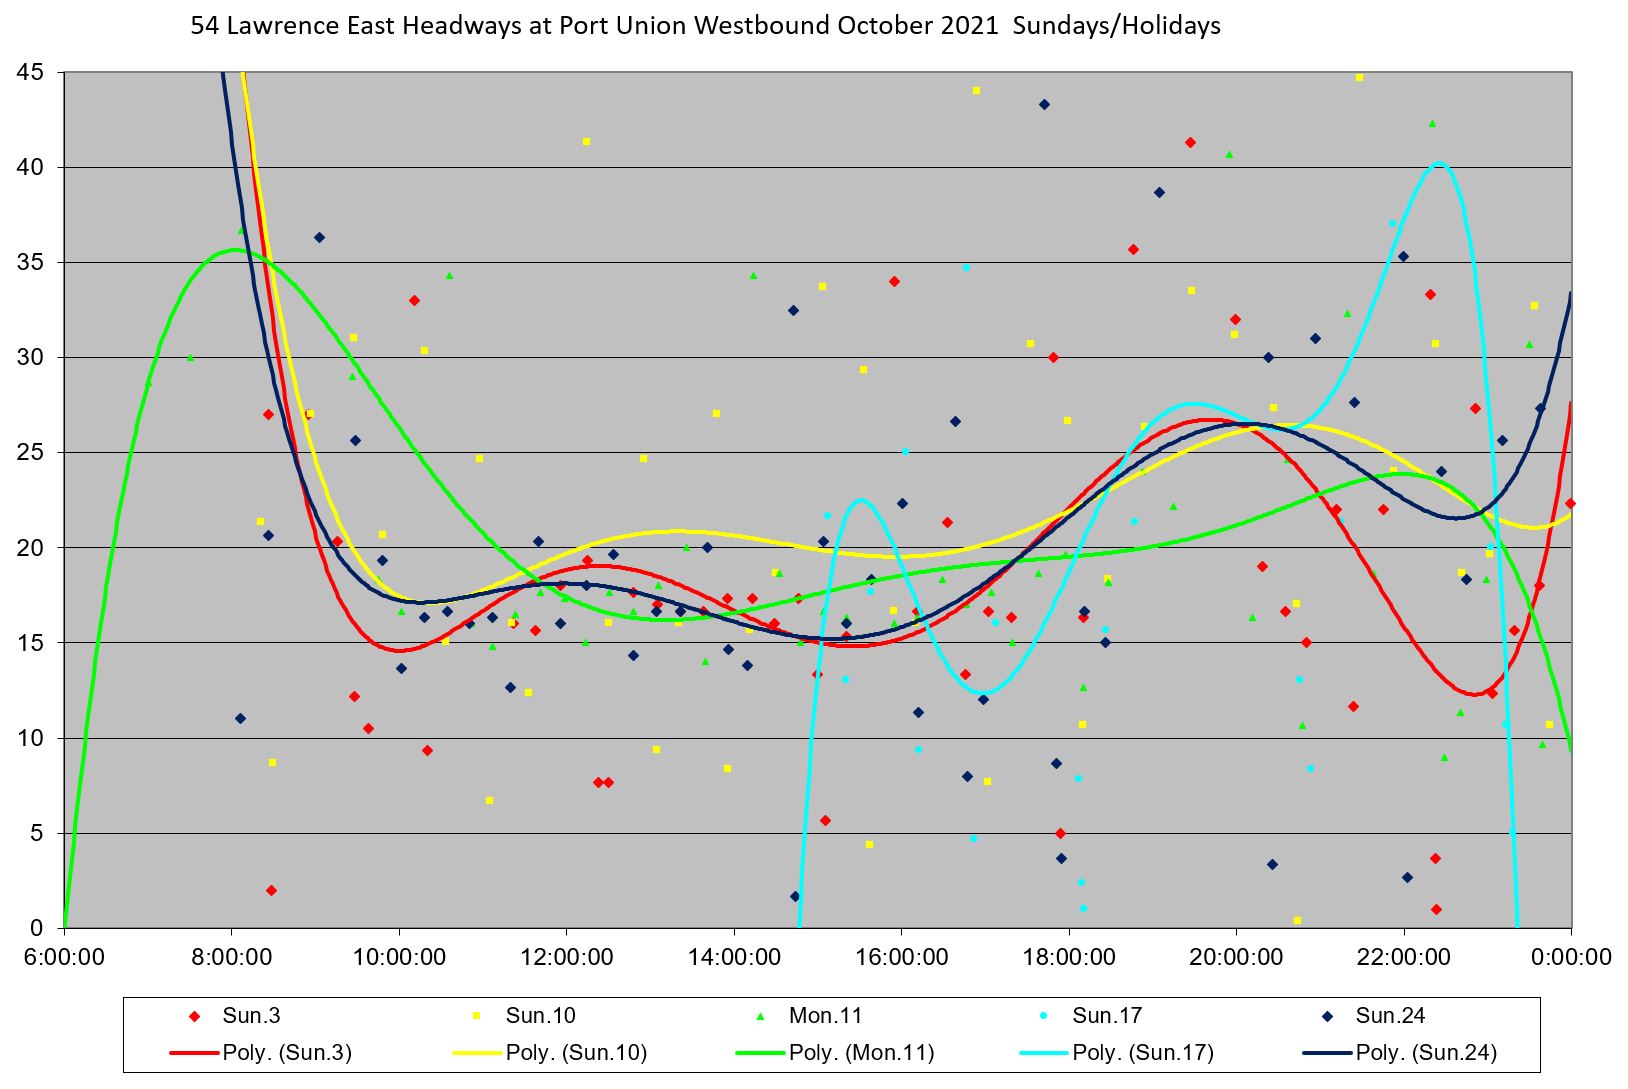
Because there are far fewer Saturdays and Sundays than weekdays, data for each type are consolidated on a single chart. For ease of comparison, these are presented in geographical sequence reading across with Saturdays on the first row of each set, and Sundays on the second.
Note that the trend lines behave strangely in a few places due to the small number of data points, particularly for service at Port Union.
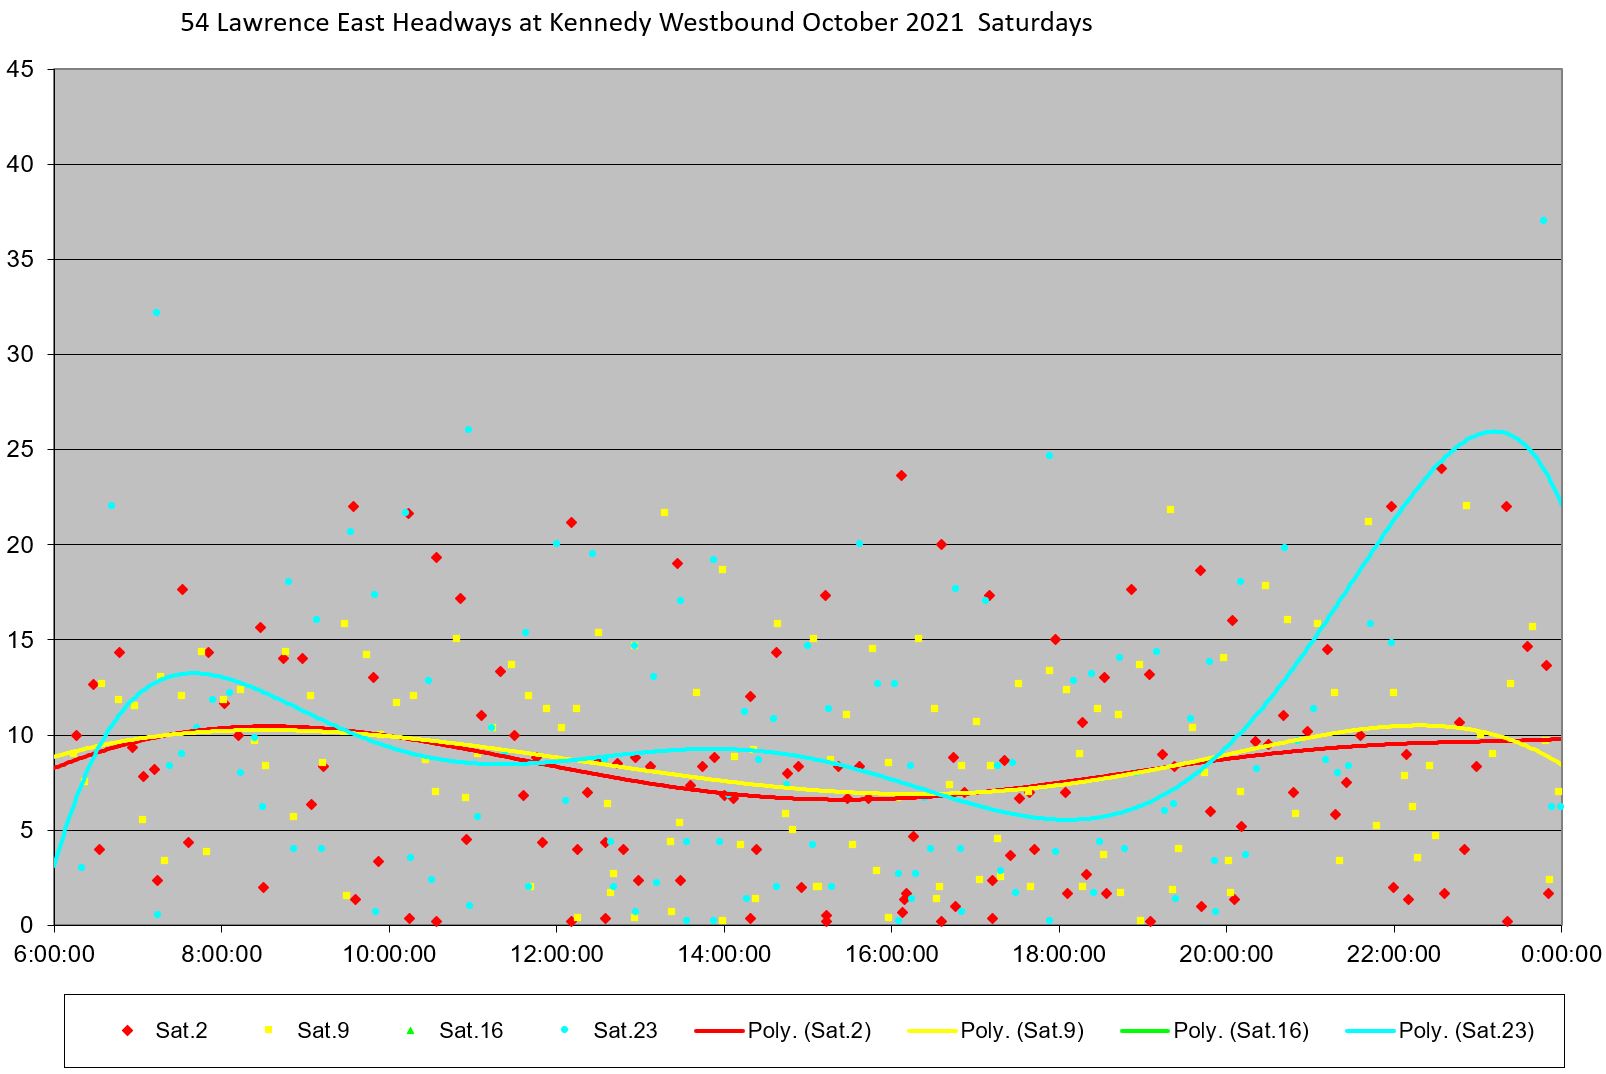
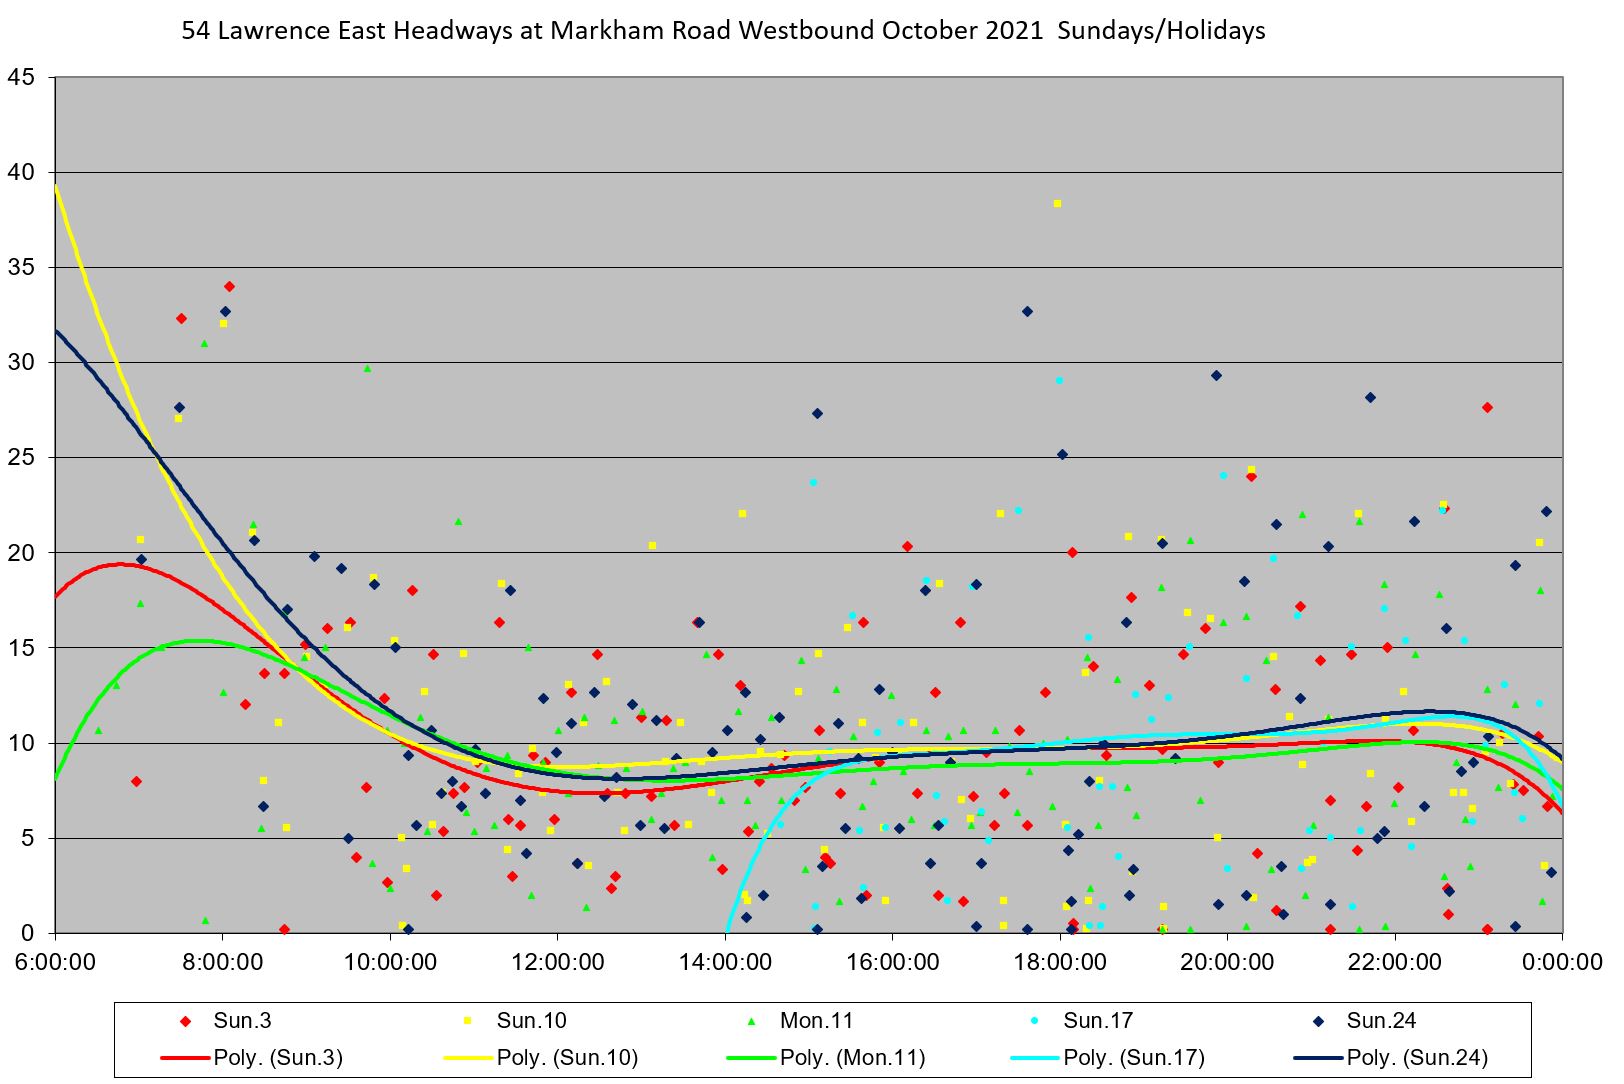
What is consistent here is the very wide range of values with the “cloud” of point spread over a wide range of values, at times over half an hour. There are also many very small values indicating that the wide gaps are caused by bunching, not by missing vehicles. Even on the portion of the route with the combined 54A and 54B services headways are scattered over a range greatly in excess of the TTC’s six-minute target from the Service Standards.
As with the weekday operations, headways are not regulated at Lawrence East Station. Buses depart westbound (Kennedy screenline) and eastbound (Midland screenline) just as erratically as they arrive.
Because of the cyber-attack on the TTC and its aftermath, data for November weekends is incomplete, and that month is not included below.
October
Westbound
Eastbound
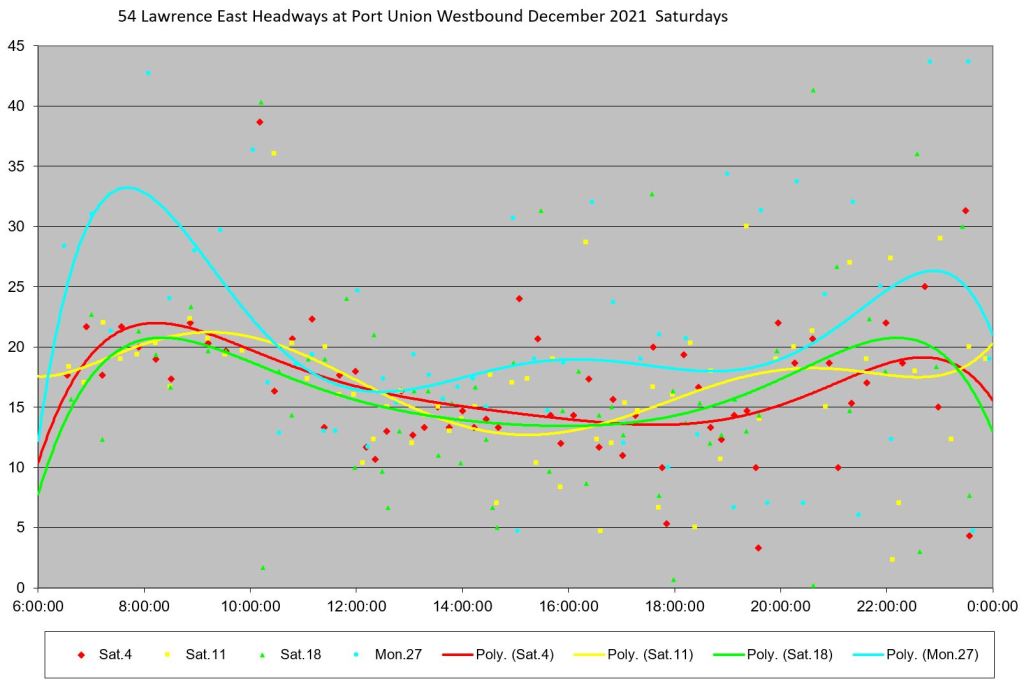
December
In the December charts, Christmas Day (a Saturday) is included on the Sunday charts. Boxing Day (observed on a Monday) is included in the Saturday charts.
The range of headway values is not quite as bad in December as in October, but it is still far from ideal. Note that on some days, headways westbound at Port Union are quite reliable compared to other examples, and they lie within a narrow band of values for at least part of the day. However the two branches of the route do not blend reliably further west leading to a band of headways about 20 minutes wide at Markham Road.
Westbound
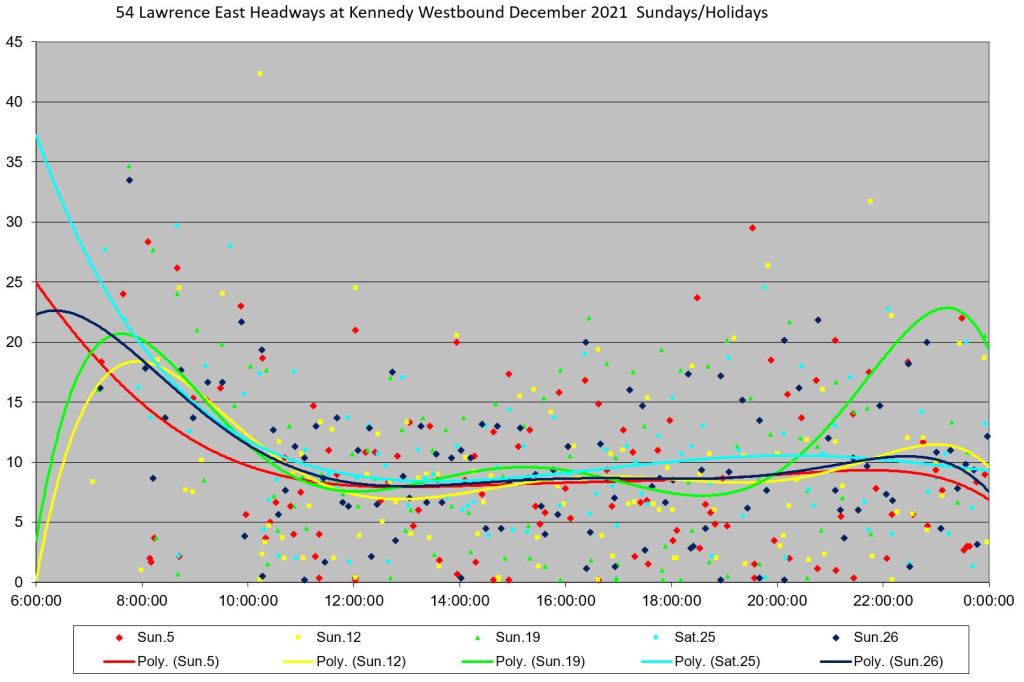
Eastbound
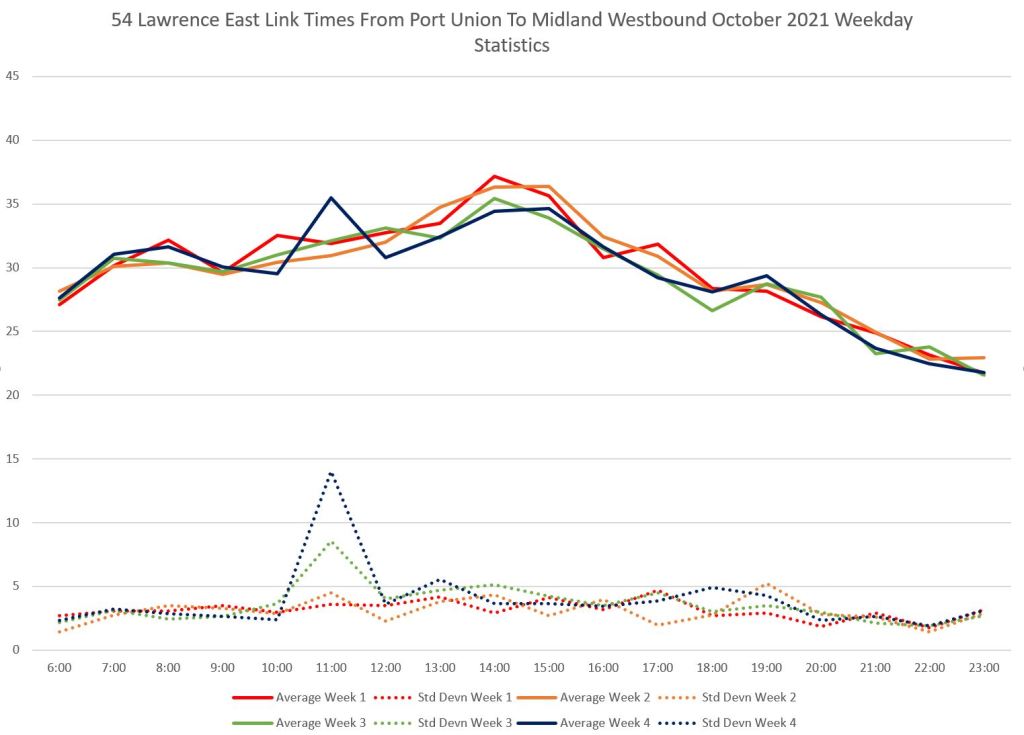
Travel Times
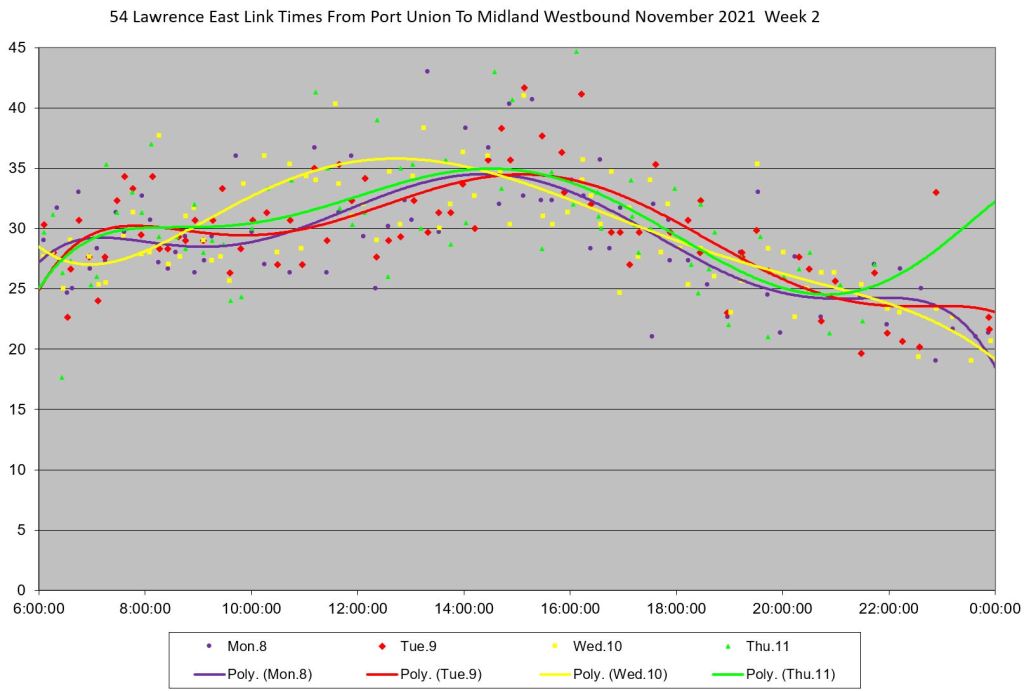
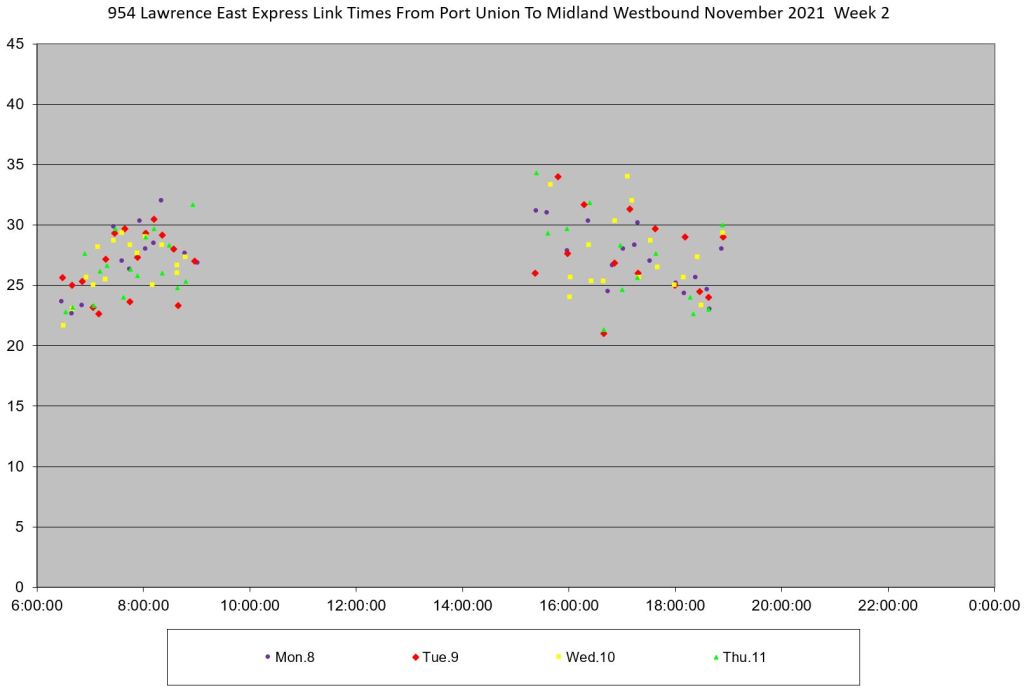
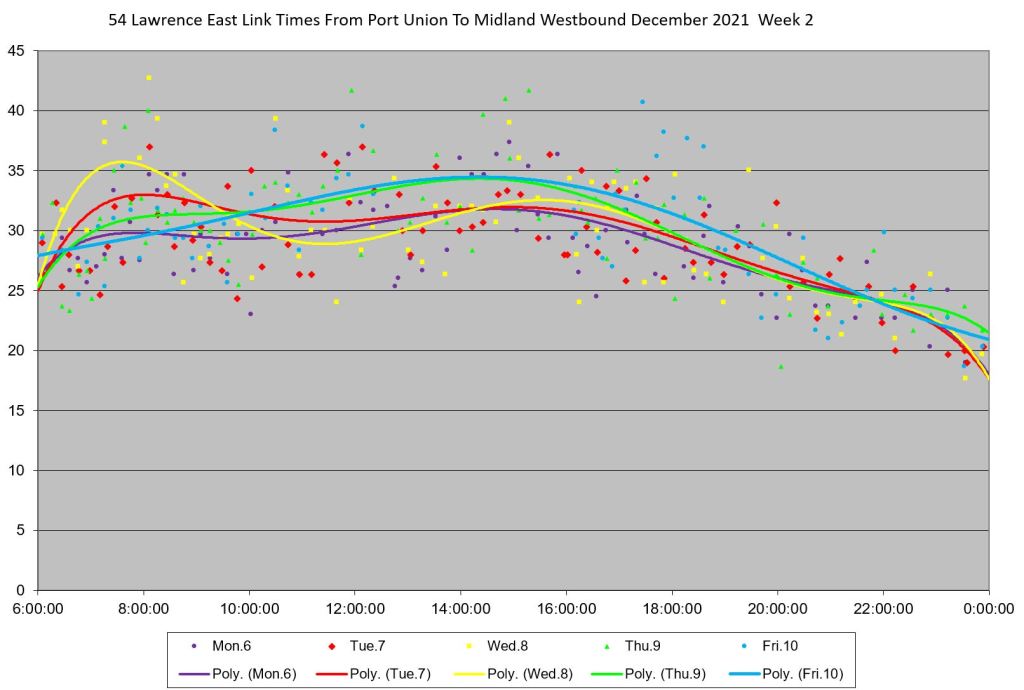
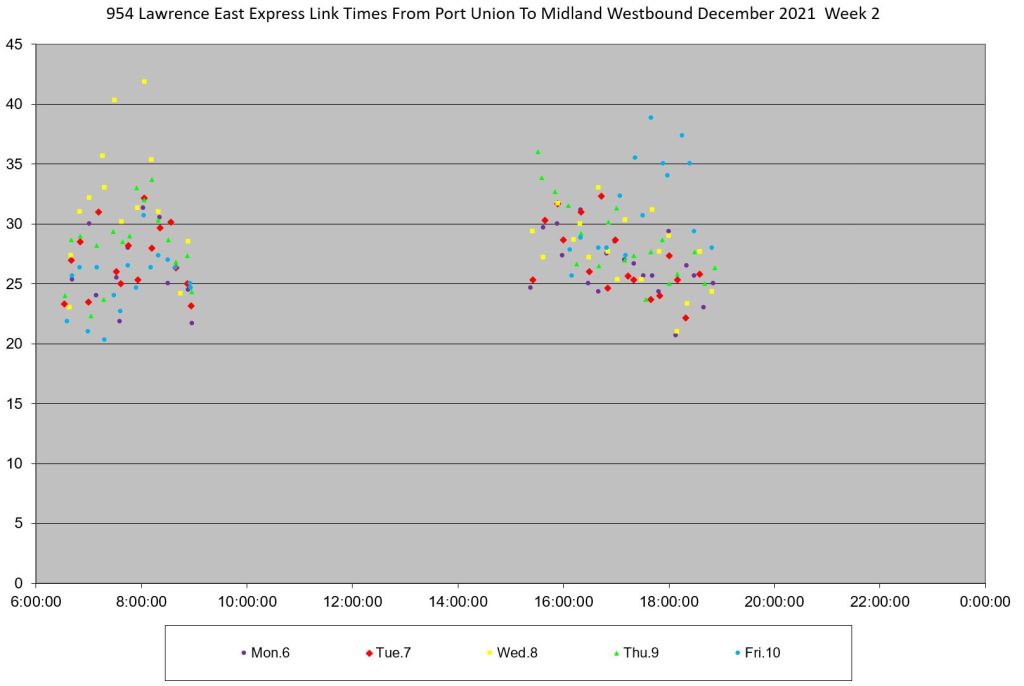
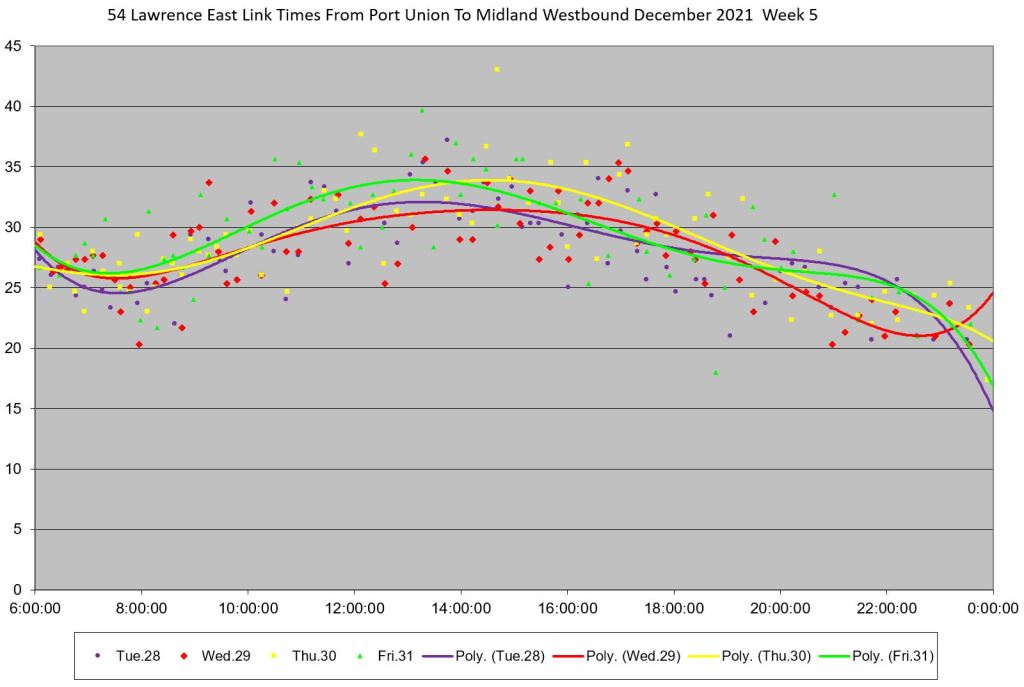
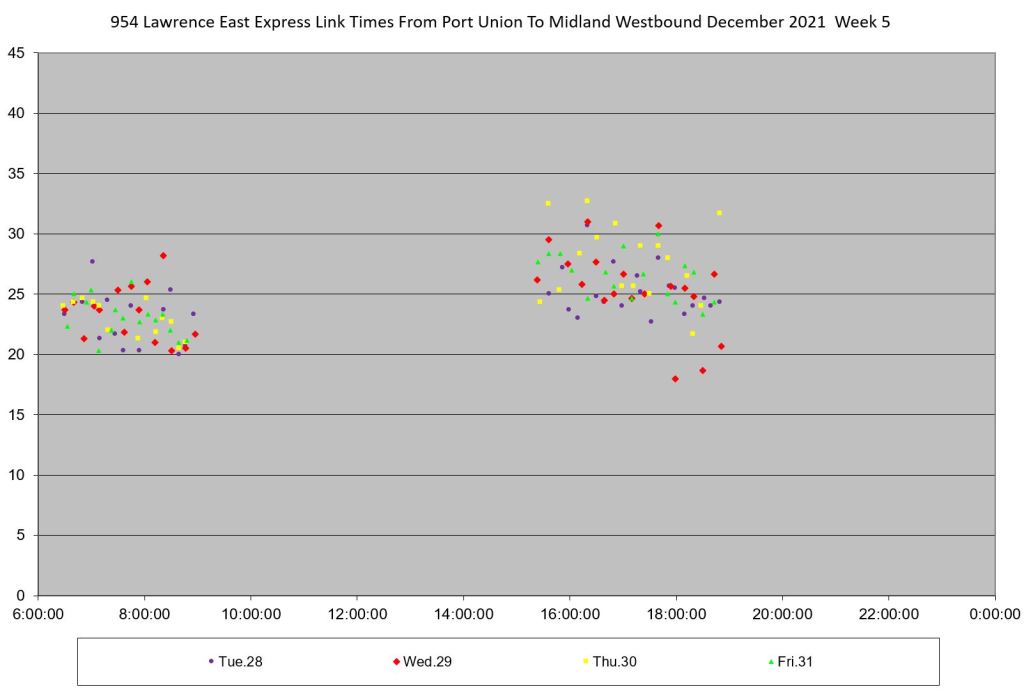
Port Union to Midland Westbound
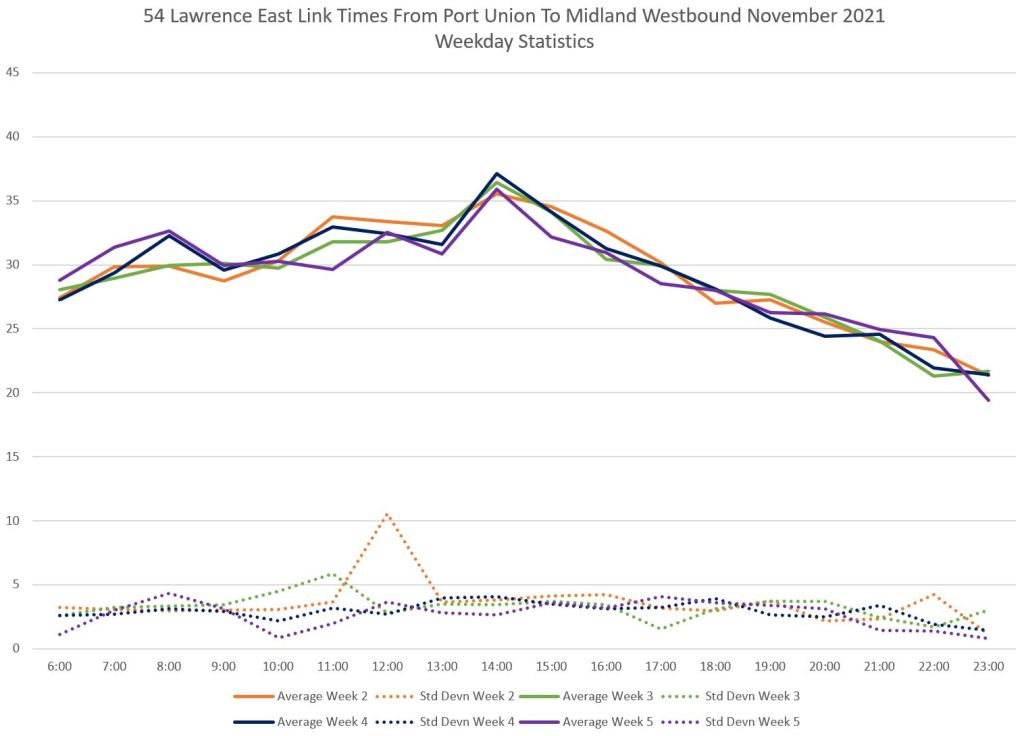
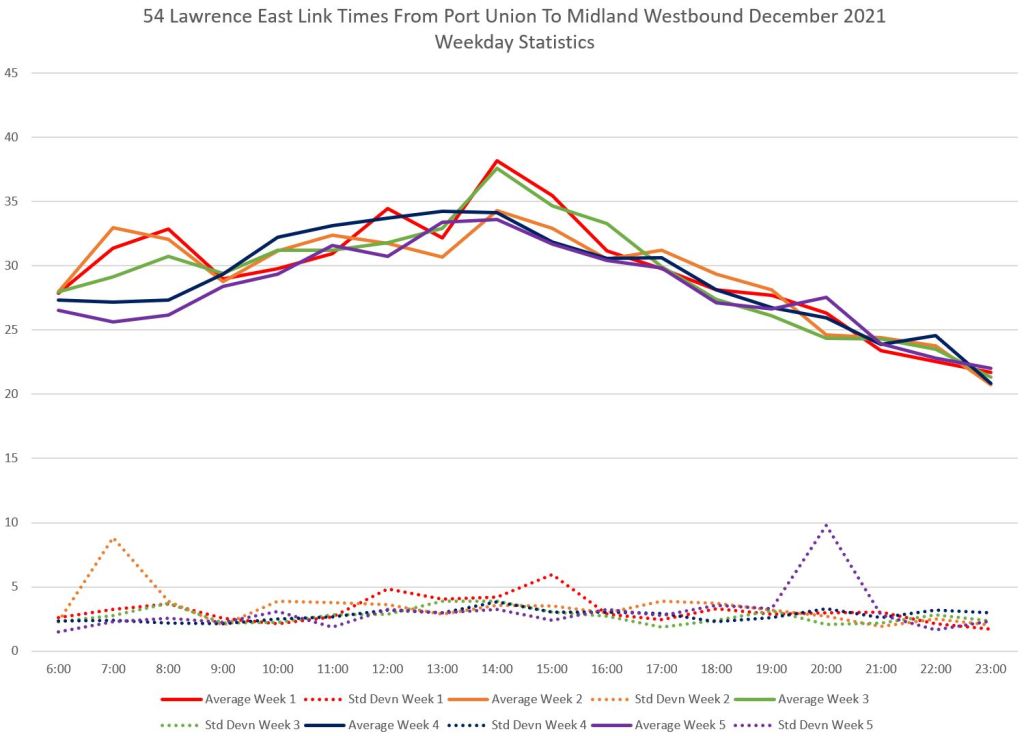
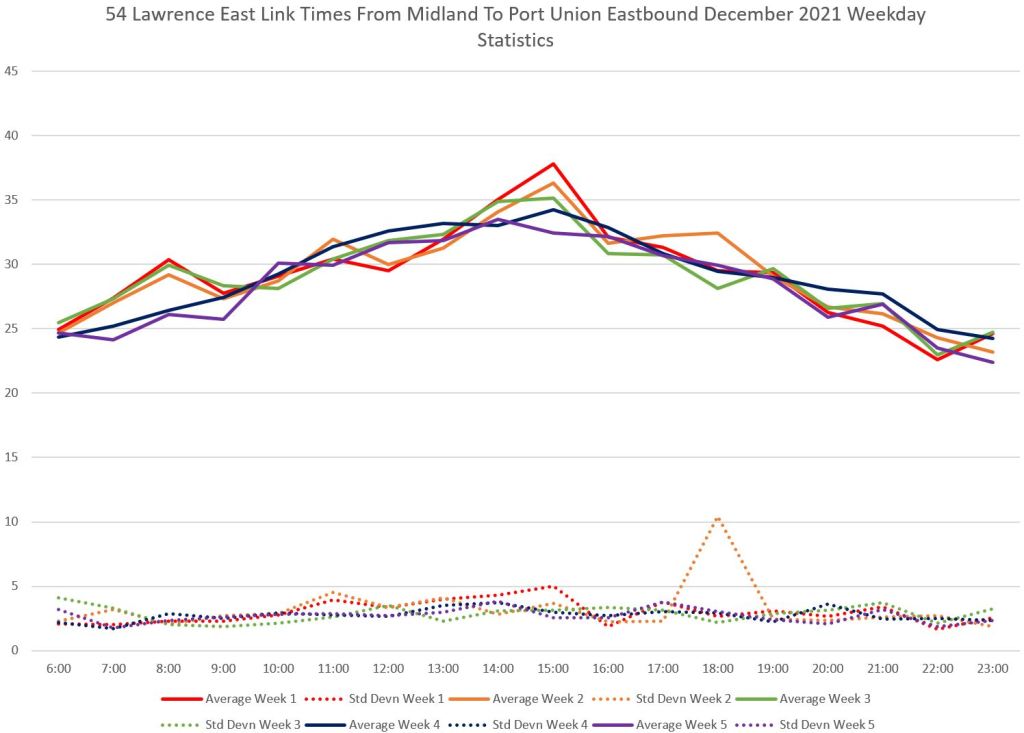
In this section, the first row contains the averages and standard deviations for travel times westbound from Port Union to Midland. This entire area would receive “red lane” treatment under the RapidTO plan.
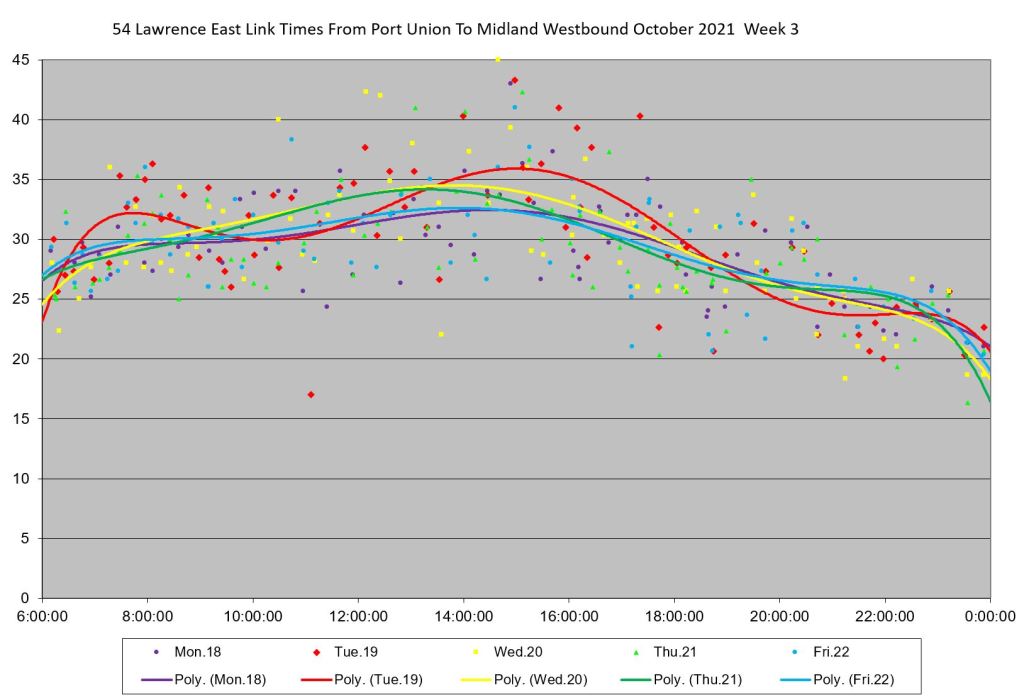
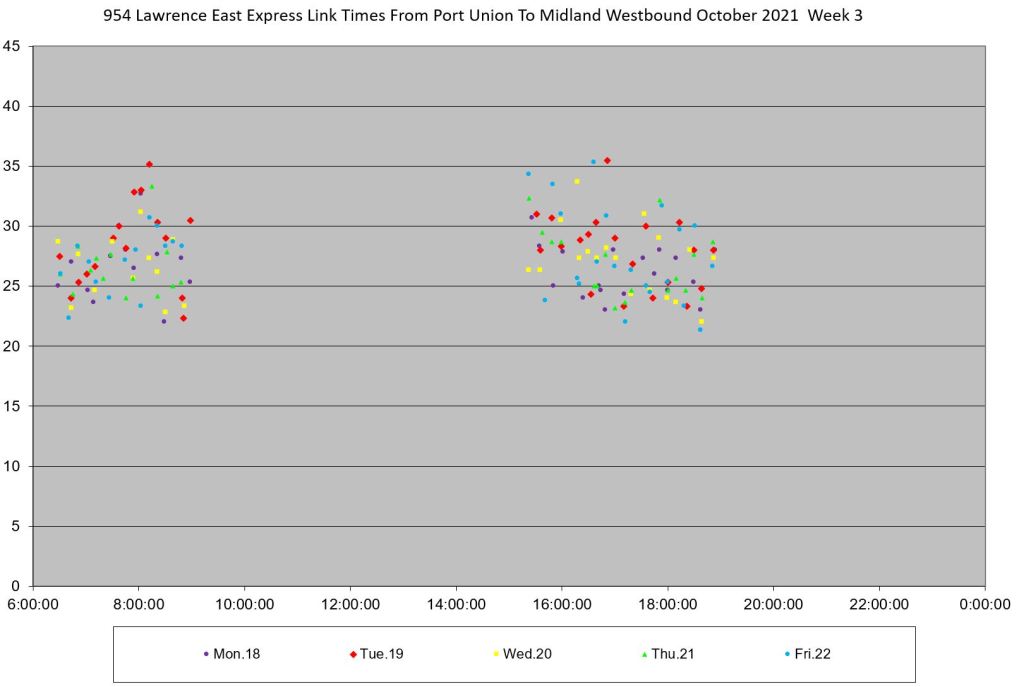
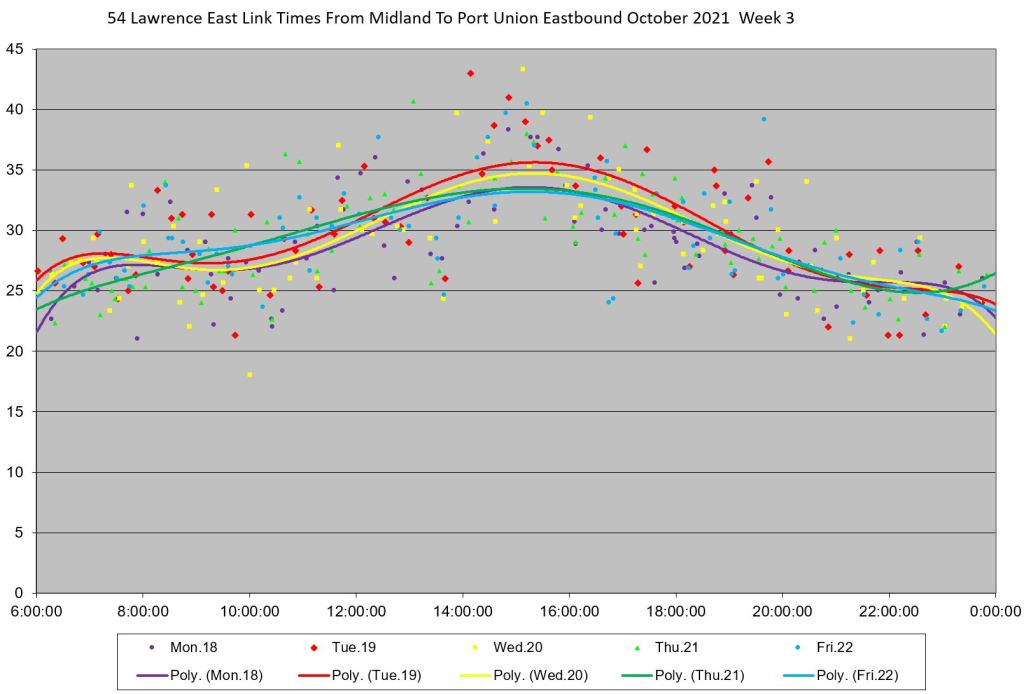
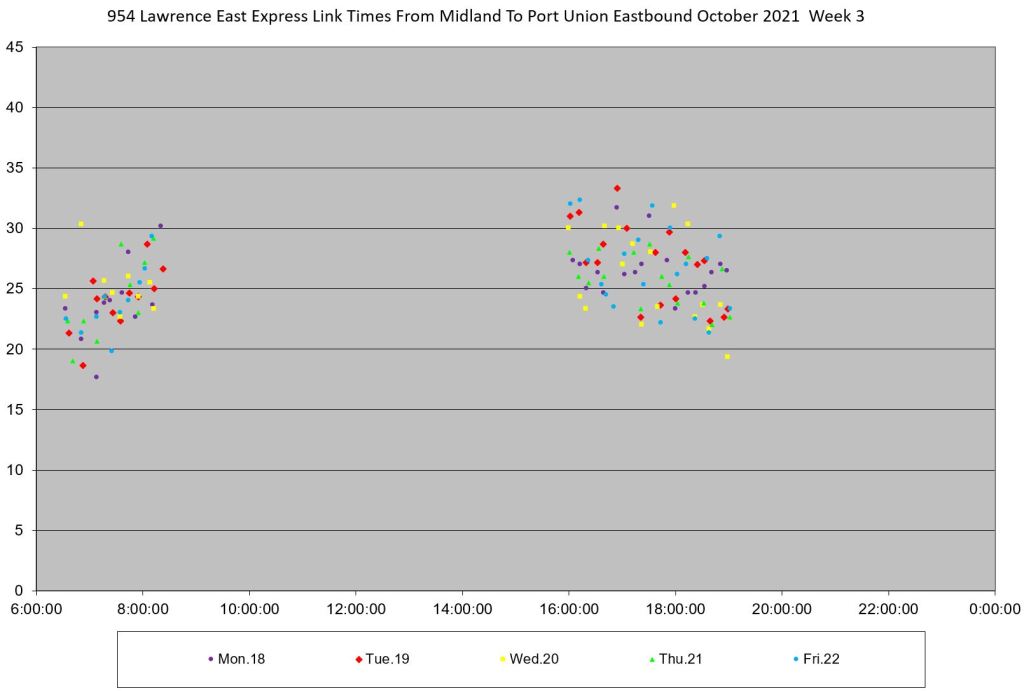
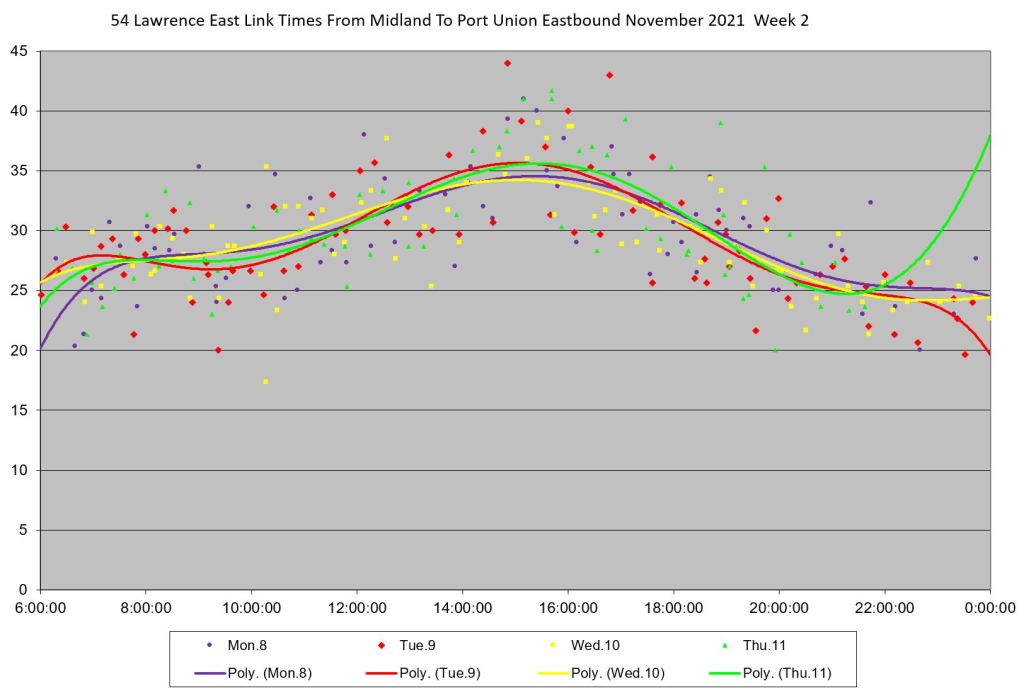
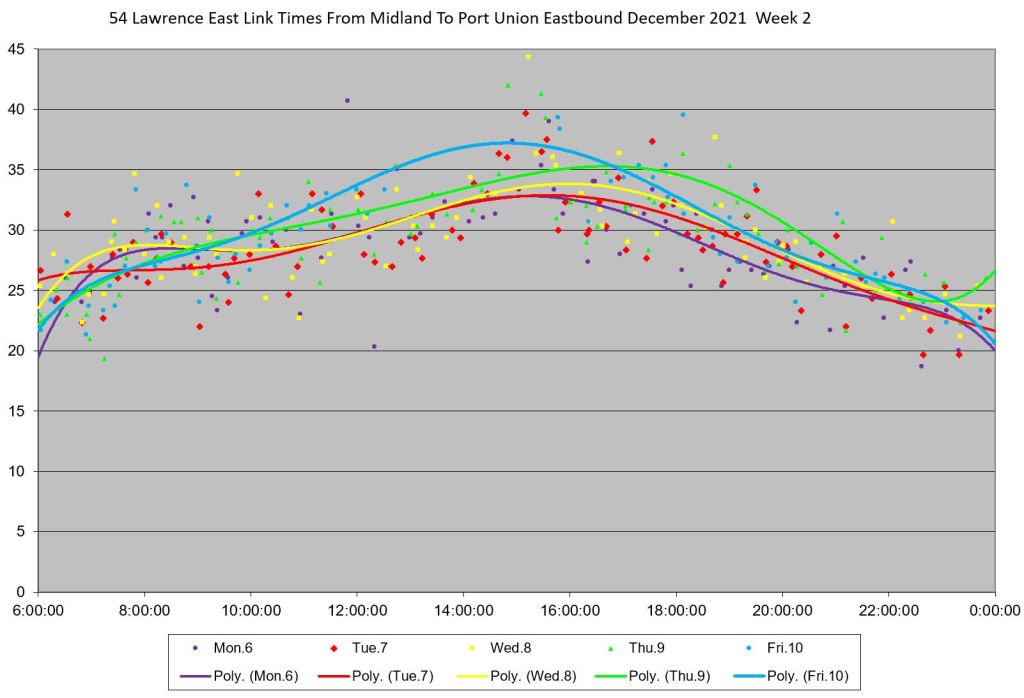
The following section compares travel times for local and express service during four selected weeks.
Items of note:
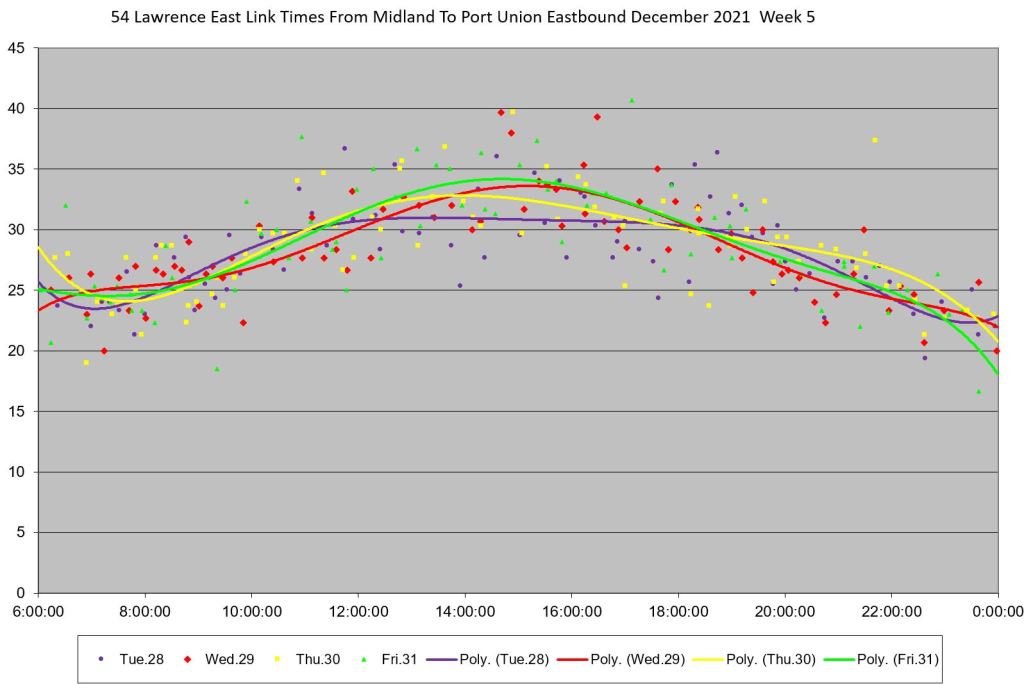
- The peak in travel times for local service occurs in the mid-afternoon before the pm peak.
- The last week of December has slightly shorter travel times than earlier in the month. This is due both to the holiday season and the imposition of social restrictions for the Omicron wave.
- The SD values for local service lie roughly and consistently at about 4 minutes. The data values are scattered over roughly a 10 minute band.
- Values for express travel times lie in a band roughly five minutes lower than for local trips, but they too show a dispersed set of values.
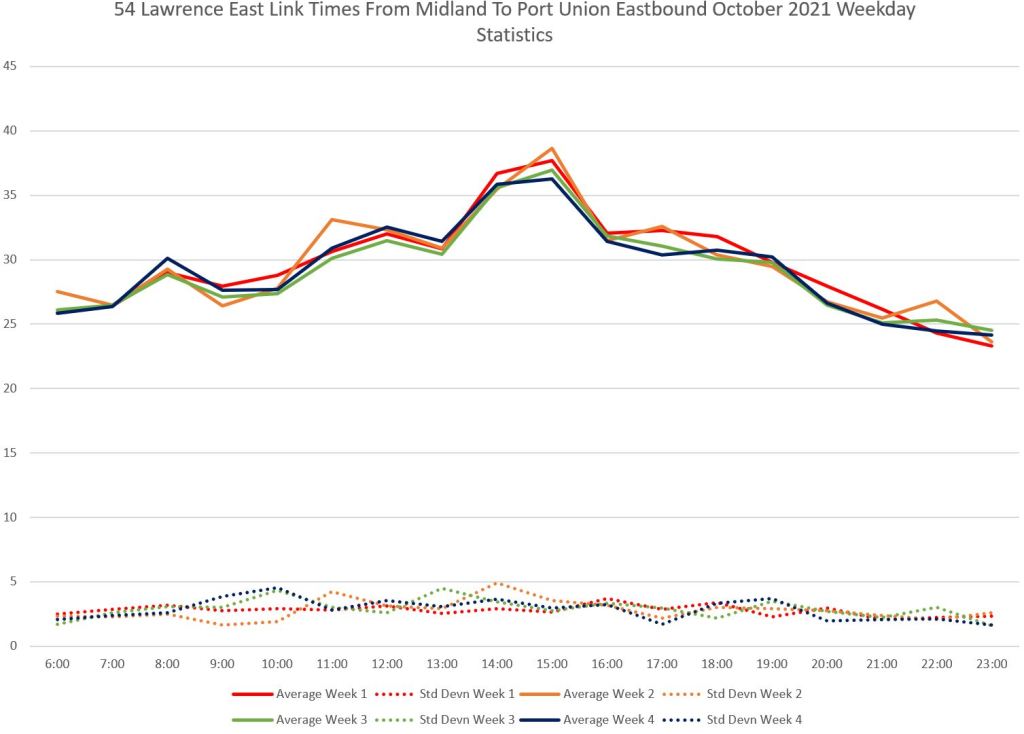
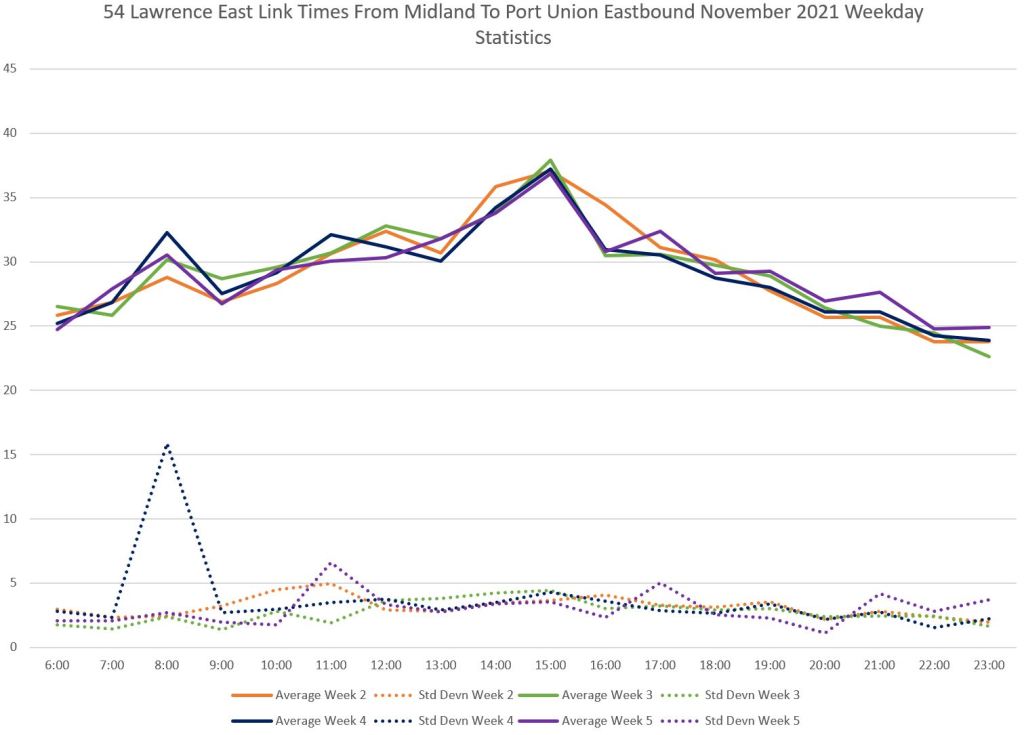
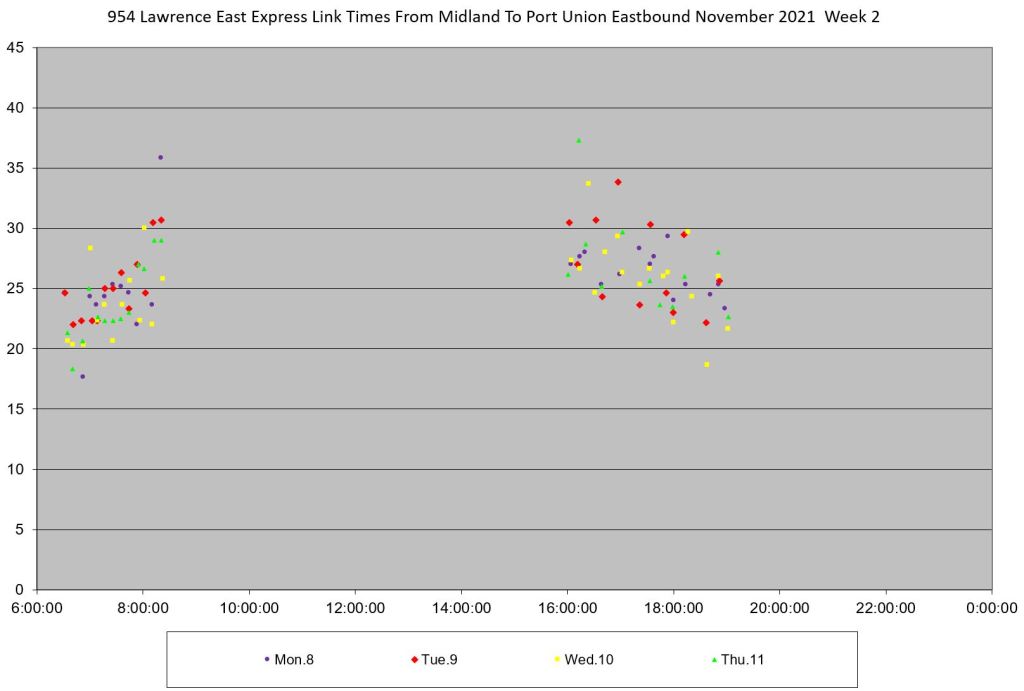
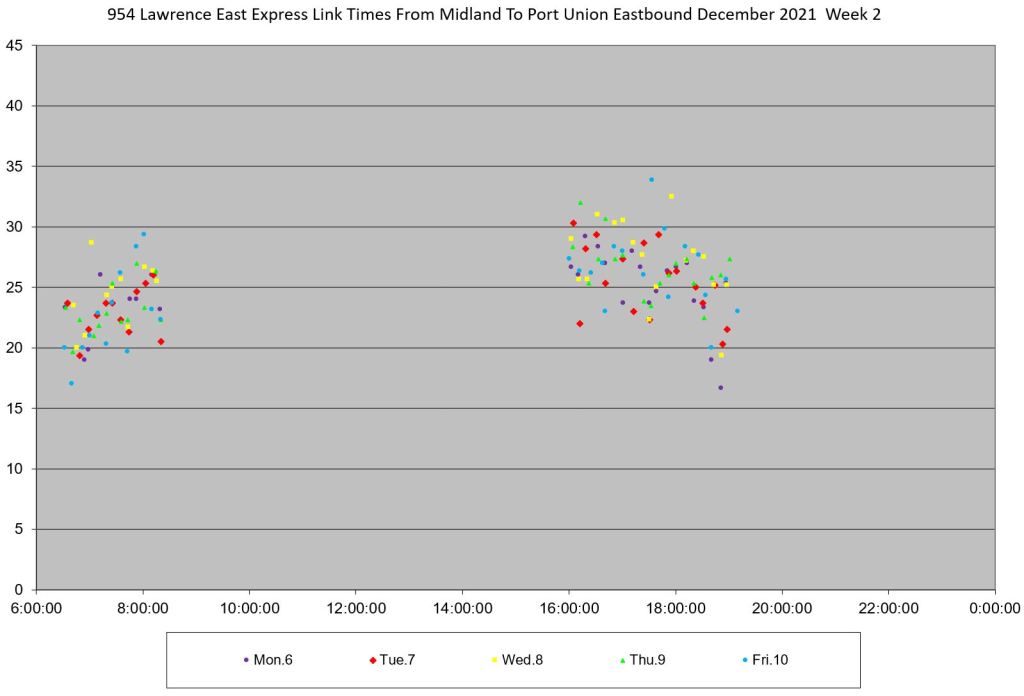
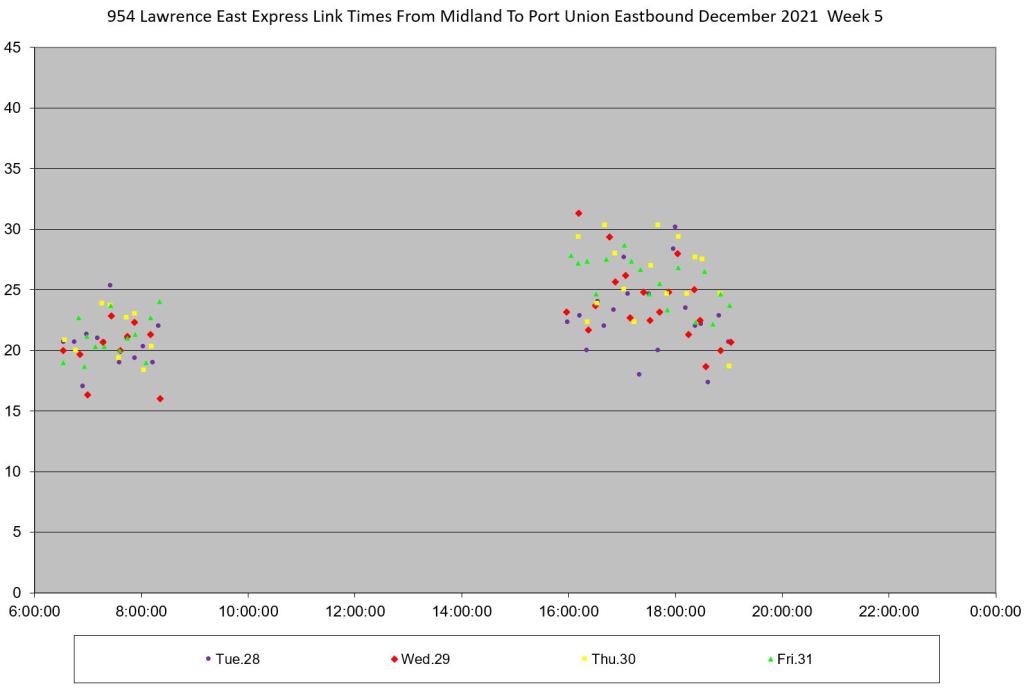
Midland to Port Union Eastbound
Eastbound service from Midland to Port Union shares the same travel time patterns as the westbound service.
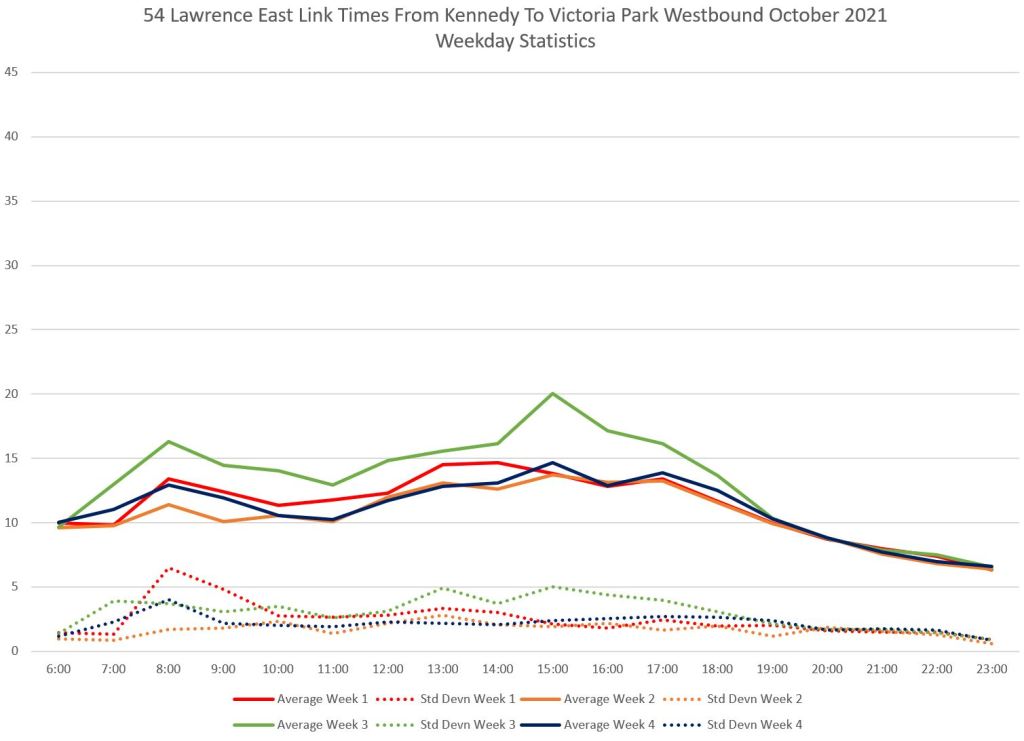
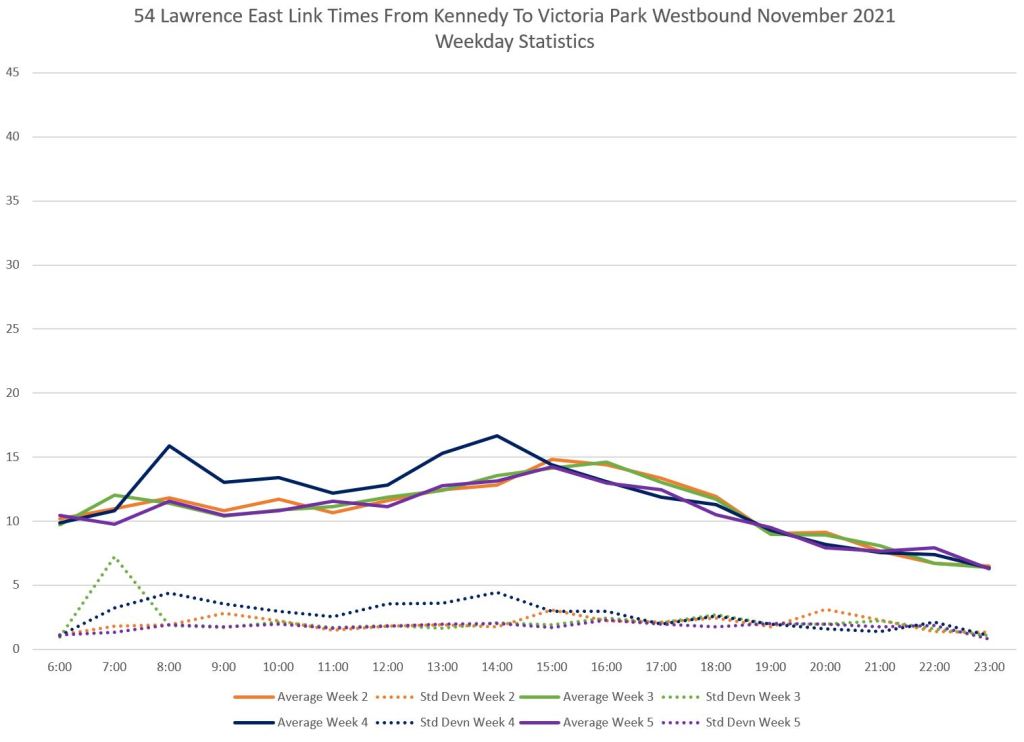
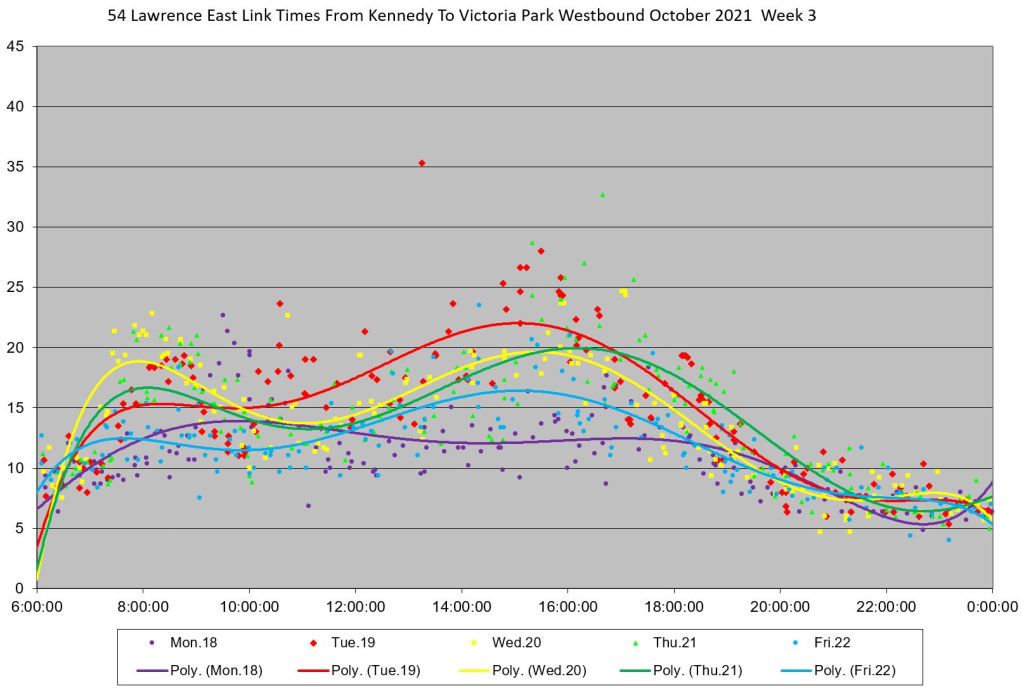
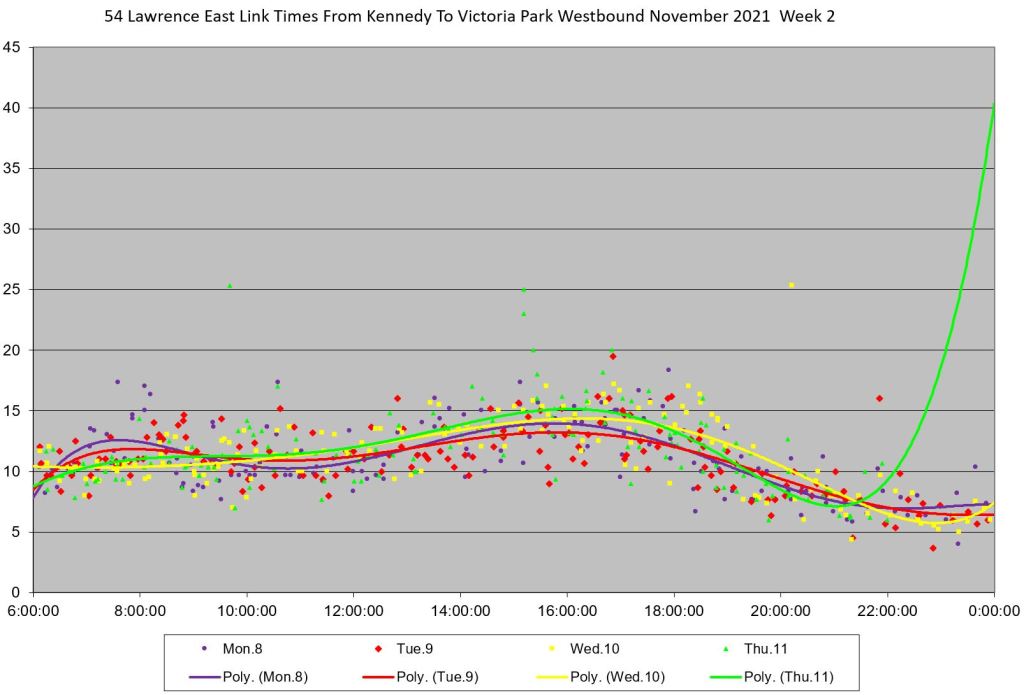
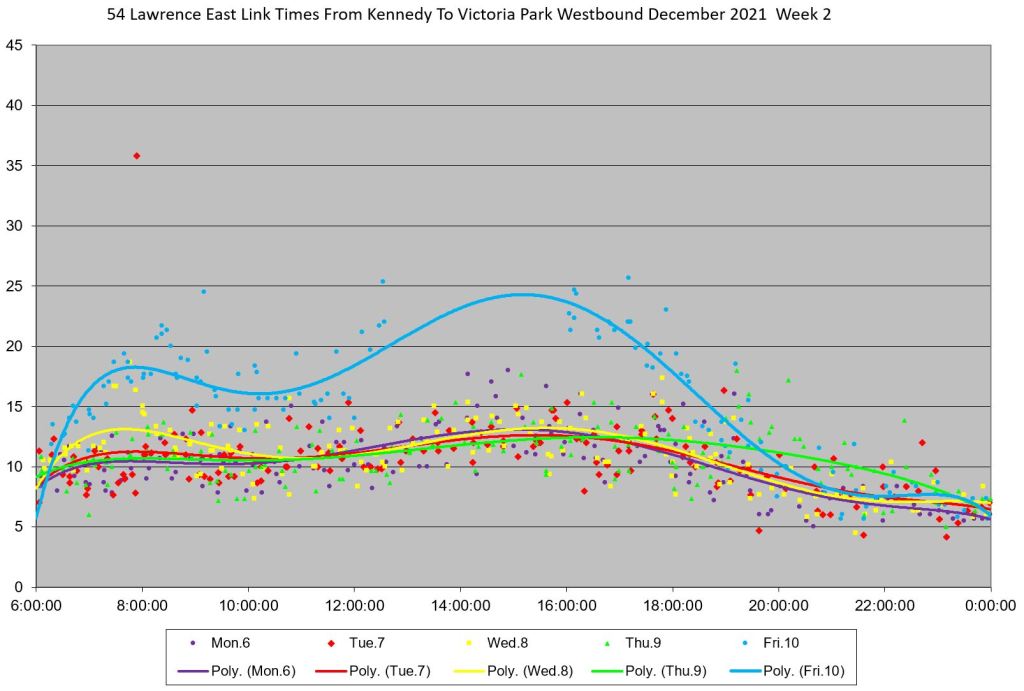
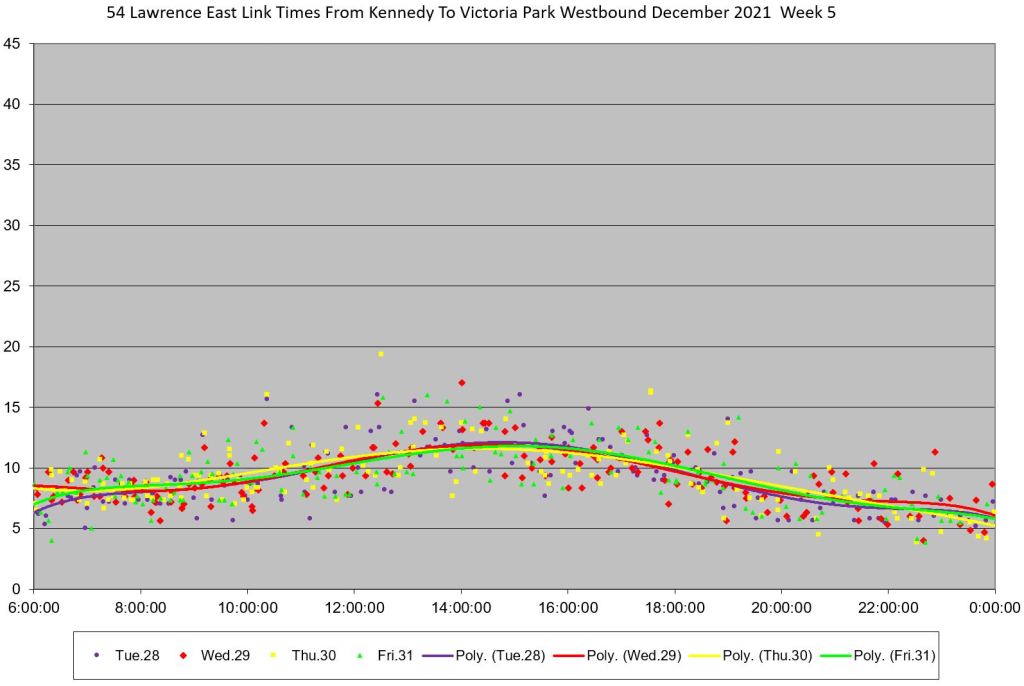
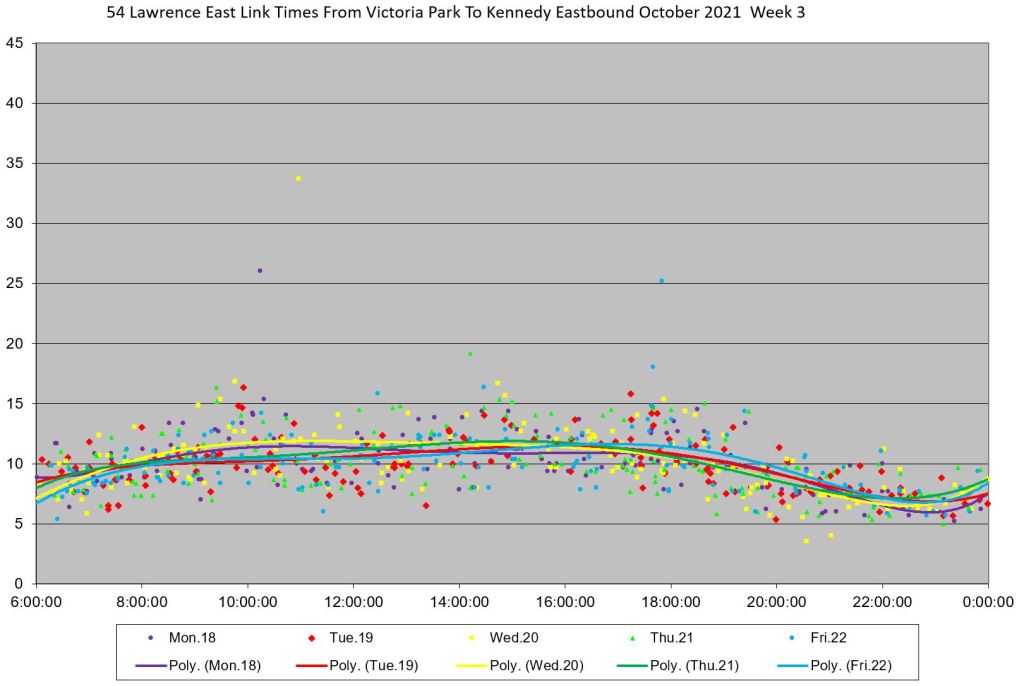
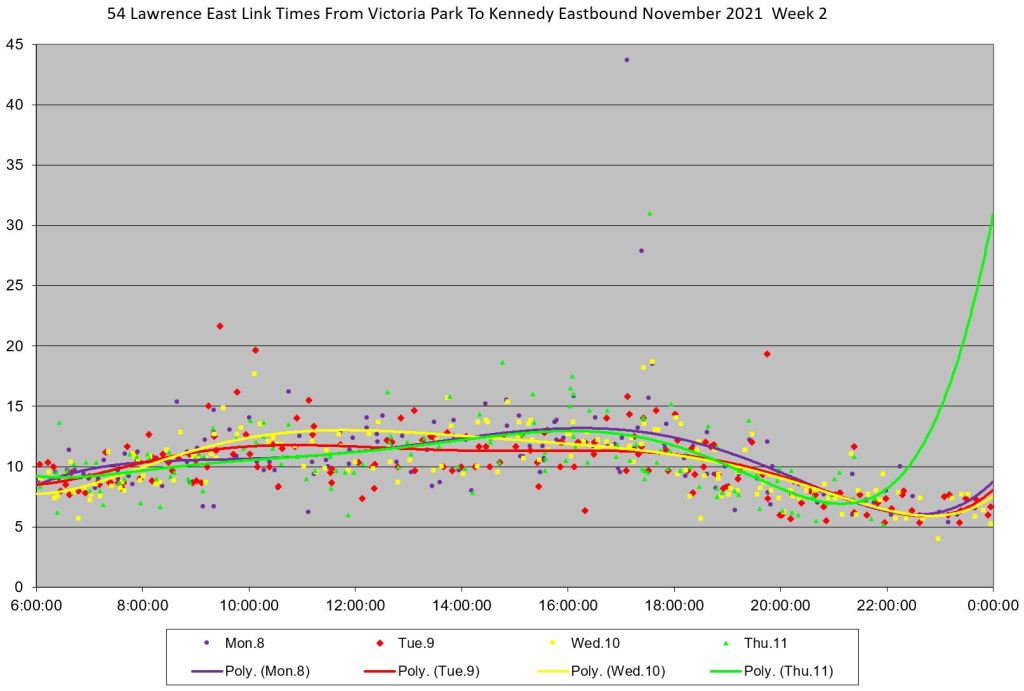
Kennedy to Victoria Park Westbound
Travel time behaviour between Kennedy and Victoria Park varies from week to week as shown in the average values which do not sit tightly along the same lines in October and November, and the higher SD values in weeks where the averages pull away from the pack.
Note: On December 10, there was a combination of missing data and severe congestion westbound to Victoria Park. This causes the trend line for that segment to ride well above other days in that week.
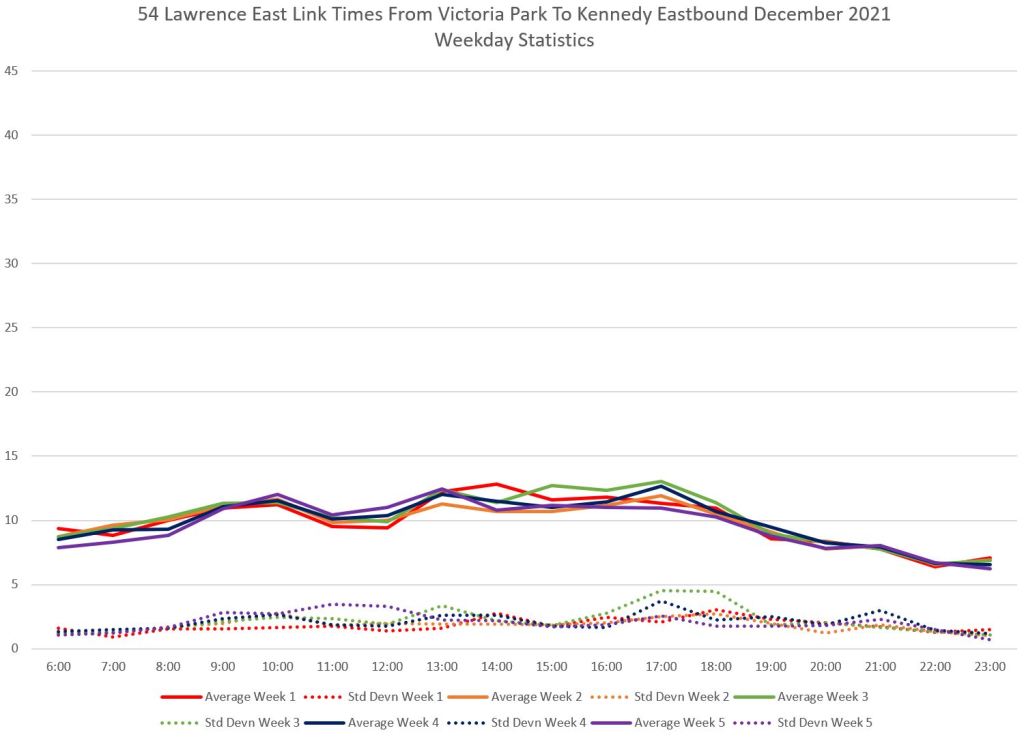
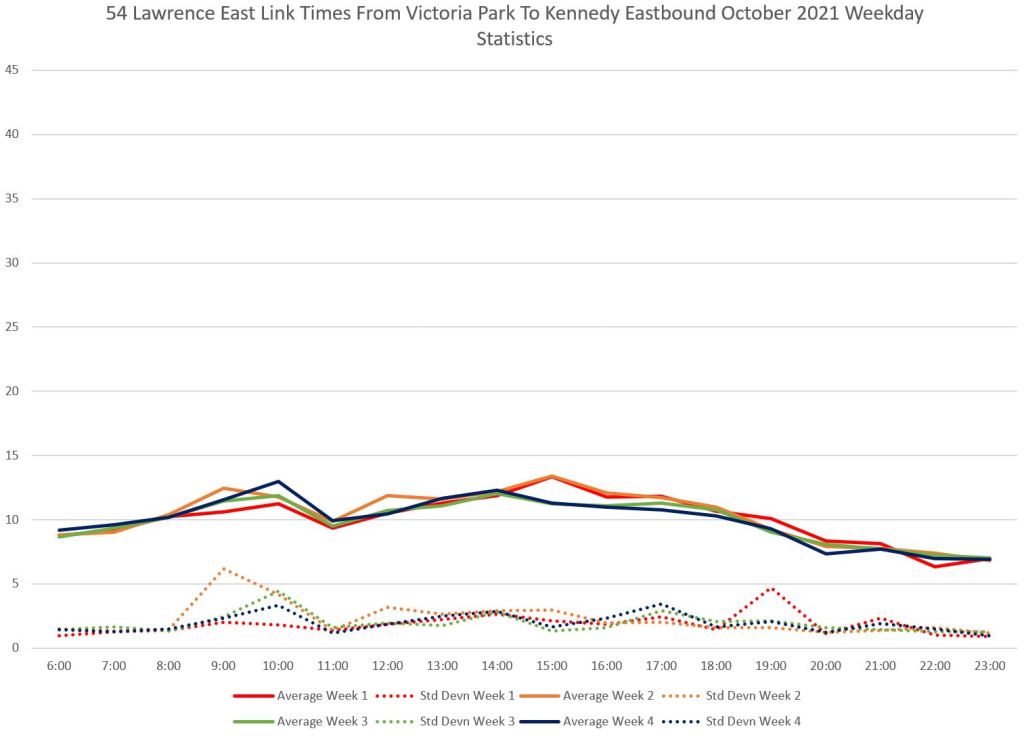
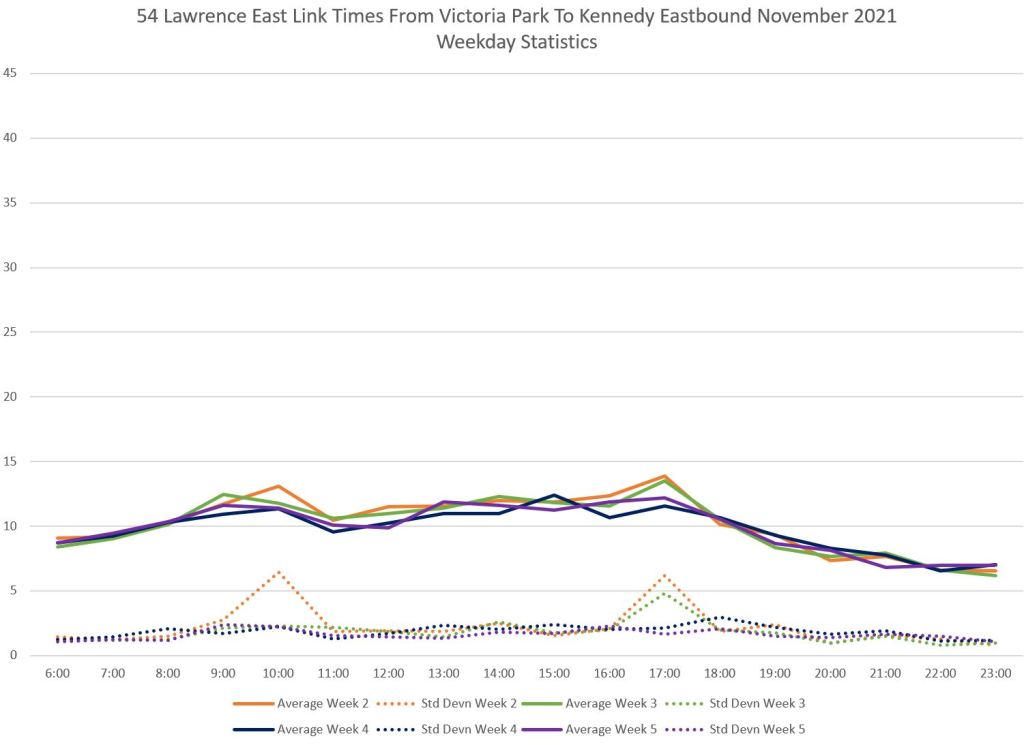
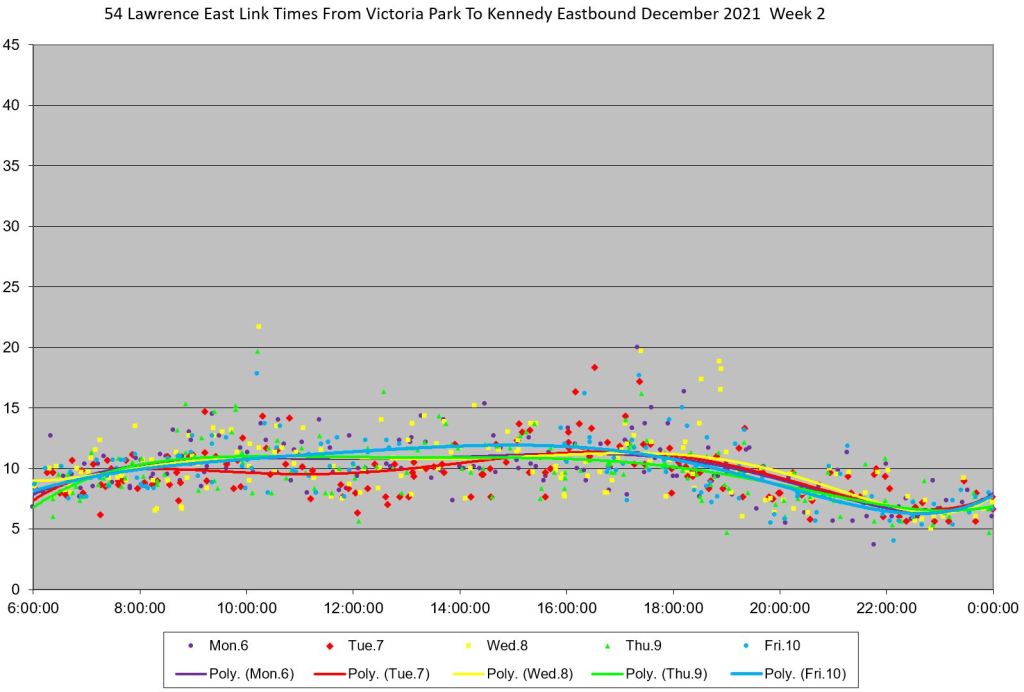
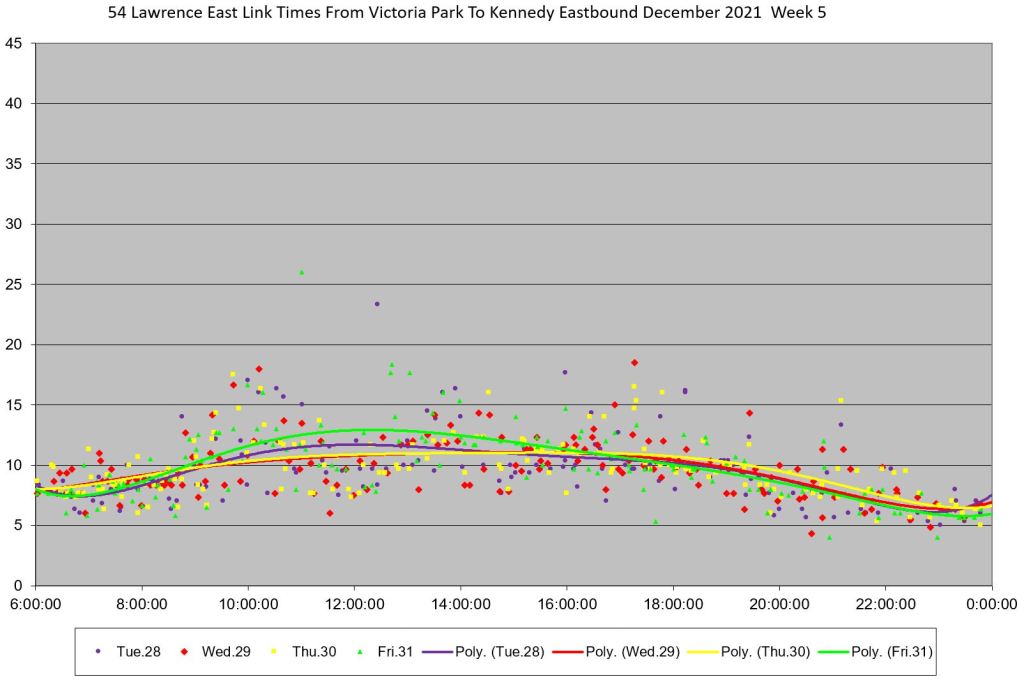
Victoria Park to Kennedy Eastbound
Eastbound data between Victoria Park and Kennedy do not show the same disruption as westbound data.

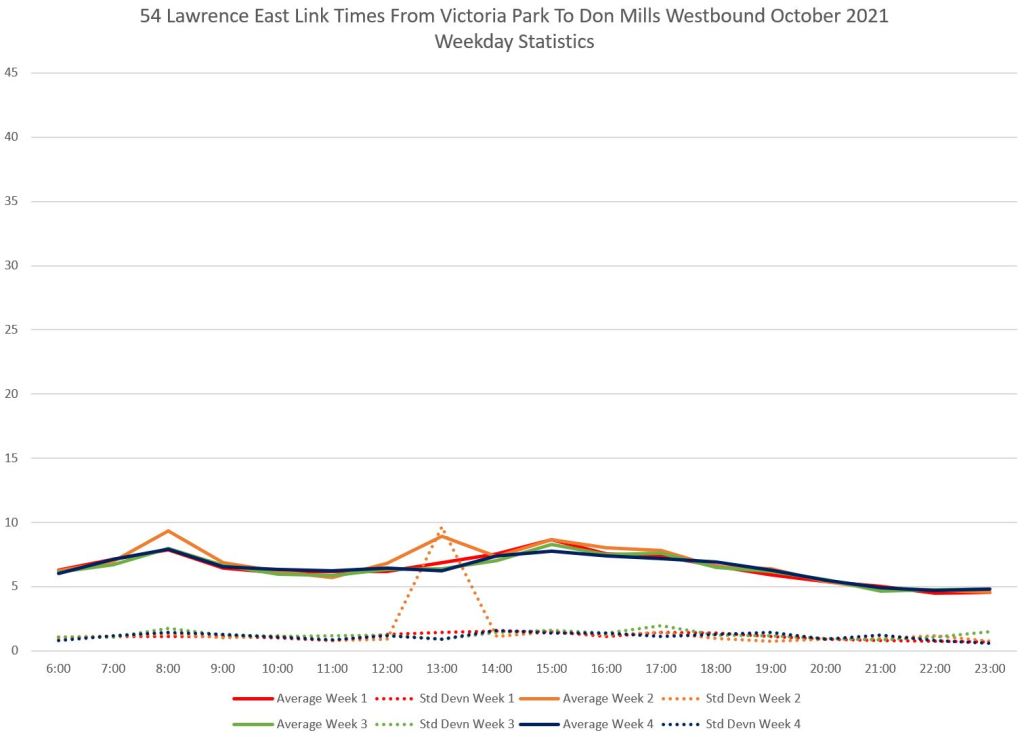
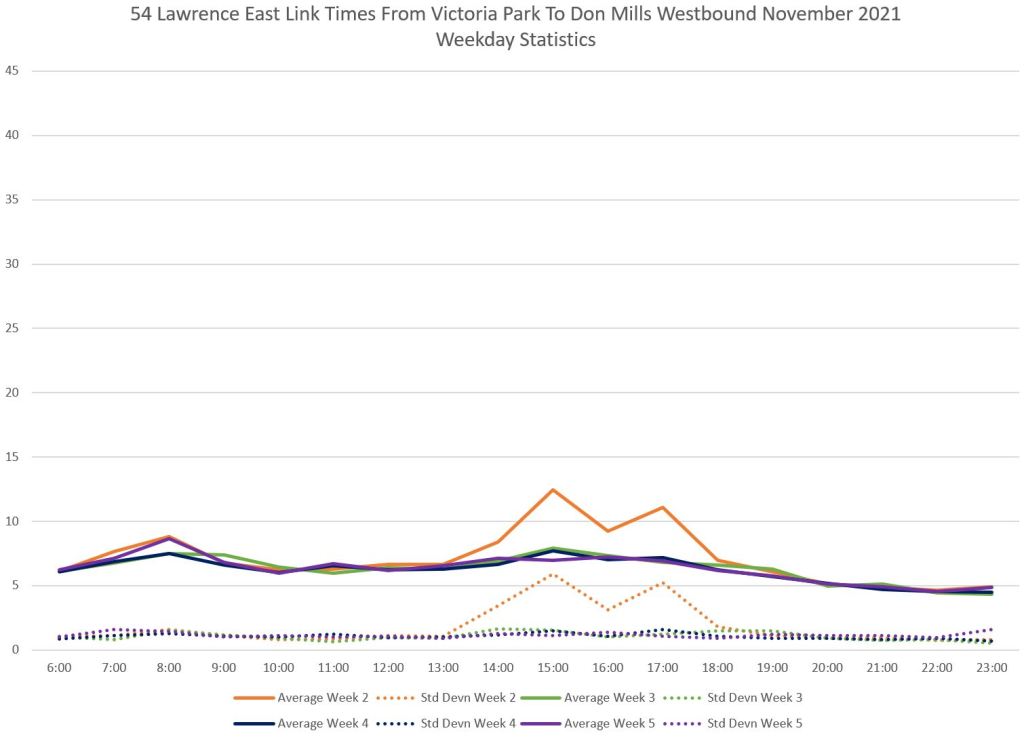
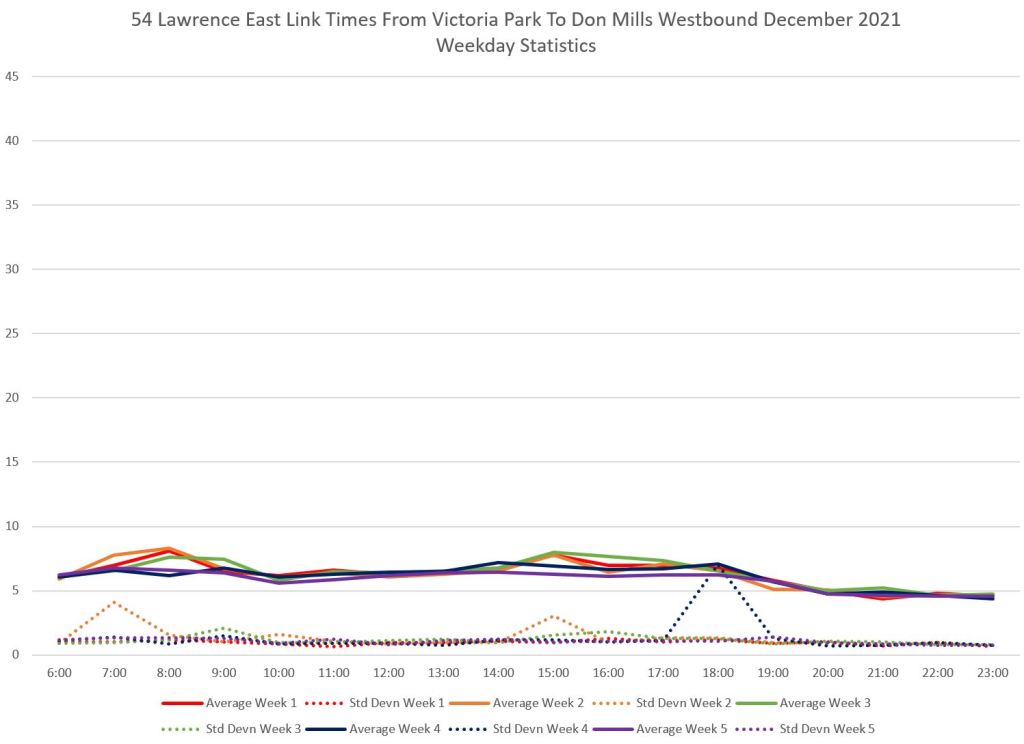
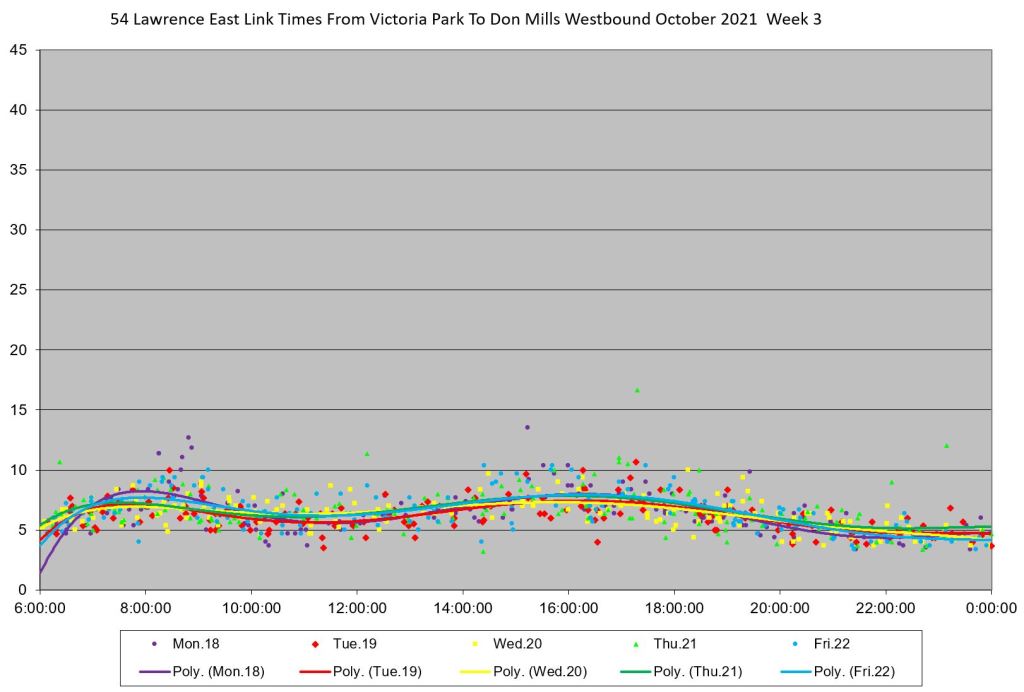
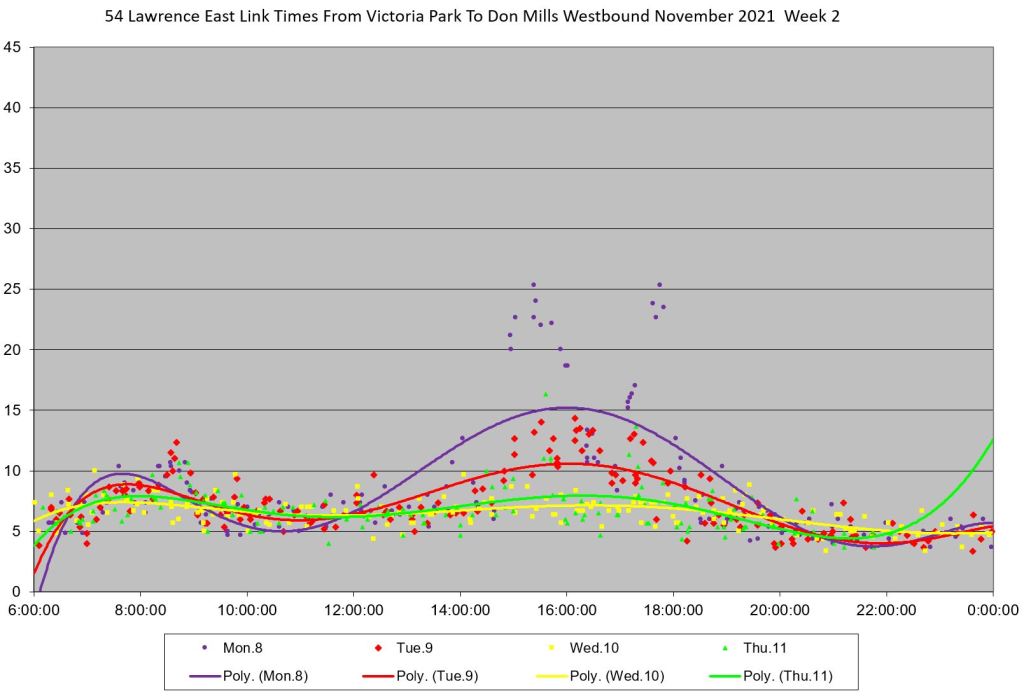
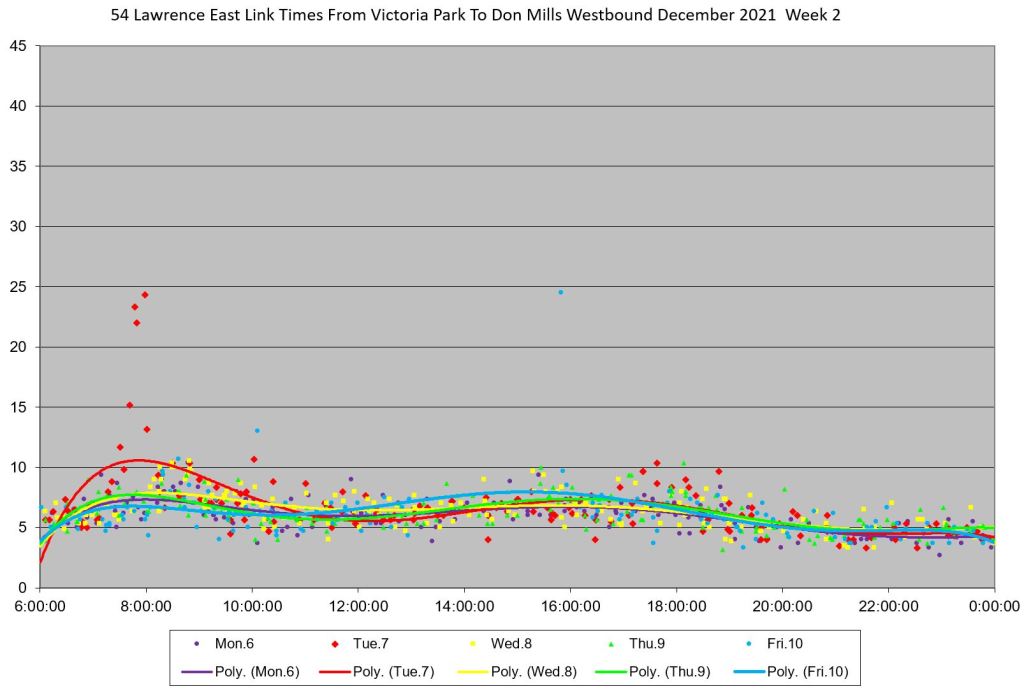
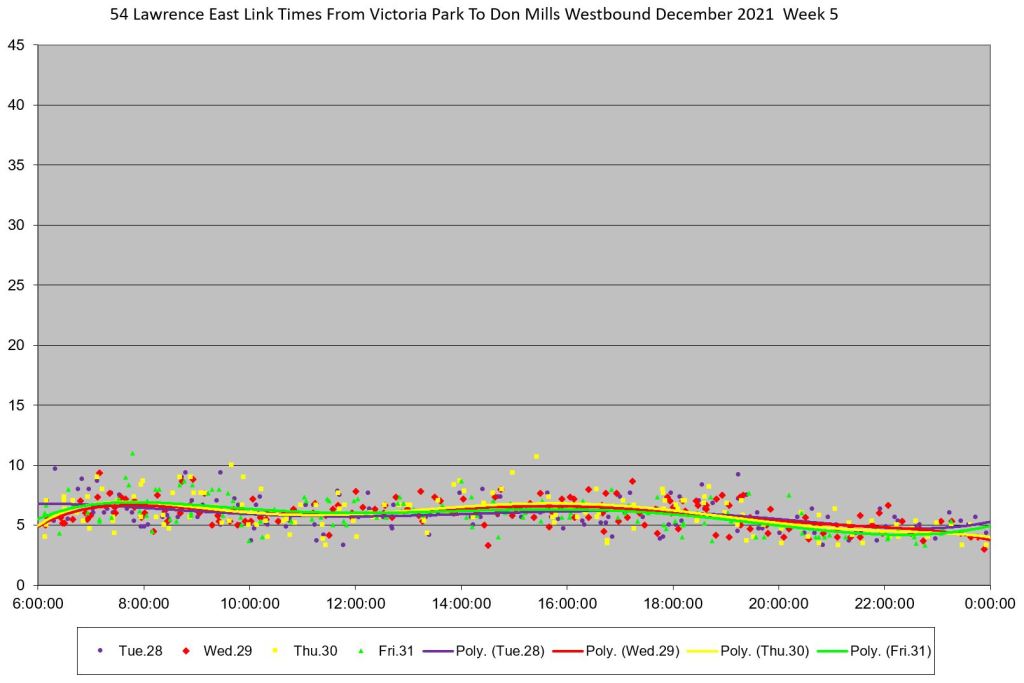
Victoria Park to Don Mills Westbound
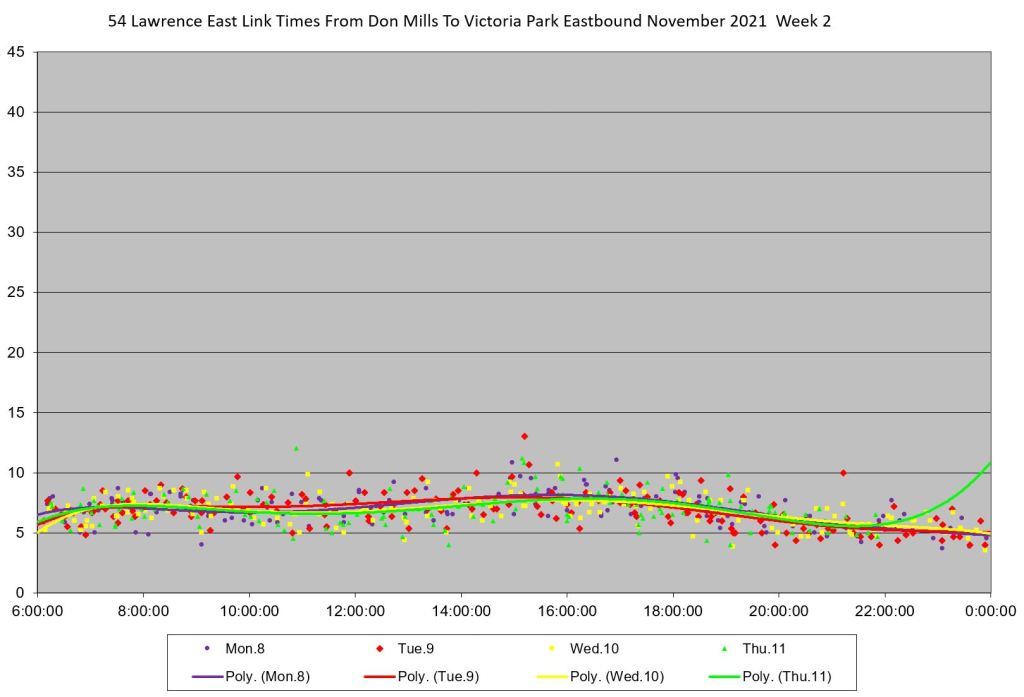
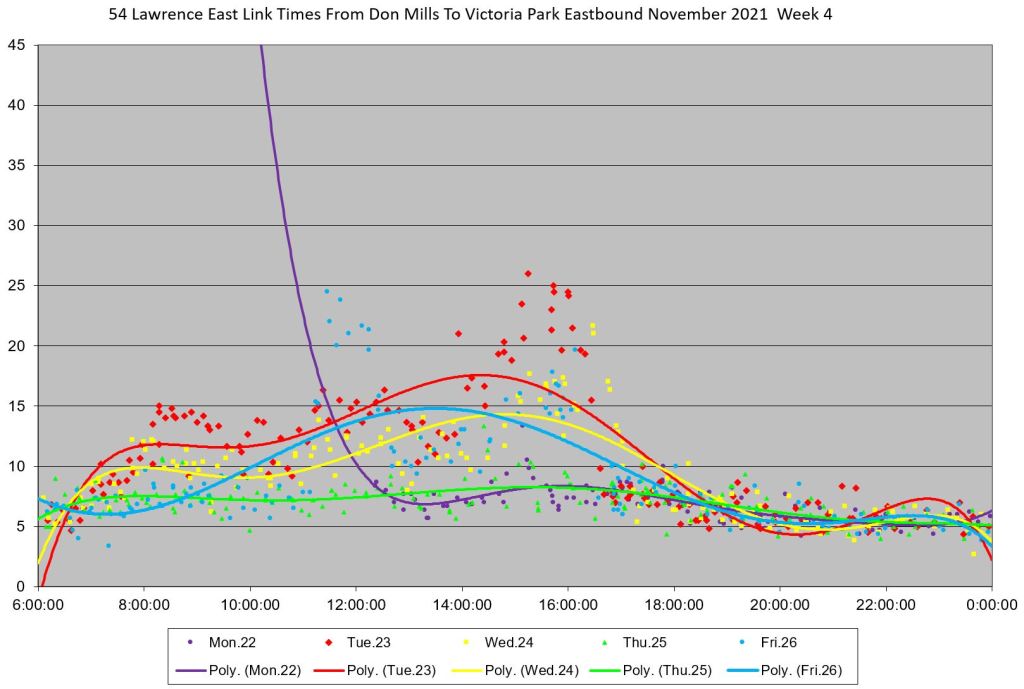
From Victoria Park to Don Mills westbound, the travel times are, with a few exceptions very similar with only a slight hint that peaks even exist. There is a bulge in travel times in November Week 2 that is echoed in eastbound data in Week 4.
Note that the trend line for Monday, November 22 swoops in from the top of the page because tracking data were not collected until mid-morning.
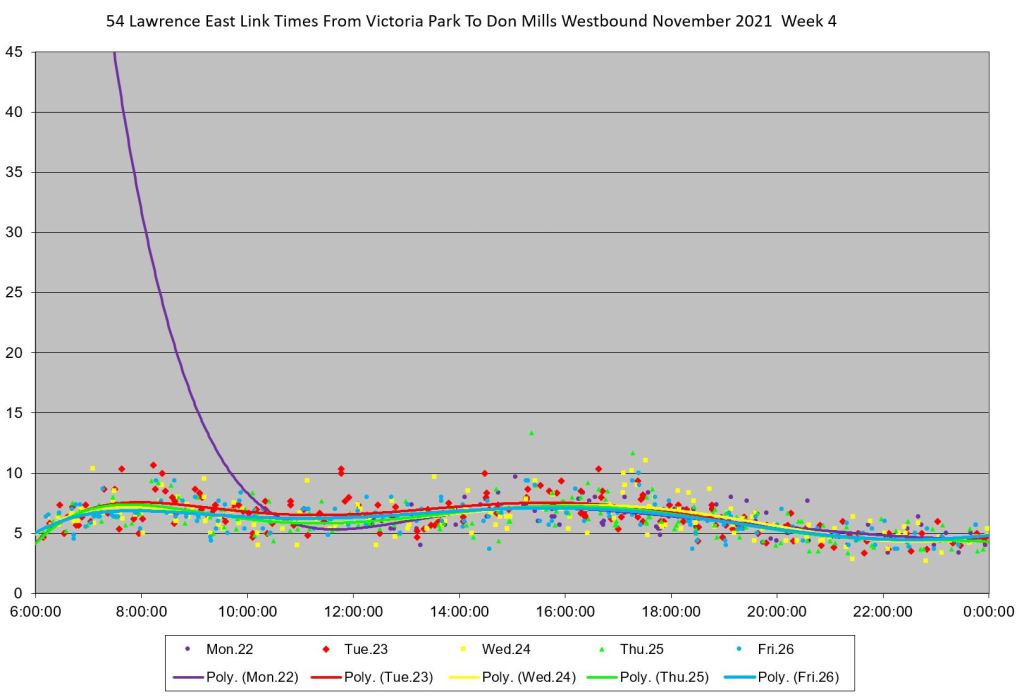
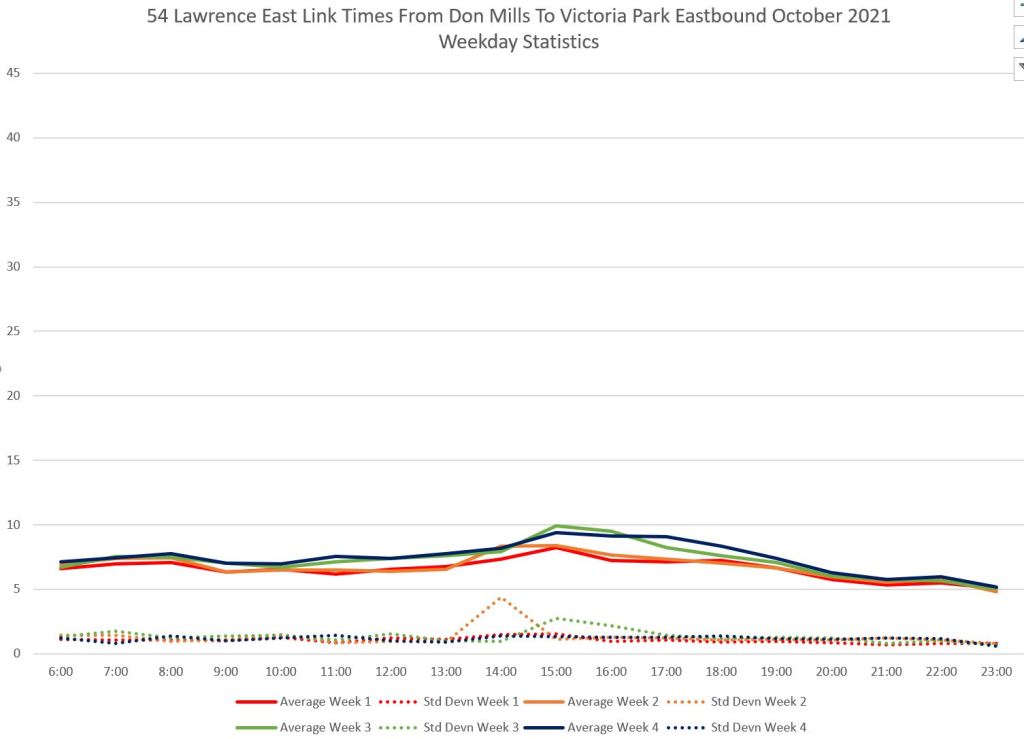
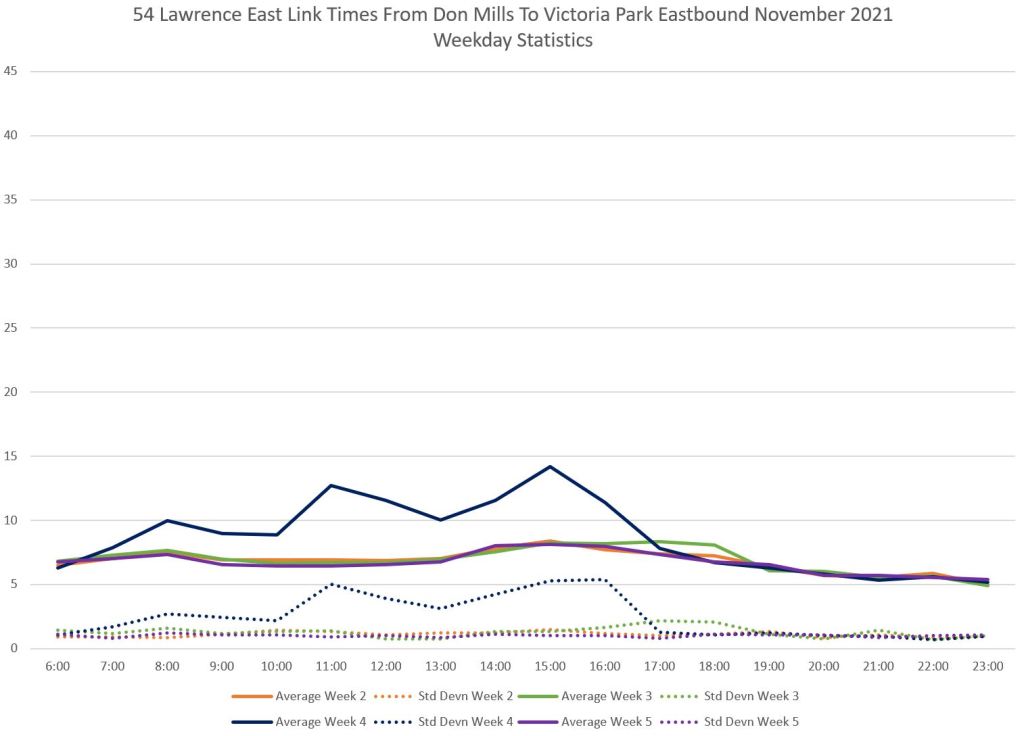
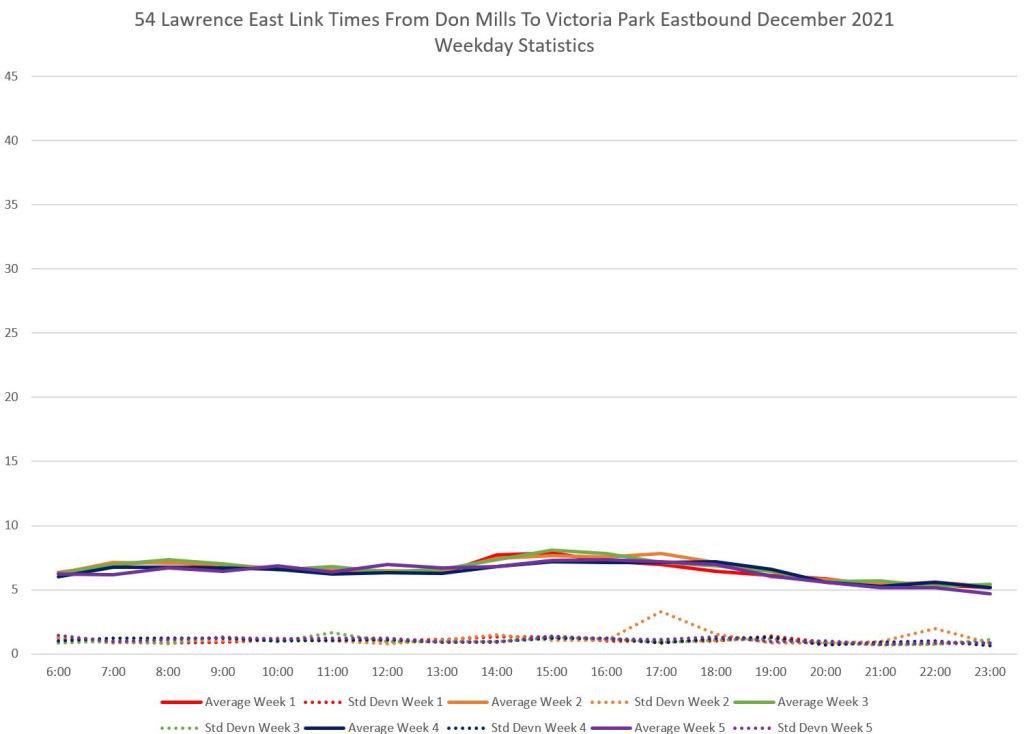
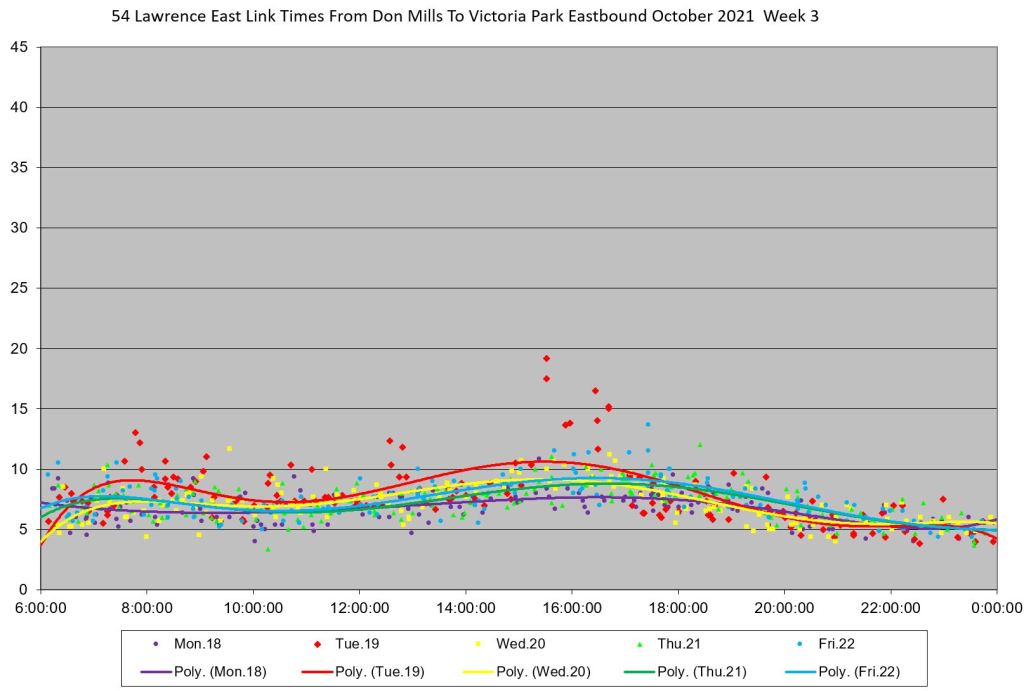
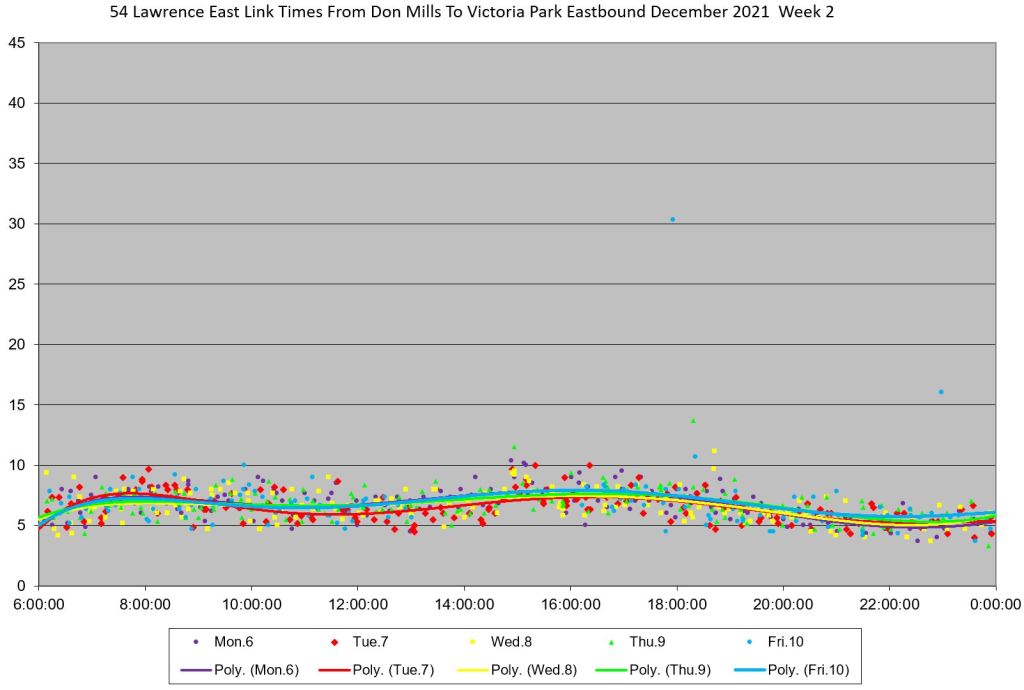
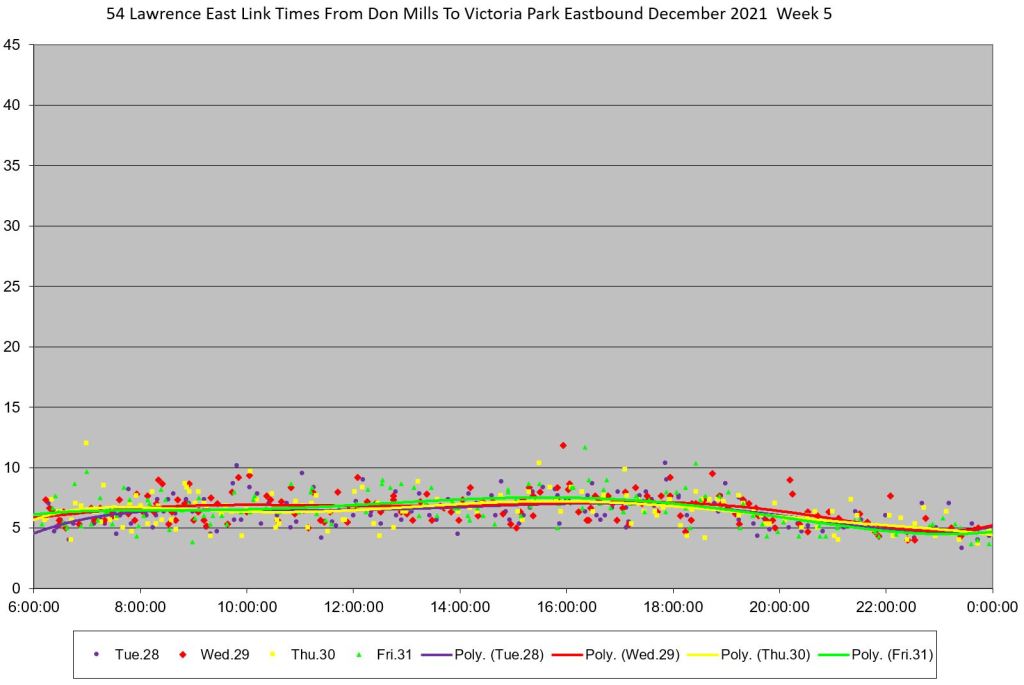
Don Mills to Victoria Park Eastbound
As with the westbound data, travel times eastbound from Don Mills to Victoria Park are quite uniform except for a disruption in week 4 of November.
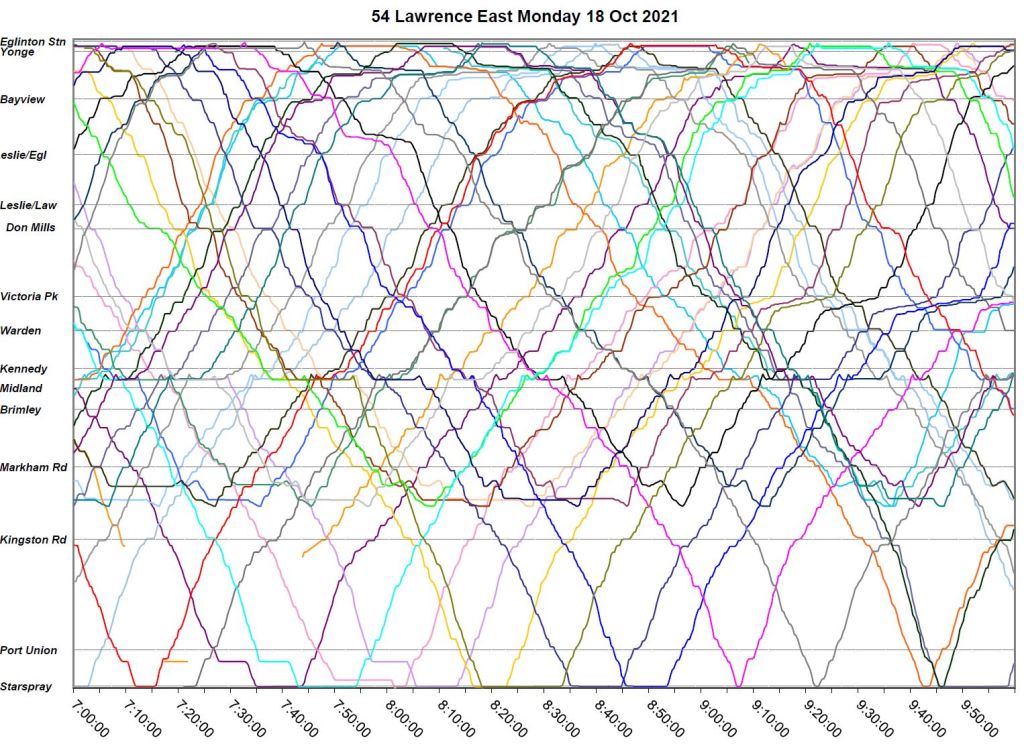
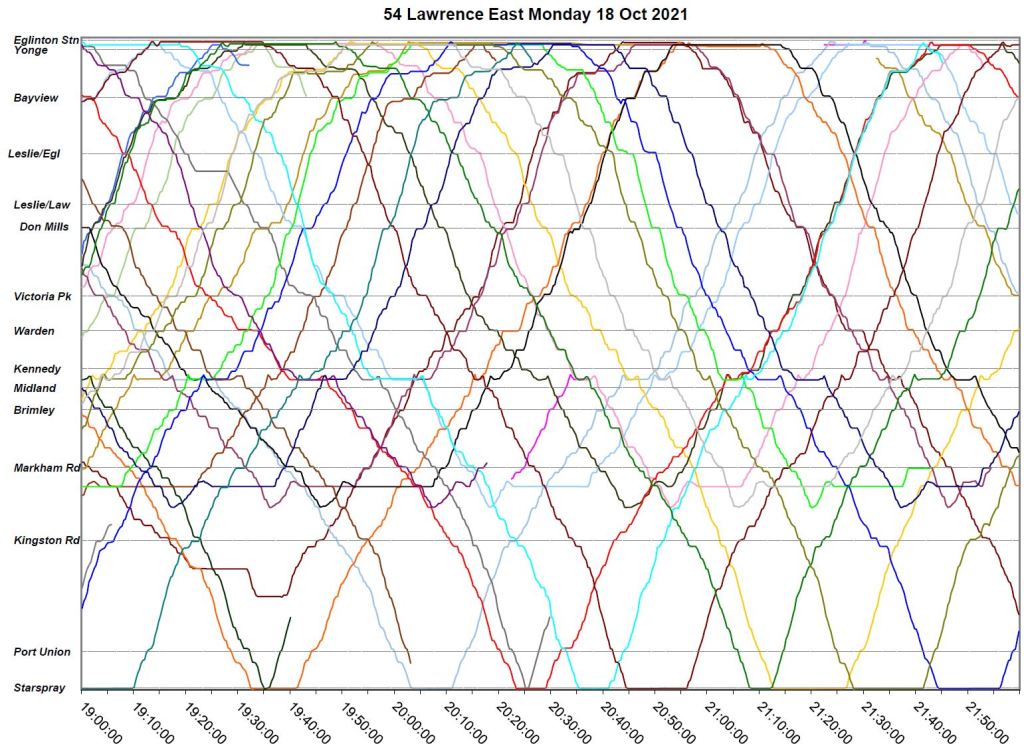
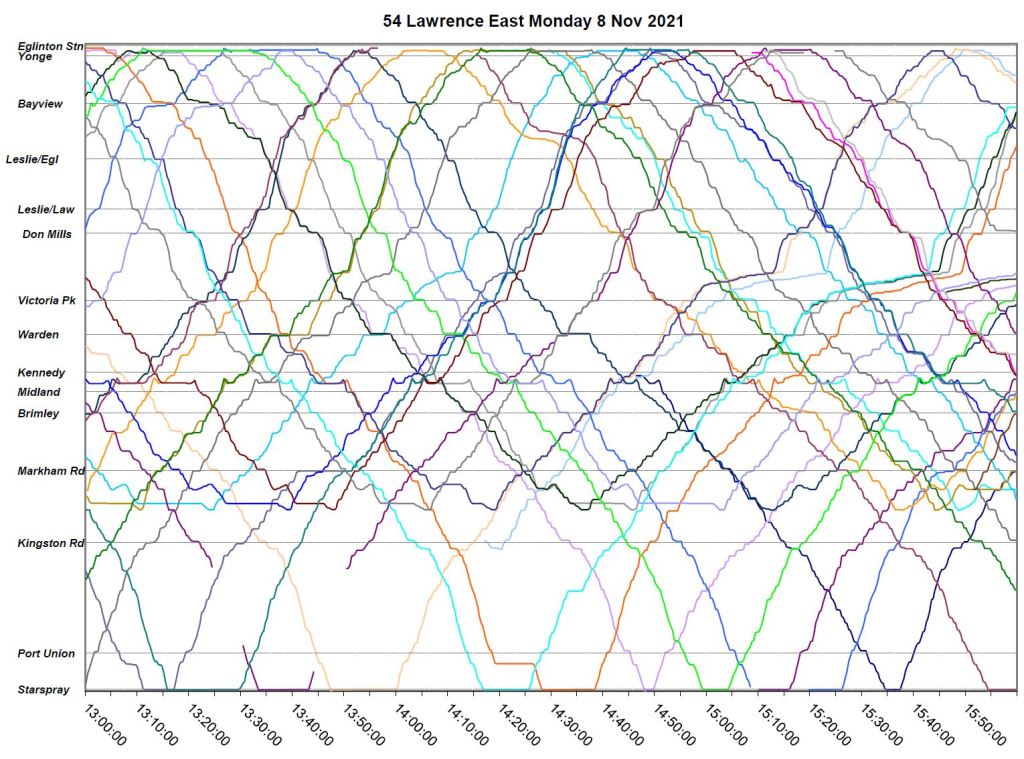
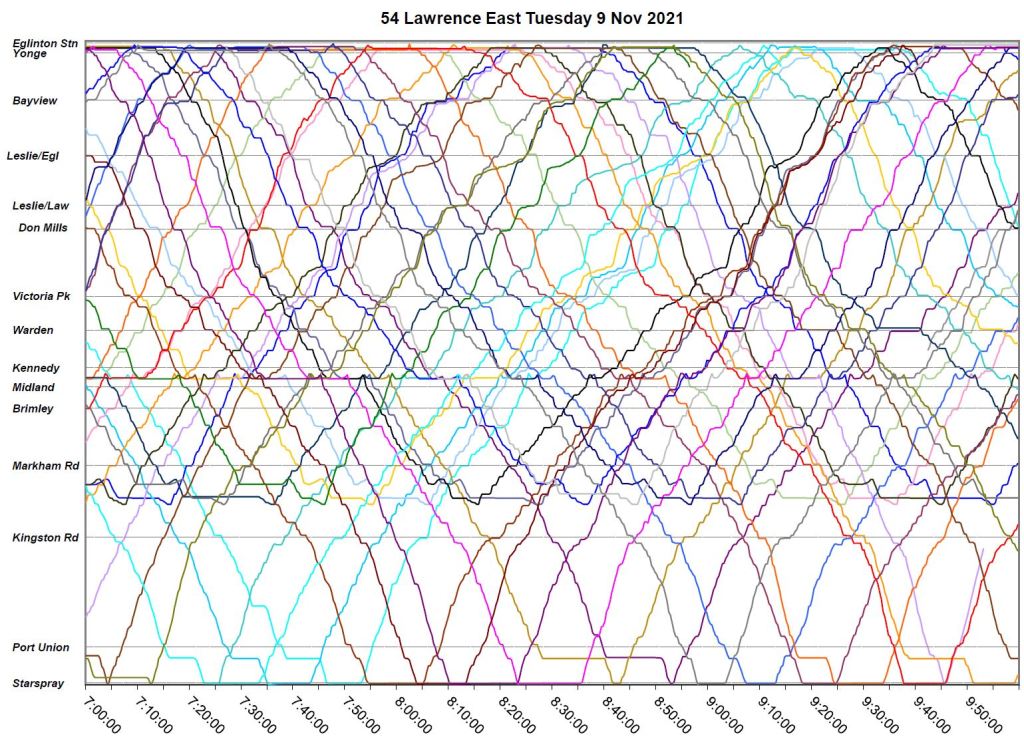
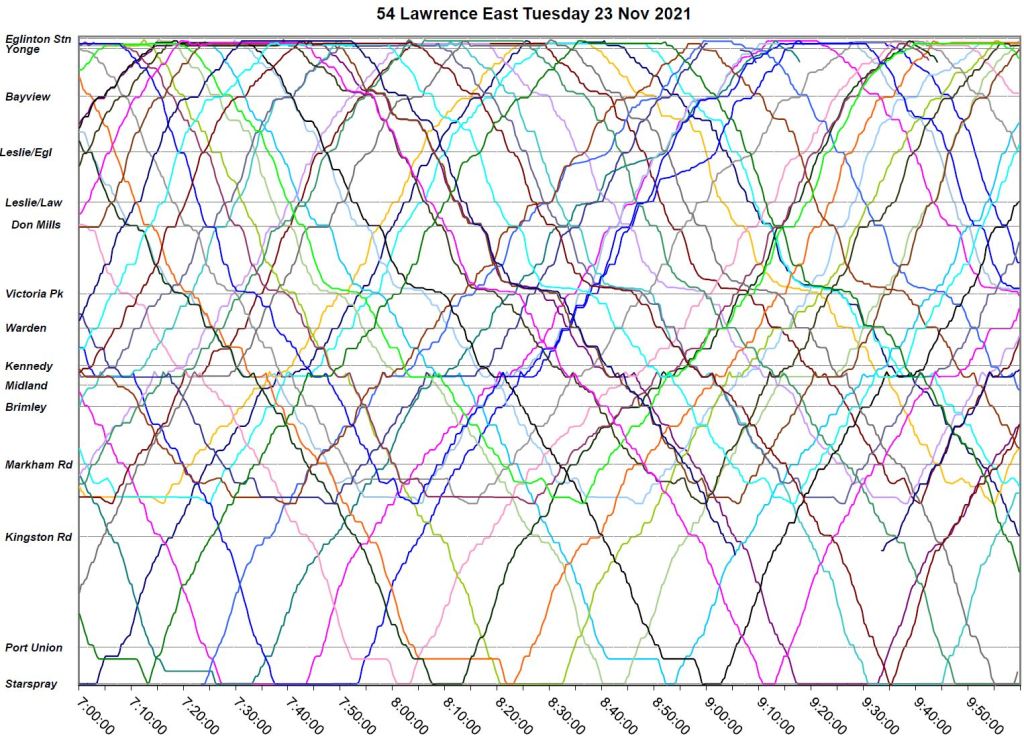
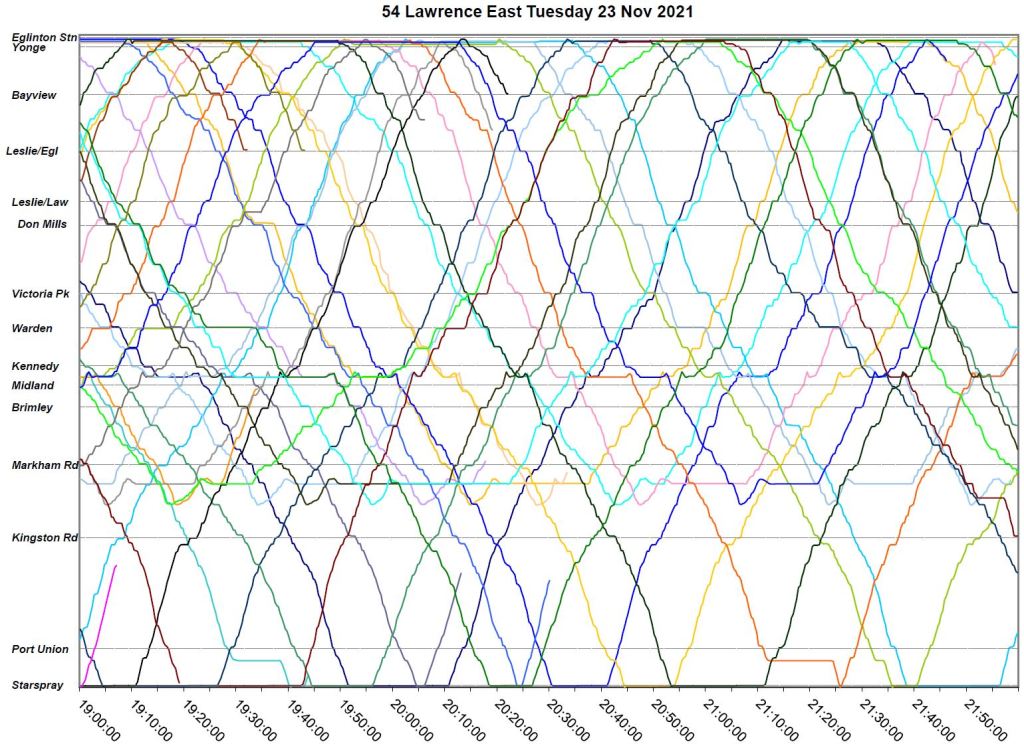
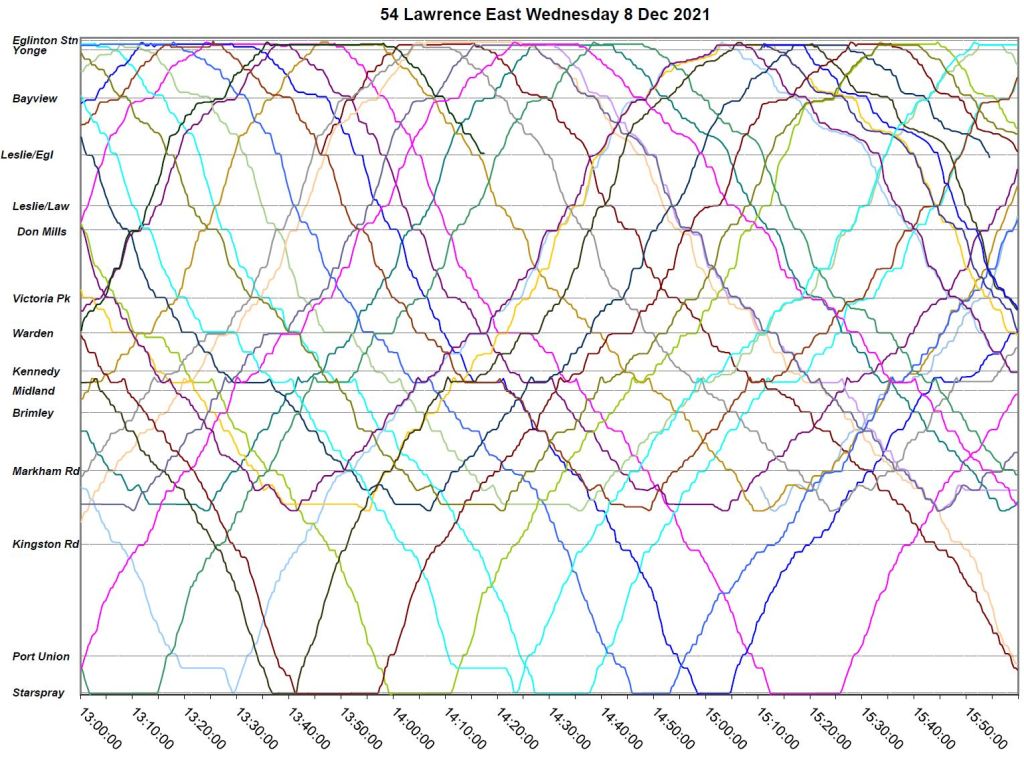
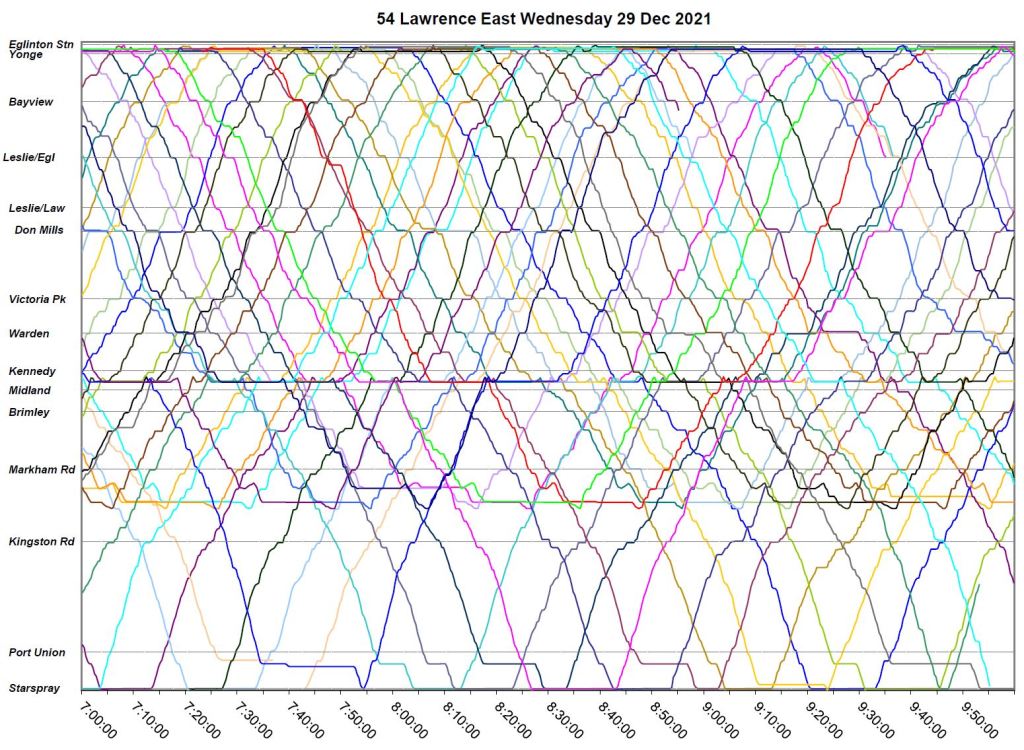
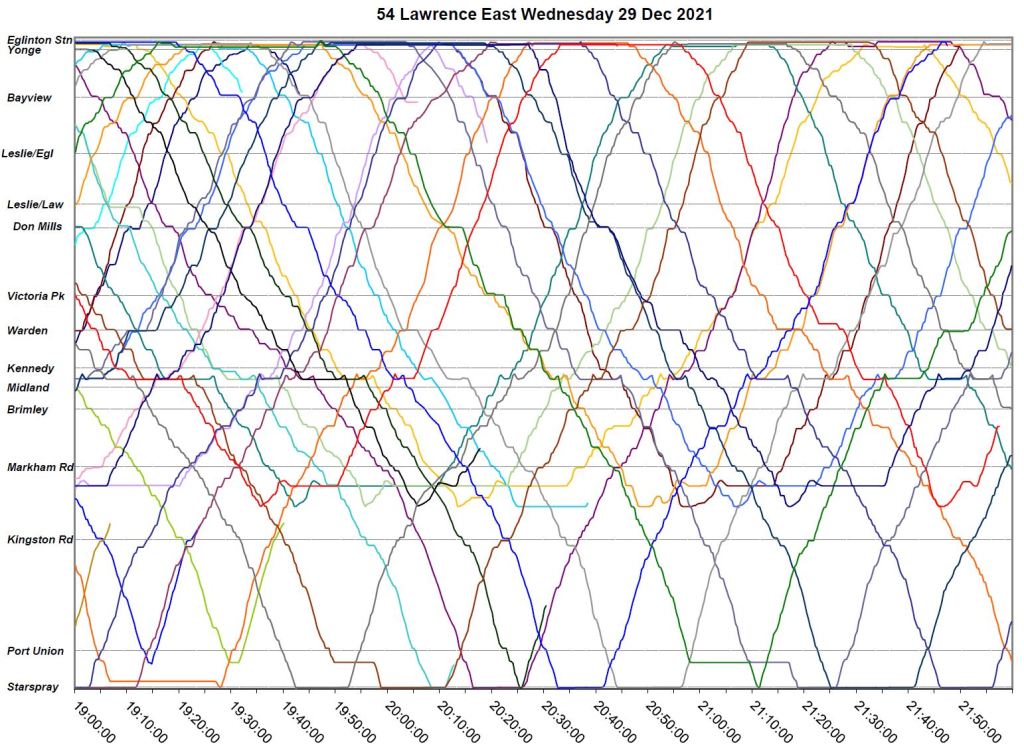
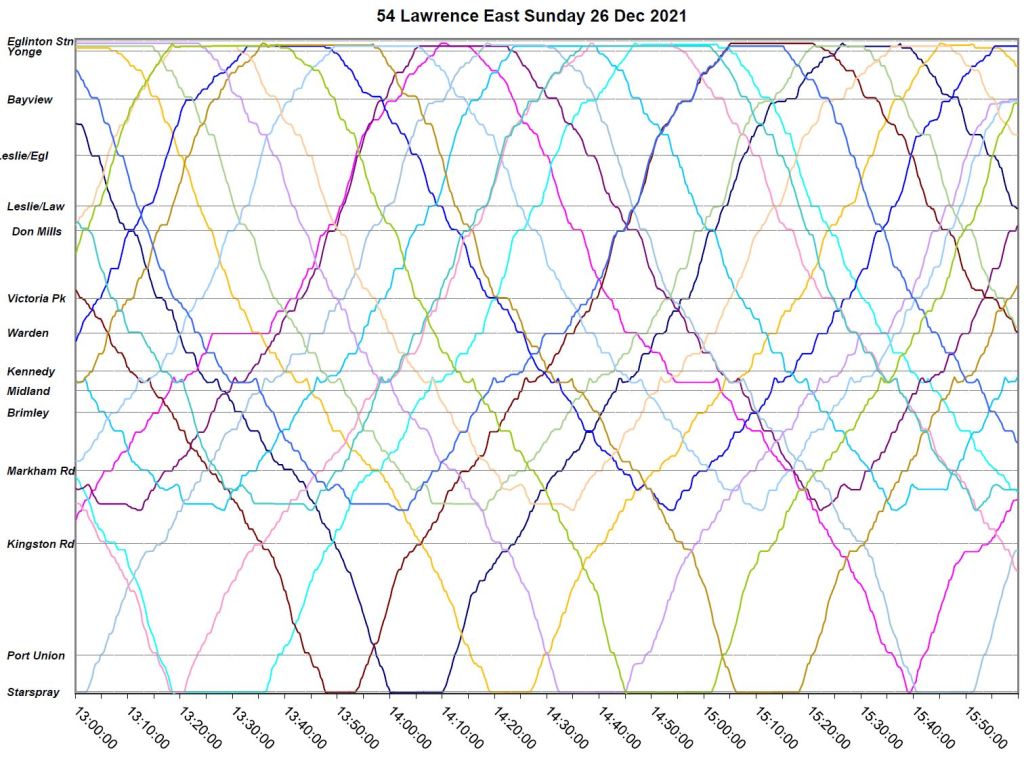
Detailed Operating Charts
This section contains detailed charts showing various days of interest through the three month period.
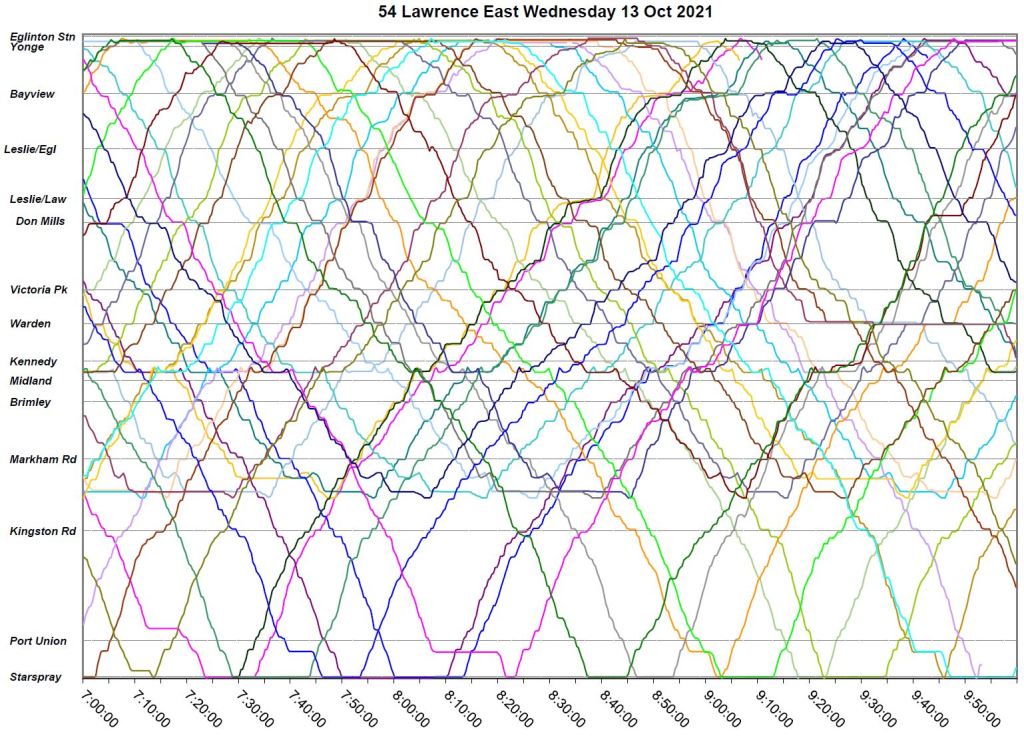
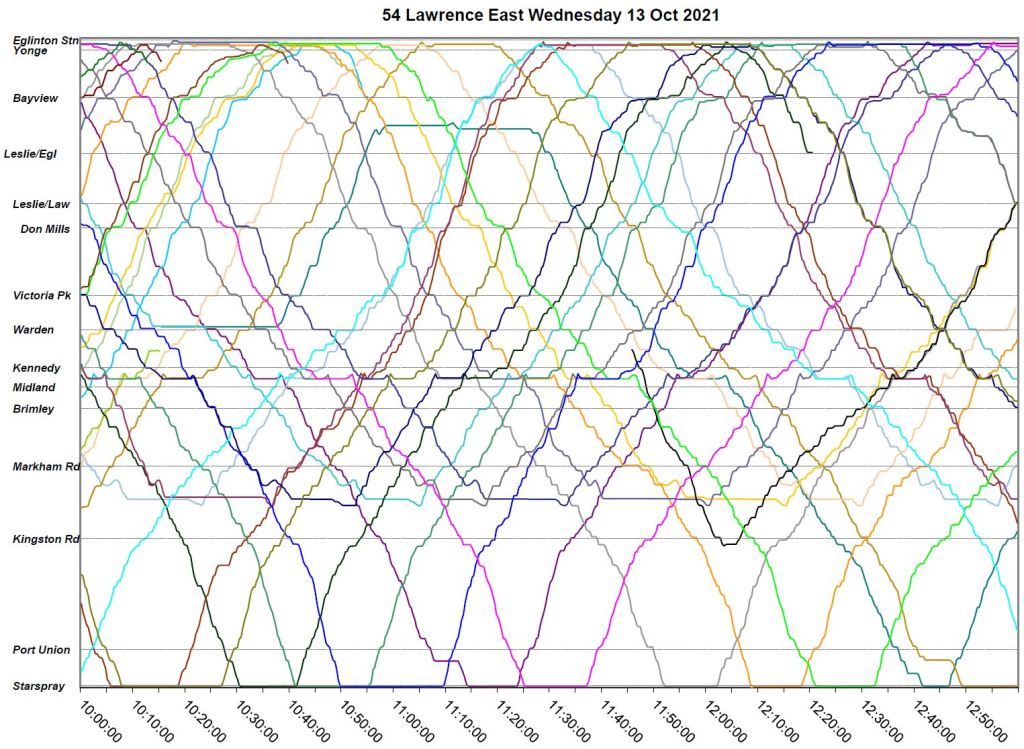
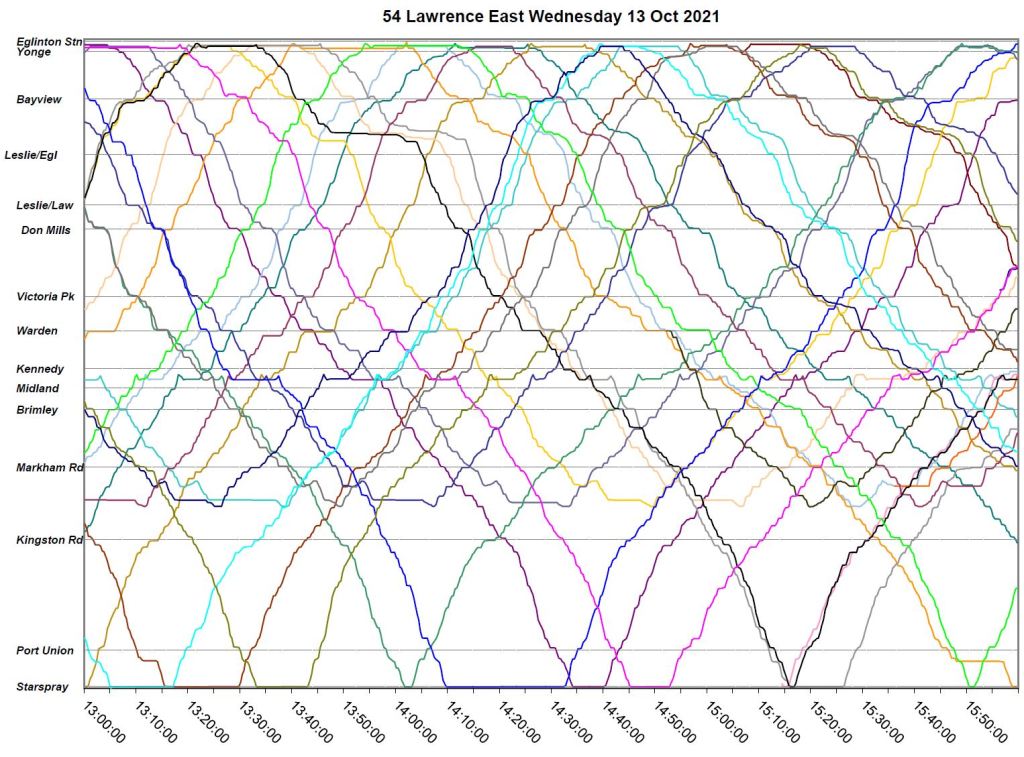
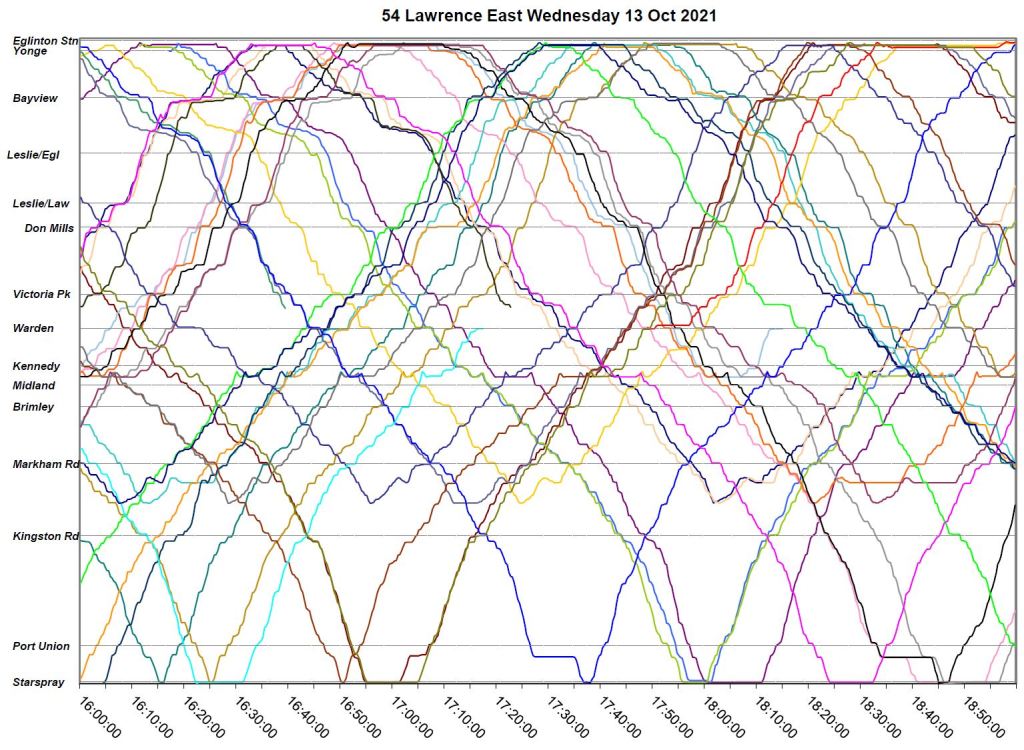
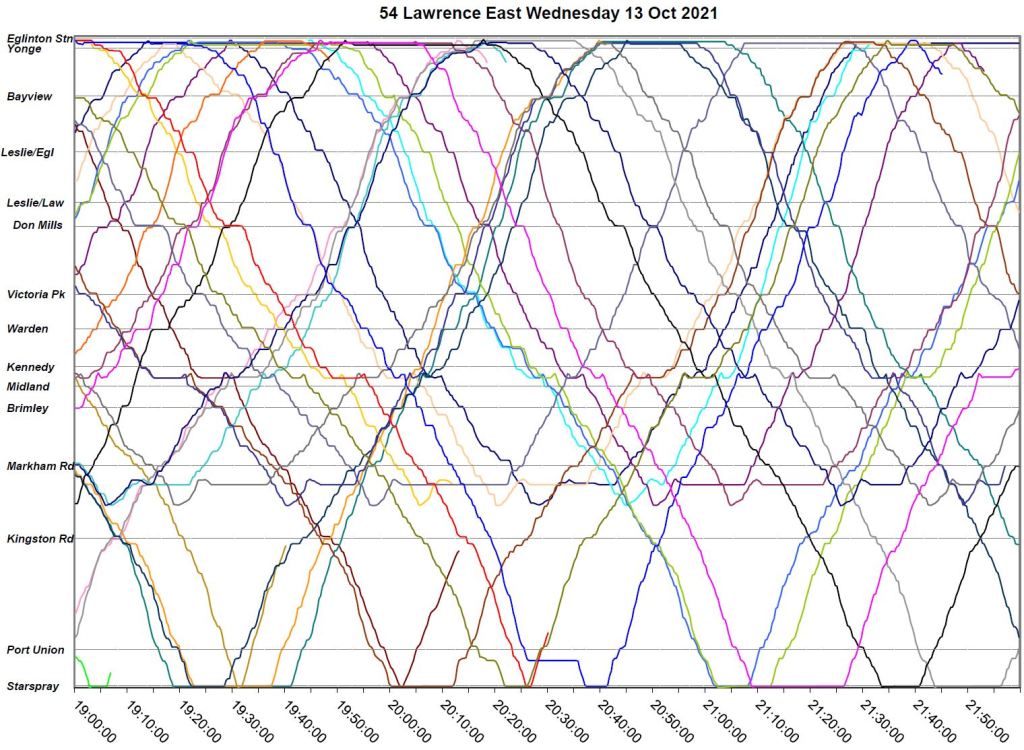
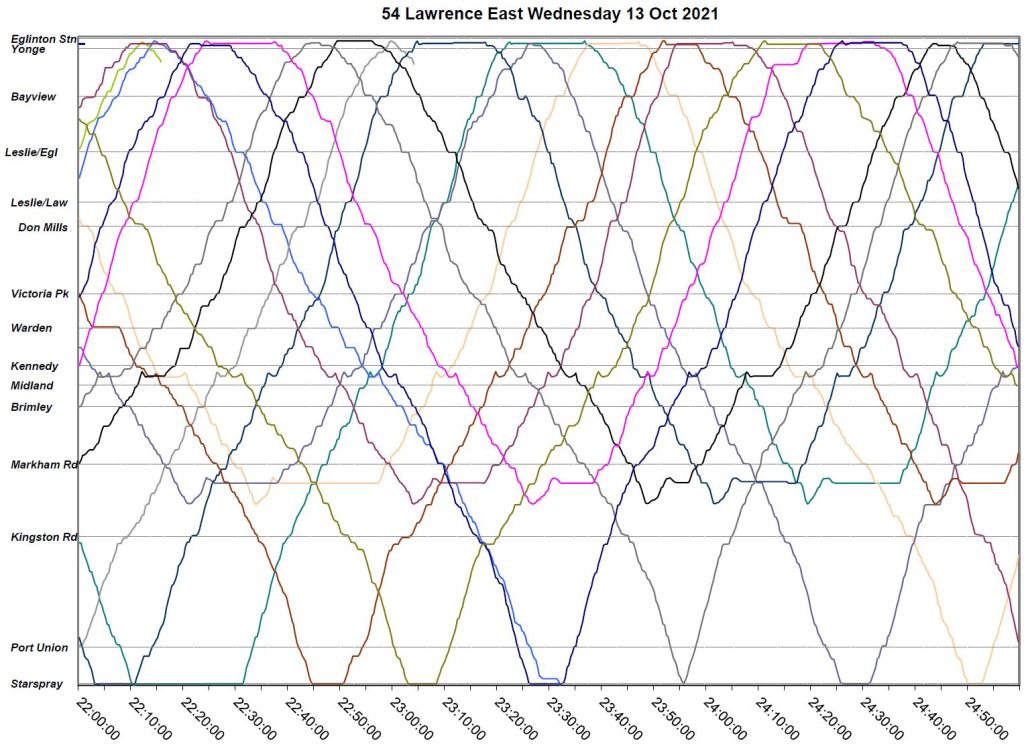
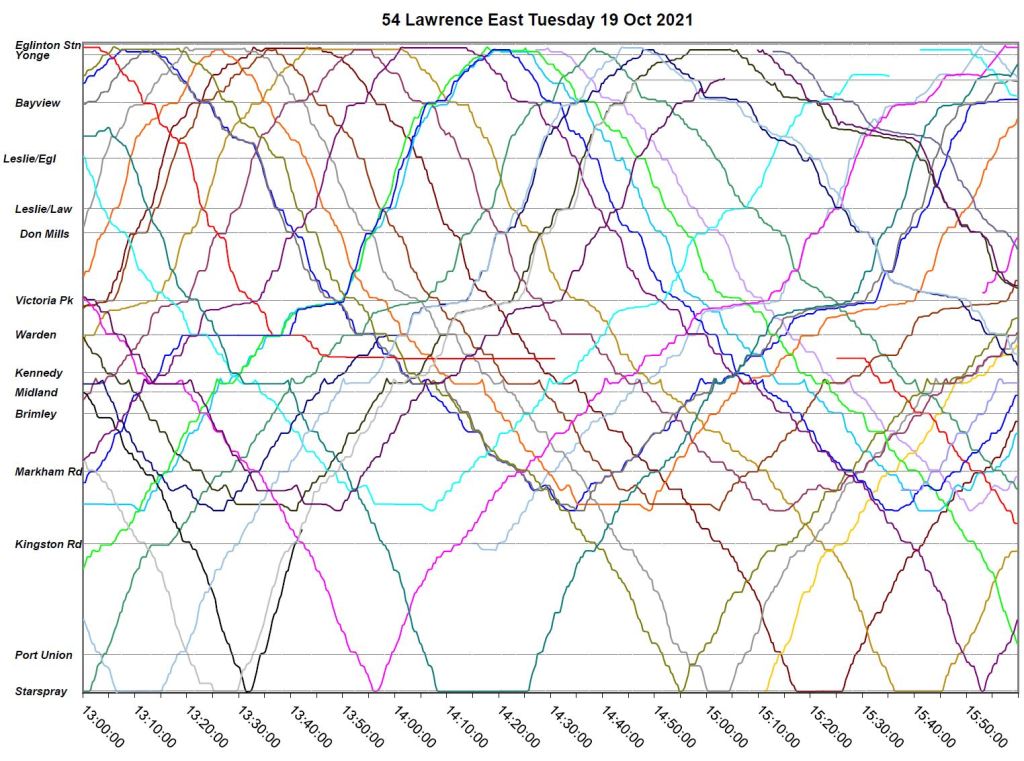
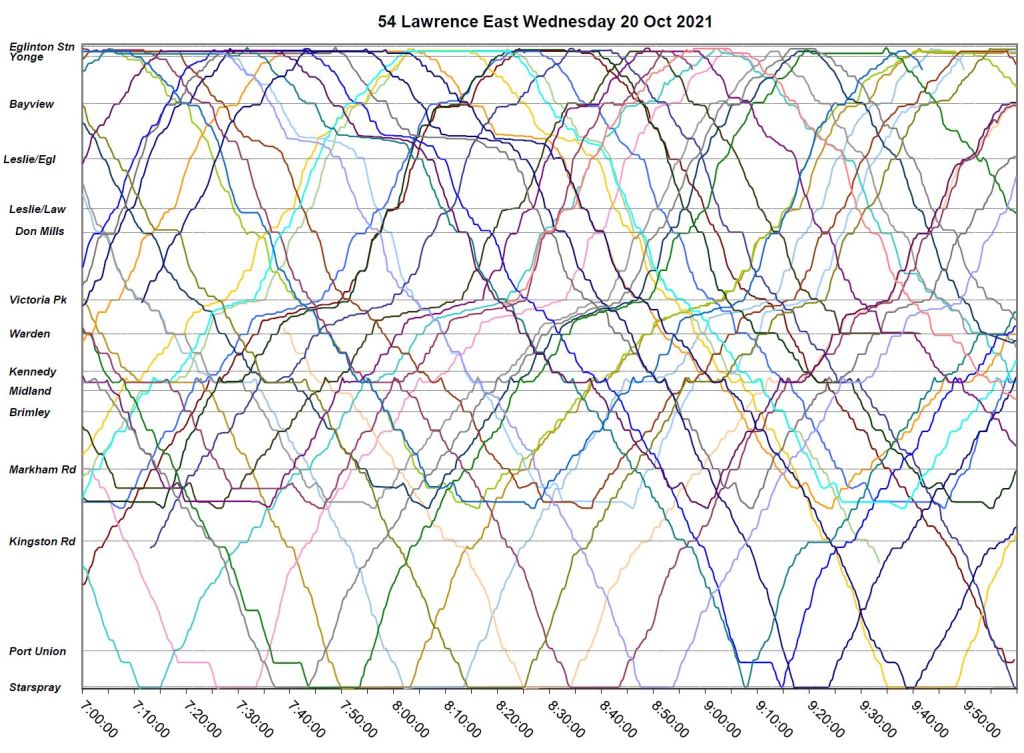
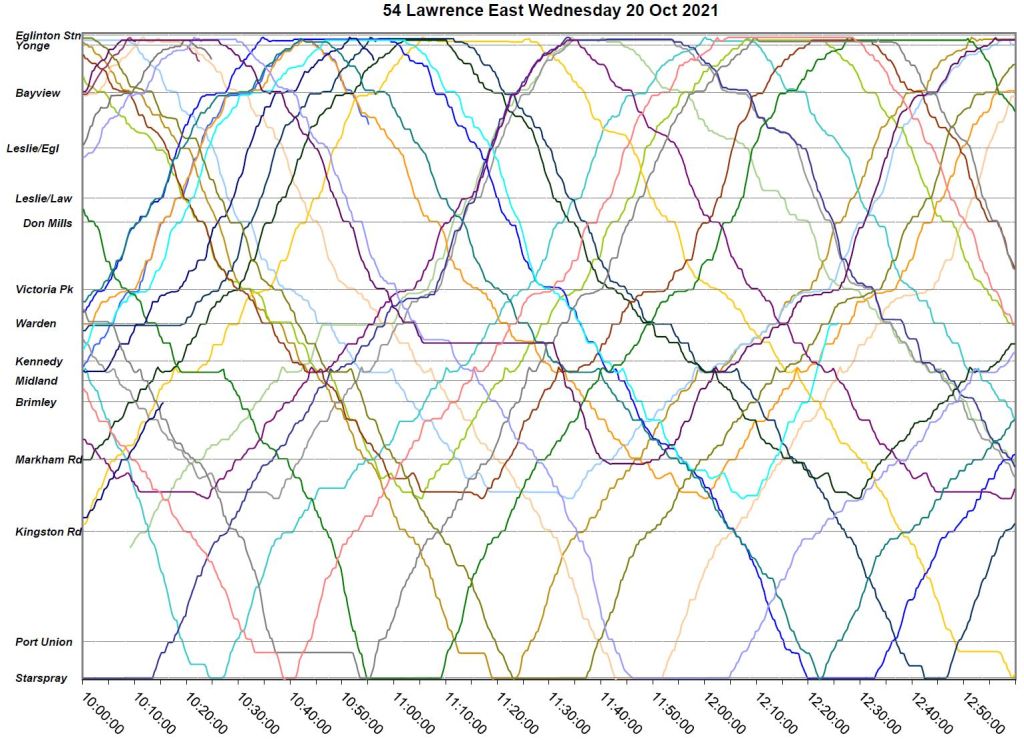
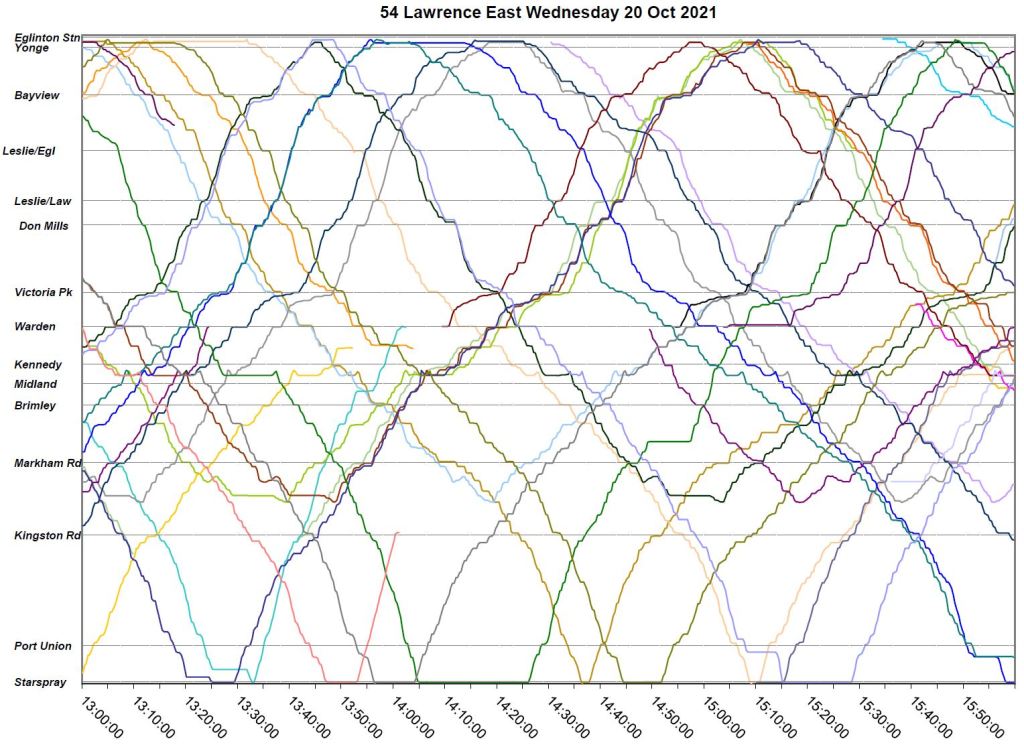
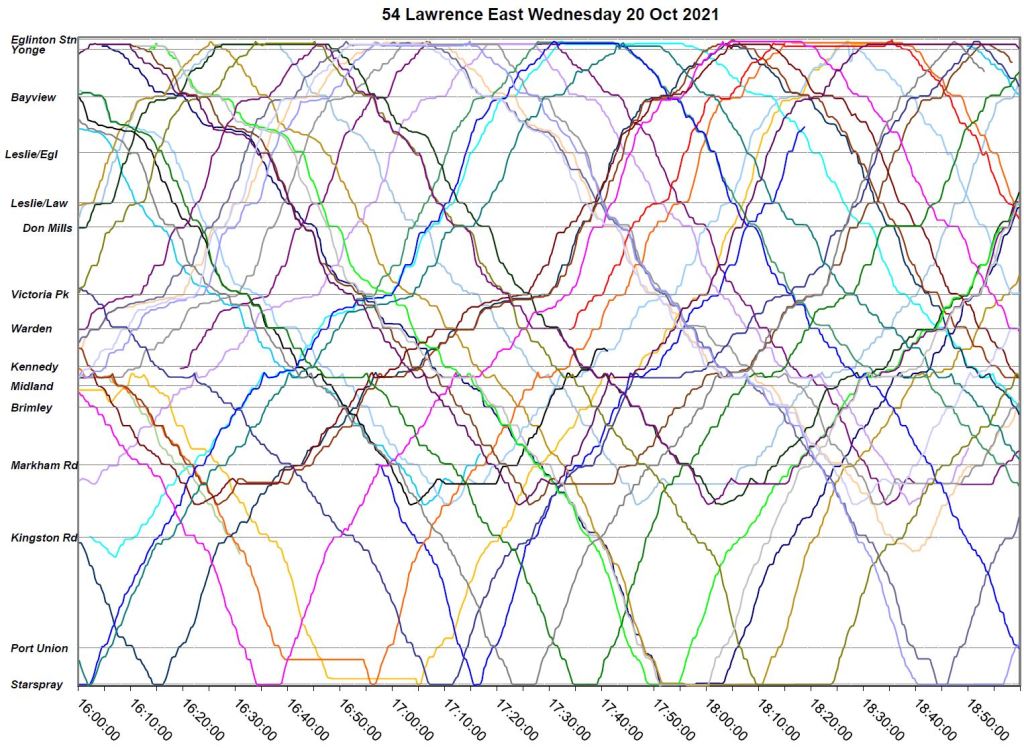
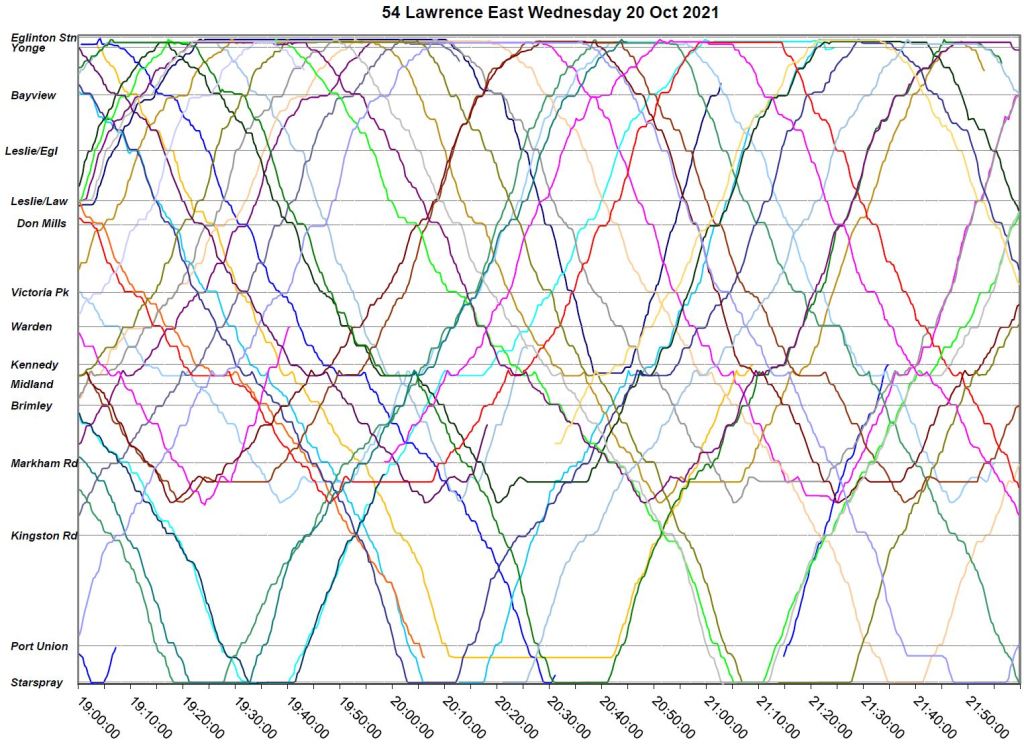
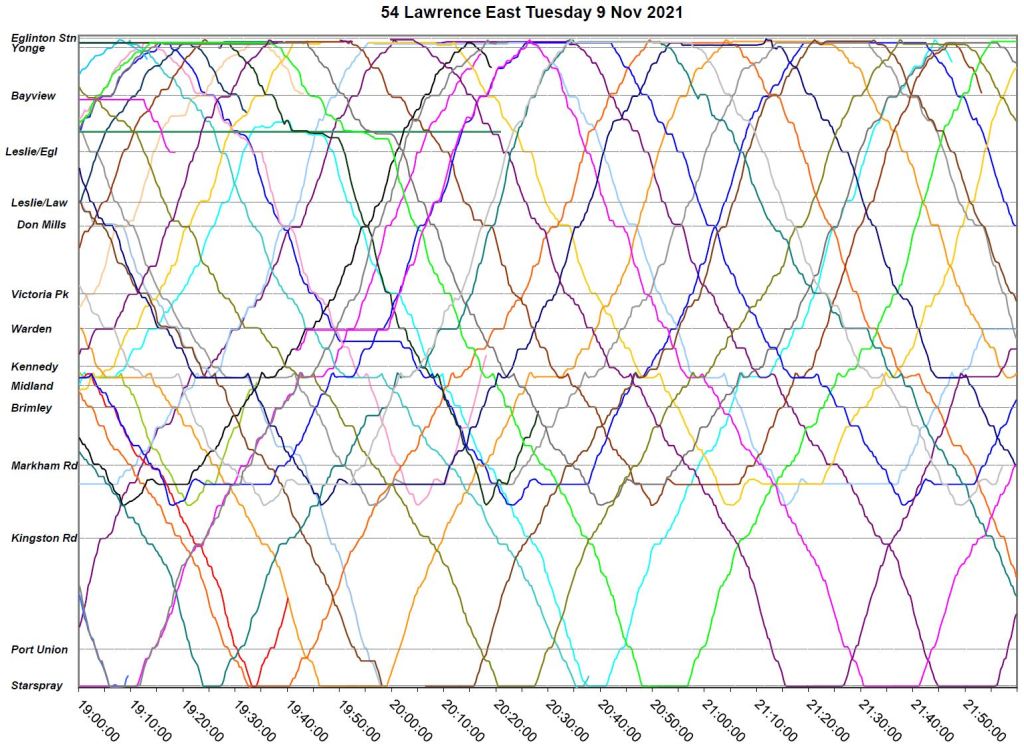
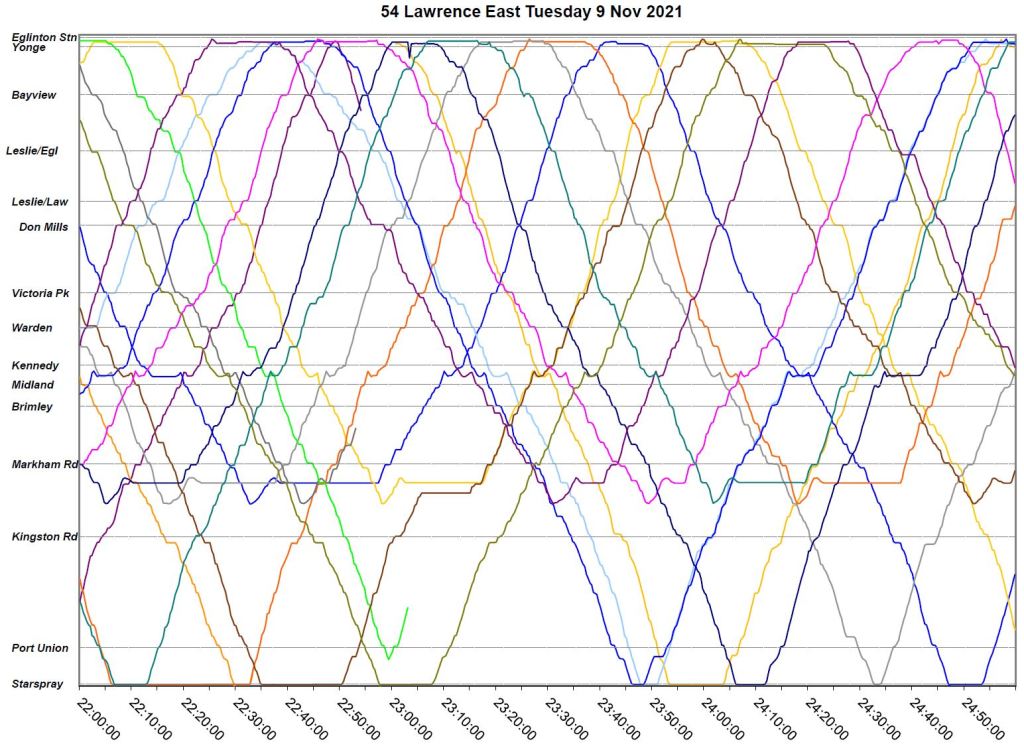
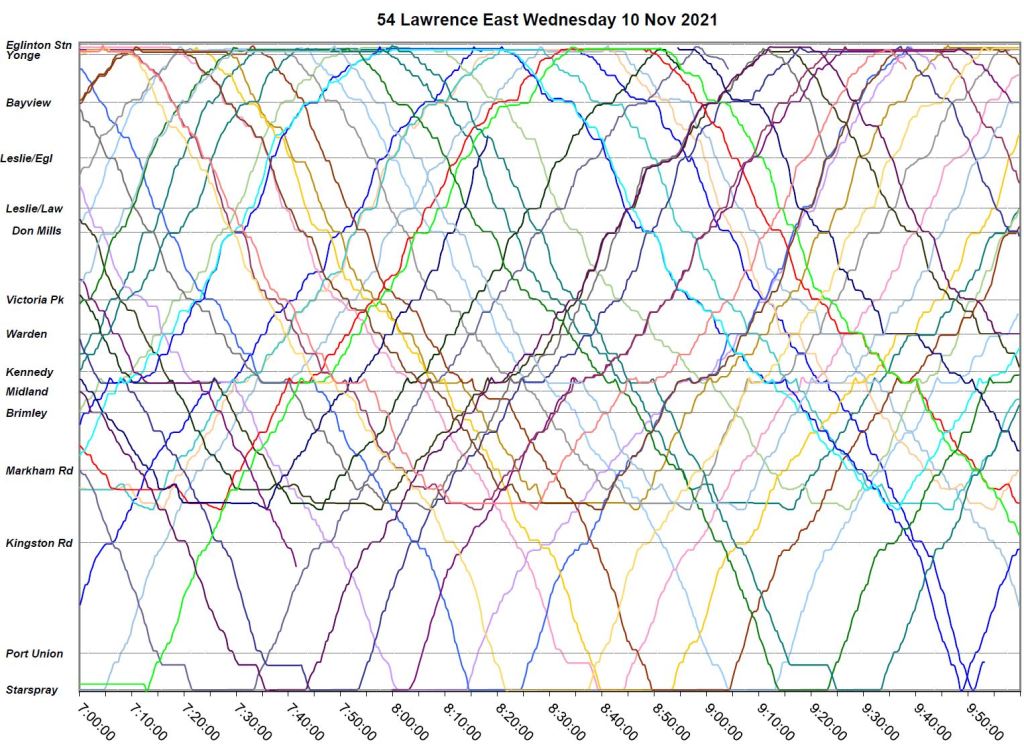
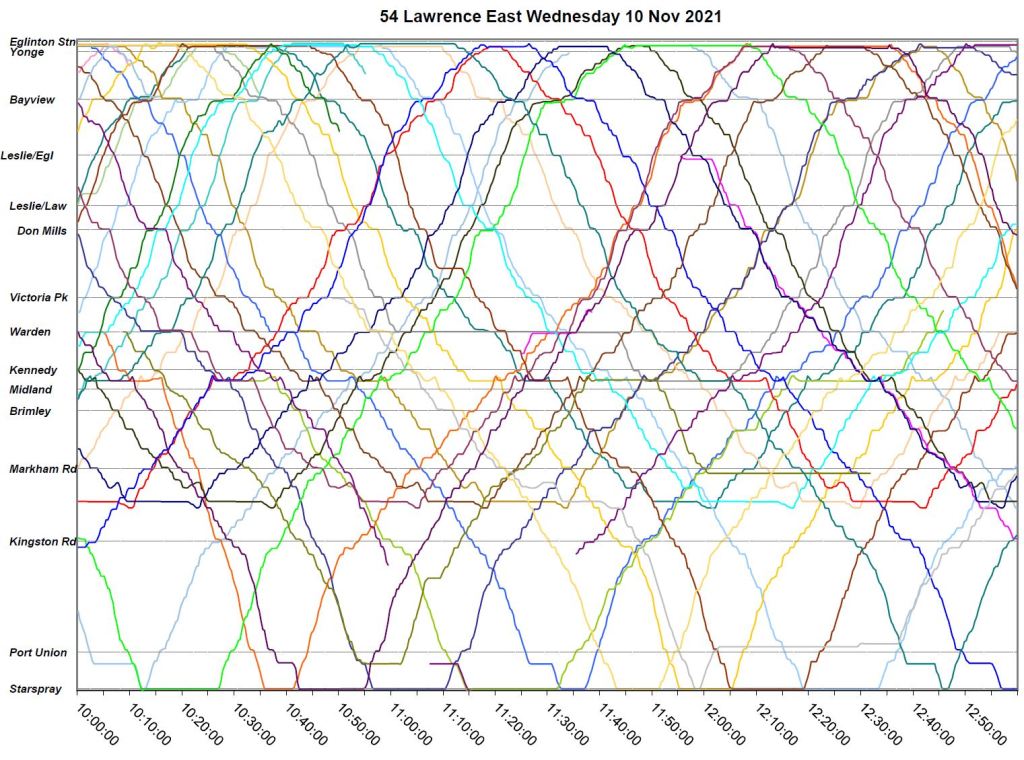
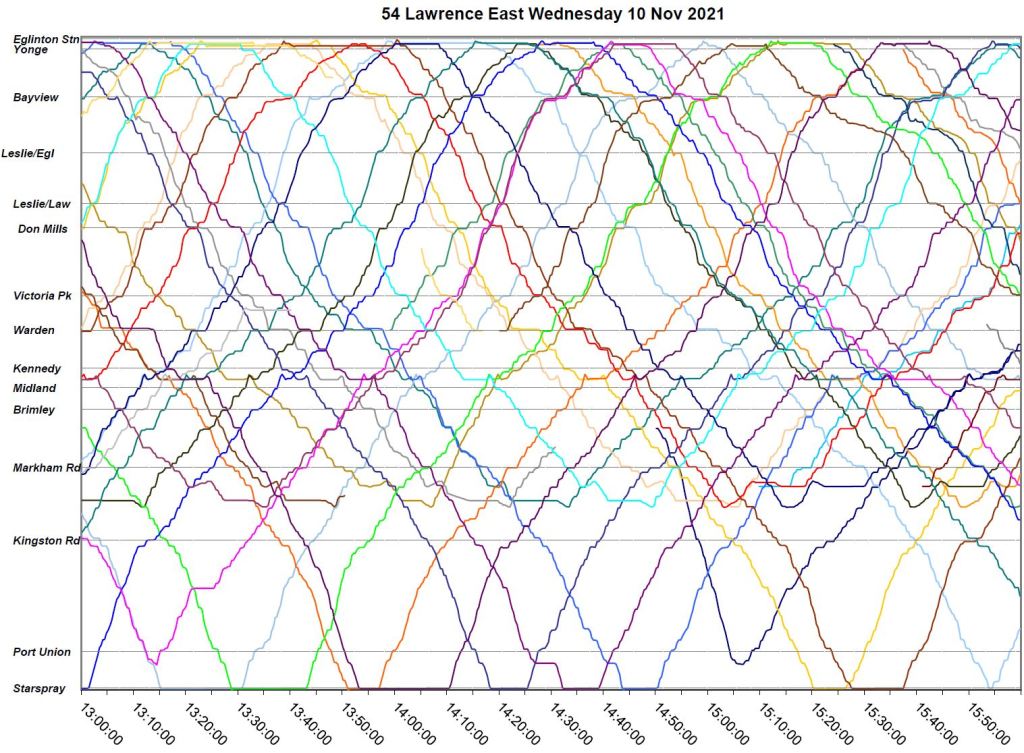
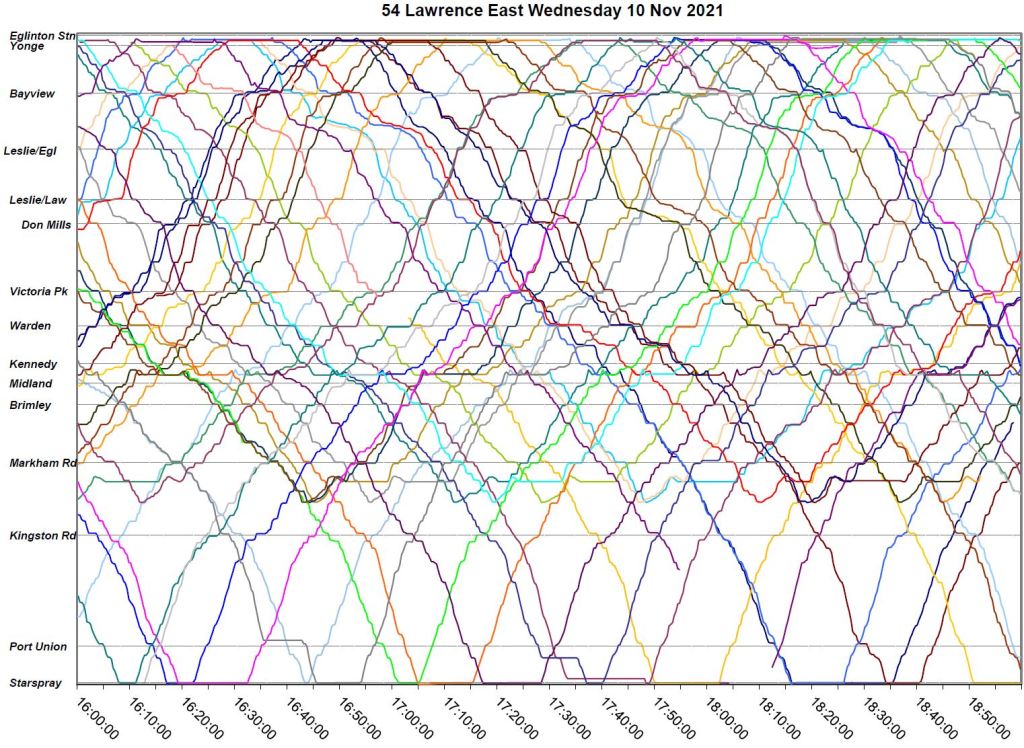
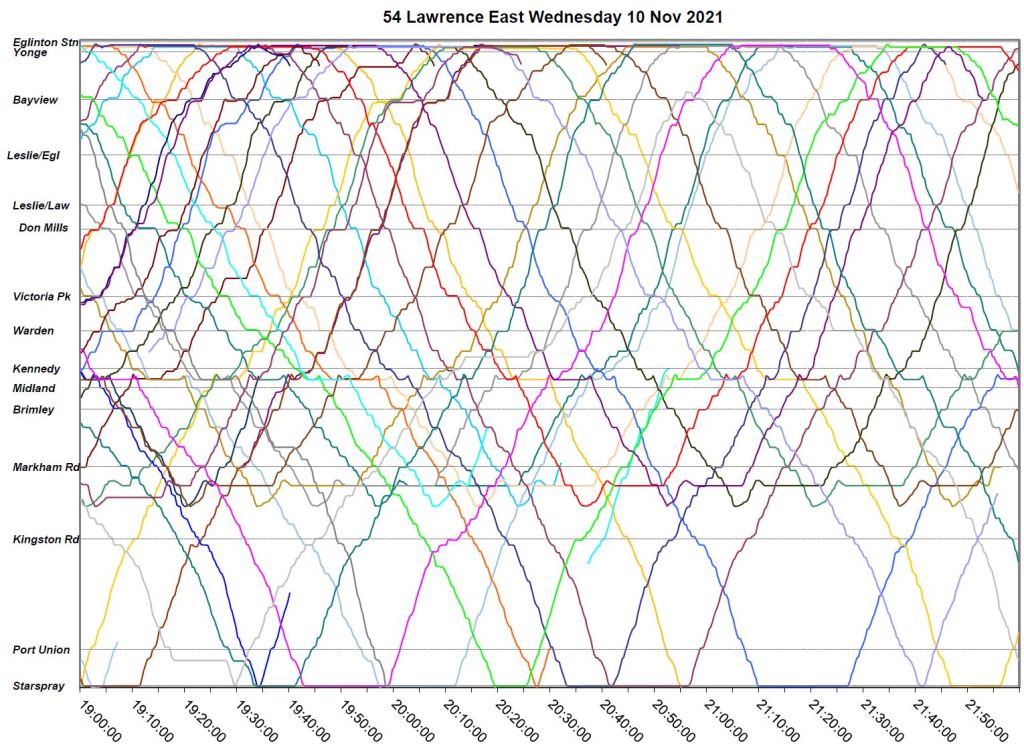
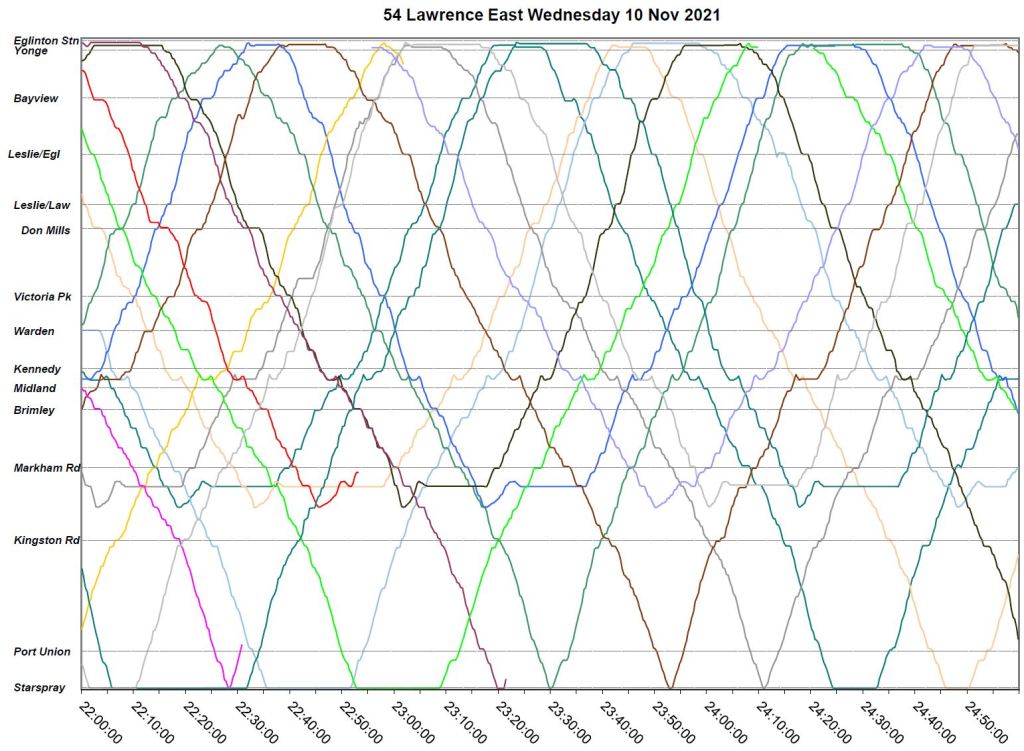
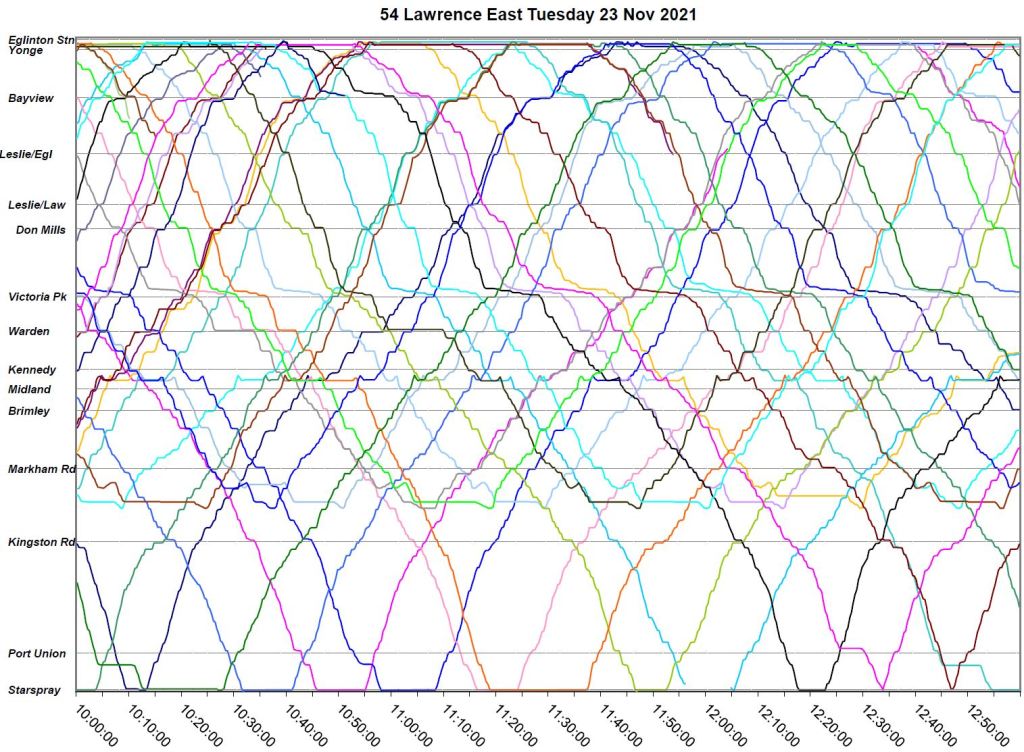
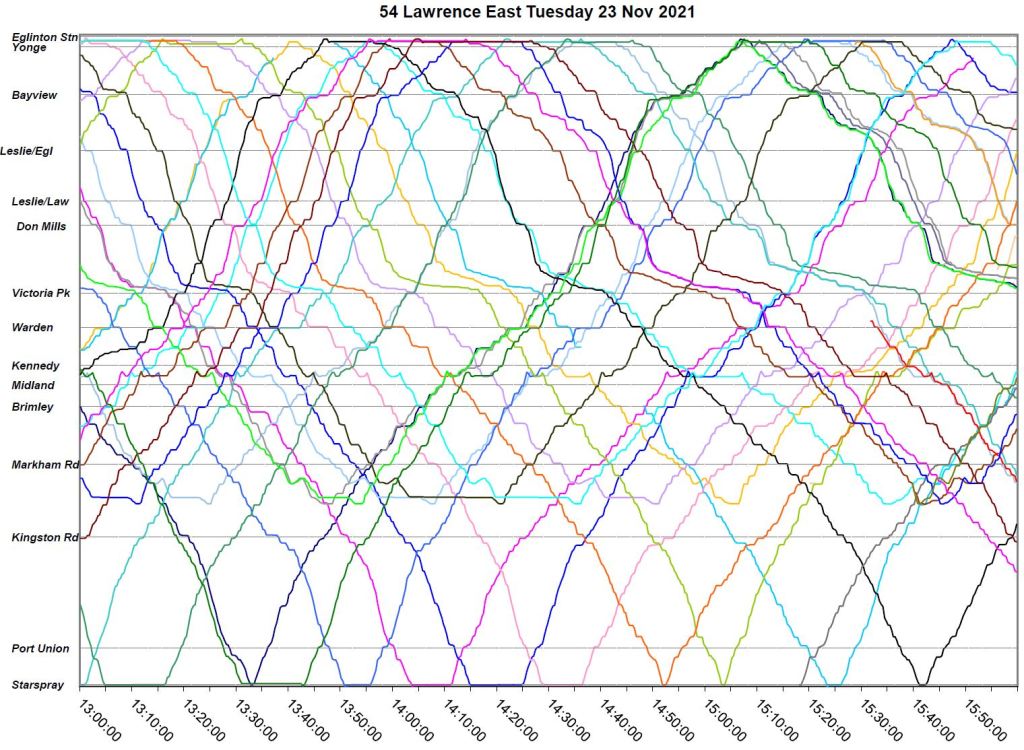
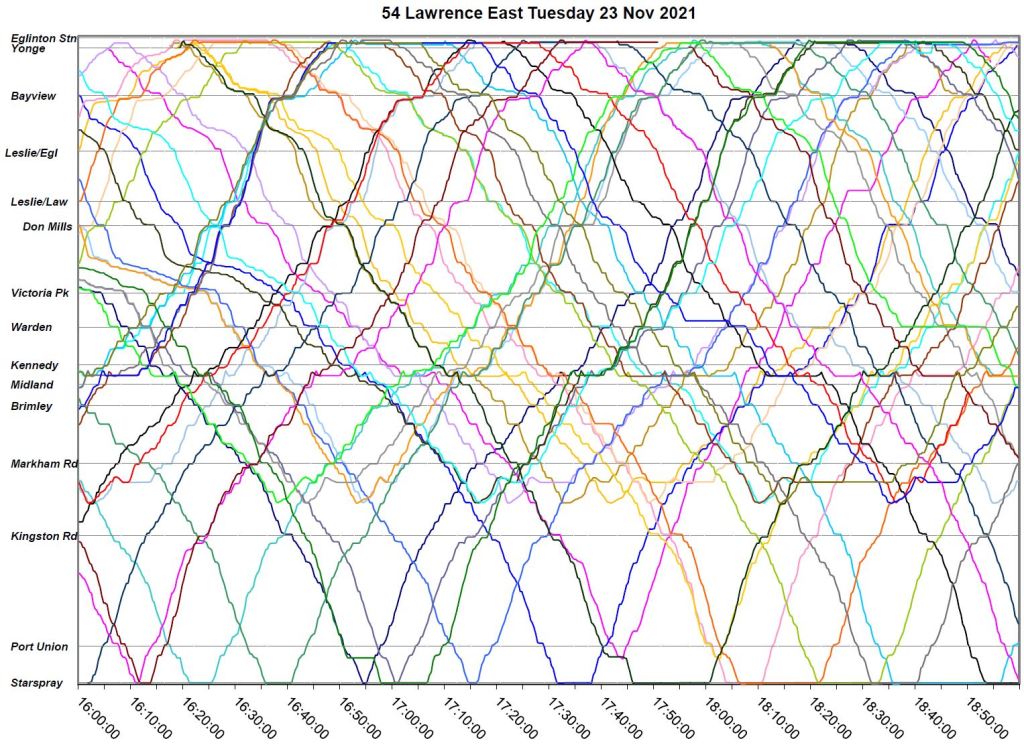
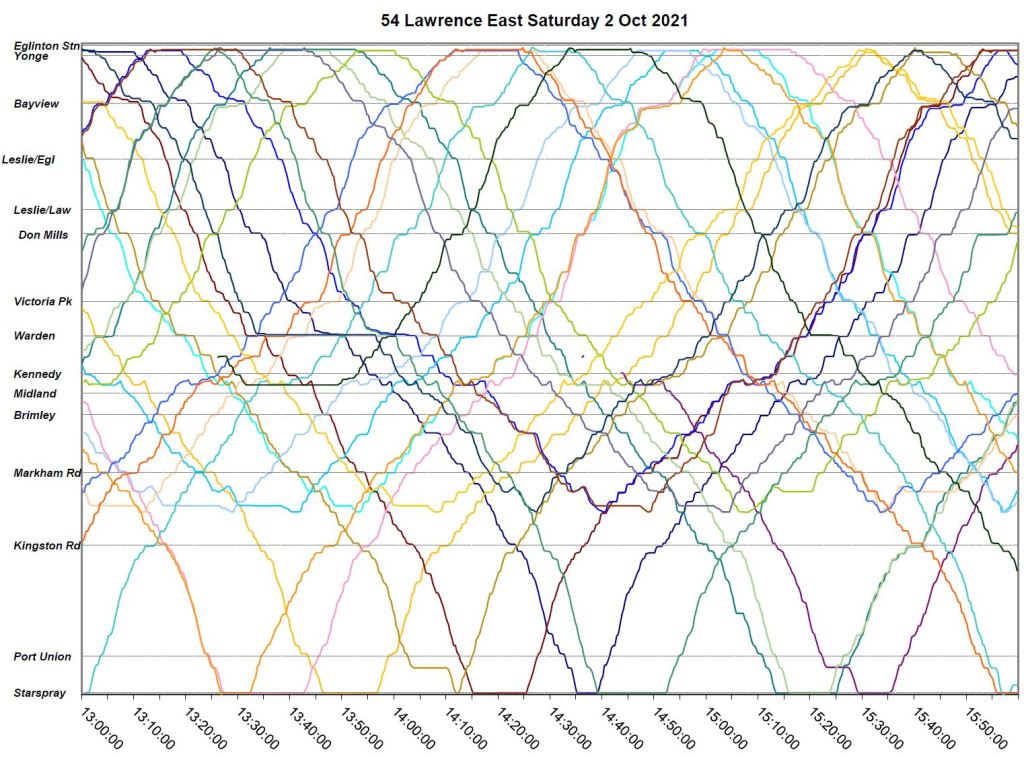
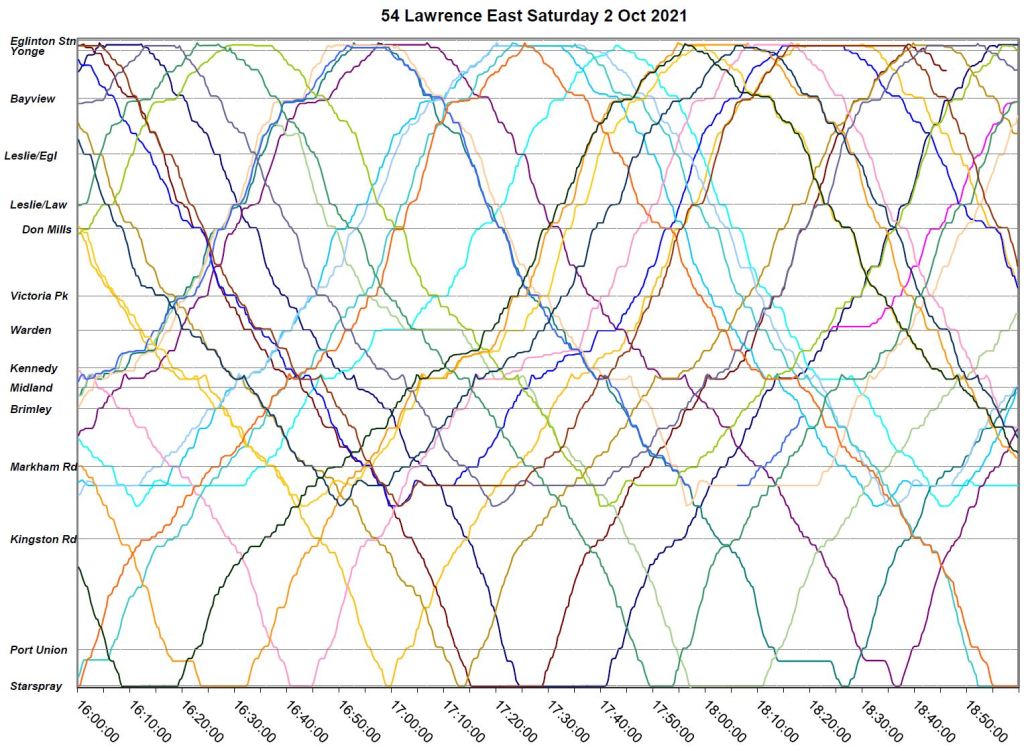
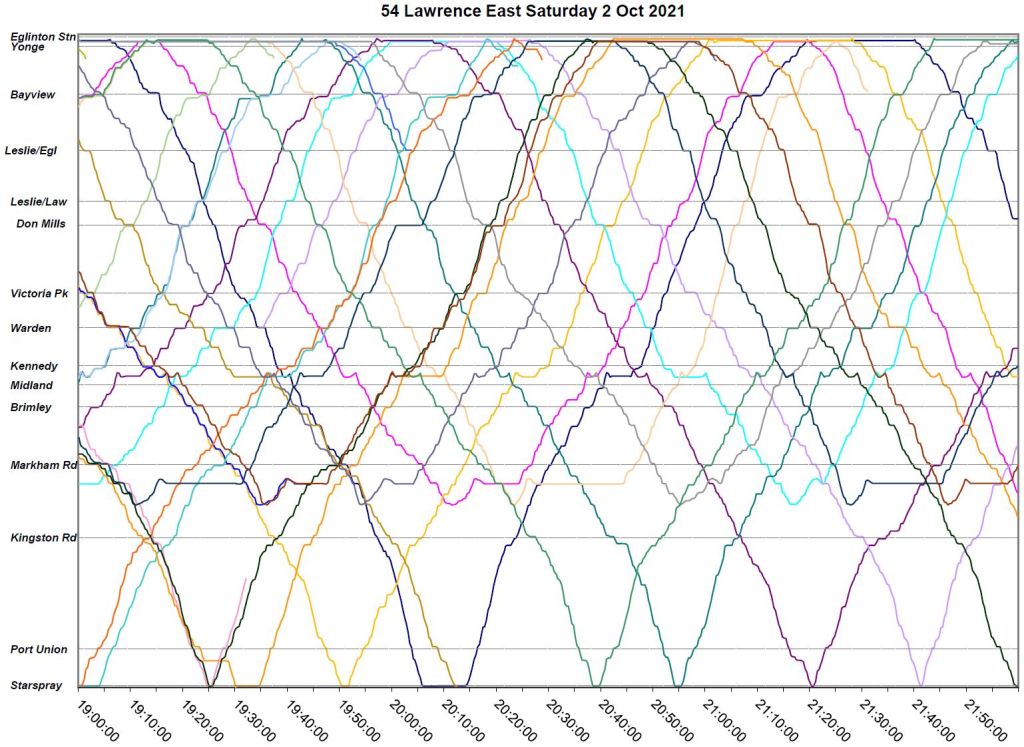
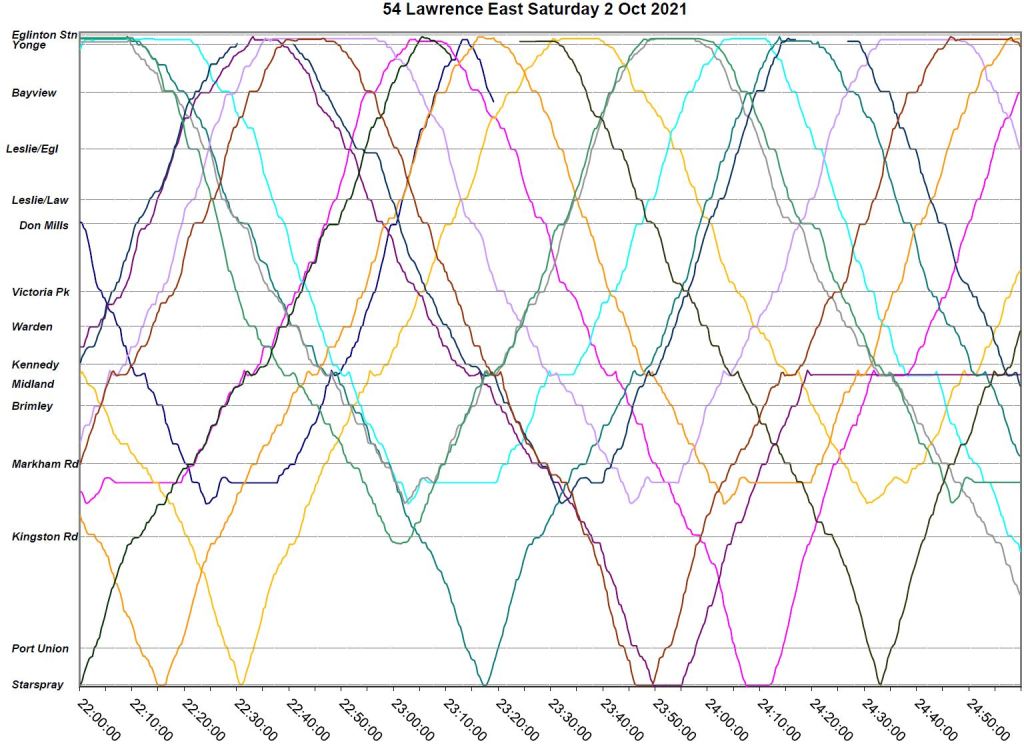
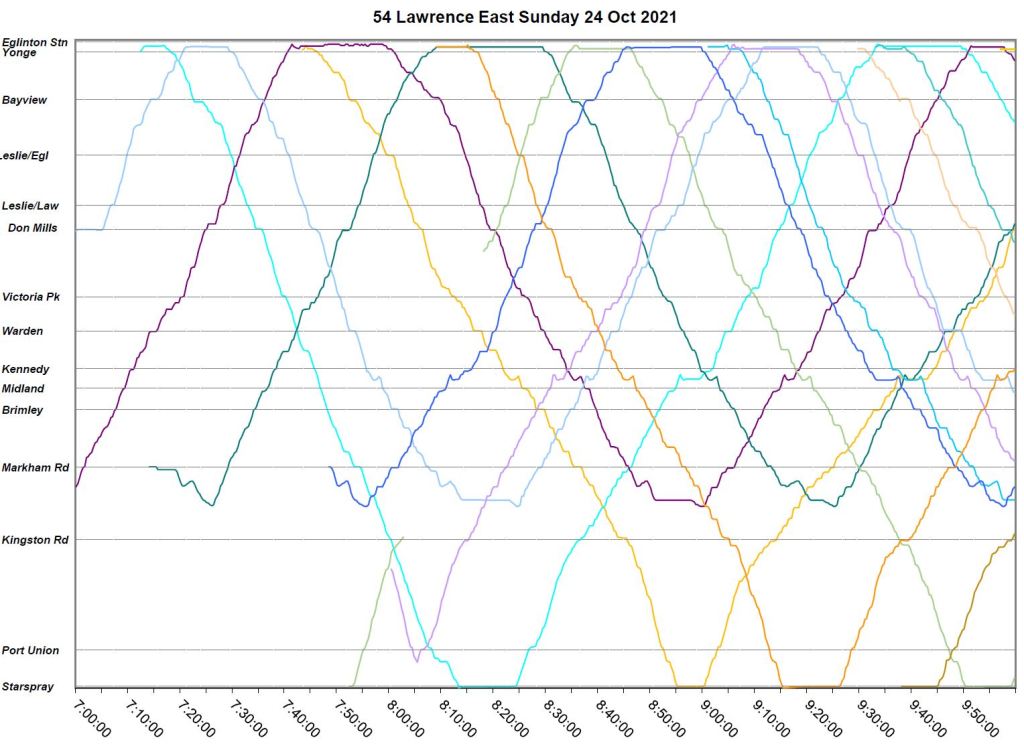
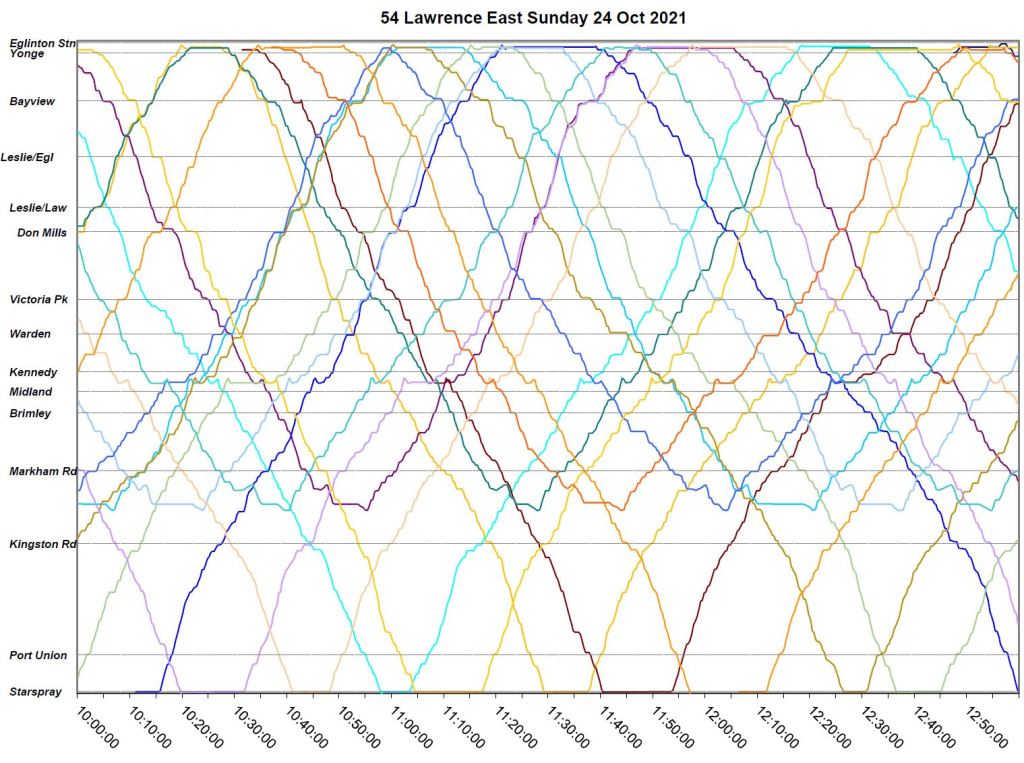
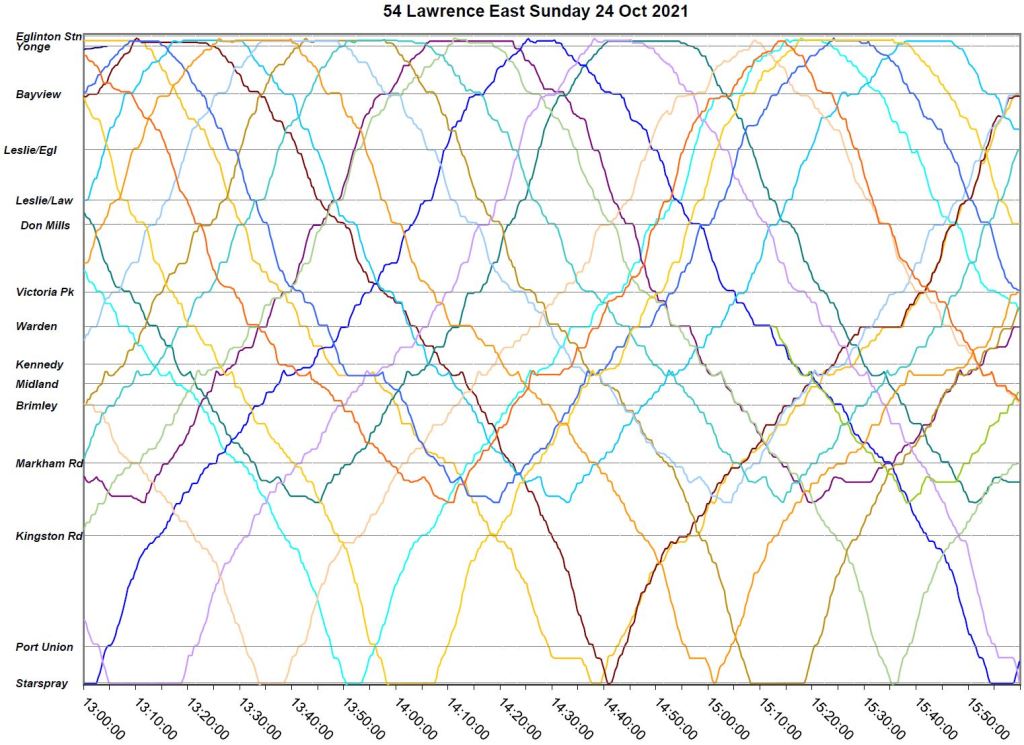
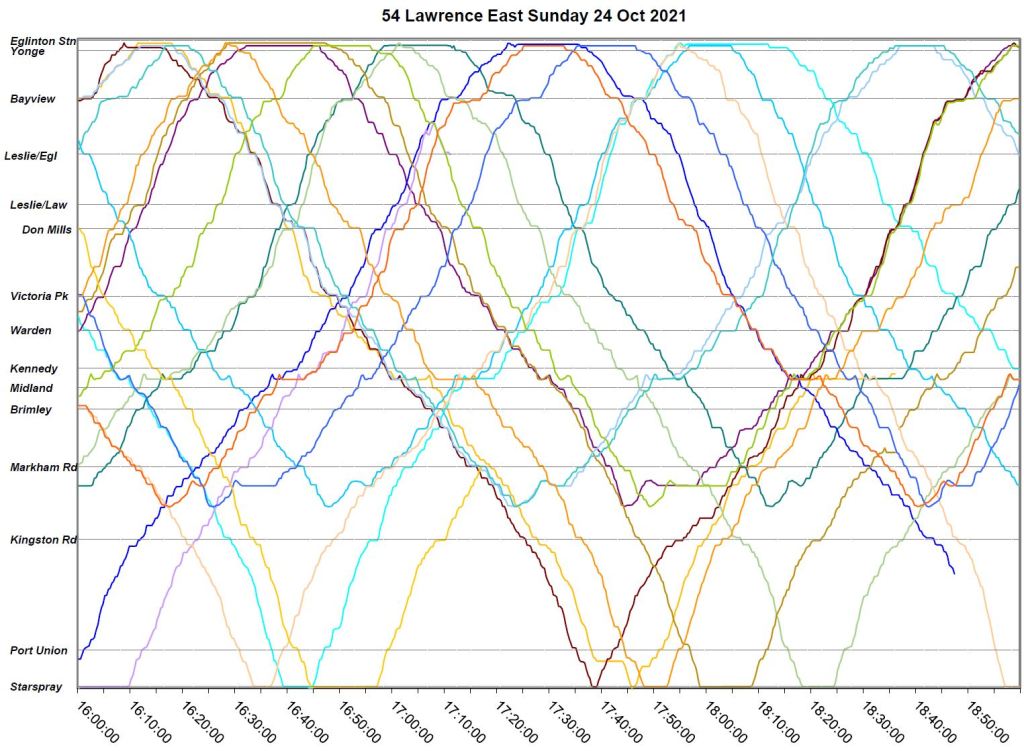
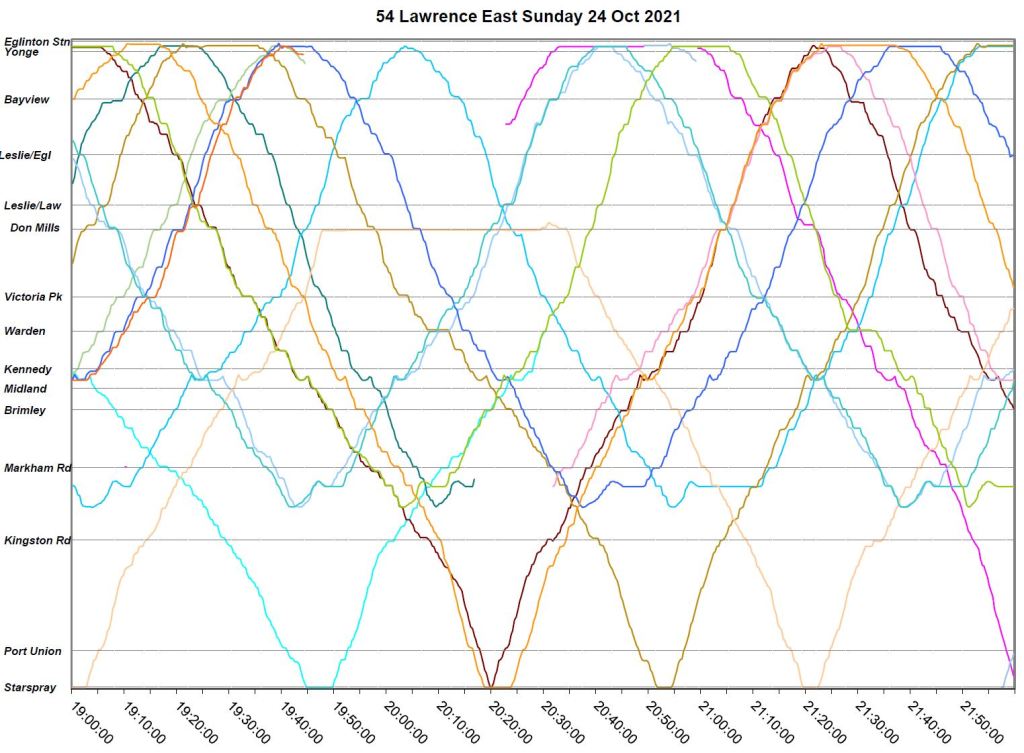
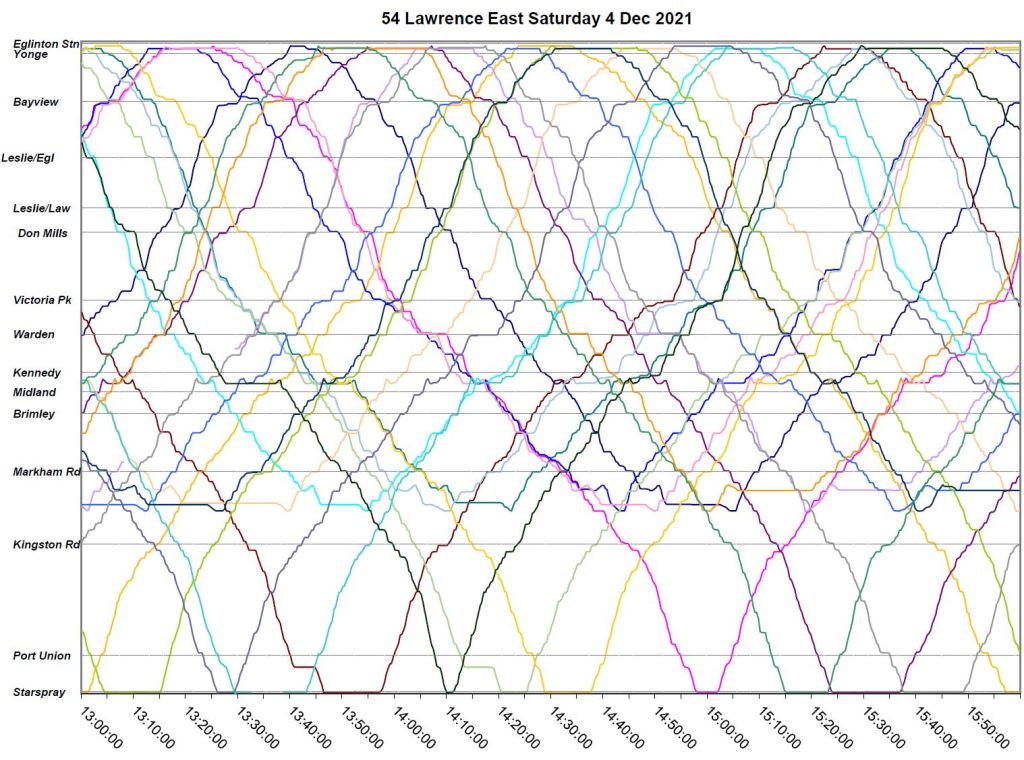
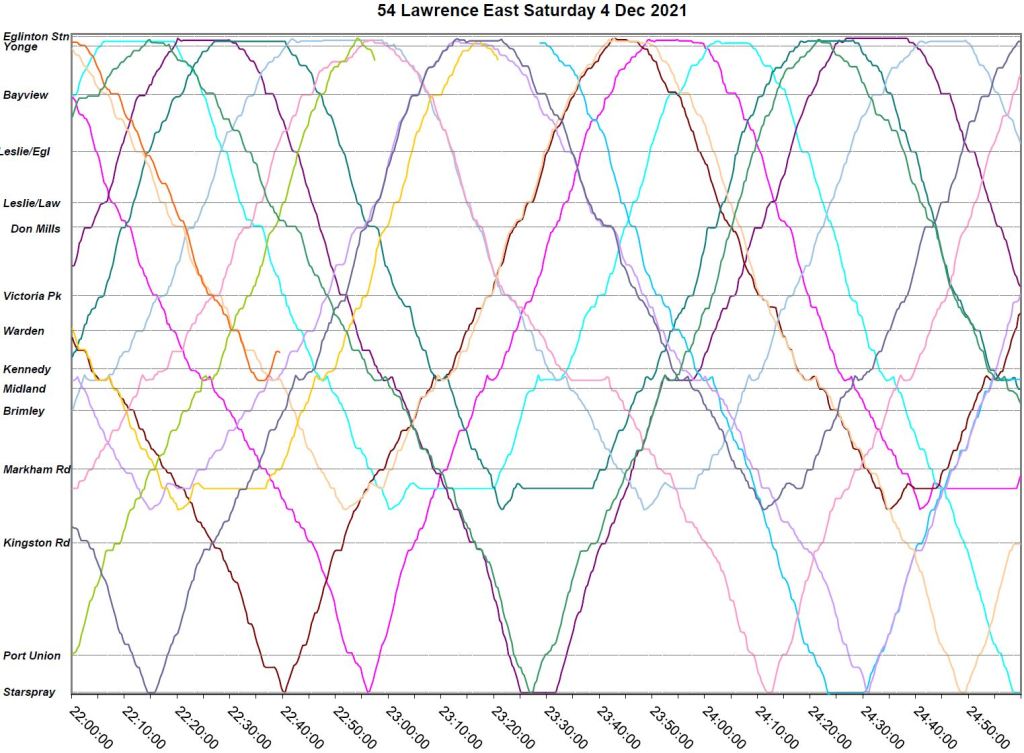
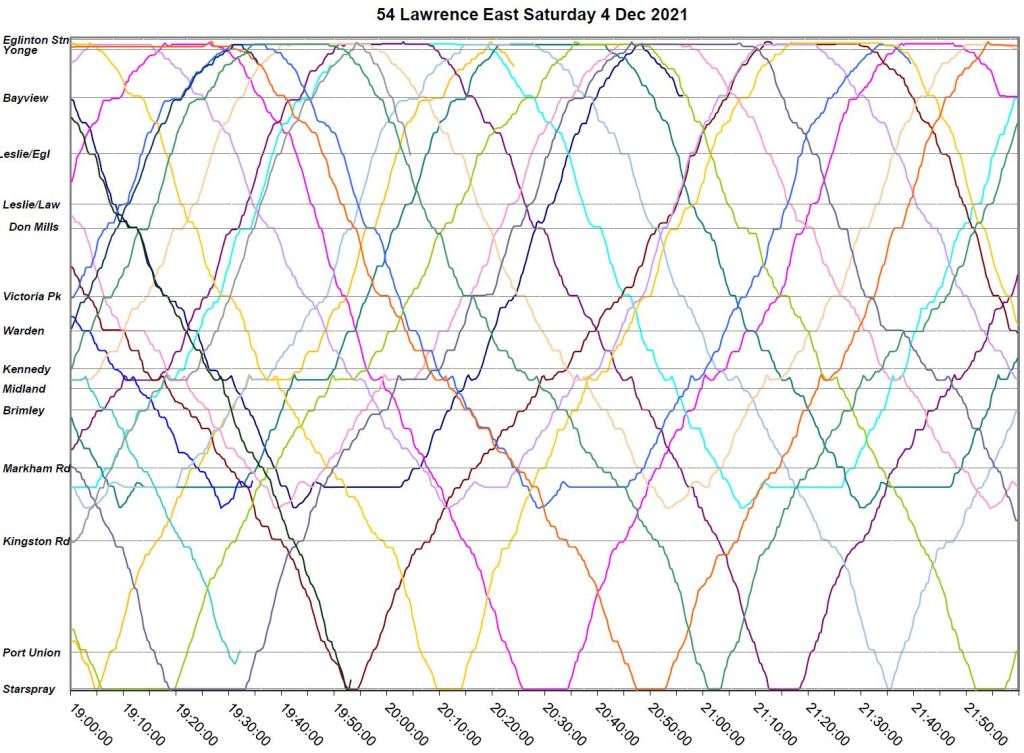
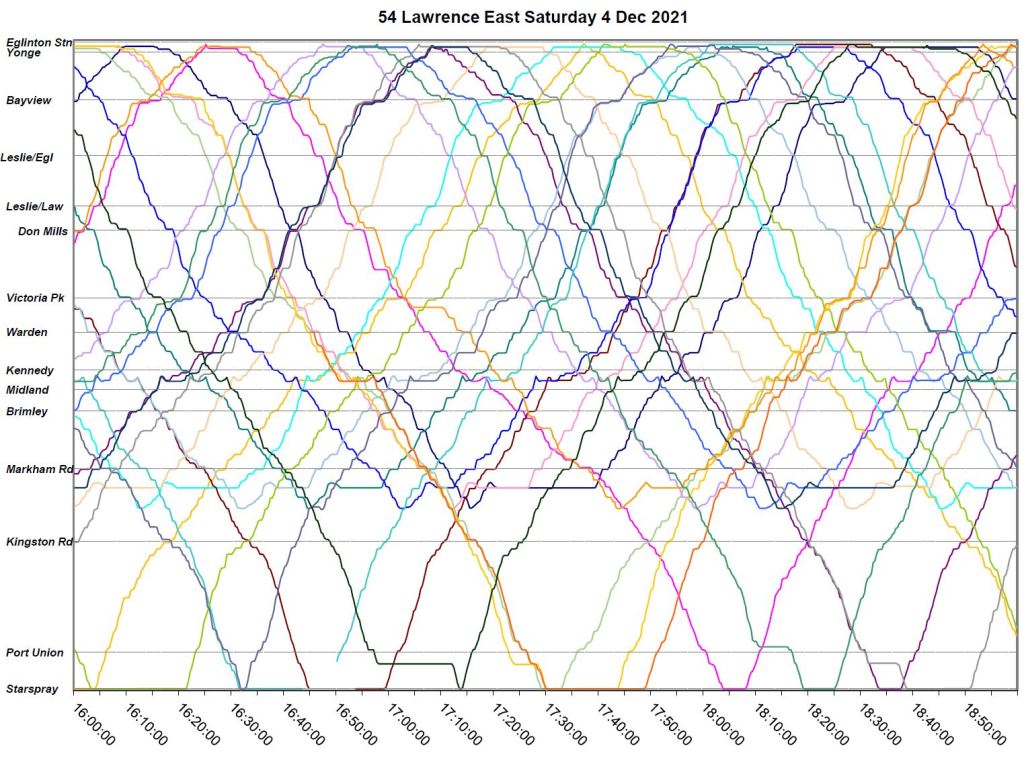
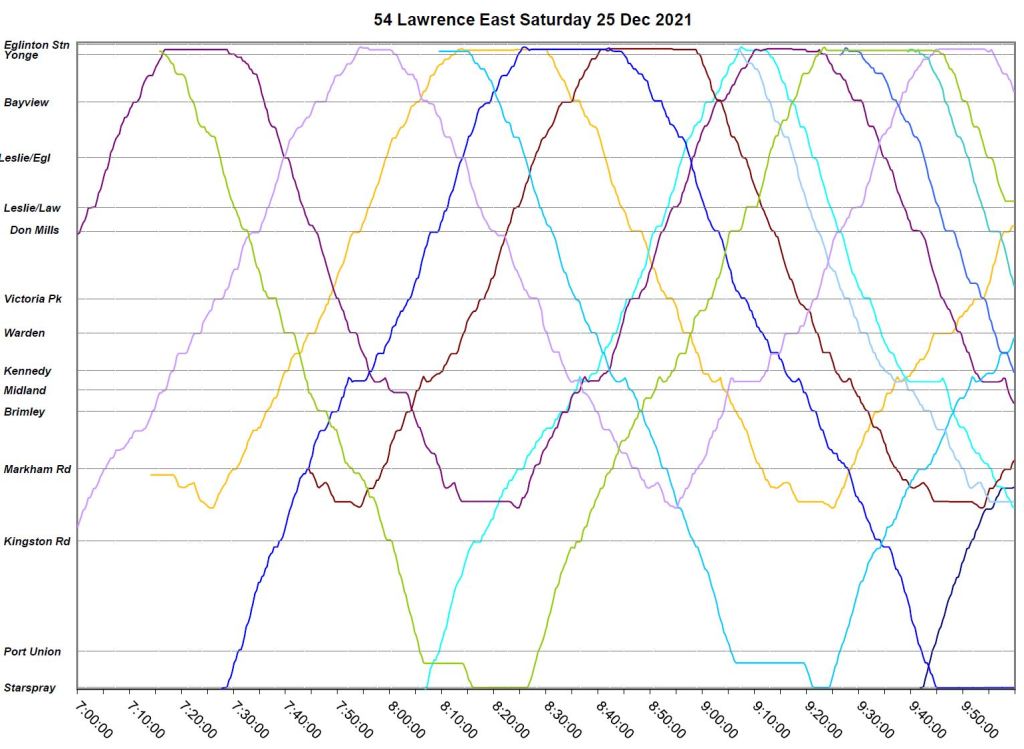
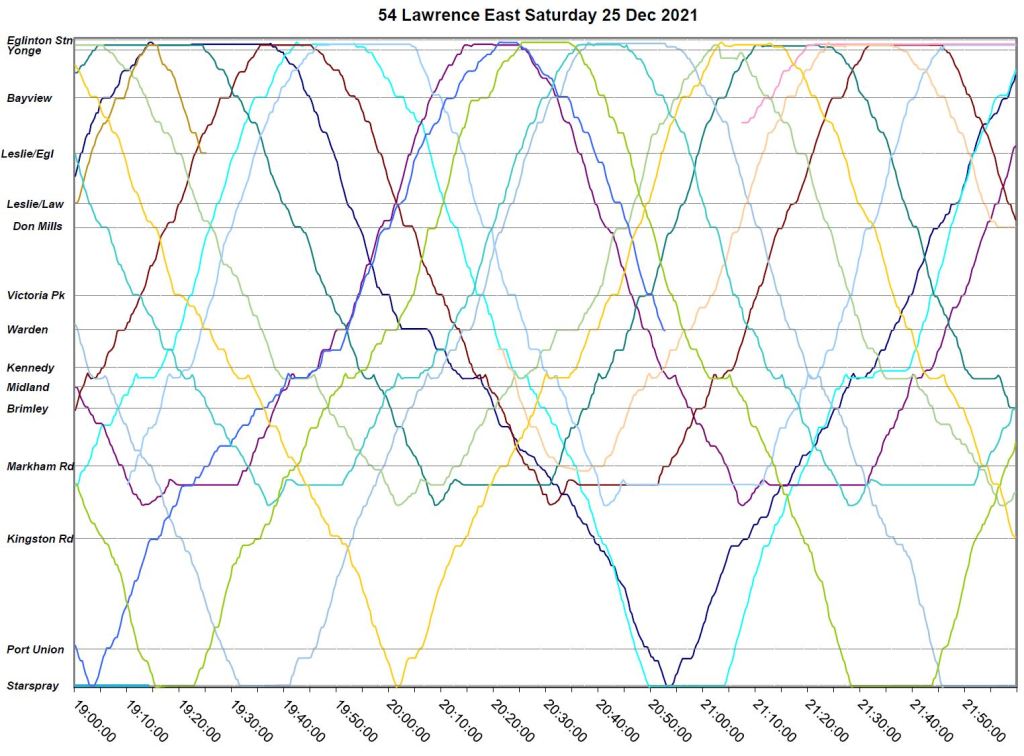
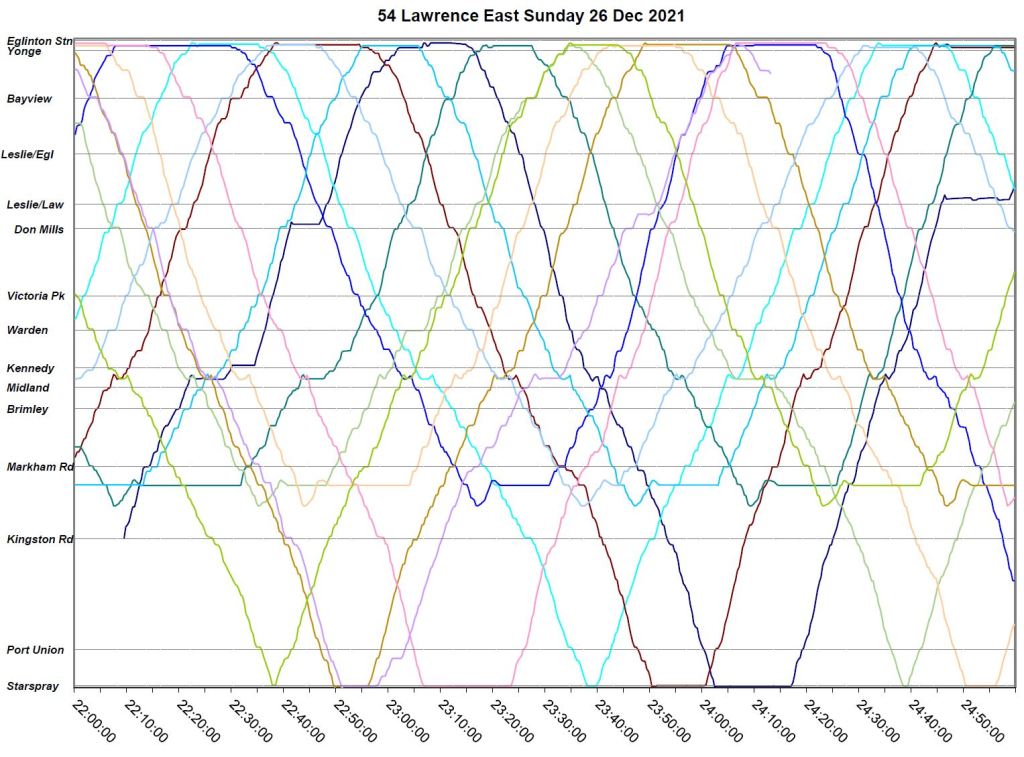
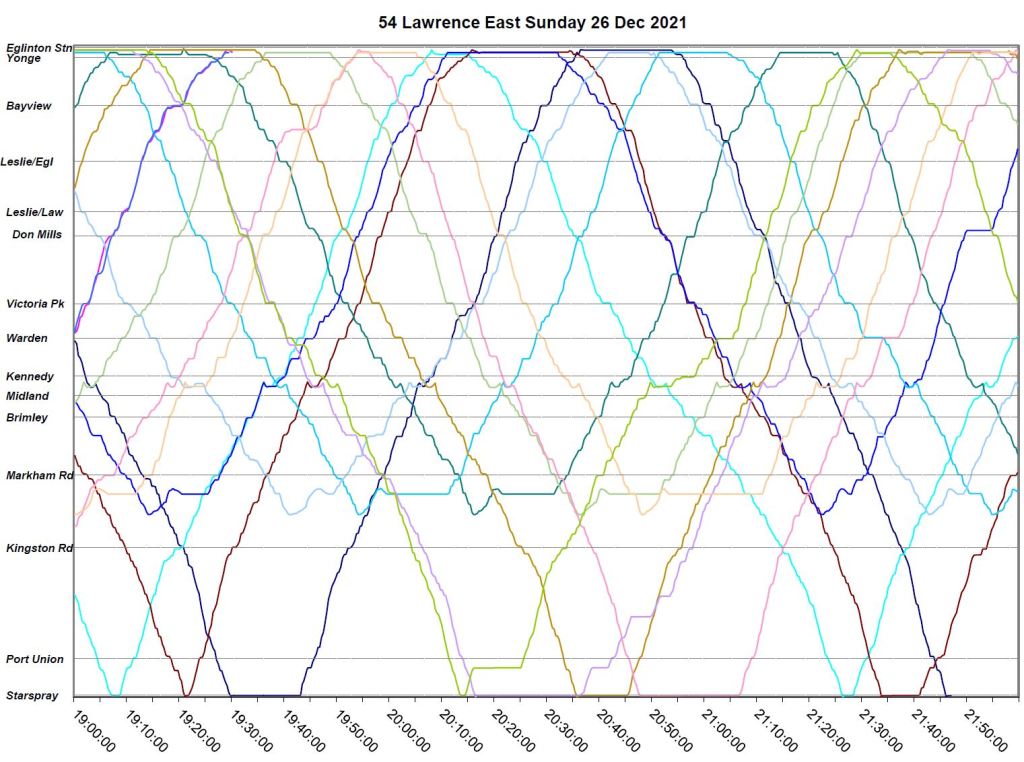
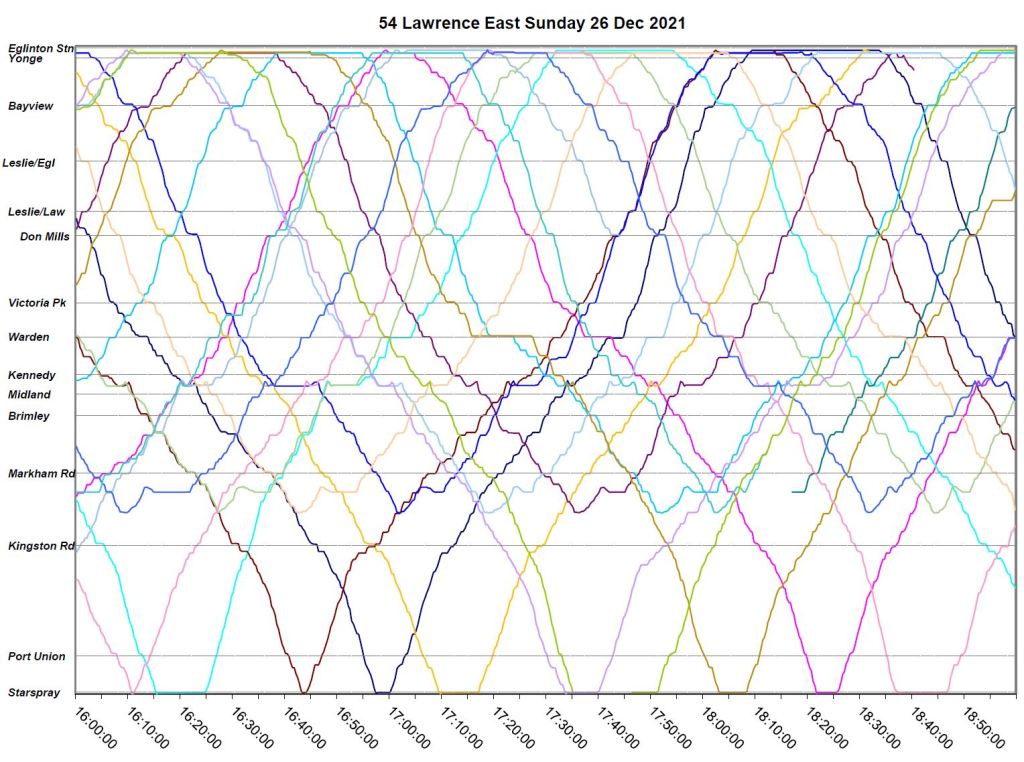
- Each line on the chart represents one bus moving back and forth along the line between Starspray (at the bottom) and Eglinton Station (at the top).
- The slope of a line shows the speed of a bus with more vertical lines being faster.
- Where a line runs horizontally, this indicates that the bus is not moving, and this is commonly seen at locations where buses take layovers.
- Where a group of lines become more horizontal for a short distance over a period of time, this indicates a congestion delay that is slowing all service.
- The space between the lines shows the separation in time, and lines running together are a bunch of two or more vehicles.
- The weekend samples are grouped together after the weekdays.
Wednesday, October 13
Week 3 of October was a bad week for traffic congestion (see charts for October 18-20 below). Here is October 13 as a “before” version of the route. Items of note:
- There is congestion both ways at various times of the day approaching Bayview Avenue until mid-evening caused by construction at Leaside Station on Line 5.
- Severe congestion is evident eastbound between Laird and Brentcliffe, again caused by Line 5 work.
- Some buses form pairs or trios when a delay opens up a gap, and the gap bus(es) fall further behind due to passenger load.
- Some buses leave terminals together, or form pairs where service merges in at the Orton Park short turn.
- Some clusters of buses build up gradually but then stay together for a trip or more. This is particularly evident between 3 and 6pm where five or more buses can be seen travelling together followed by a wide gap.
- This pattern continues into the evening and service is not reliably spaced until after 10pm.
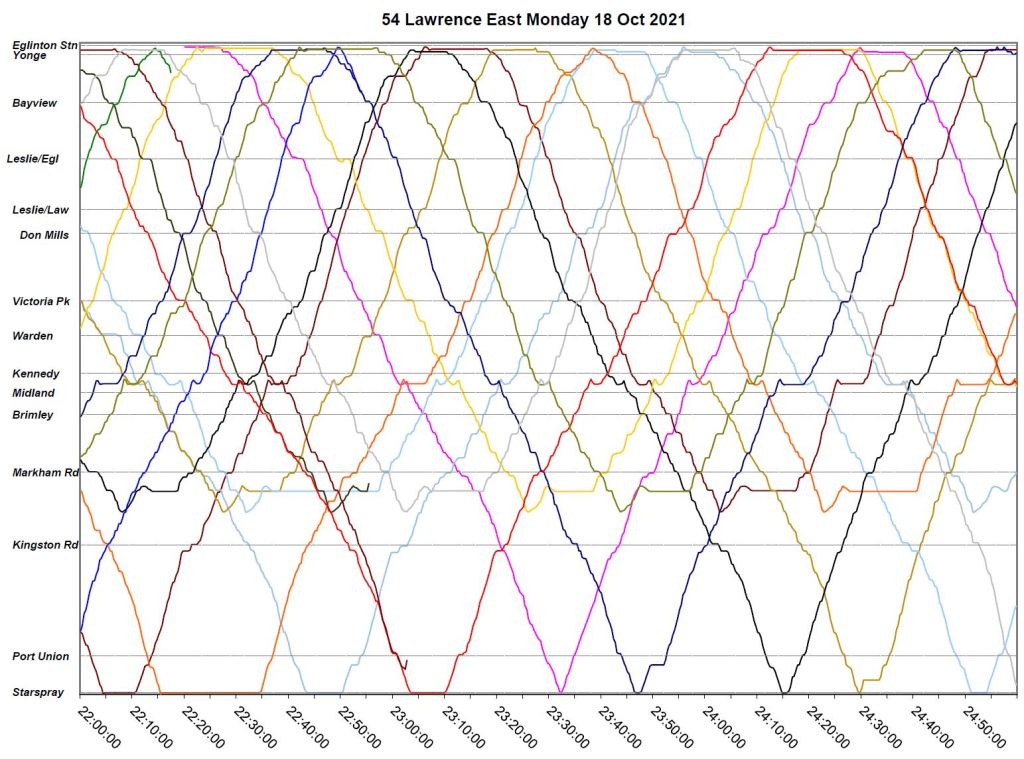
Monday, October 18
- October 18 begins with severe delays bothways at Mt. Pleasant until just before 10am.
- Congestion westbound to Victoria Park begins just after 9am and lasts until 11am.
- Other problems seen above on October 13 are also visible, although pm peak bunching is less severe.
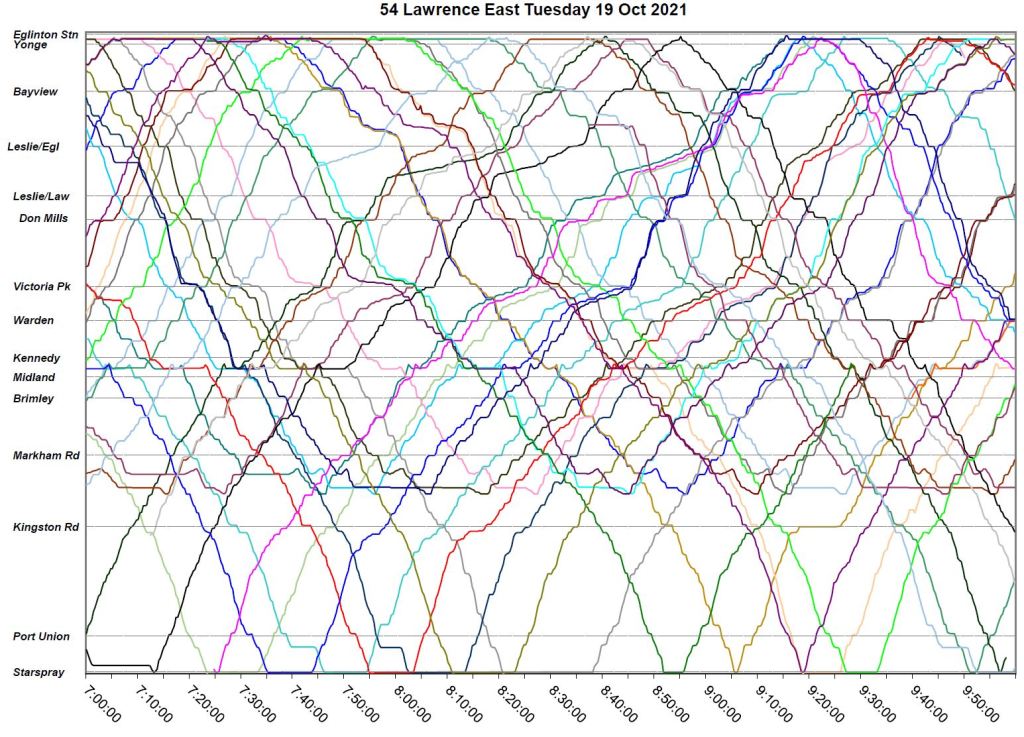
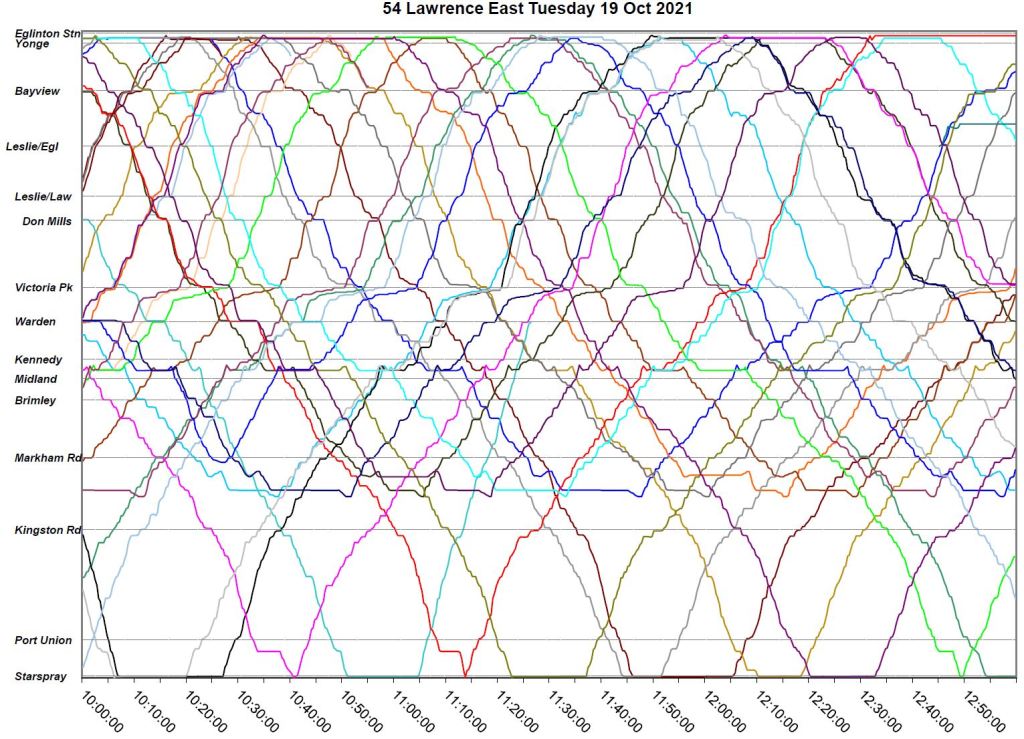
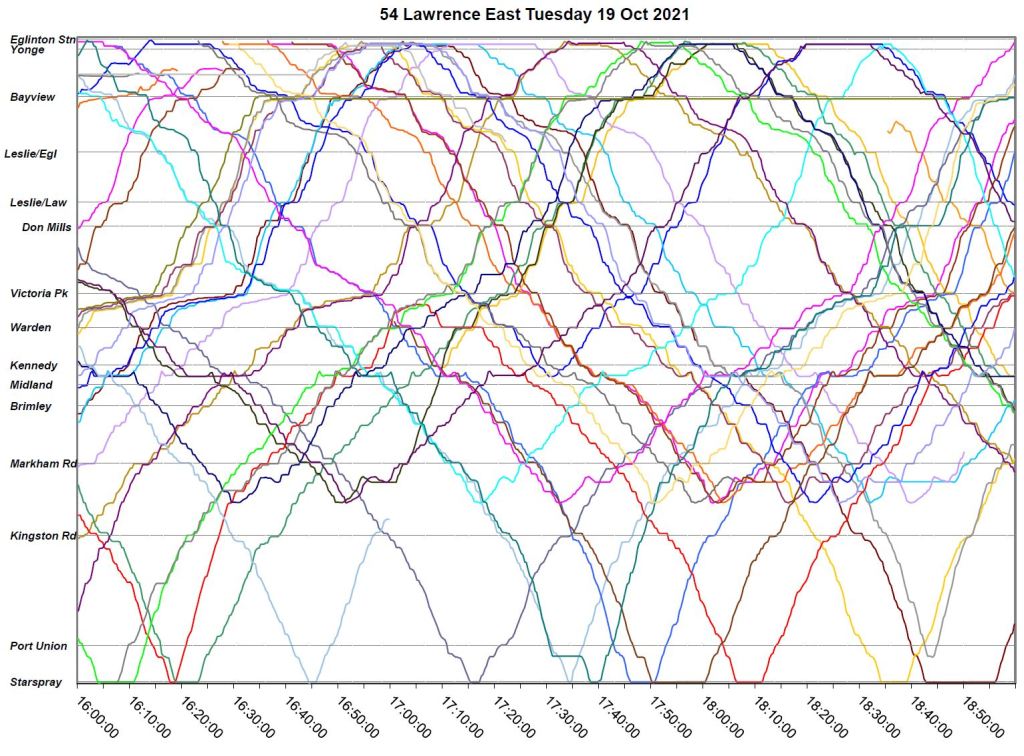
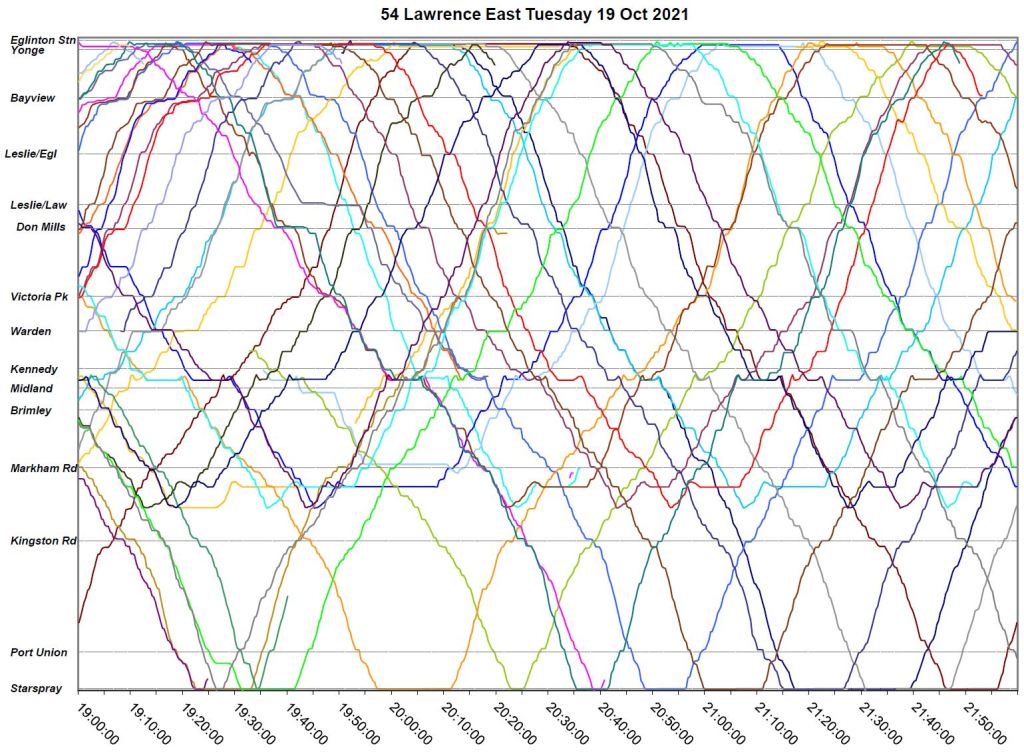
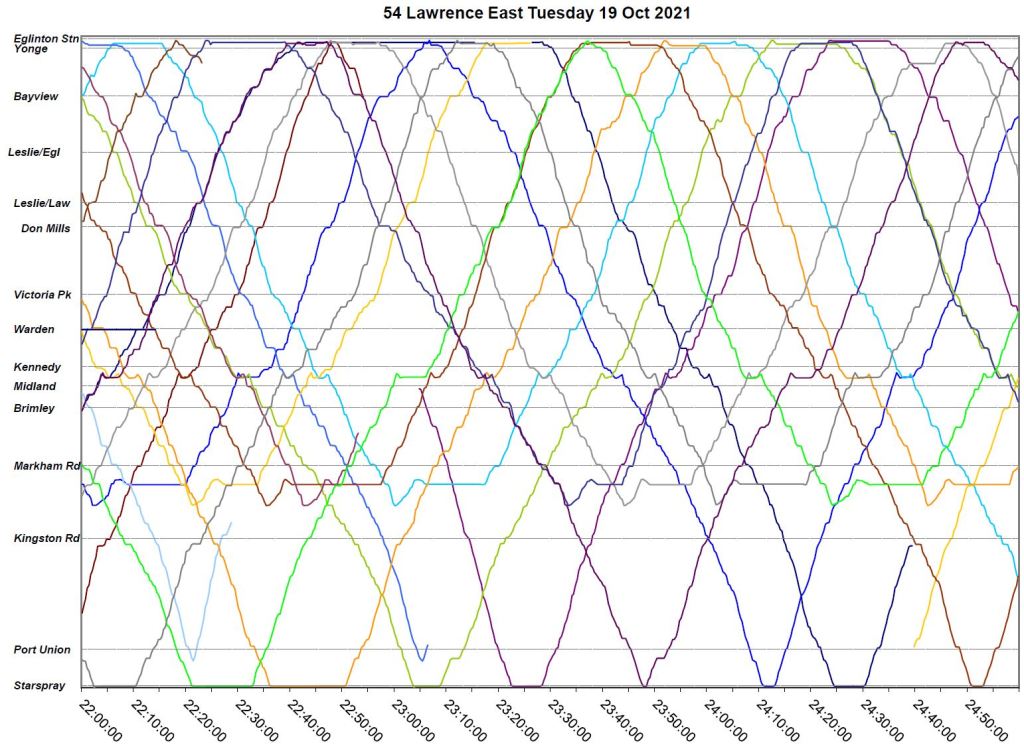
Tuesday, October 19
- October 19 has congestion southbound approaching Leslie & Eglinton, but only for about 2 hour in the am peak.
- Congestion westbound at Victoria Park begin before 8am and continues in varying degrees until the early evening.
- Bus bunching becomes a problem after 2pm and there are some very wide gaps into the early evening.
- There is some evidence of buses missing and reappearing at odd places along the route (possible short turns or change-offs) as well as buses running express to get back on time (lines that are more vertical than those around them.
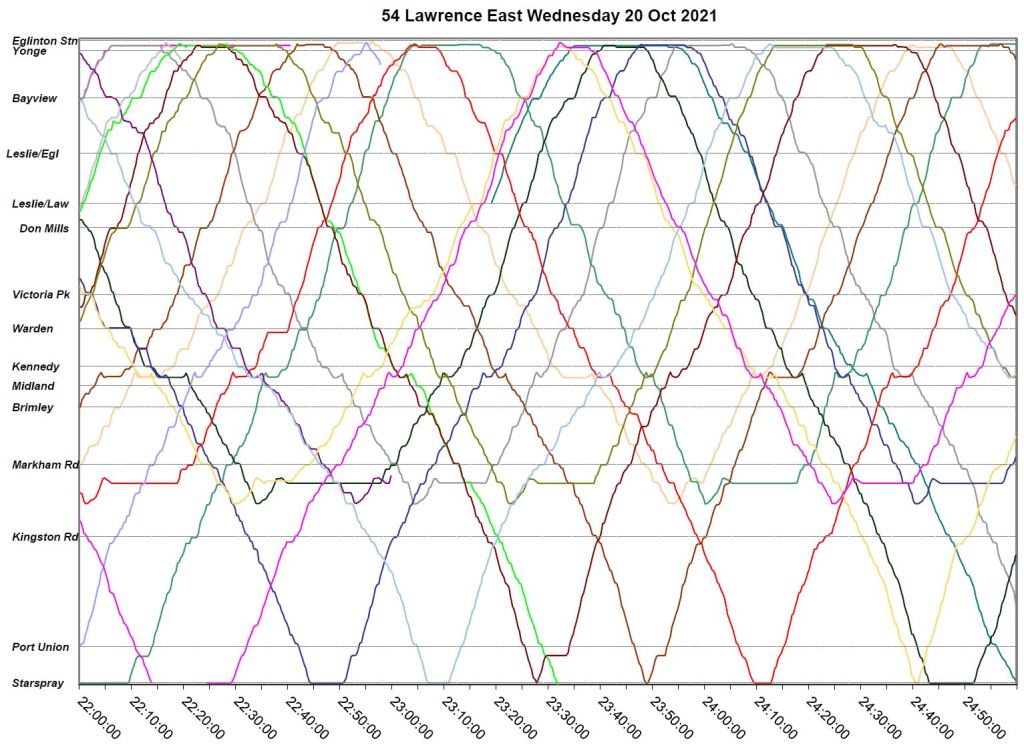
Wednesday, October 20
- Service on October 20 has many of the same problems with delays as the 19th, but the bunching and gaps start much earlier after 9am.
- By mid-day there are clusters of buses travelling together and this persists through to late evening.
- Mid-day problems are compounded by buses vanishing and reappearing at various locations.
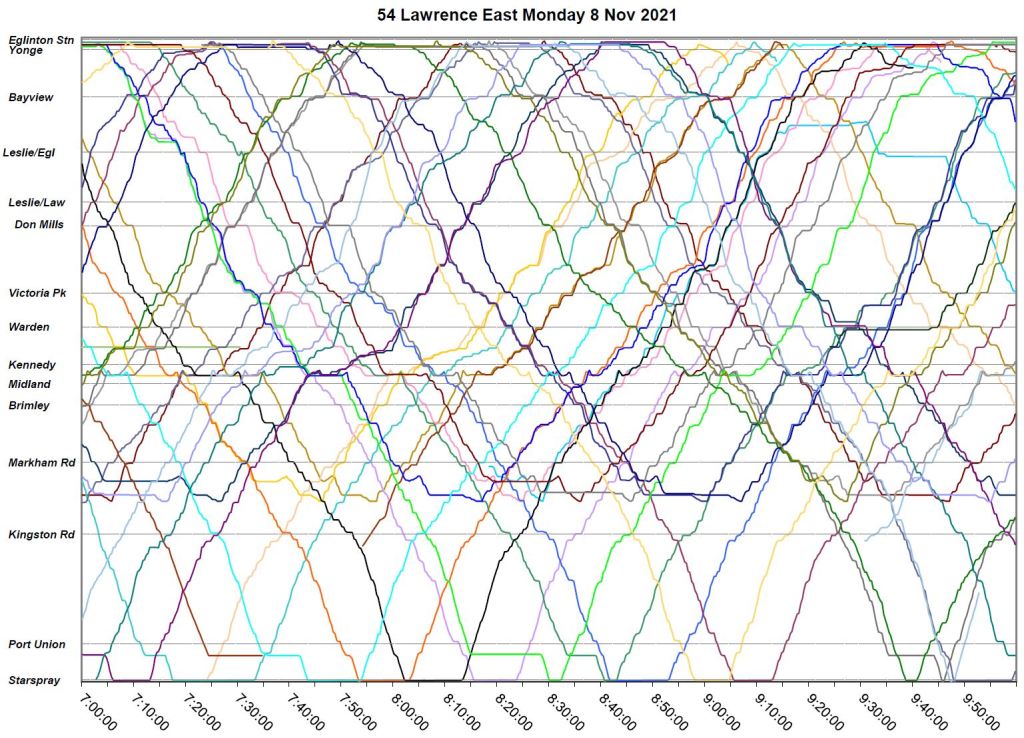
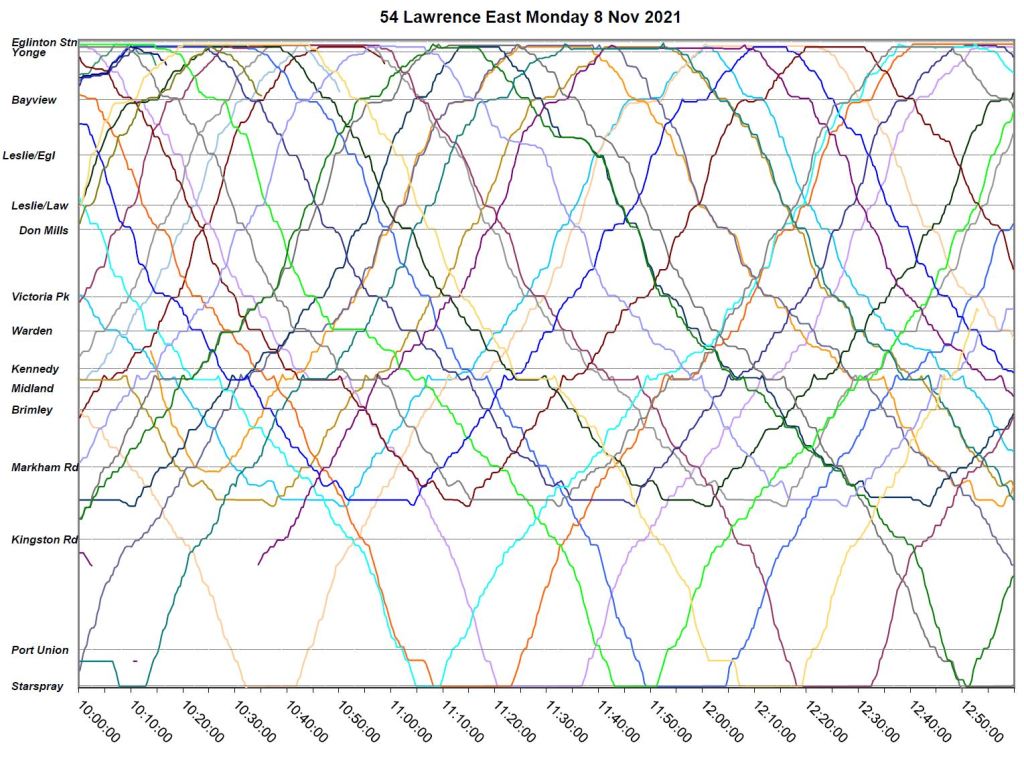
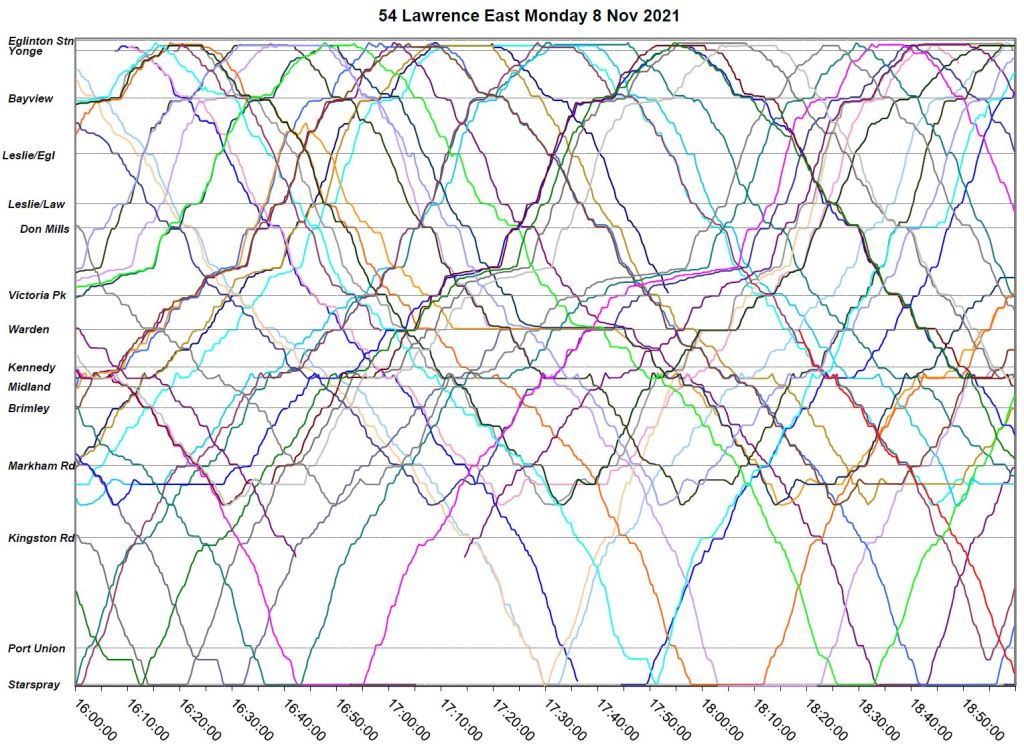
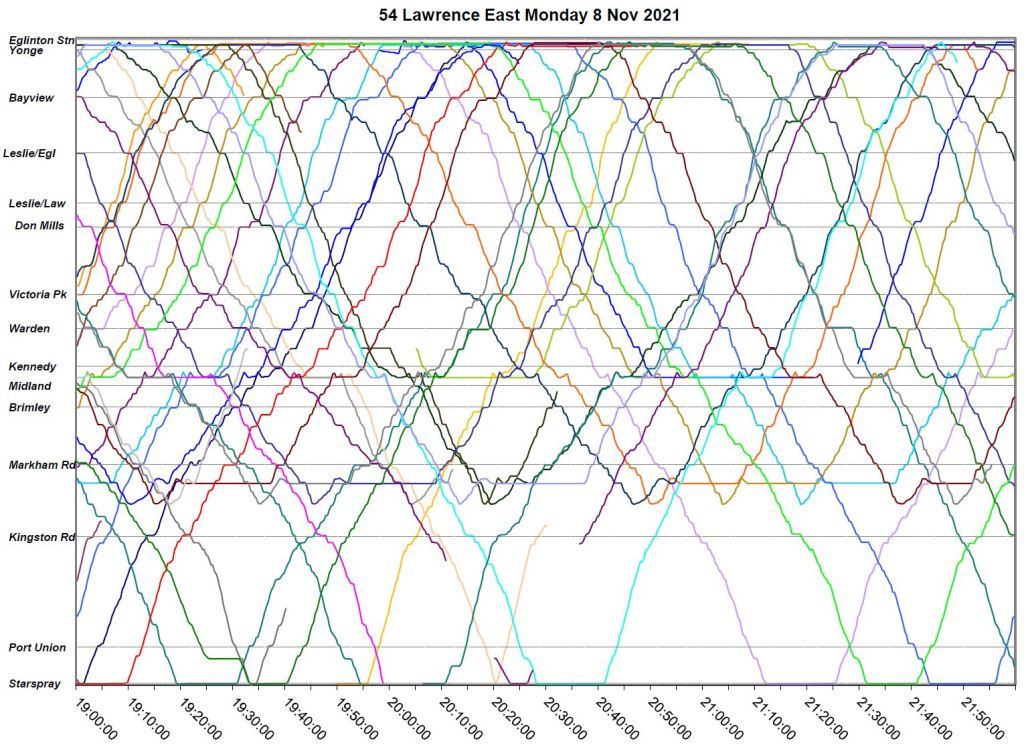
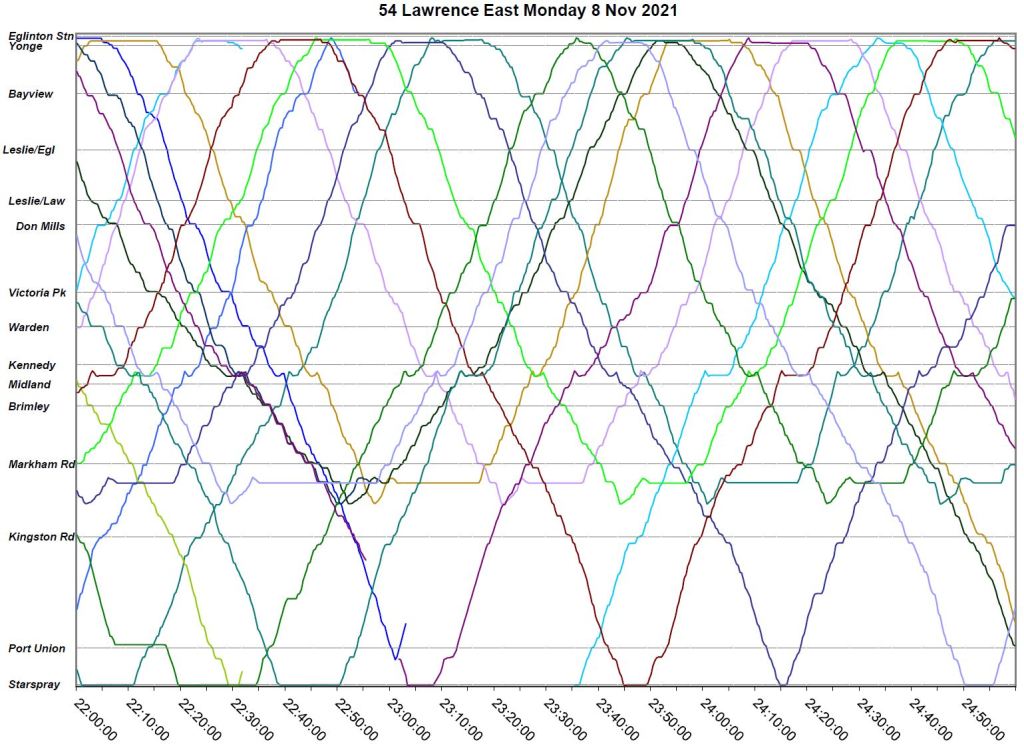
Monday, November 8
- On November 8, the westbound delay previously east of Victoria Park had shifted to west of of the intersection.
- Bunching of three or more buses is problem from the AM peak even though there is little congestion at that time.
- As in previous weeks, the service is not sorted out, and then not completely, unti late evening.
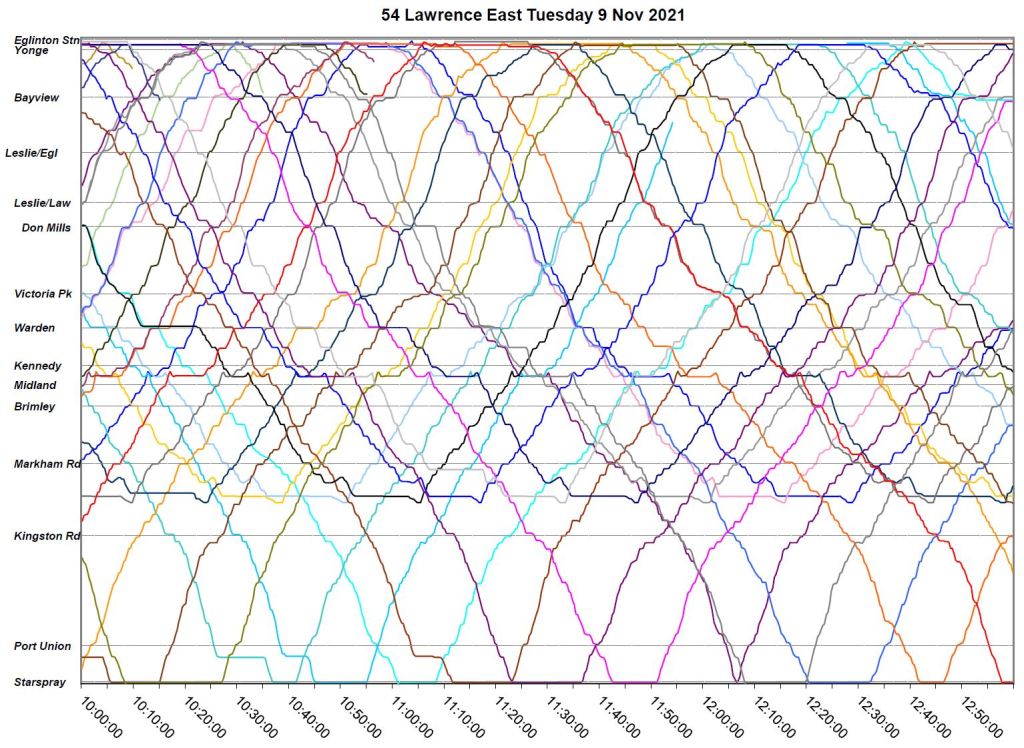
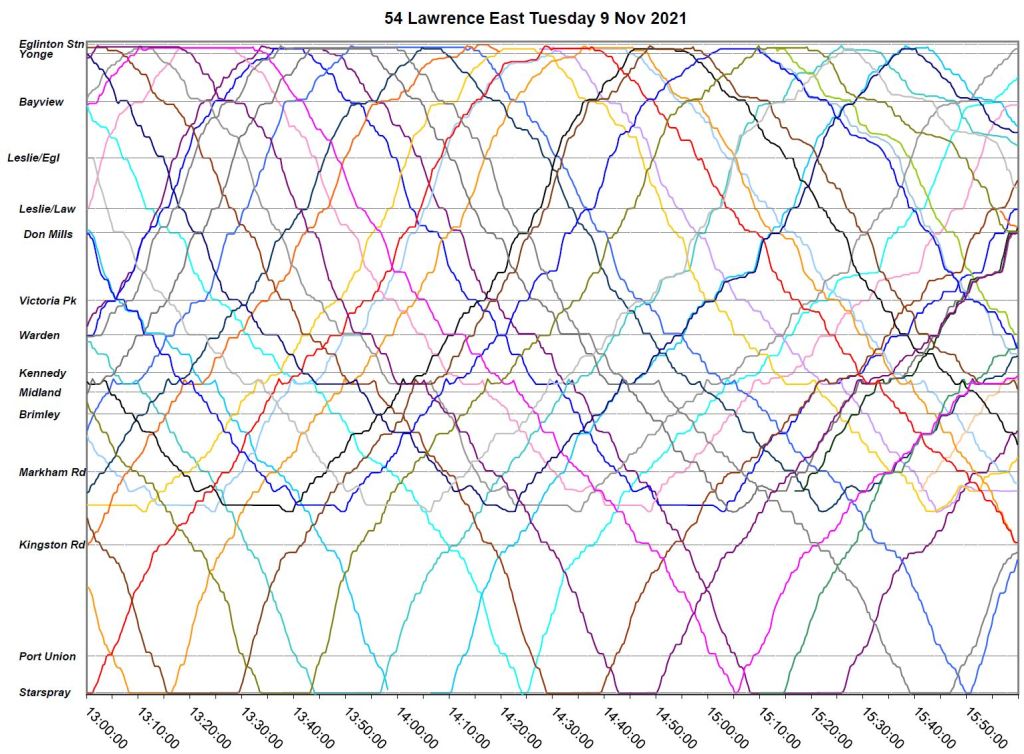
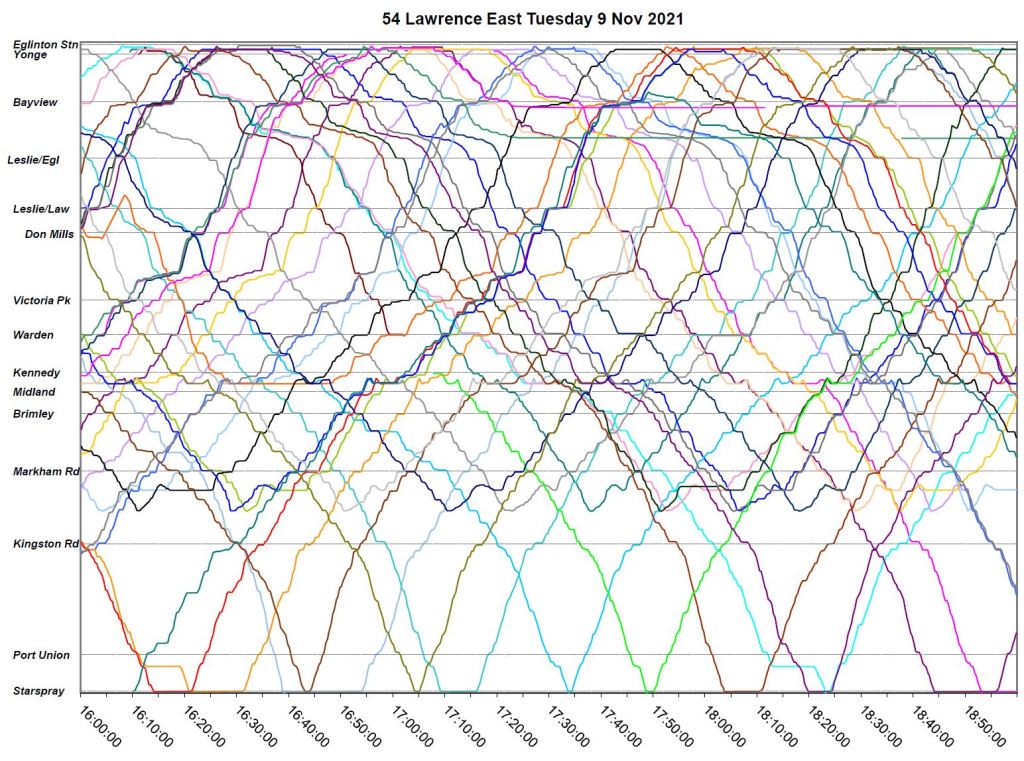
Tuesday, November 9
November 9 is similar to the preceding day with bunching a continued problem.
Wednesday, November 10
By November 10, the delays west of Victoria Park have ended, although bunching continues to be an issue.
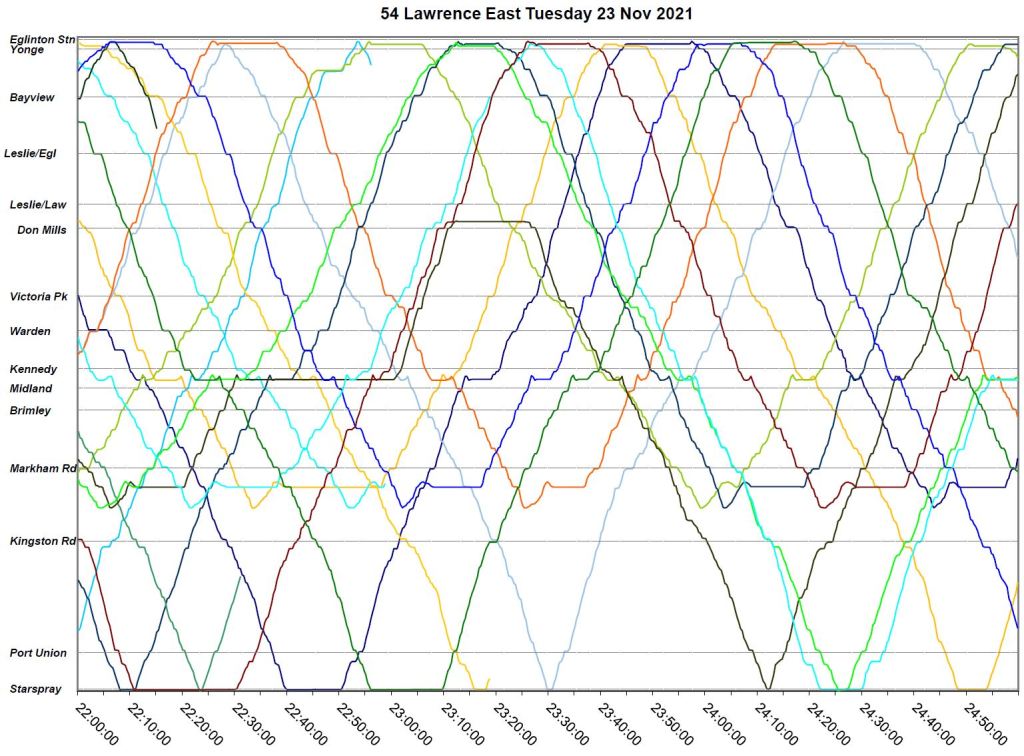
Tuesday, November 23
By November 23, the delay location has shifted to westbound approaching Victoria Park. Bunching continues to be a problem especially in the pm peak and early evening.
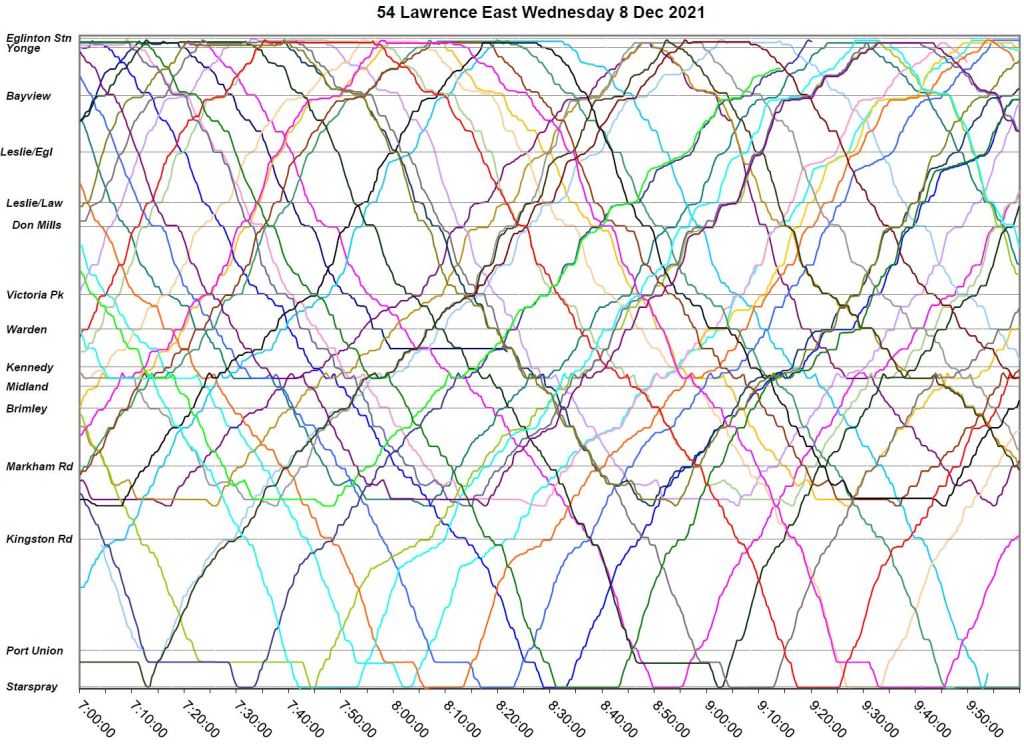
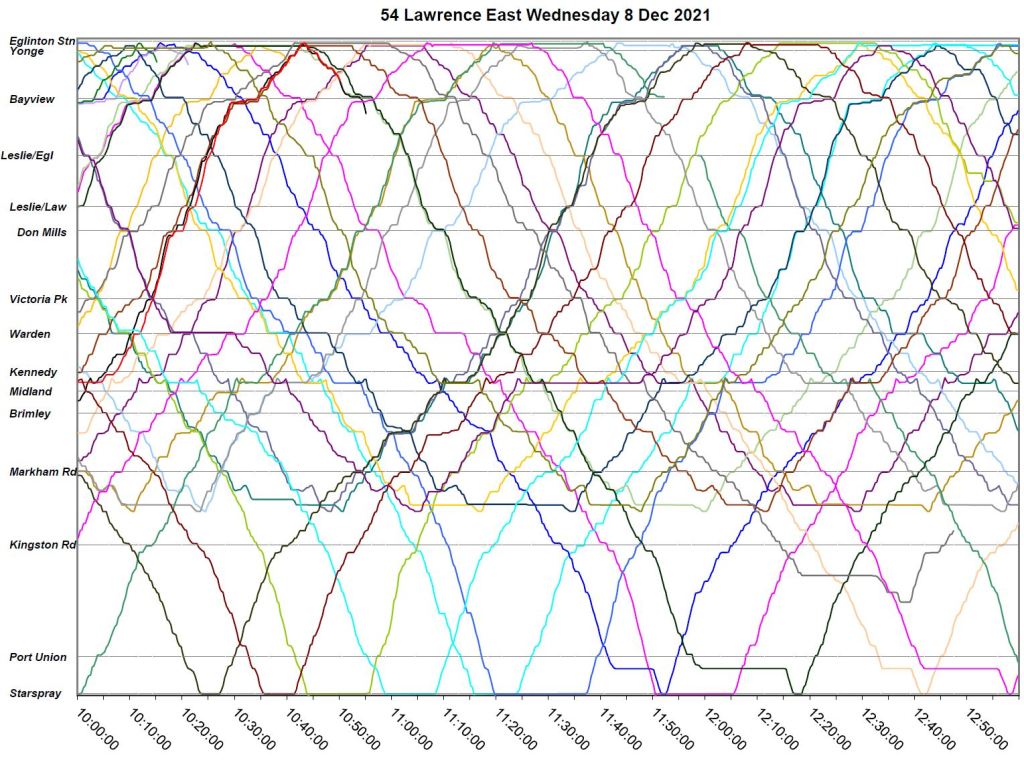
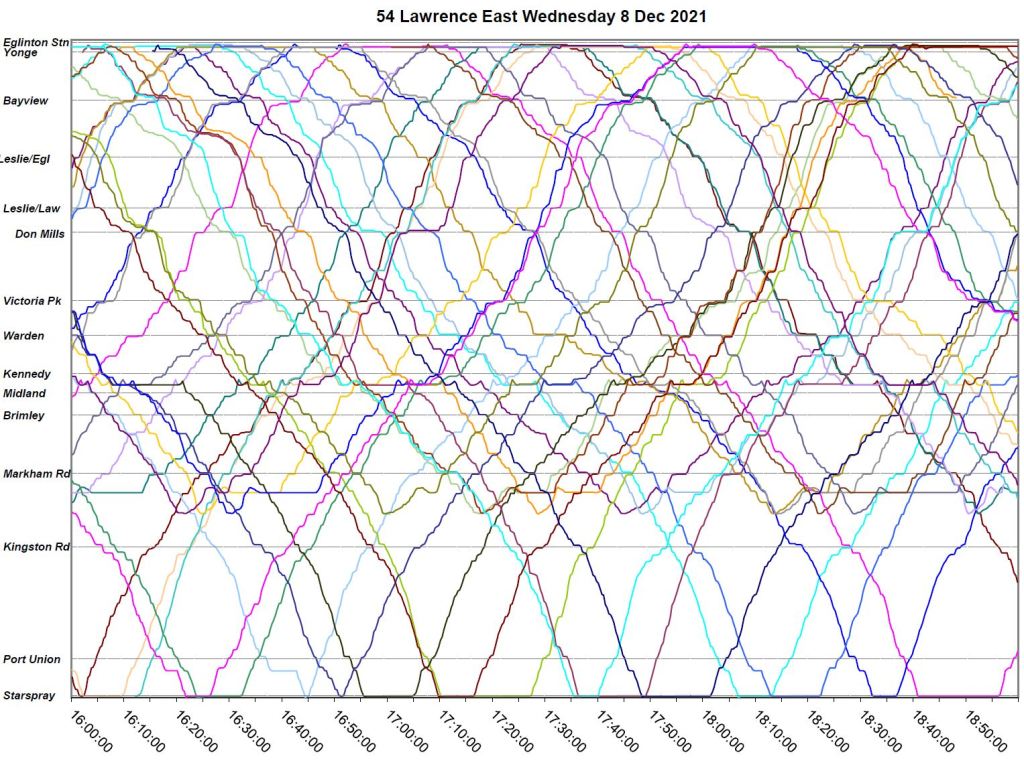
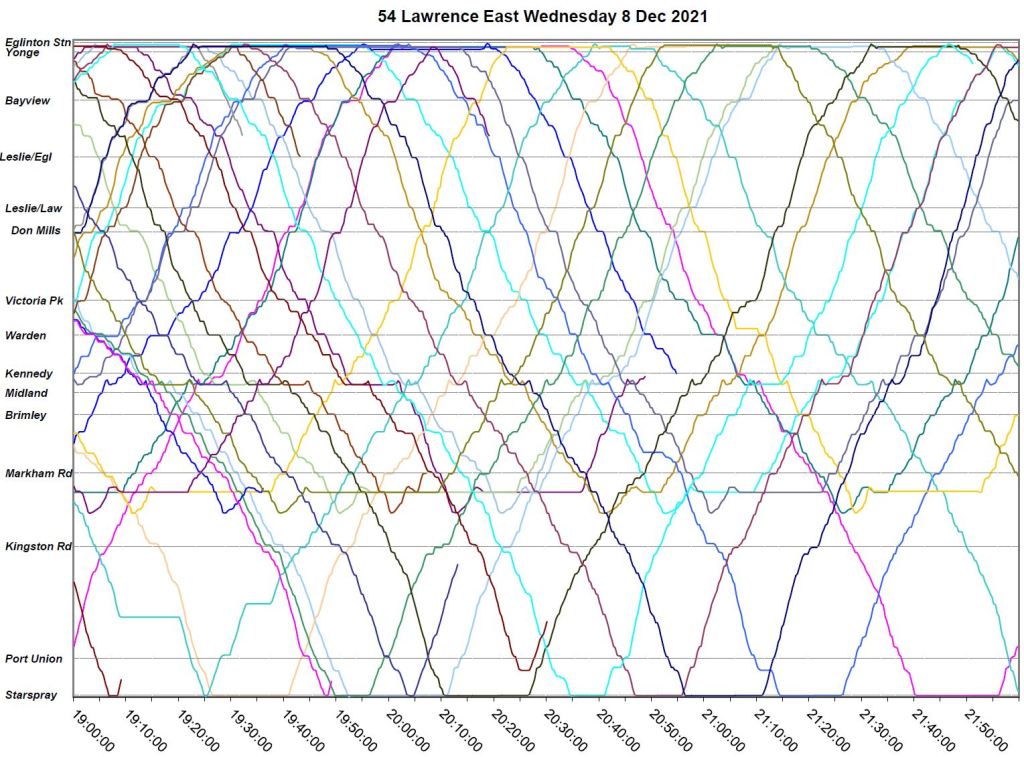
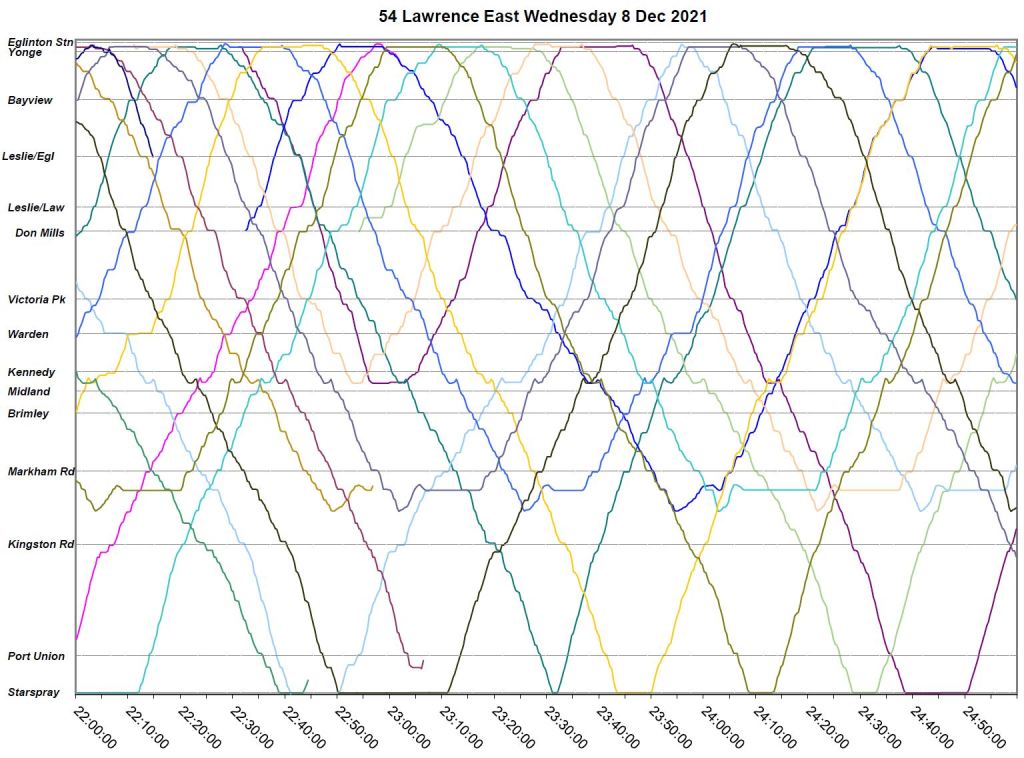
Wednesday, December 8
By December 8, the delays at Victoria Park have vanished, but service continues to bunch.
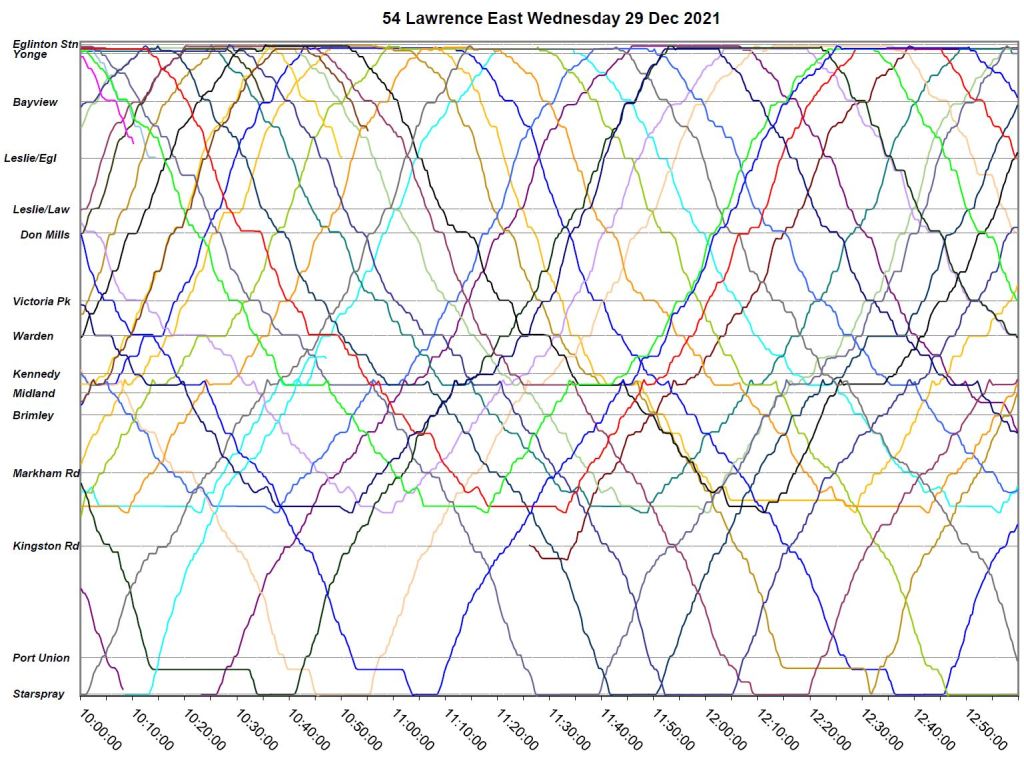
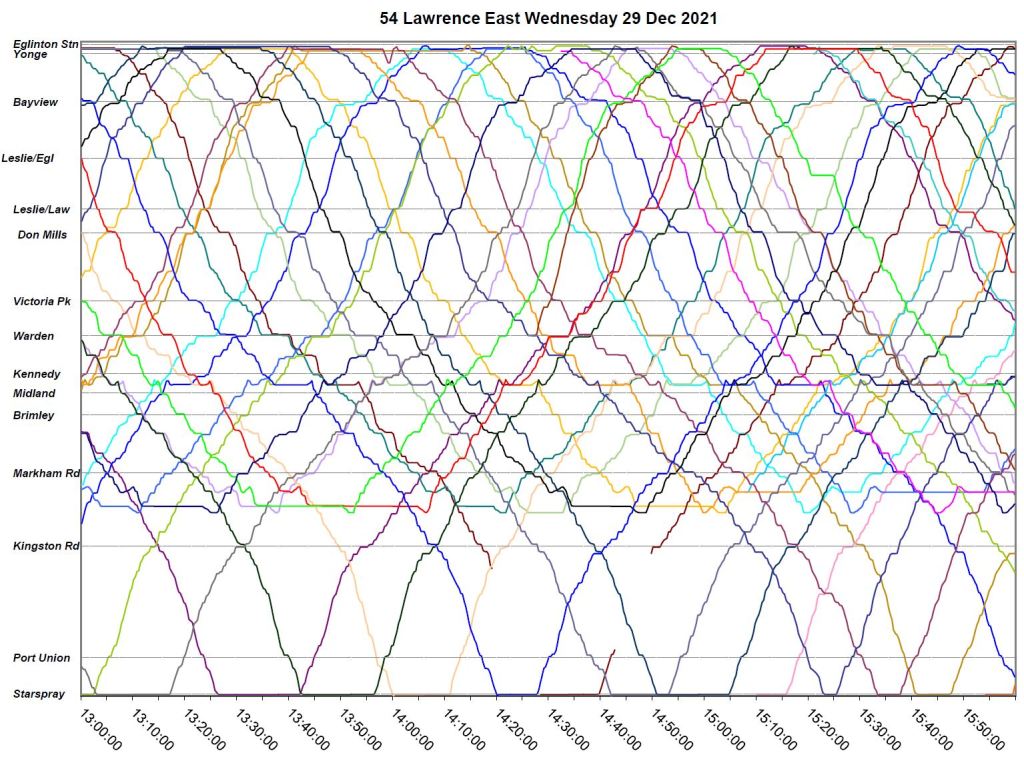
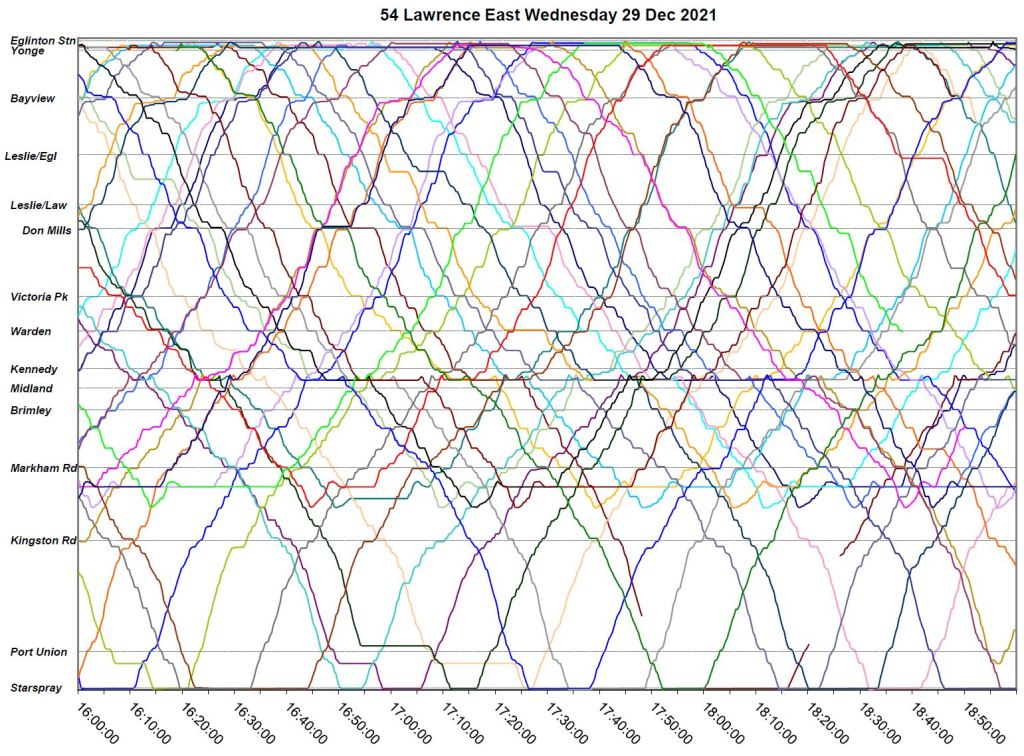
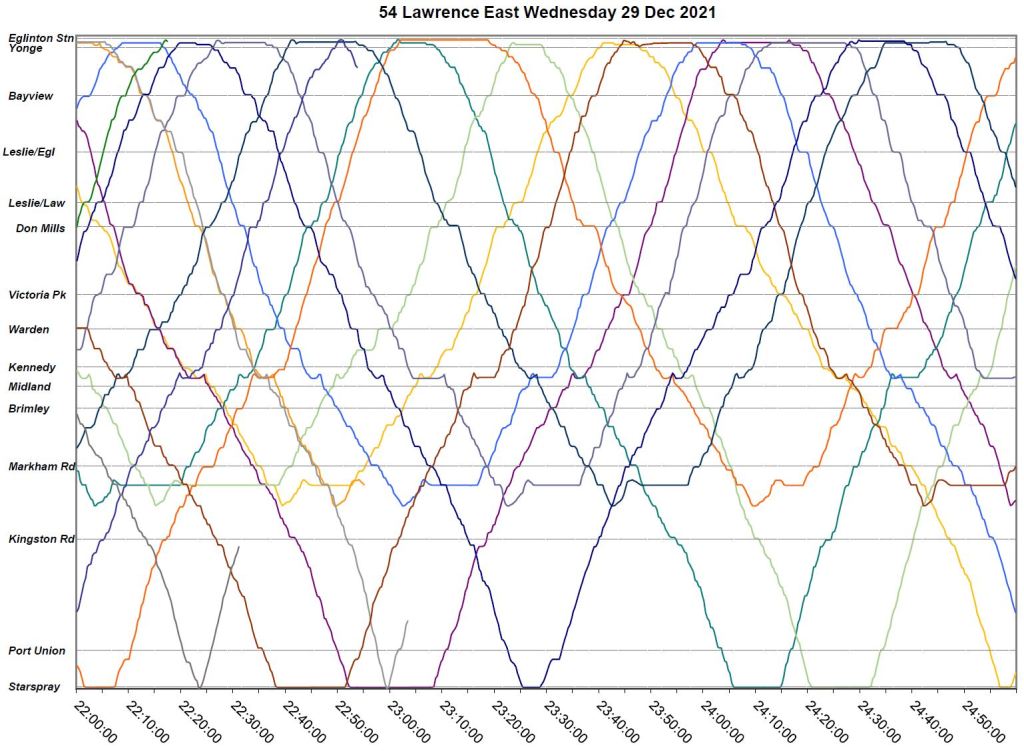
Wednesday, December 29
December 29 falls in a period of lower traffic and the service is more reliable. However, a striking pointis that service westbound from the point where the 54A and 54B services blend is actually spaced rather than running in pairs. (This was noted in the headway reliability discussion earlier.) One cannot help thinking that service was actually managed to produce this rare effect.
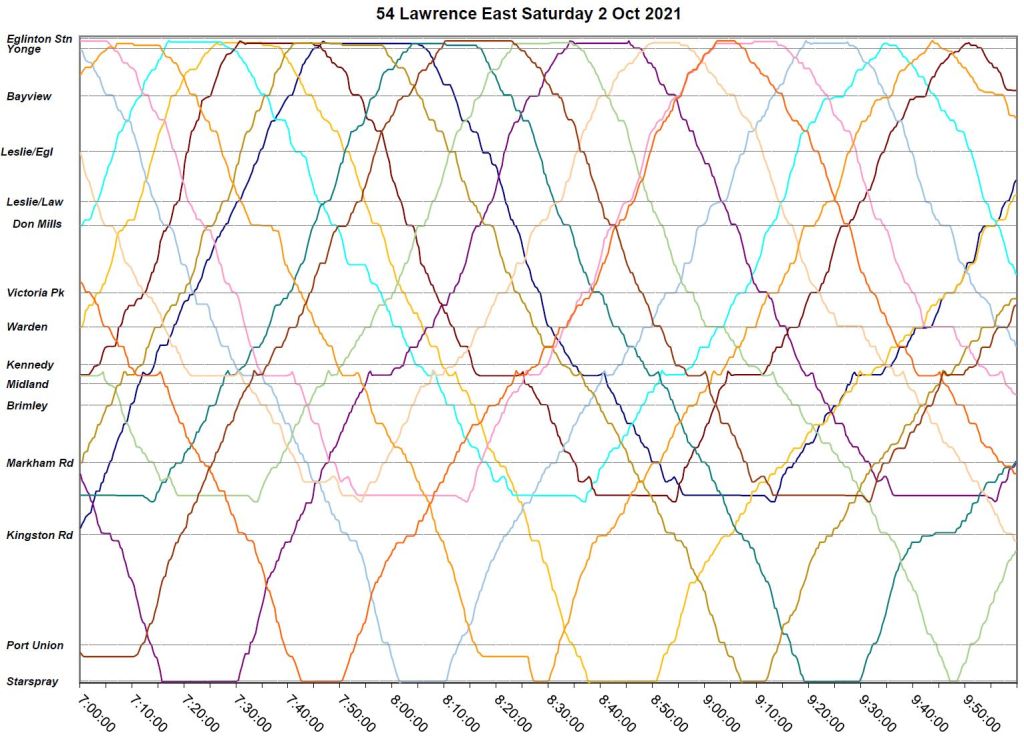
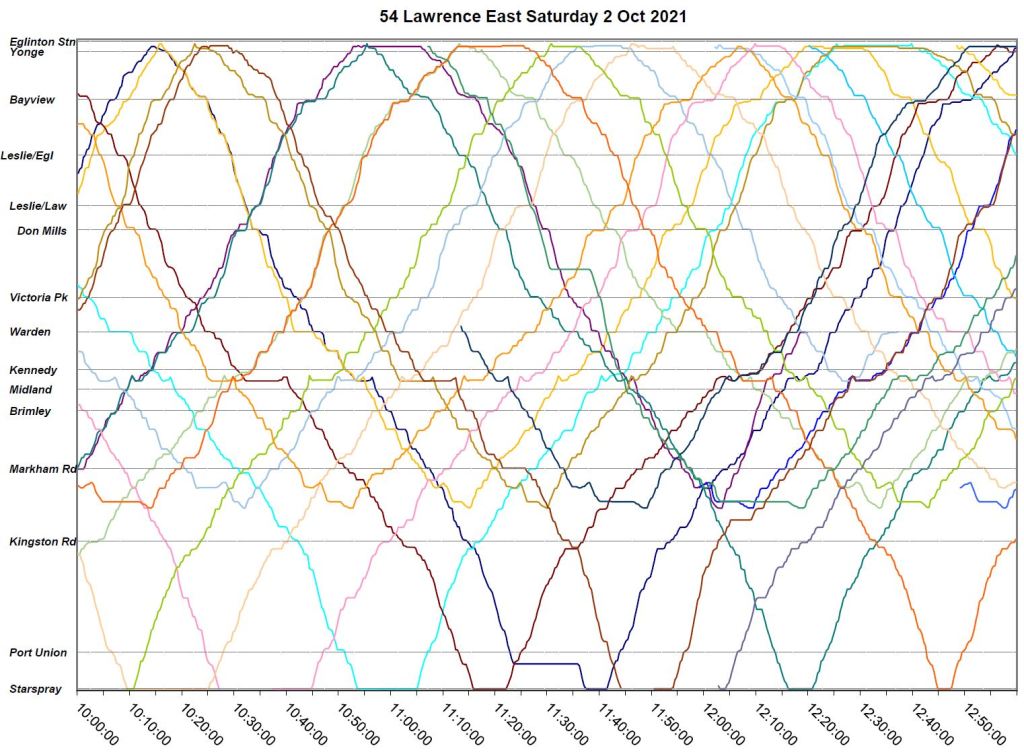
Saturday, October 2
Although there is only minor cases of congestion on October 2, bunching in twos and threes is common, including pairs running to Starspray where scheduled service is not frequent.
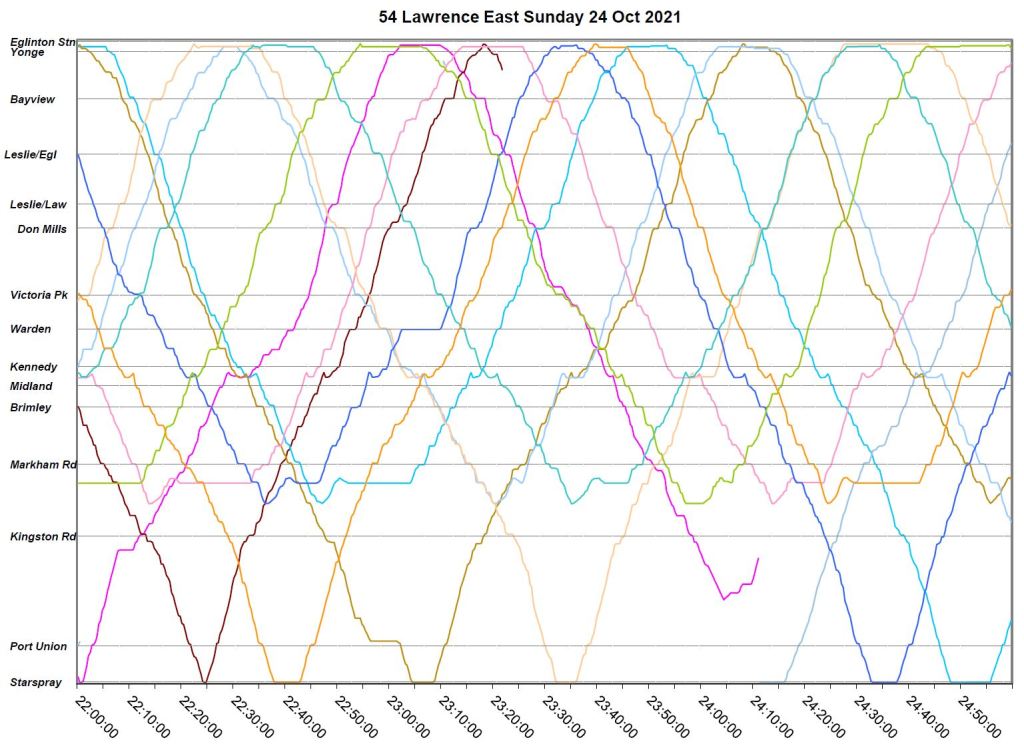
Sunday, October 24
Sunday, October 24 sees the same type of service as the Saturday shown above with buses commonly running together for extended periods including arrival at and departure from terminals.
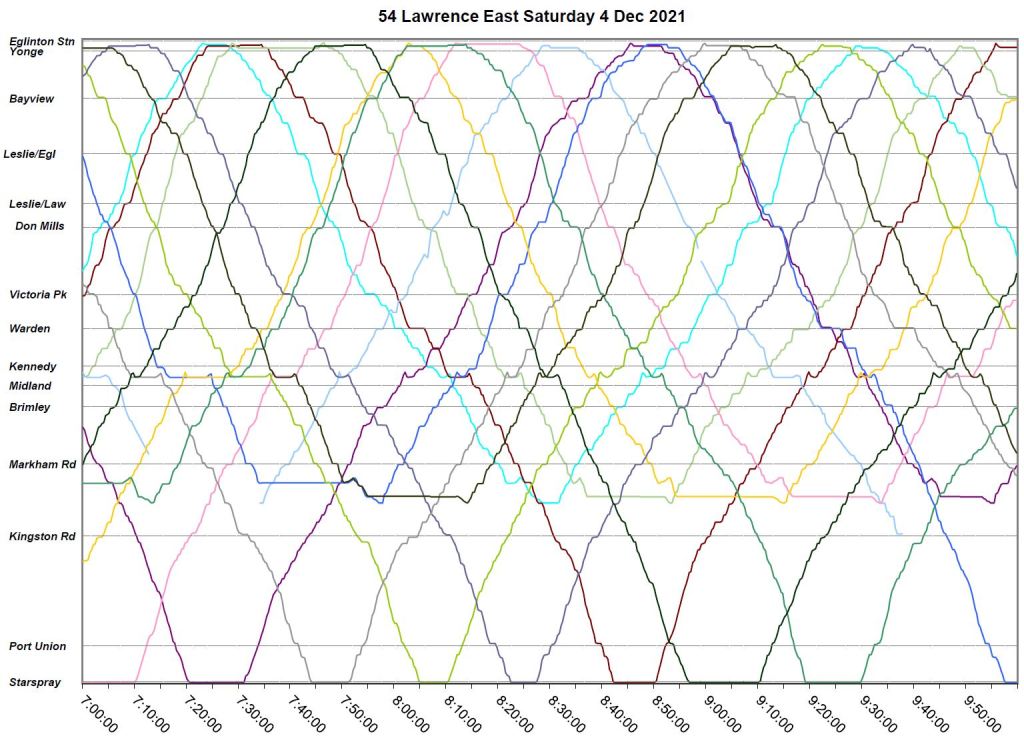
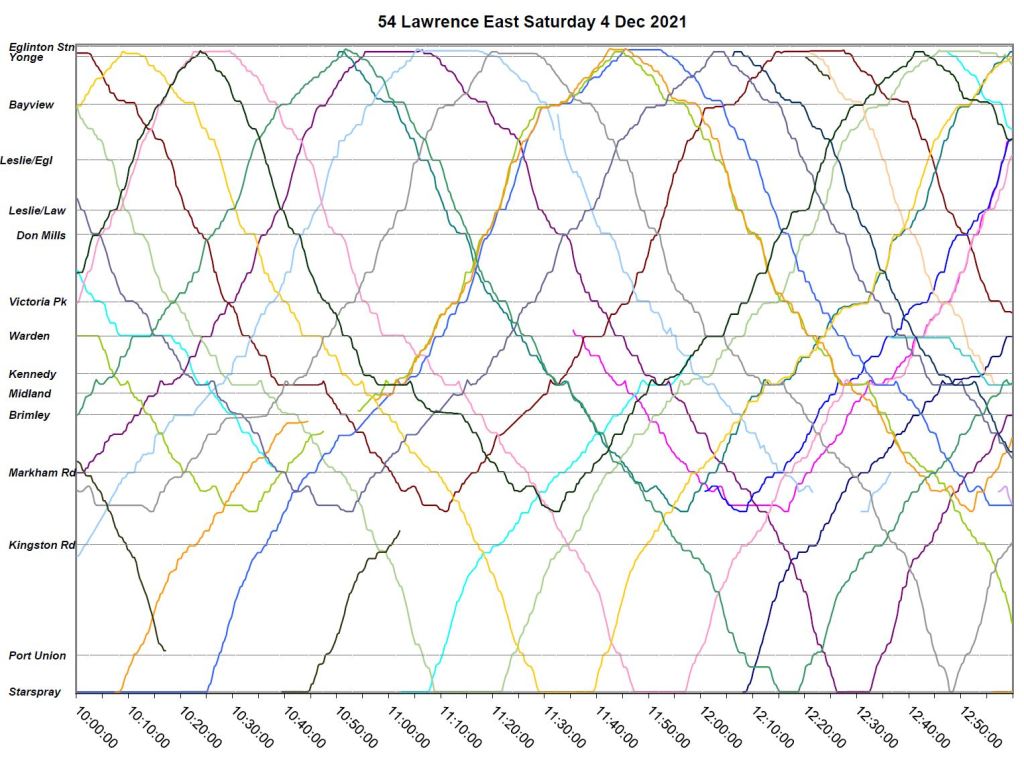
Saturday, December 4
December 4 shows the same problem with bunching that is substantially caused by blending that does not work properly and concurrent departures from terminals.
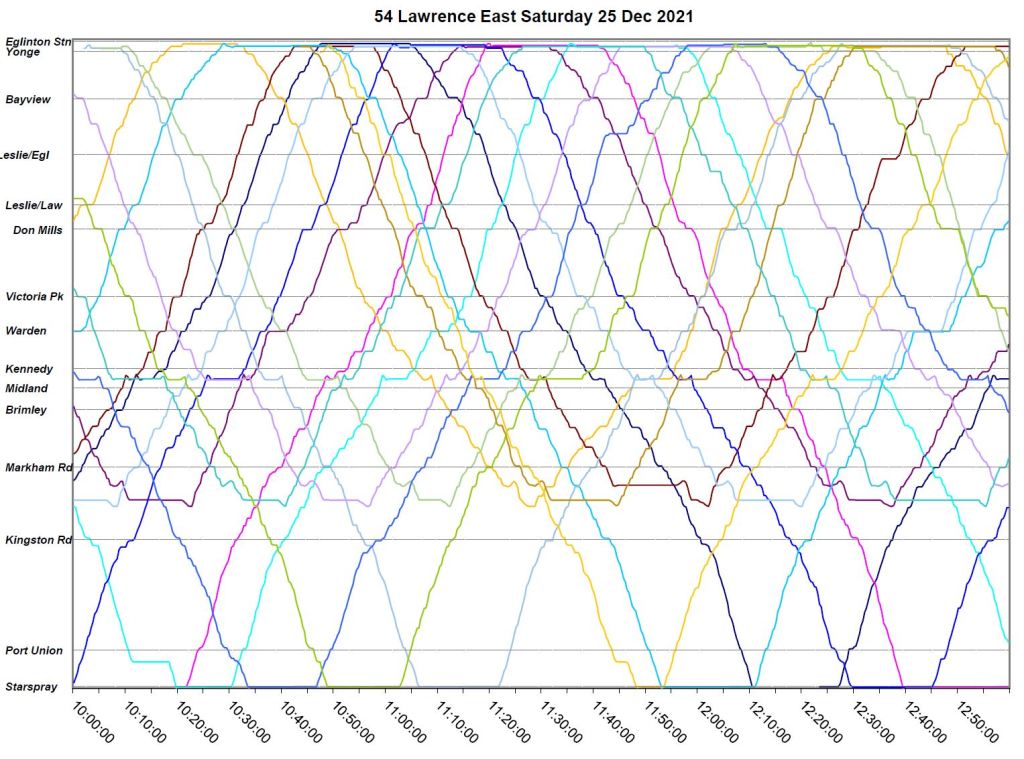
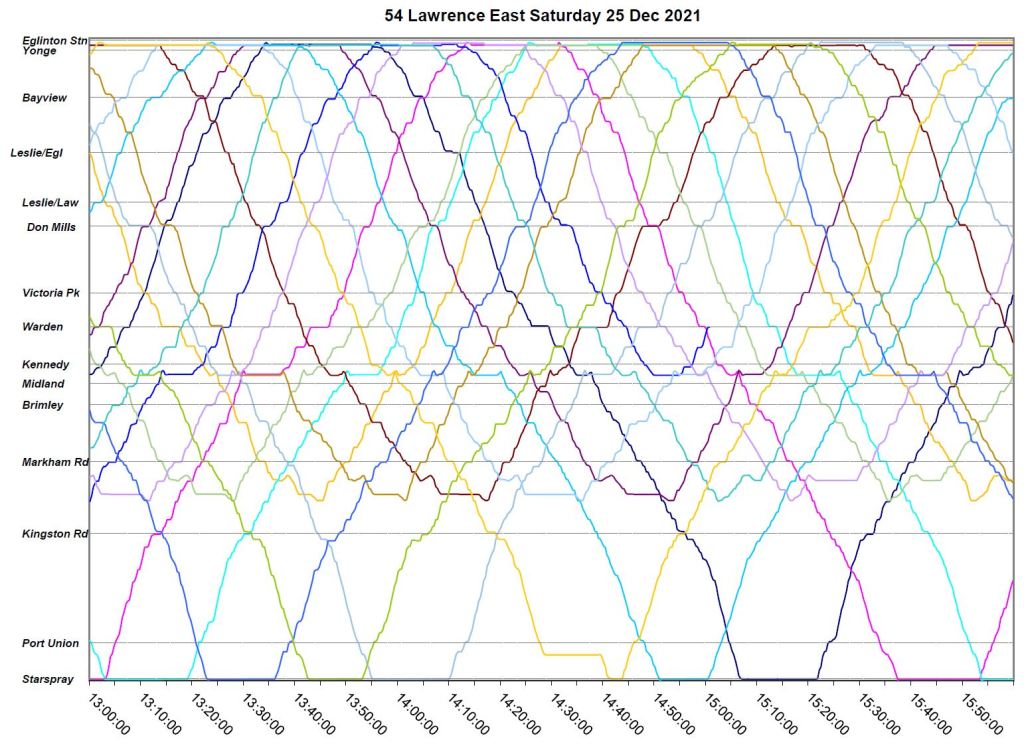
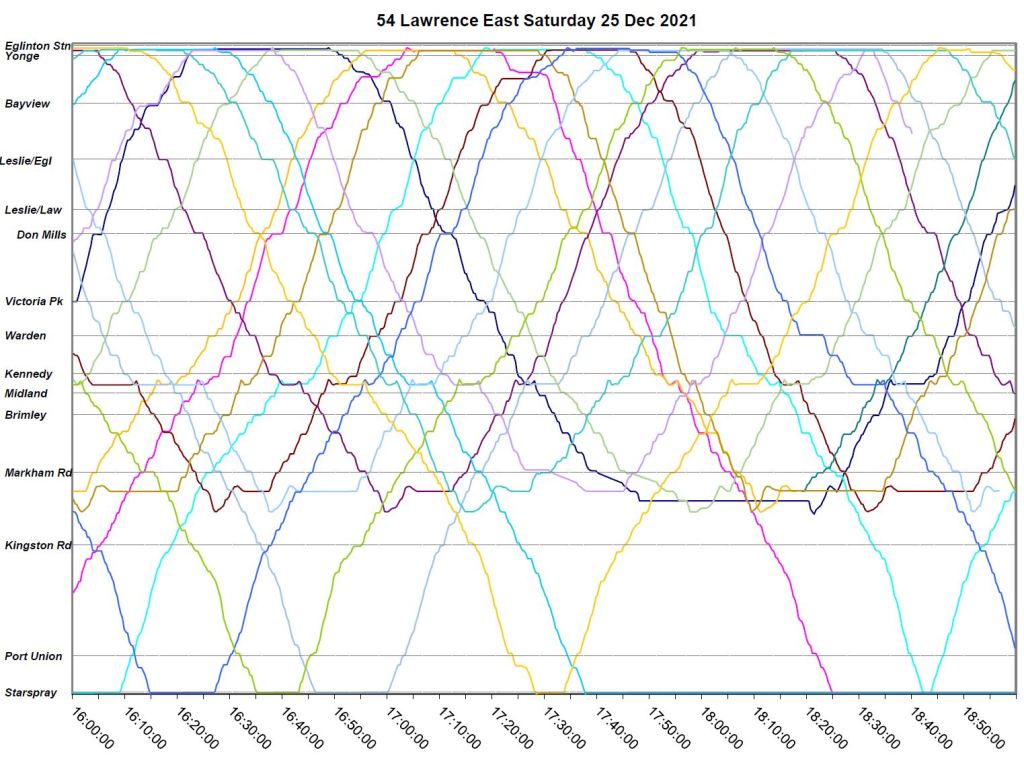
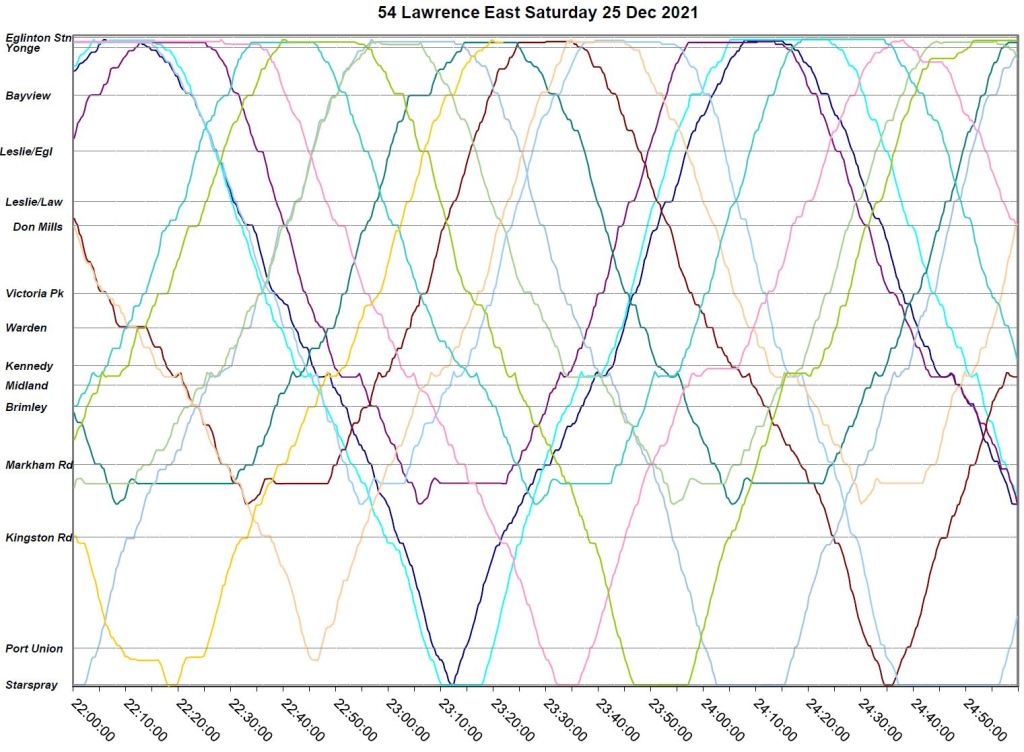
Saturday, December 25 (Christmas Day)
Conditions are rarely better for service than on Christmas Day. There is ample time for layovers at both ends of each trip, but the service still manages to bunch, particularly in the evening.
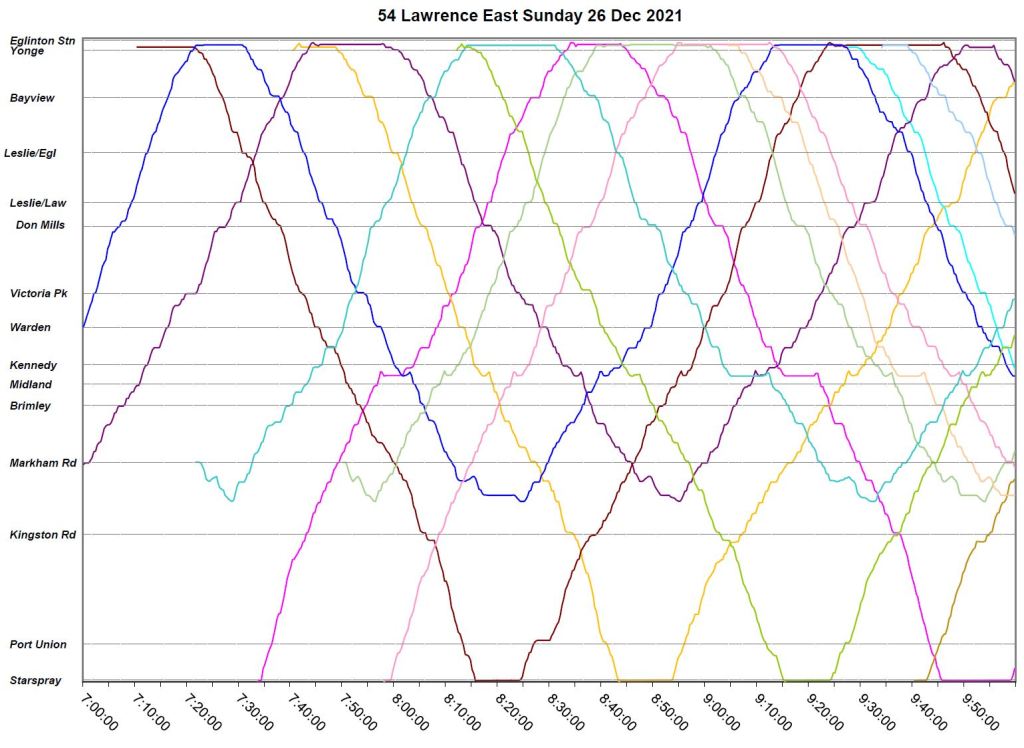
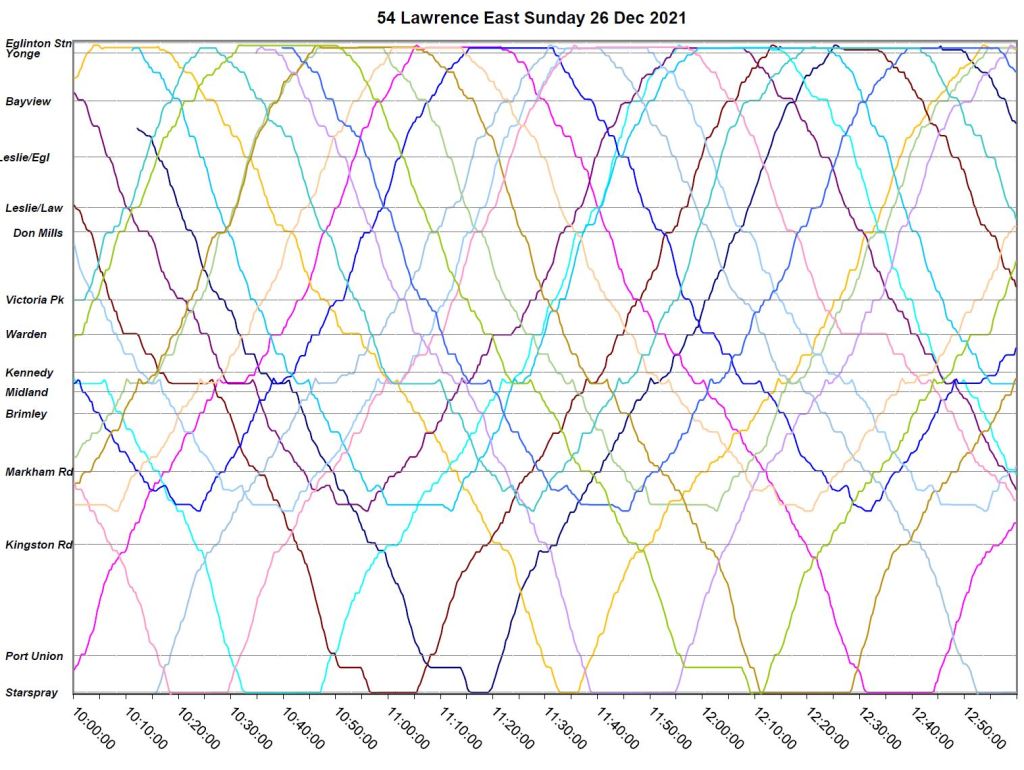
Sunday, December 26
December 26 was not Boxing Day in the traditional sense both because of the calendar and because the usual shopping and associated traffic did not occur. Nonetheless, bunching did occur and, as on many other occasions, there were wide gaps to Starspray Loop. There was certainly no traffic congestion.

Hi Steve, the common theme on all your analysis related to buses is the bunching issue and need for dispatch service. Why isnt the TTC listening? Too difficult to have these conversations with the unions?
Steve: This is a complex question. First off, there is a lot of bad blood with heavy handed discipline of operators by management, and the TTC’s metric is “on time” rather than “well spaced”. Second, I don’t think that the TTC is prepared to address the depth of the problem and their own laissez-faire attitude to service management. Their standards are based on average metrics that they only have to hit part of the time, and it is amazing that they don’t always achieve them. I don’t think anyone involved in creation of those metrics understands how their formula translates to what constitutes “good service”. Add to this that the past two years have been an exercise in just keeping the lights on, and that line management was not exactly well practiced pre-pandemic, and there’s a lot of history.
On the management side, the big issue a few years back was short turns, and the entire approach to scheduling and to management was to avoid them, or at least to under-report them, at all cost to make the stats look good. This was done at the cost of padded running times and glacial operation or long layovers on routes. But Rick Leary got a big gold star because short turns went away. Past practice had been too generous short turning cars that could well have made a full trip, but the pendulum swung too far the other way. Now it is common in the service charts to see bunches of vehicles that go back and forth across the city with no attempt to space the service.
It is ludicrous that some operators precipitate bunching by their operating style, and equally that management does not address this bunching by actively sorting out the service.
LikeLiked by 2 people
I’m still waiting for the May 8, 2022 board period TTC changes details. Do you know when it will come out and what changes are being proposed for that board period?
Steve: The Scheduled Service Summary is up already here. There was a delay in sending out the detailed memo, and I expect to see it soon at which point I can build the usual article.
LikeLike
Thanks for the link. The TTC seems to be unorganized with it’s website nowadays.
LikeLike