
On January 17, 2022, a record snowfall hit the Toronto area. Yes, this is Canada, and it does snow here, although people who live in areas without the moderating effect of Lake Ontario rarely have much sympathy on that score.
A post mortem report on the event will be discussed on March 29, 2022, at the Infrastructure & Environment Committee. As the City’s report on the event summarizes:
On January 16-17, 2022, the City of Toronto experienced an extraordinary winter storm that involved extreme cold temperatures, very rapid snowfall, and an ultimate snow accumulation of 55 centimetres in just 15 hours. The below freezing temperatures that followed the storm and lasted for more than two weeks created a unique set of challenges for storm clean up.
The effects on transit routes were severe, and there was little or no service on parts of the network for an extended period.
Snow clearing took a very long time:
Ultimately, 179,442 tonnes of snow were removed from 3,471 km of roads, requiring almost 60,000 truckloads. Removal was conducted over a 30-day period; however, operations were suspended when additional snow events occurred, meaning snow was removed on a total of 23 non-consecutive days.
Toronto’s snow clearing practices tend to focus on major streets and often do not include physical removal of snow. This effectively narrows roads and limits their capacity until the snowbanks eventually melt. A history of warmer winters and fewer severe storms has contributed to a somewhat laissez-faire relationship to winter that failed Toronto in 2022.
The report speaks to several changes in approach to major storms that will be implemented in early 2023, and I will not go into these here beyond noting the effect on transit.
Two related problems do leap out.
First, the responsibility for various aspects of snow clearing fall to different groups. Roads and sidewalks were plowed by multiple contractors. Sidewalks were, until this year, the responsibility of property owners, but the city’s fleet of sidewalk plows was not yet at full strength, and subject to breakdowns. Bike lanes might or might not be plowed especially if they are simply painted and have no protective barriers.
The result is both a “who does what” clash and a war for space where snow can be dumped before it is carted away, if ever.
Second, the reduction in road capacity causes congestion both by taking lanes out of service, and by parked cars, to the extent motorists can navigate the snowbanks, encroaching beyond the curb lane. This is a particular problem on streetcar routes, but is not confined to them.
Plowing, when it does occur, may not be accompanied by aggressive towing, or at least by temporary relocation of parked cars so that the curb lane can be fully cleared.
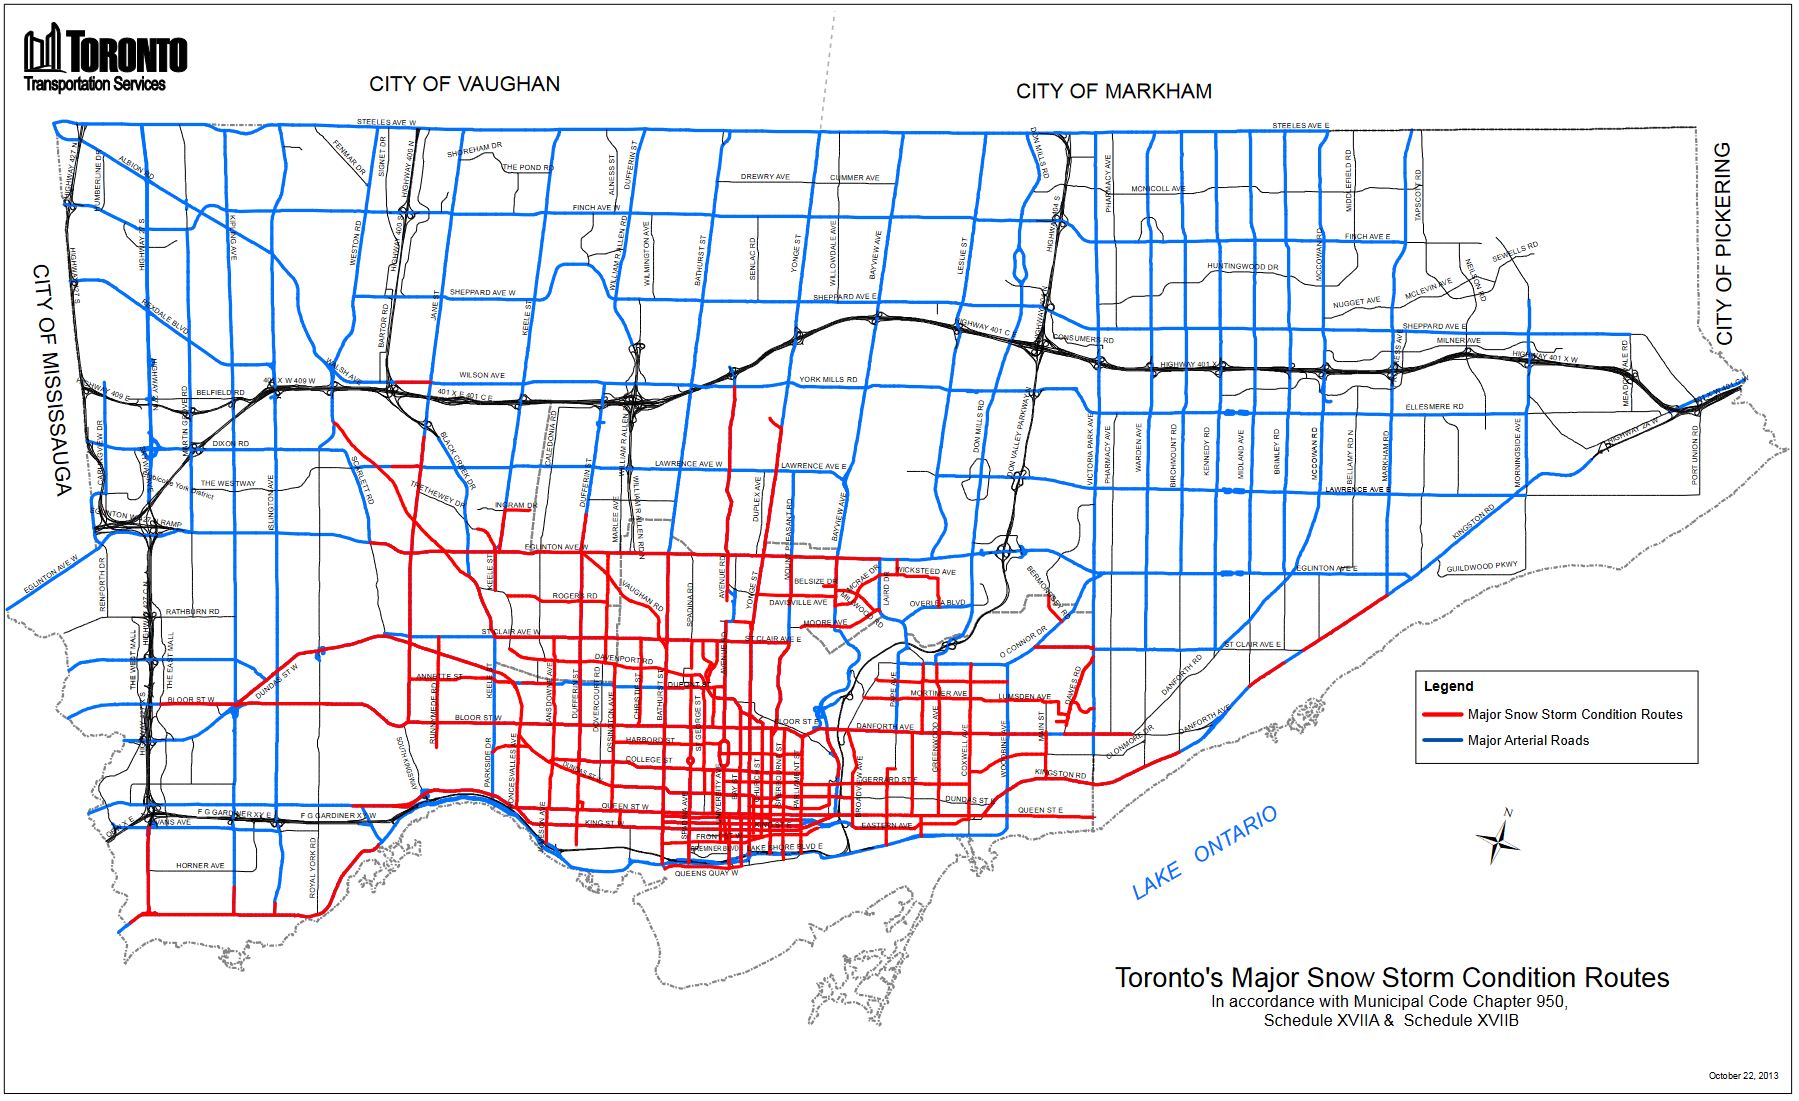
Toronto has a network of designated snow routes for major snow events. Most of the territory it covers is in the old City of Toronto with some outlying areas. When a major storm condition is declared, parking is banned for 72 hours (or more if need be) on the streets shown in red below. Most of the suburban city is not included.
The map below is dated October 2013, and it is due for updating especially if Toronto plans to be serious about the quality of transit service and meaningful schemes for transit priority across the city.
In Brief
The major snowfall on January 17 disrupted transit service, and the effects continued for a few weeks after the event. In some cases, buses had not returned to “typical” pre-storm travel times into February.
The location of congestion problems on routes reviewed here was not distributed along them a a general delay, but could be found at specific locations and times where the effect was “net new” after the storm. This suggests that a detailed study of storm delays will reveal key locations and conditions that should be avoided in the future.
On Dufferin, a major location for delays was northbound to Yorkdale Mall, and this persisted for some time after the storm. Normally, problems on routes like this are assumed to arise from their hilly nature, but that was not always the case in late January.
Service on 29 Dufferin
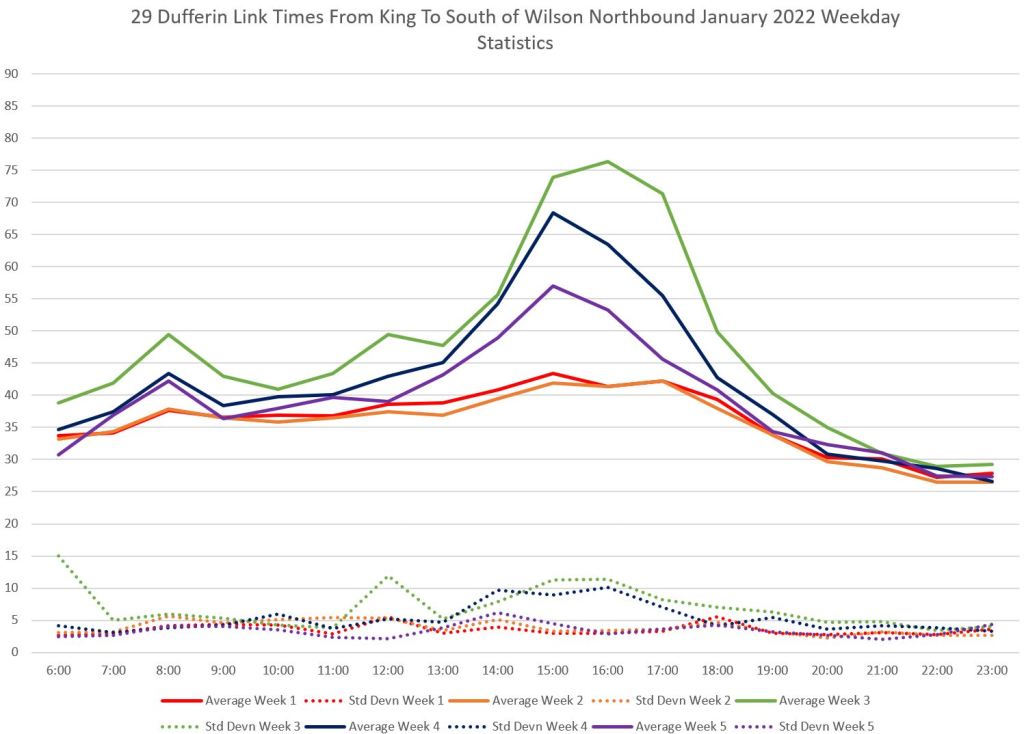
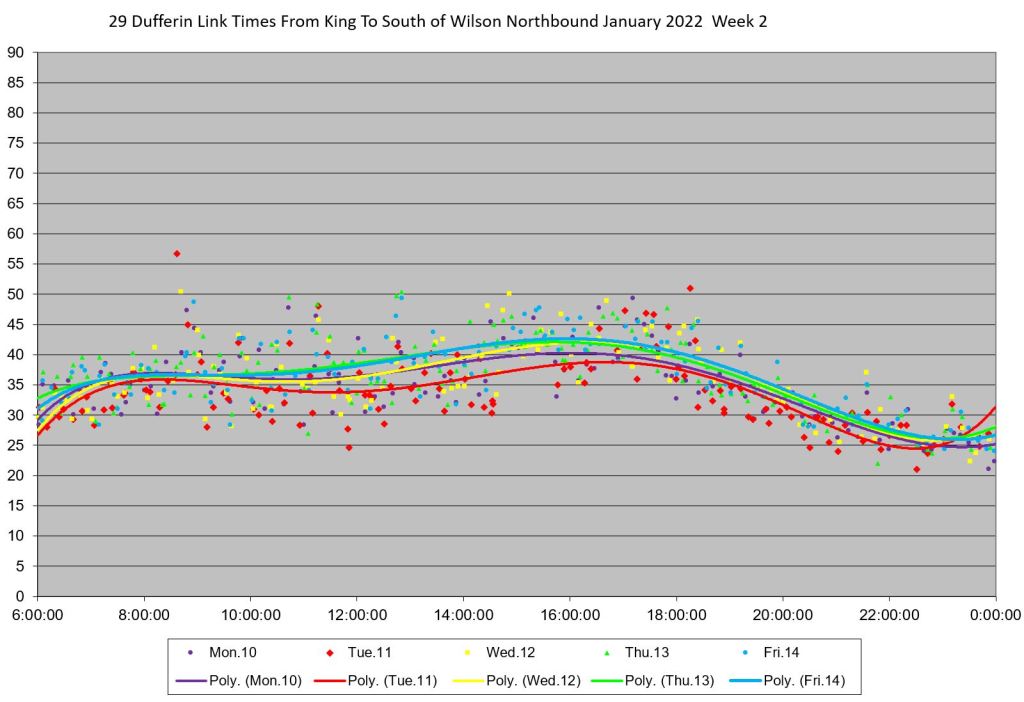
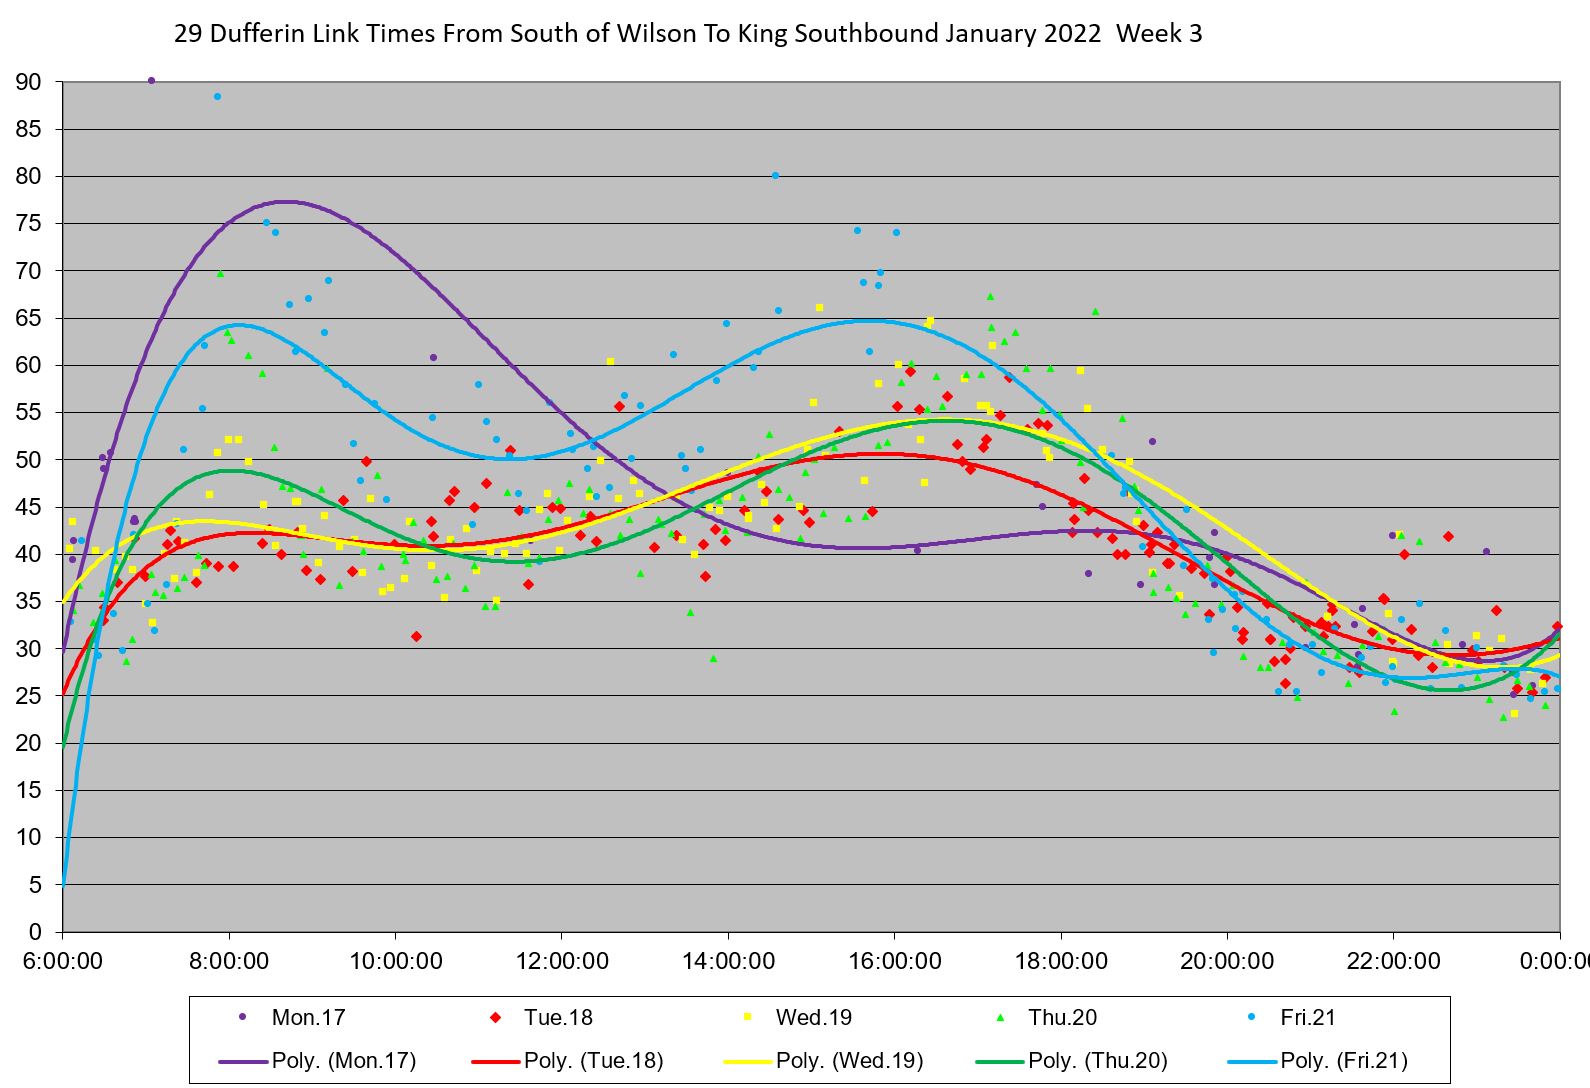
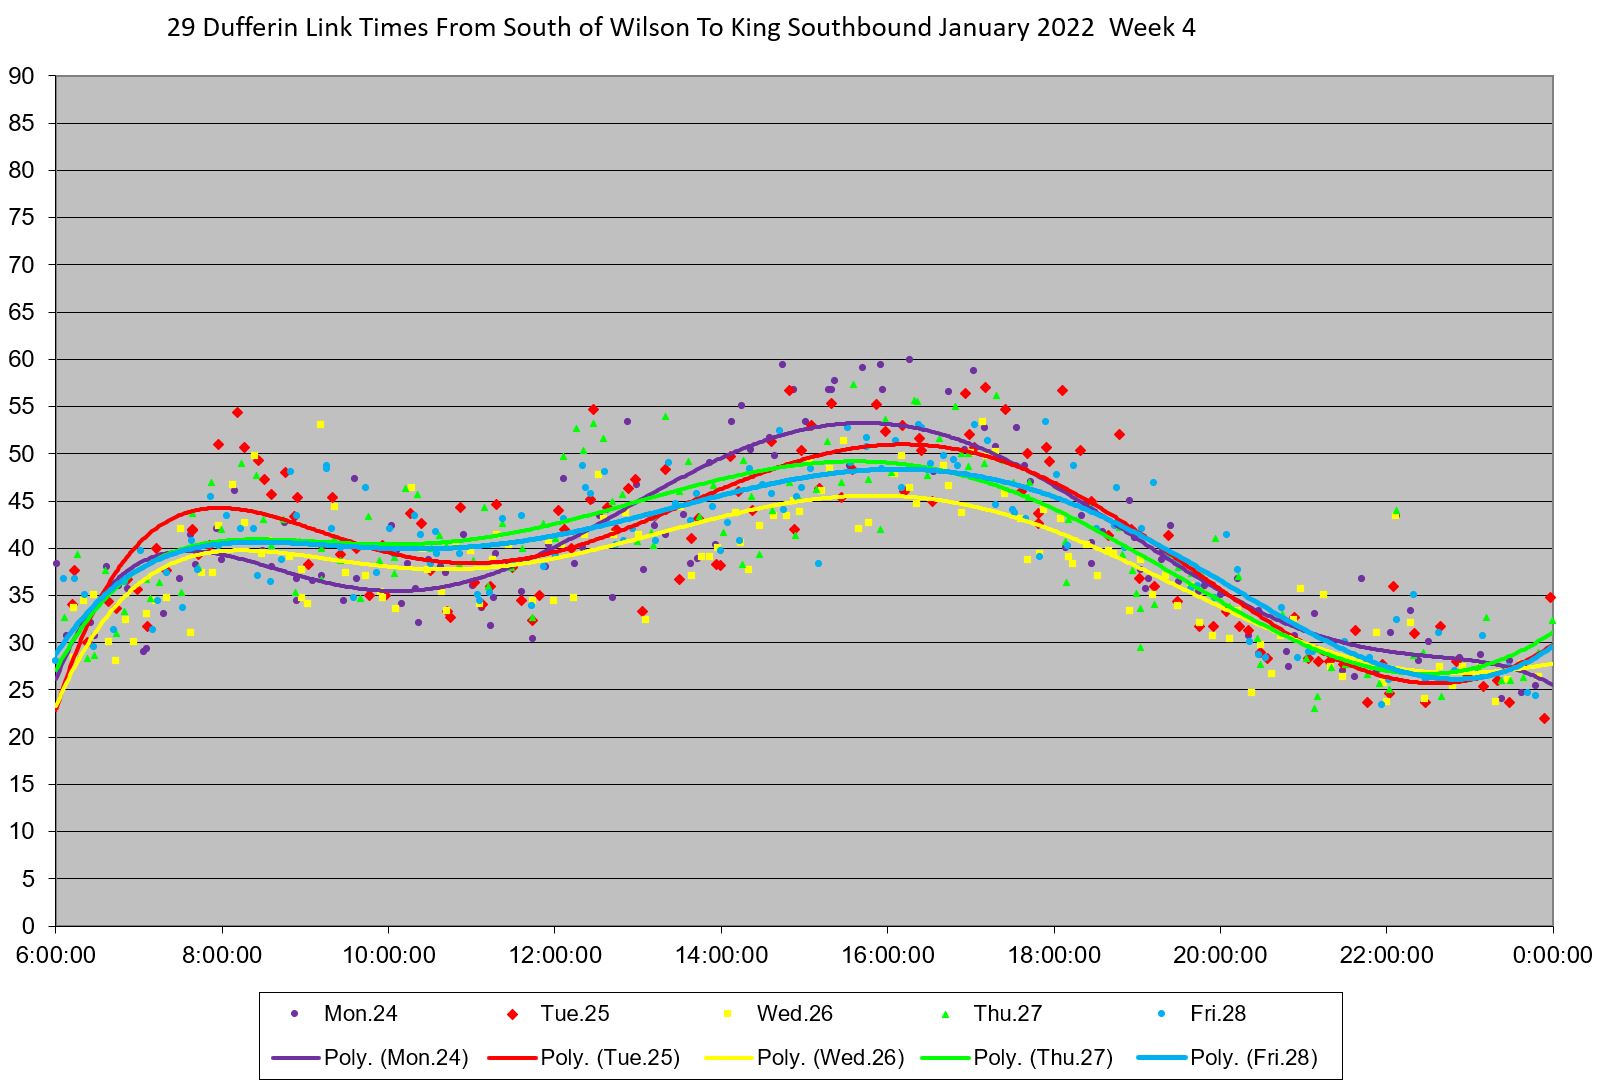
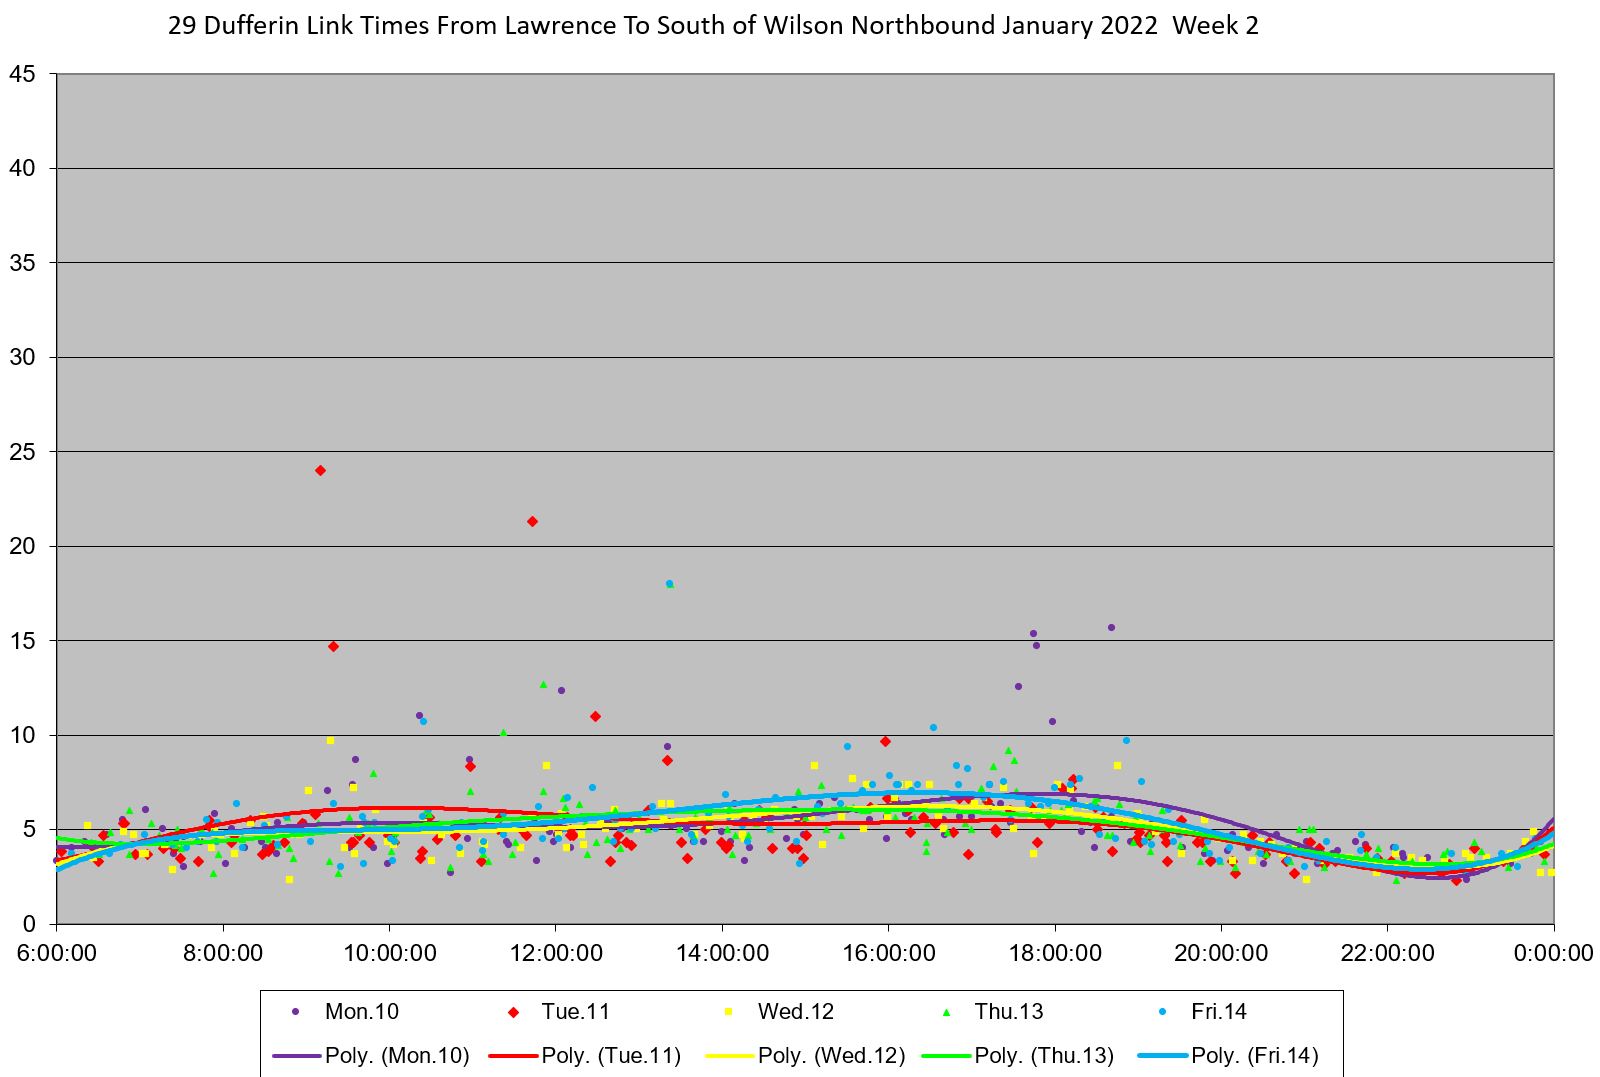
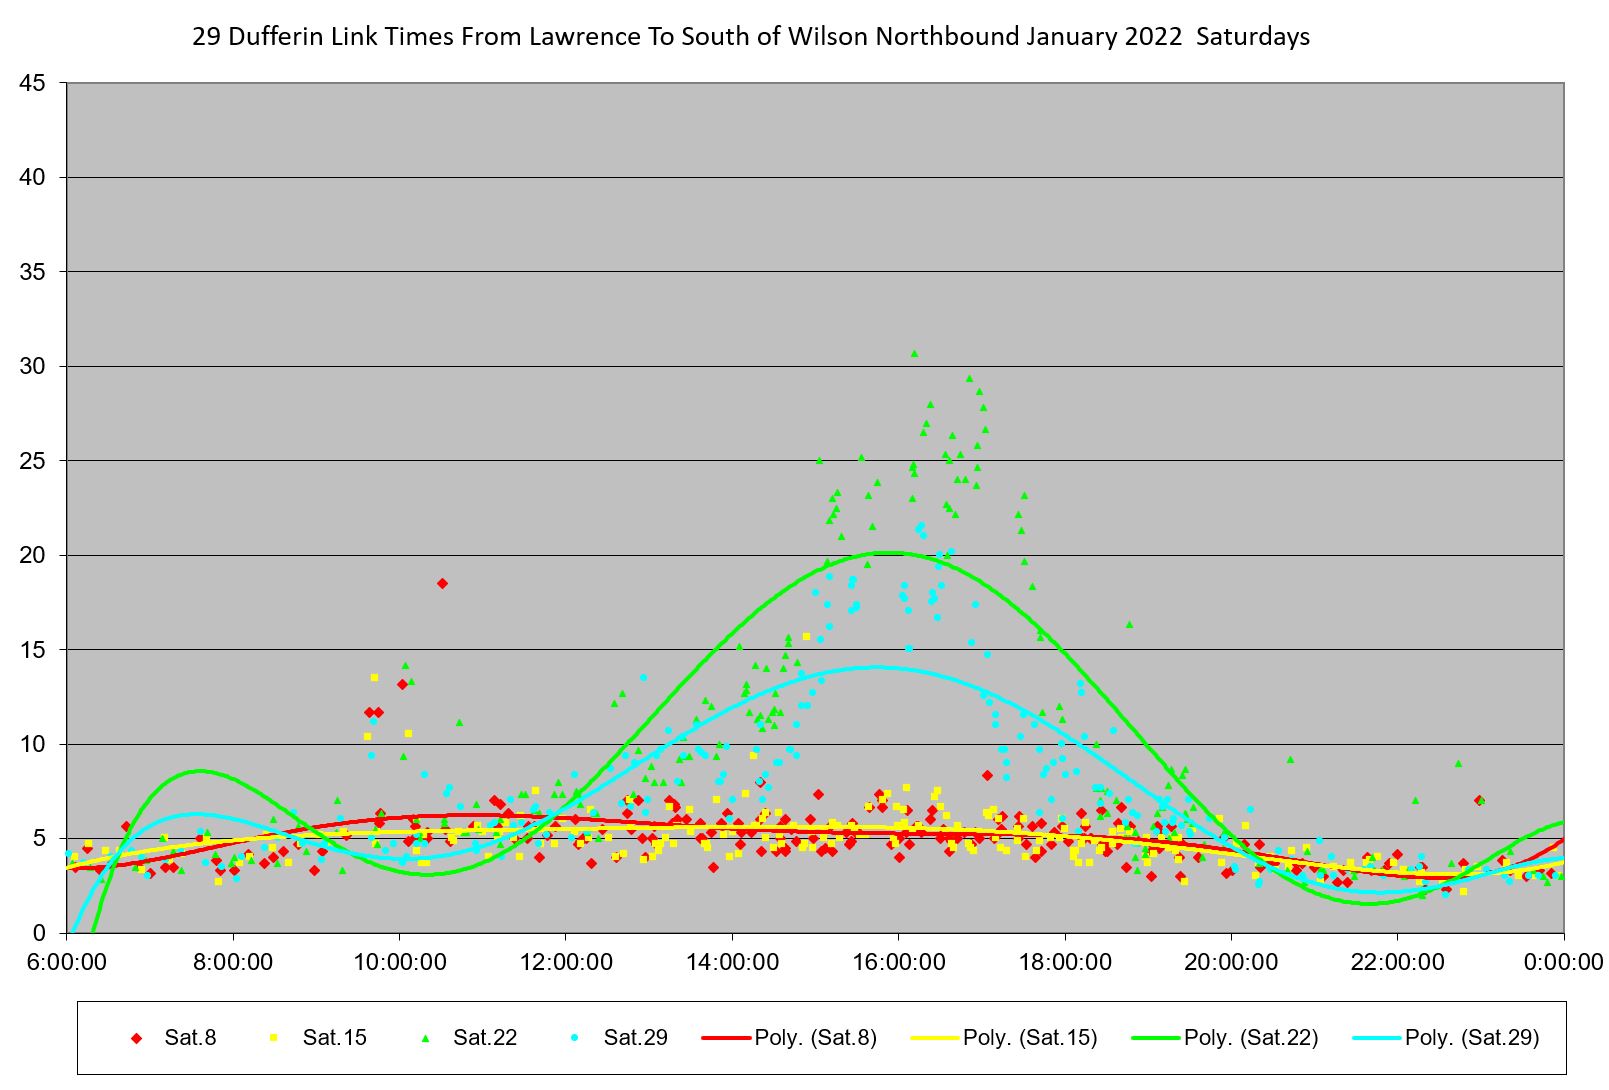
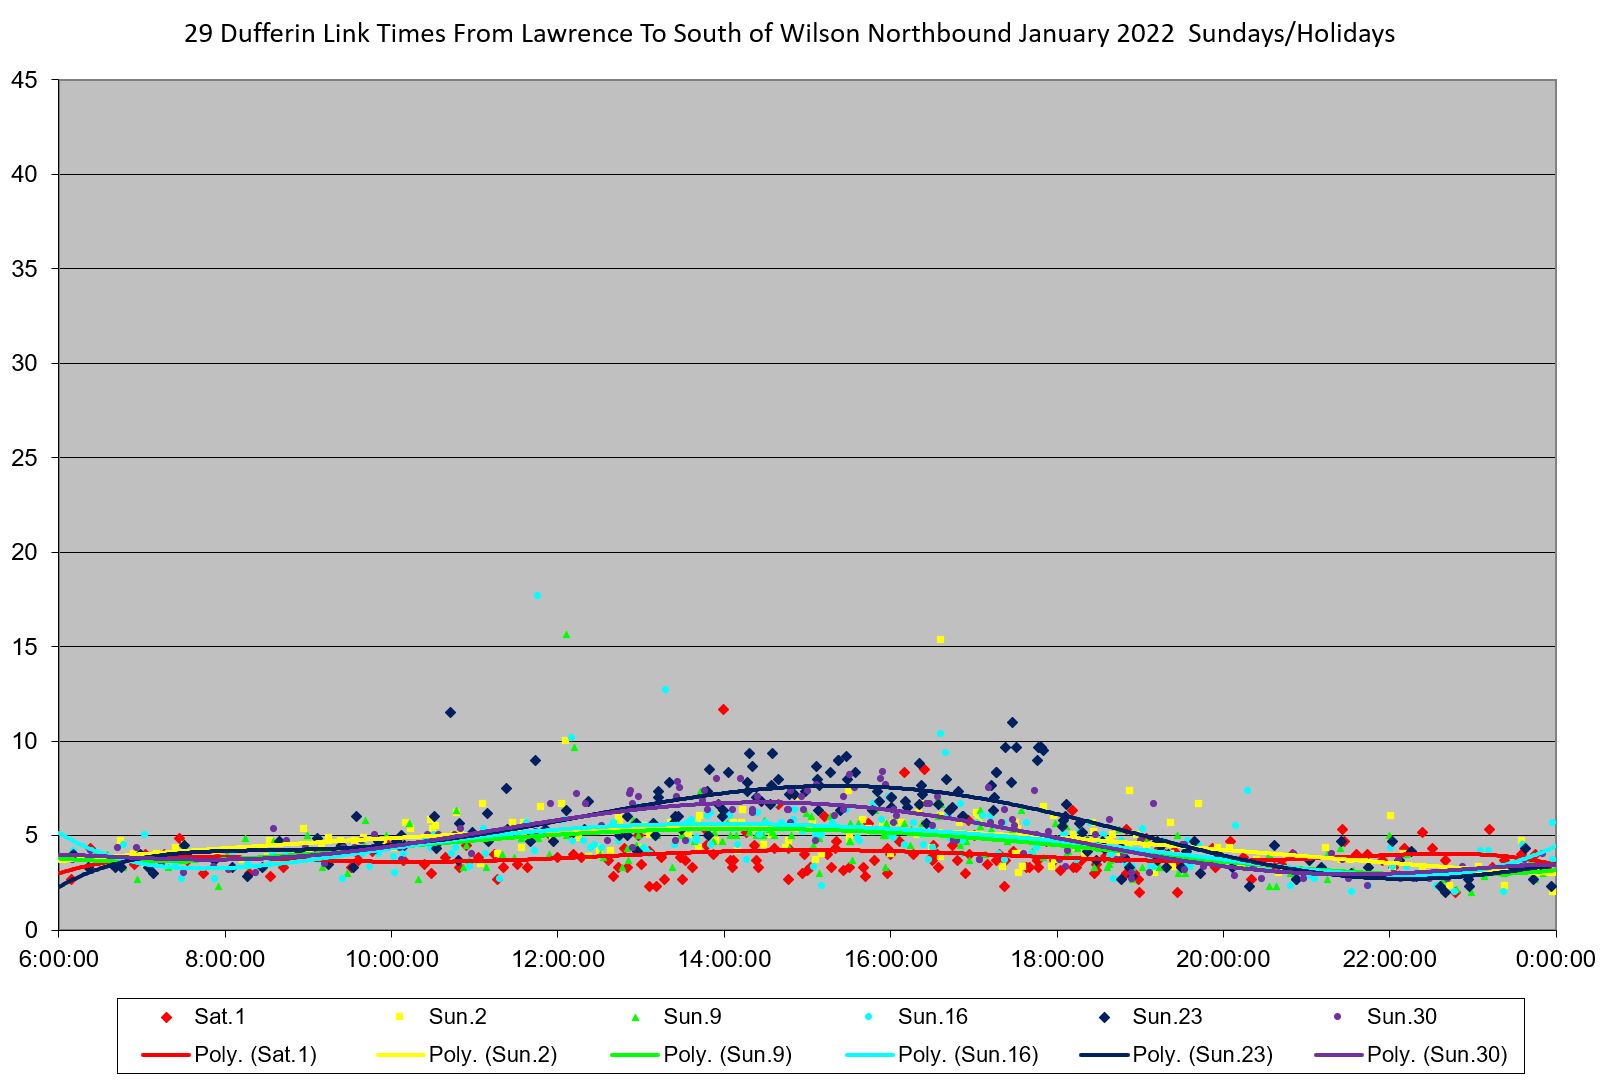
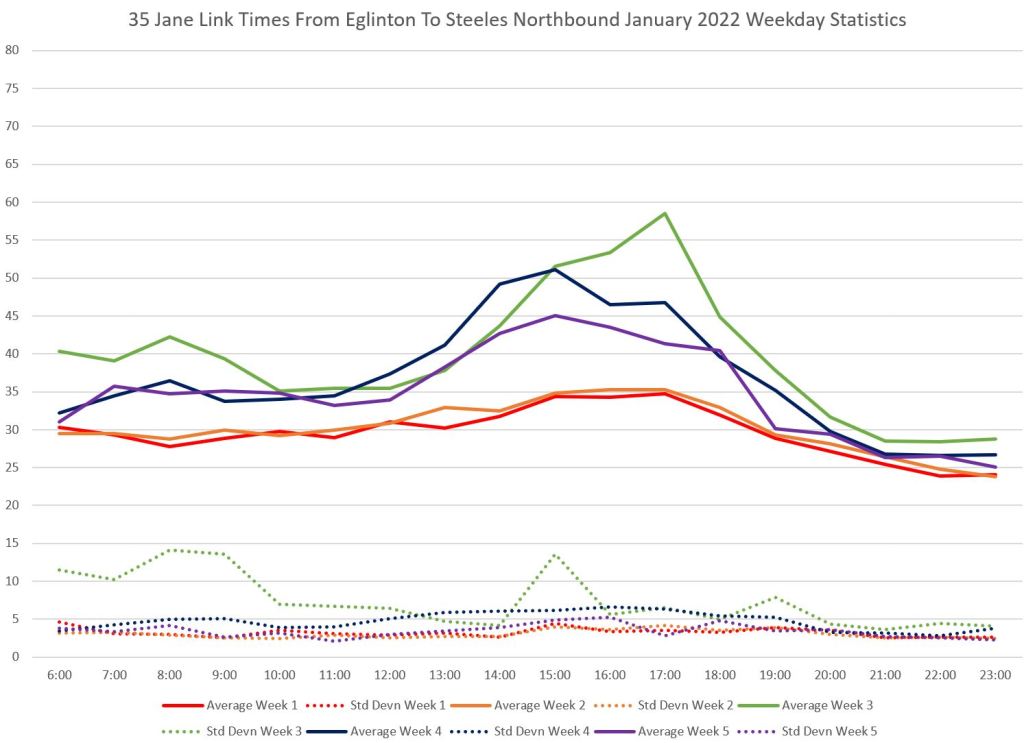
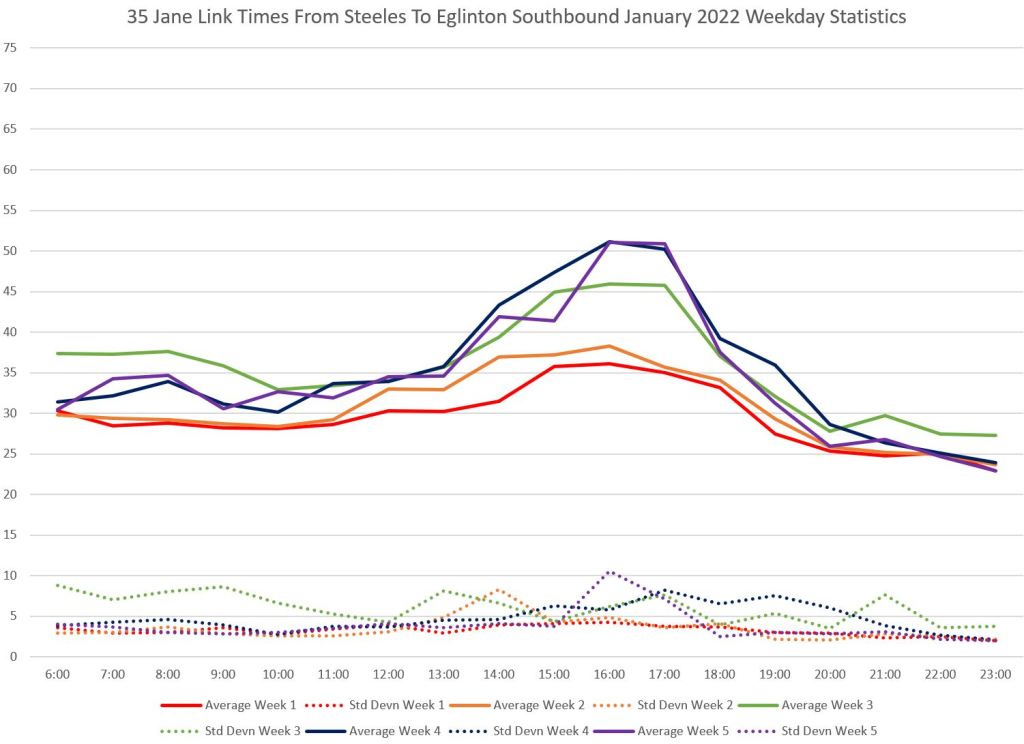
Service on Dufferin Street was badly delayed from mid-January onward. The charts below show the weekly average travel times between King Street and Wilson Avenue over the month.
The red and orange lines show the pre-storm values. Although there is some rise in PM peak travel times, it is fairly small. The green line includes the storm day and those immediately following. Blue and purple show that the problems with congestion dropped but were not eliminated as the month wore on.
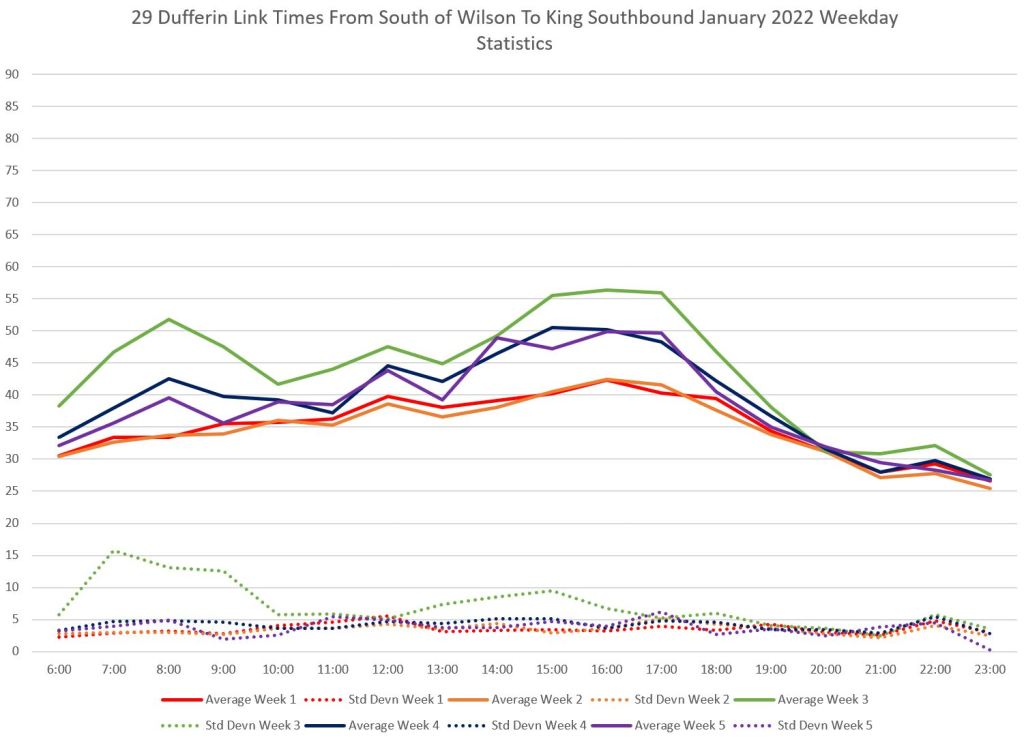
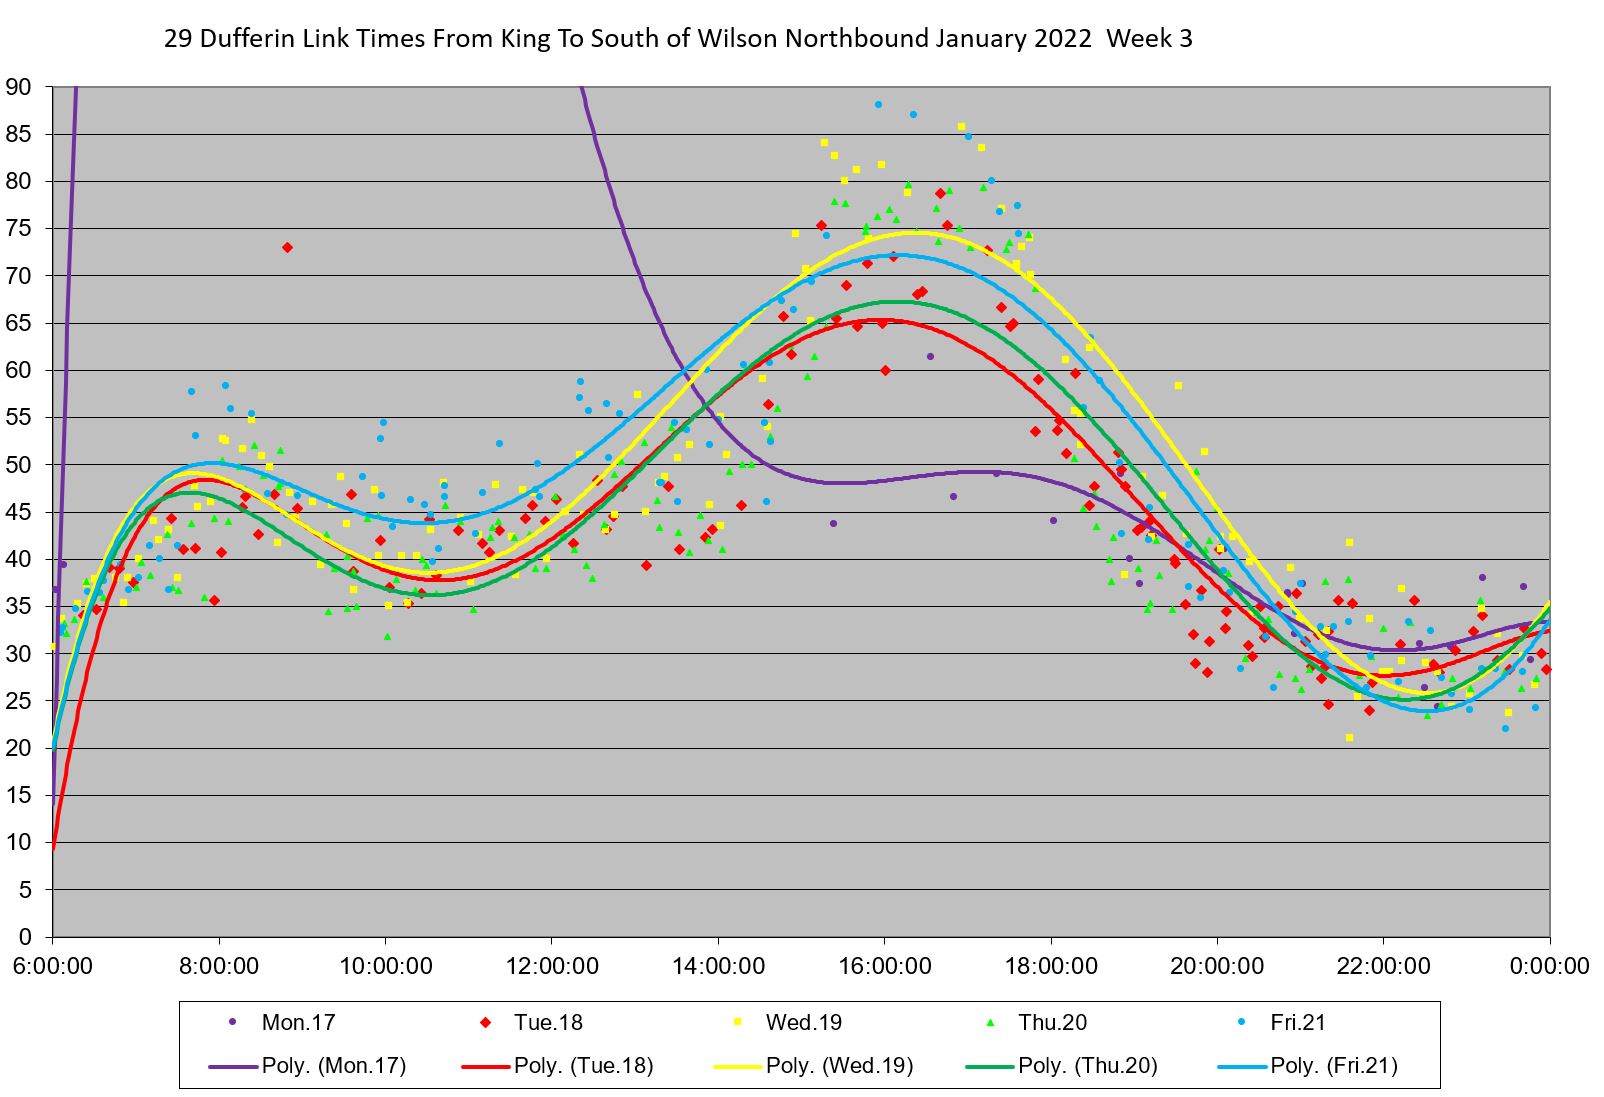
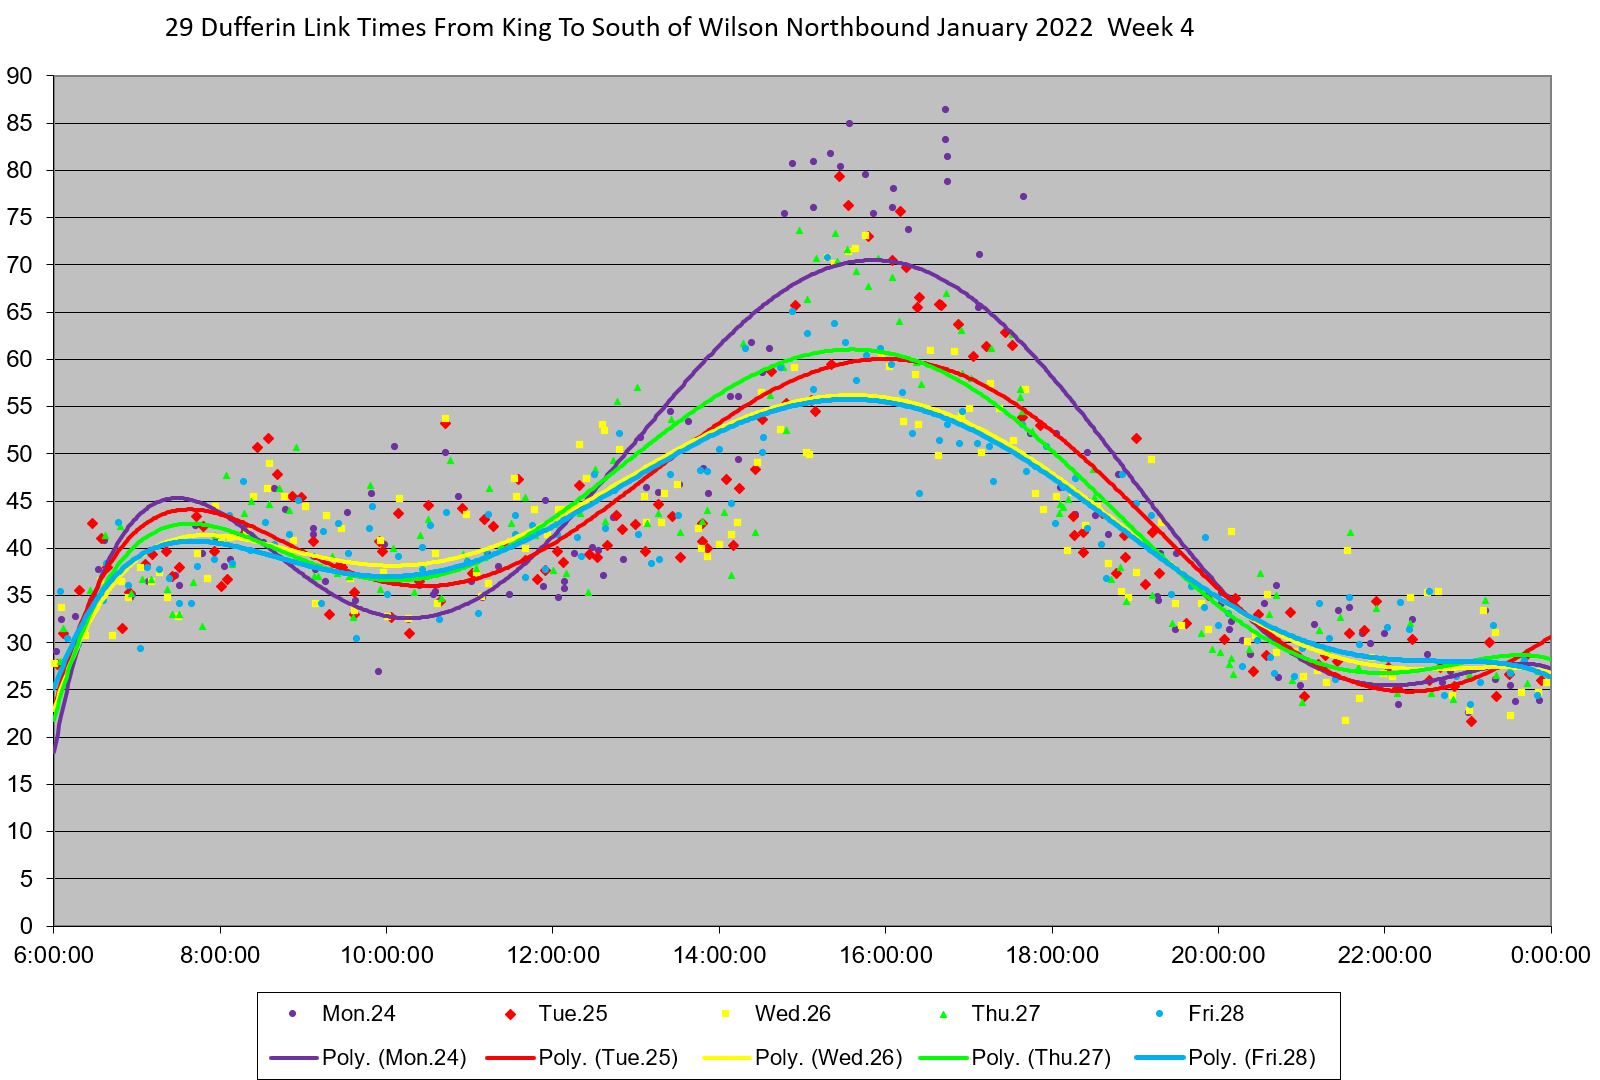
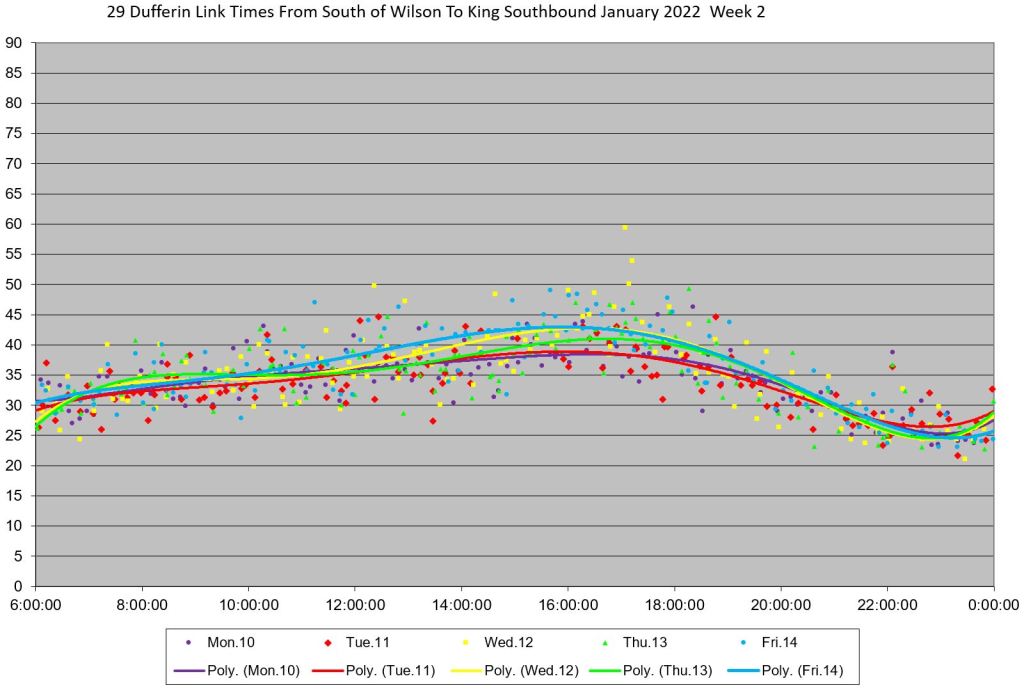
This can be seen in more detail with daily breakdowns. Each dot represents one bus, and for January 17 there are few dots because few vehicles made the full trip between King and Wilson. Week 2 is shown as a pre-storm reference. Even by the end of Week 4, travel times were still running higher than in Week 2, albeit much more so for northbound than for southbound service.
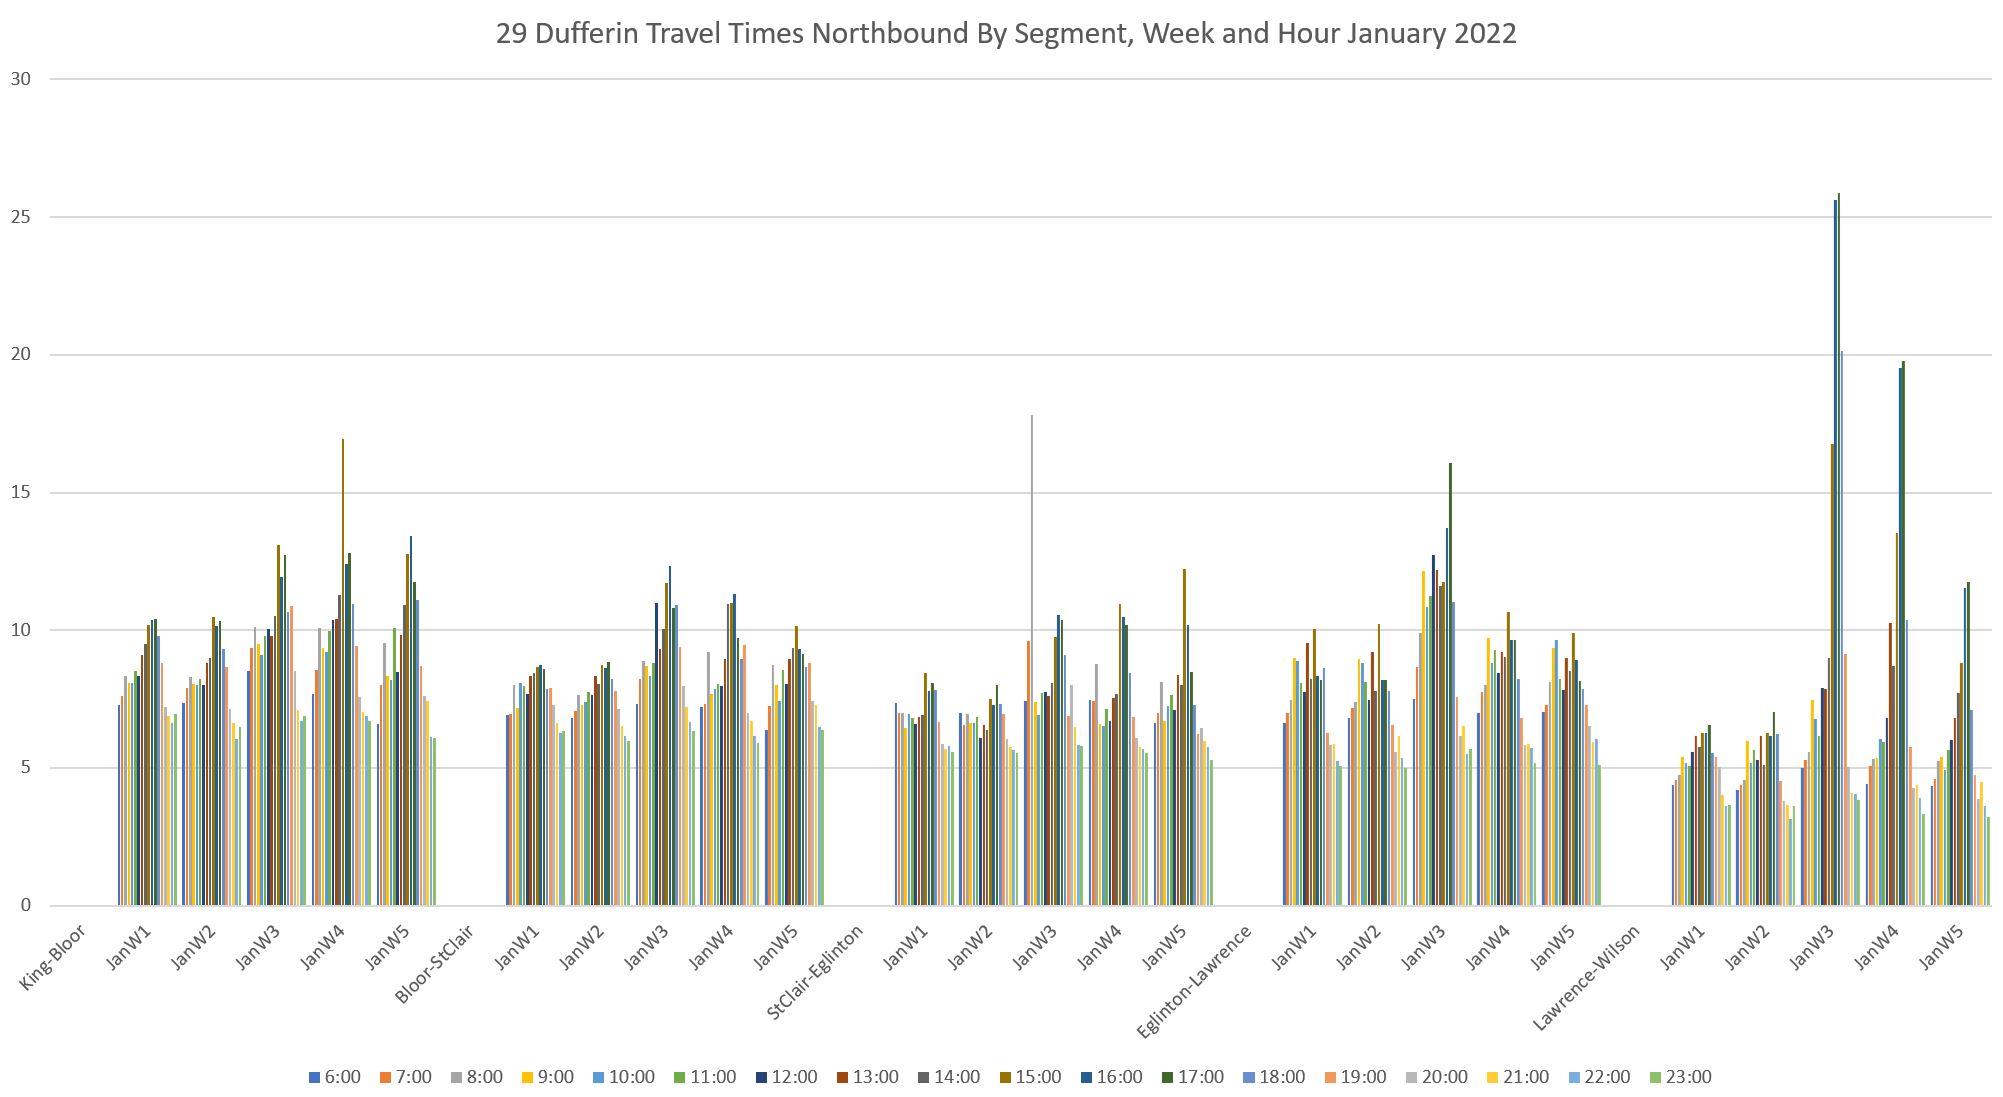
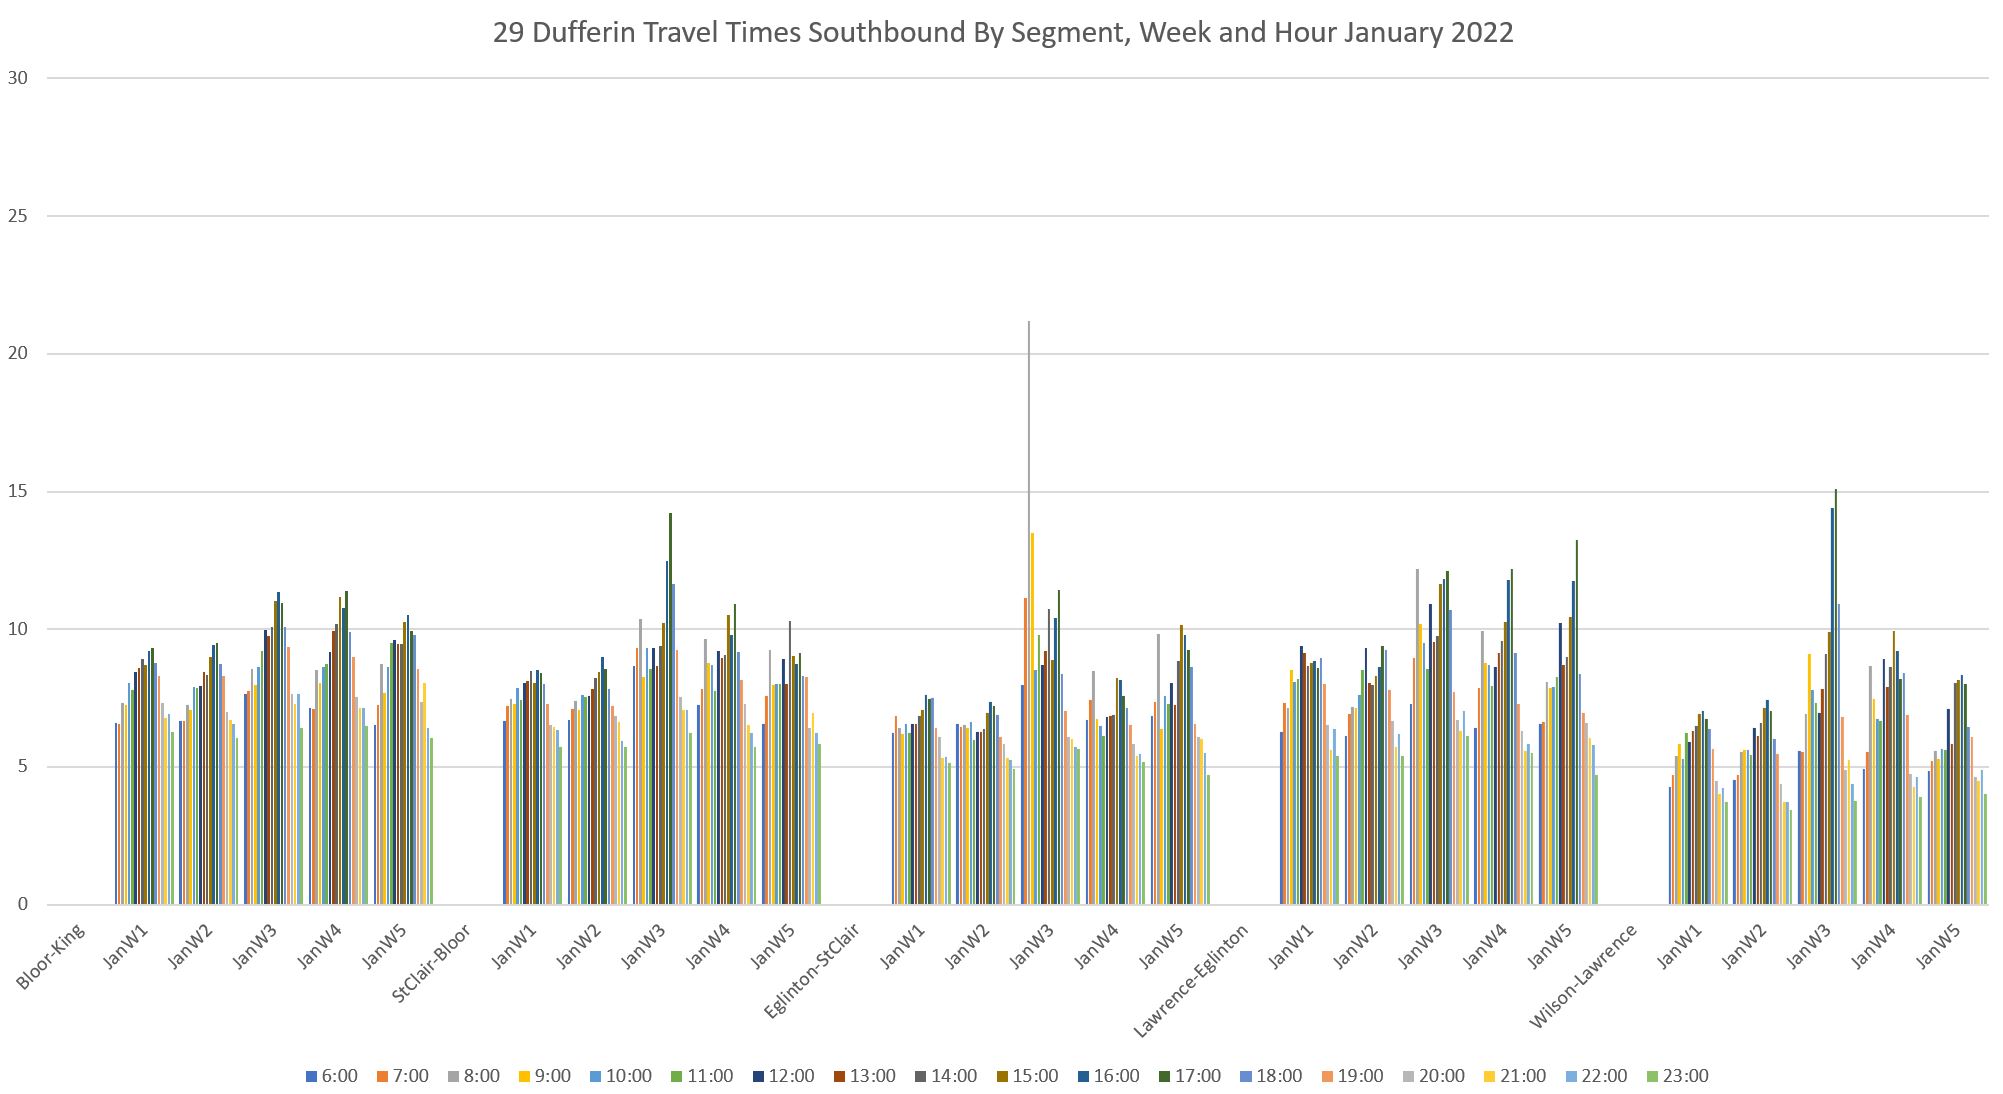
These charts do not tell the entire story, however because the profile of where and when travel times were extended was not uniform across the route. The charts below summarize the hourly travel time values, by week, over segments of the route. Each set of columns contains one week’s data for a route segment with the hours of the day clustered to show the rise and fall from early morning to late evening.
Note that:
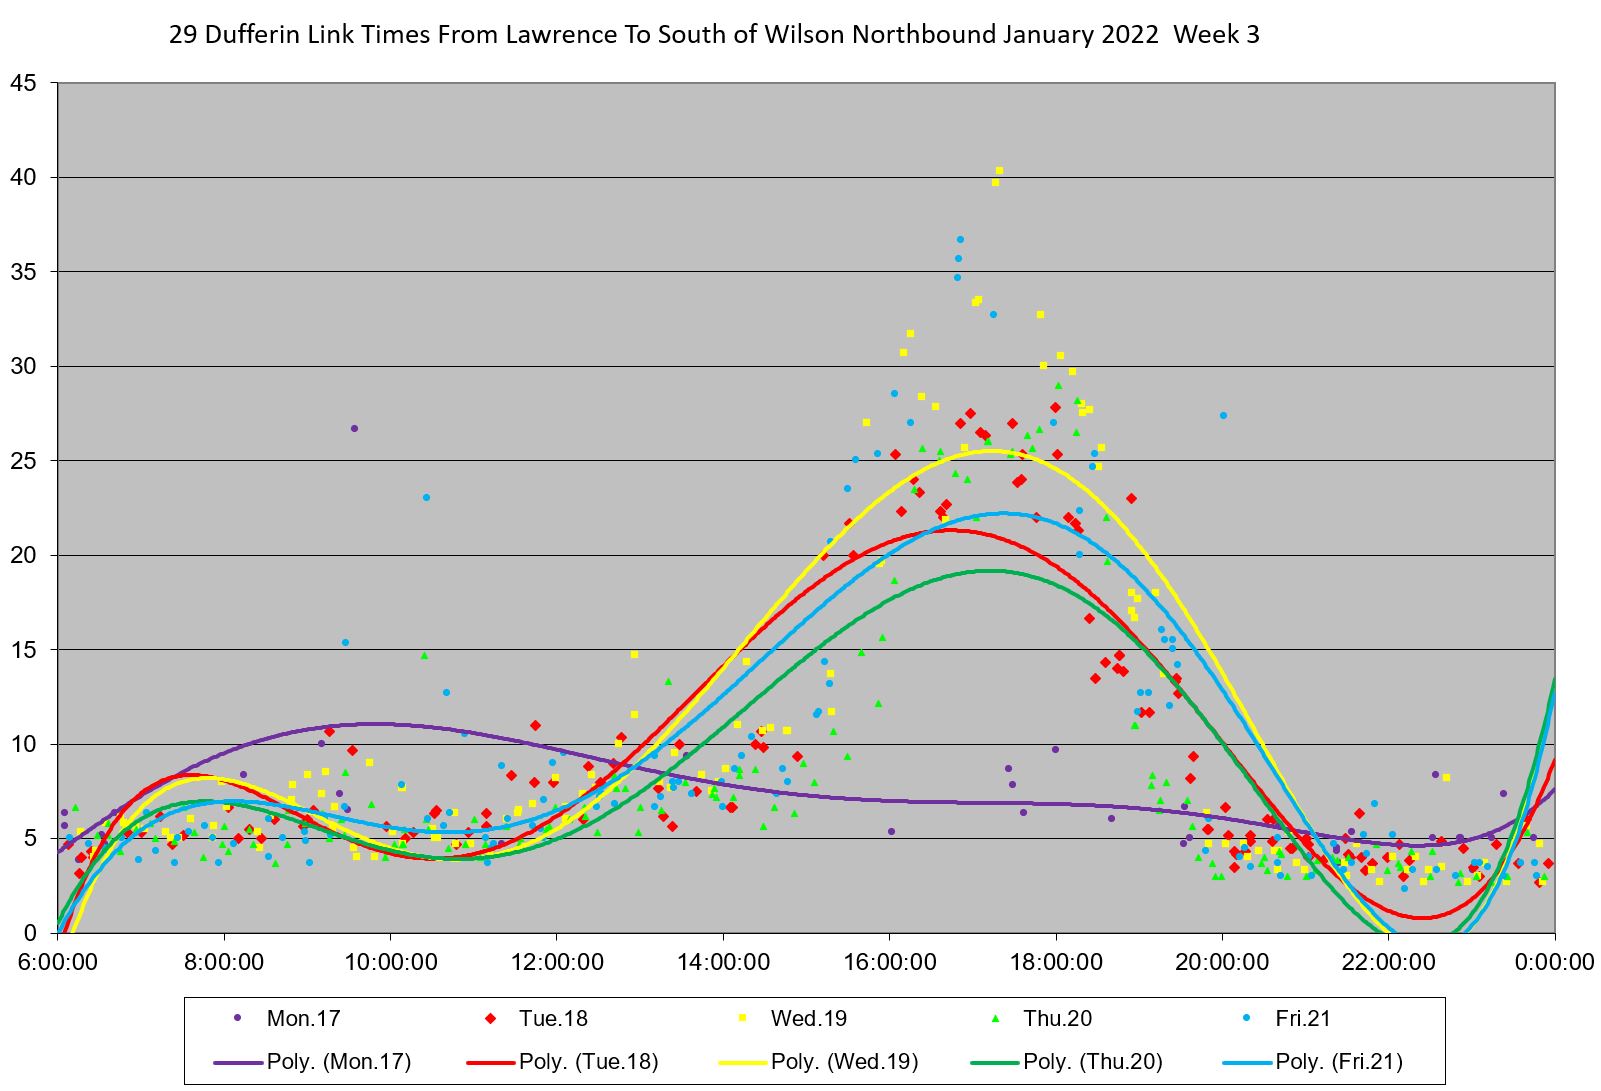
- The jump in Week 3 is obvious in all segments of the route, but it is greatest between Lawrence and Wilson, not where one might expect in the hillier portions of the route further south.
- The aftereffect is seen in all segments, but it takes a long time to fade in the Lawrence-Wilson segment northbound.
Clearly there is an issue in the Lawrence-Wilson segment of the route. This is quite obvious by breaking out the daily stats for this portion.
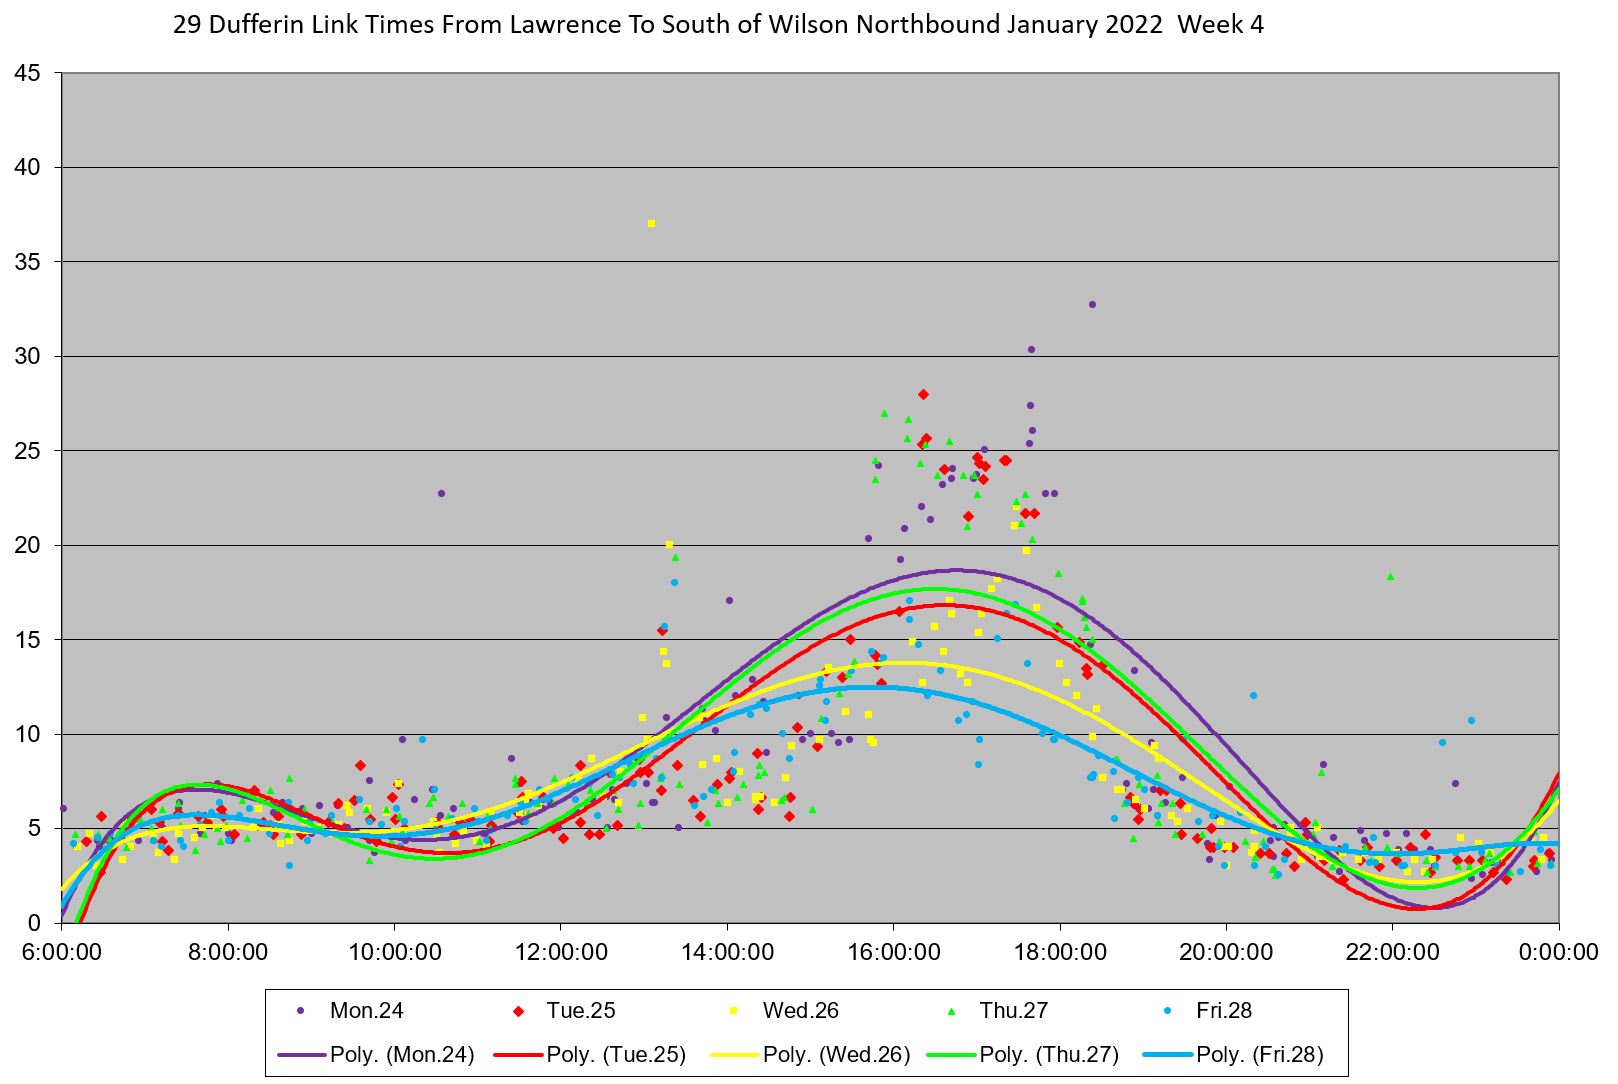
The top row of charts shows Weeks 2 through 4 of January.
- In Week 2, conditions are normal and there is little change through the day in travel times.
- In Week 3, the snow day, January 17 (purple) is fairly flat but very few buses make this journey. From Tuesday onward (yellow through blue), travel times range up to 40 minutes for what would normally be a 5-8 minute journey.
- In Week 4, the averages have fallen a bit, but they are still much above normal values.
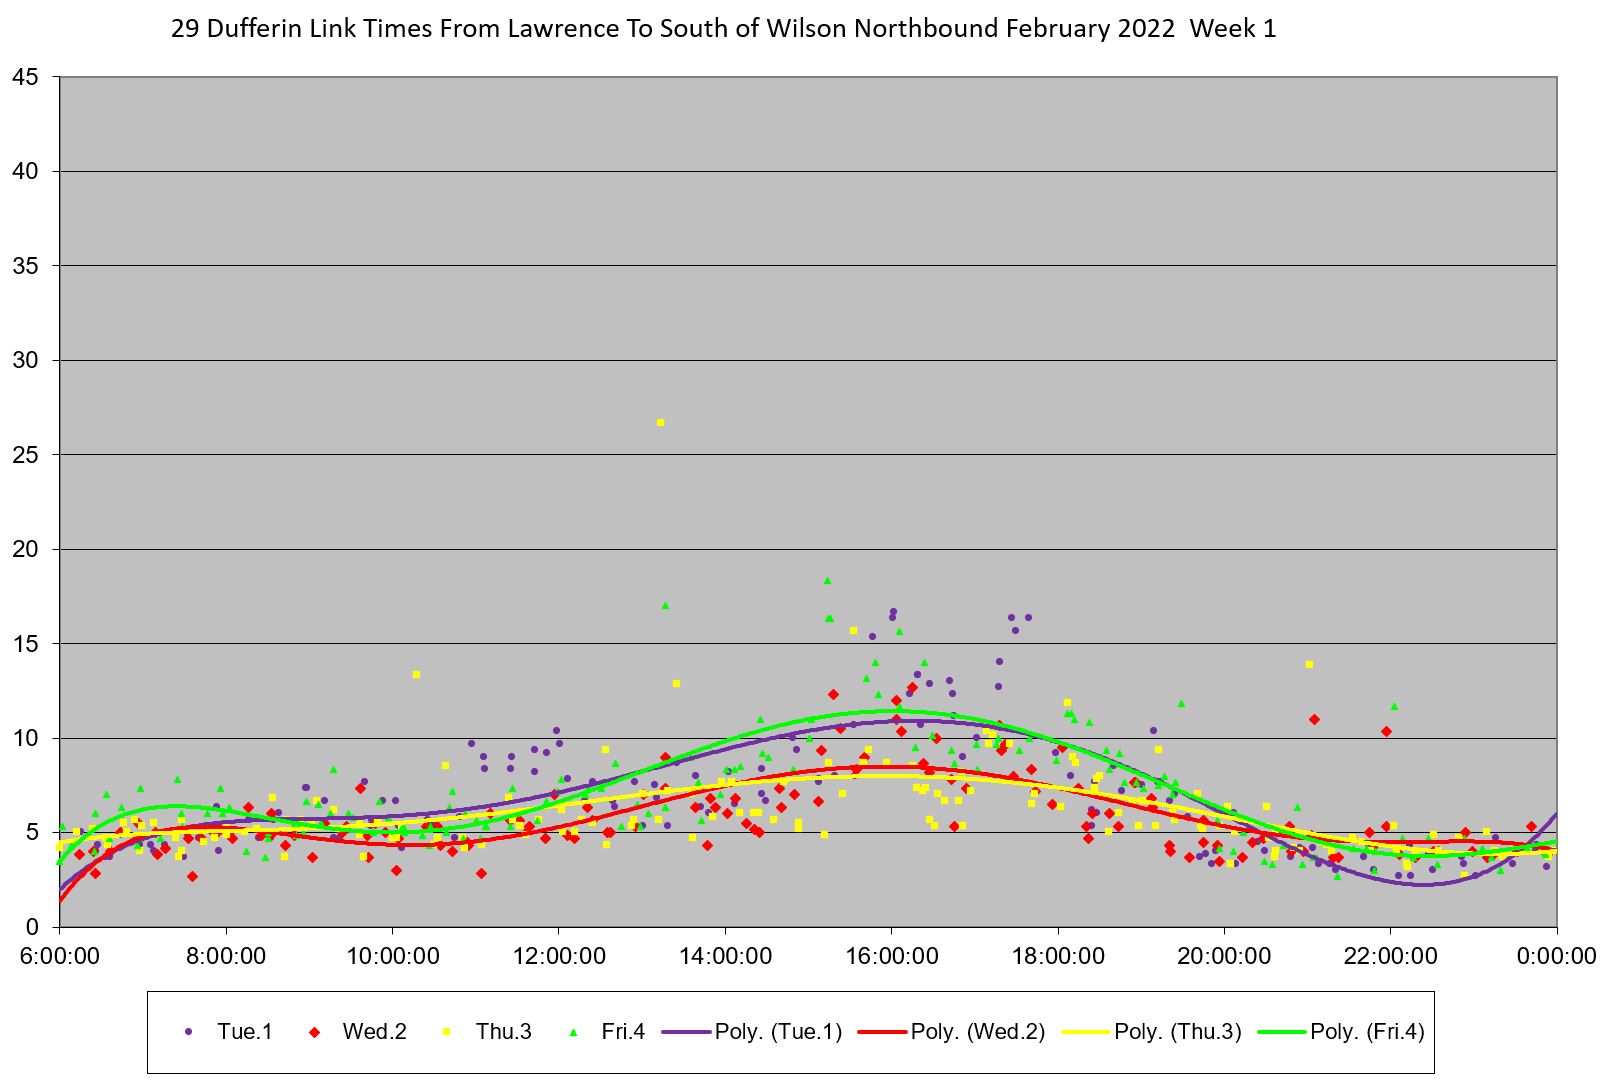
The bottom row shows the beginning of February as well as weekend data for January.
- In February Week 1, the travel times settle down to the normal range, more or less.
- Saturdays show the effect of post-snow congestion on the 22nd and 29th (green and blue).
- Sundays show a slight increase, but nowhere near the same as on Saturdays implying that the Sunday traffic, such as it was, could operate fairly normally with whatever snow was still on the street.
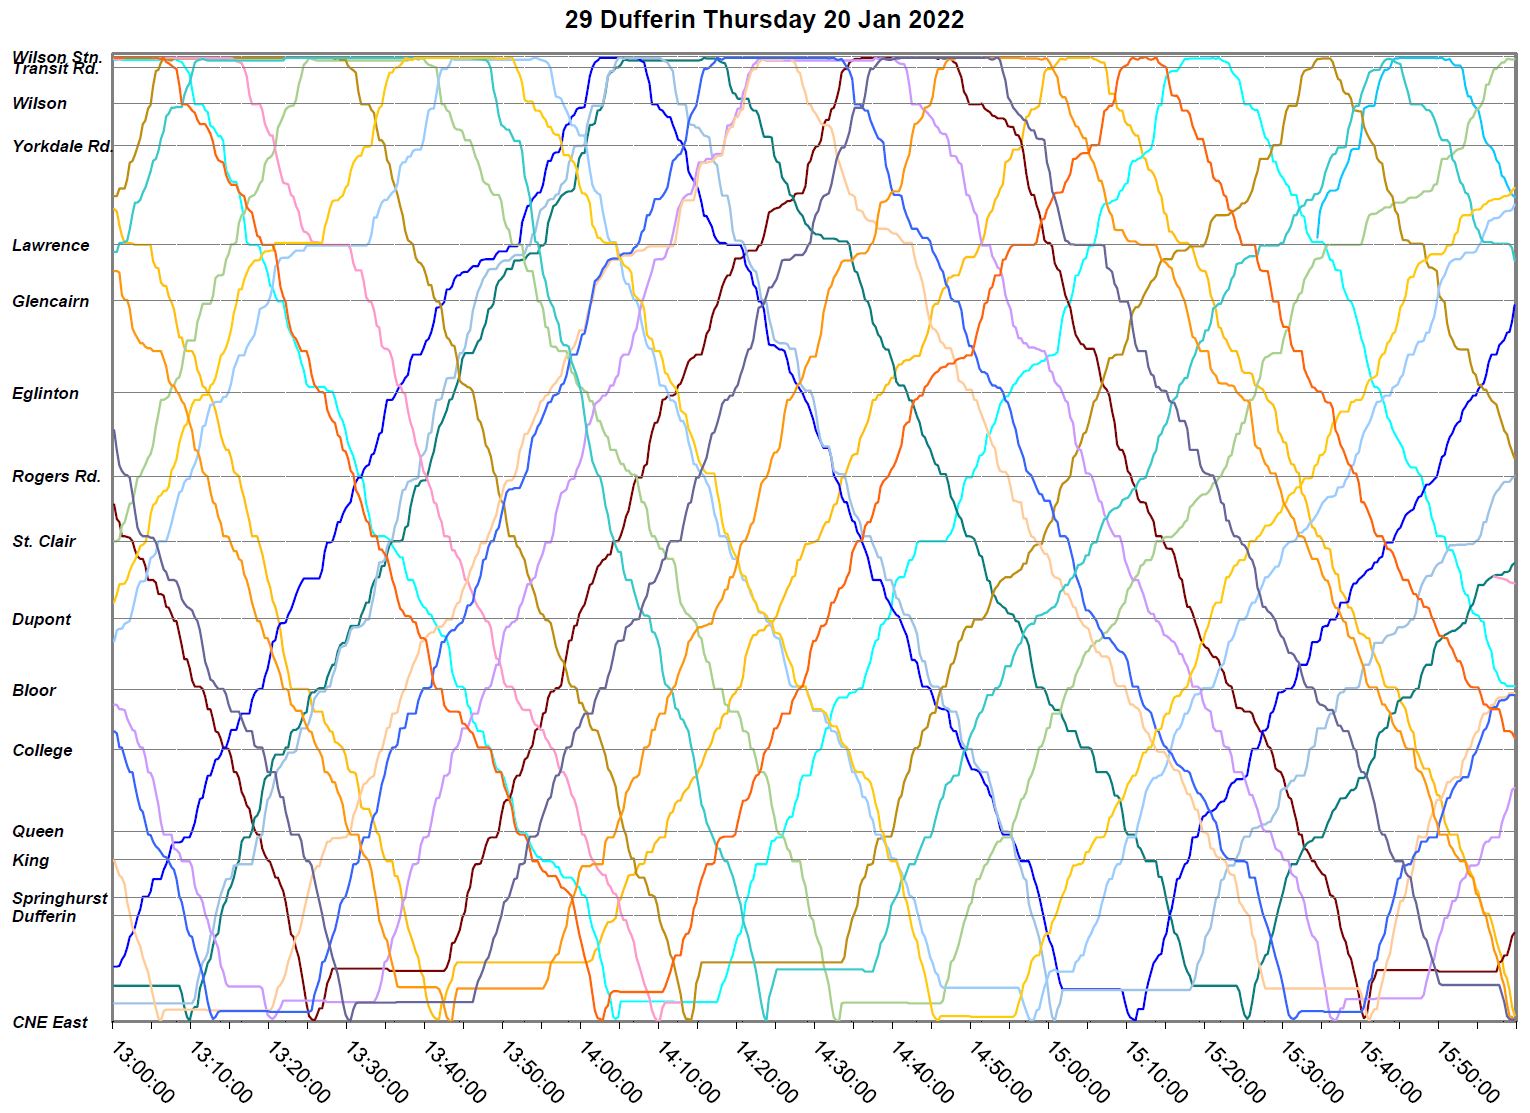
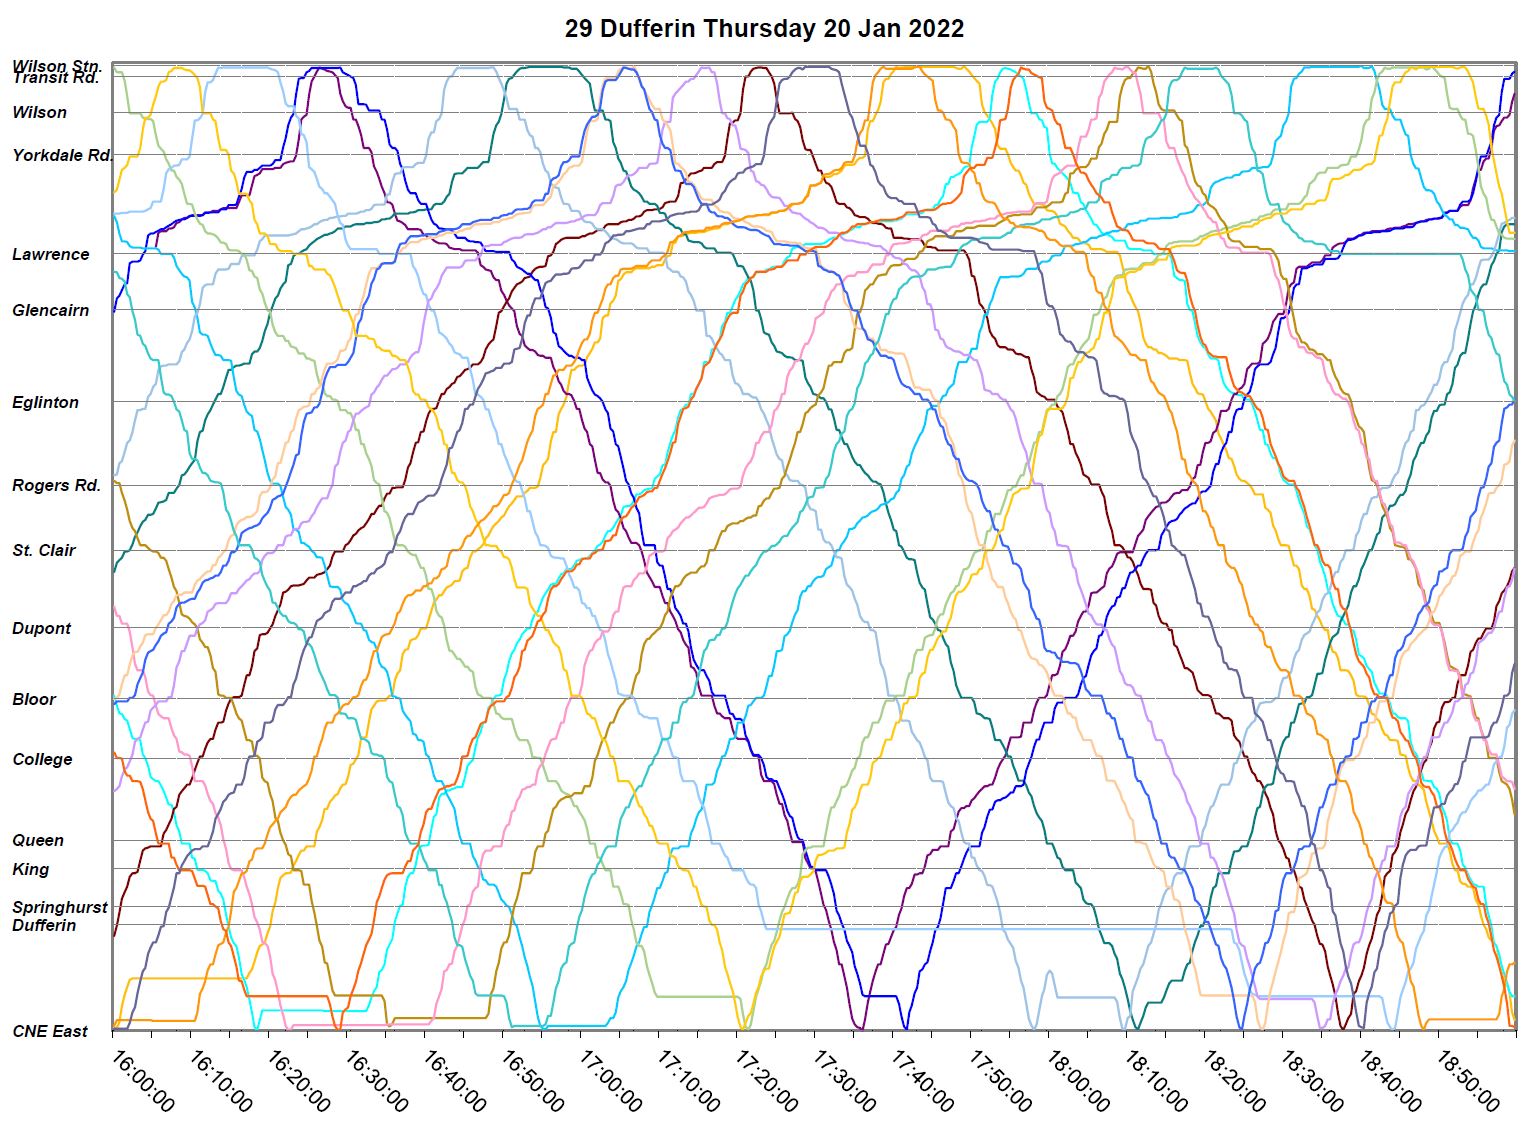
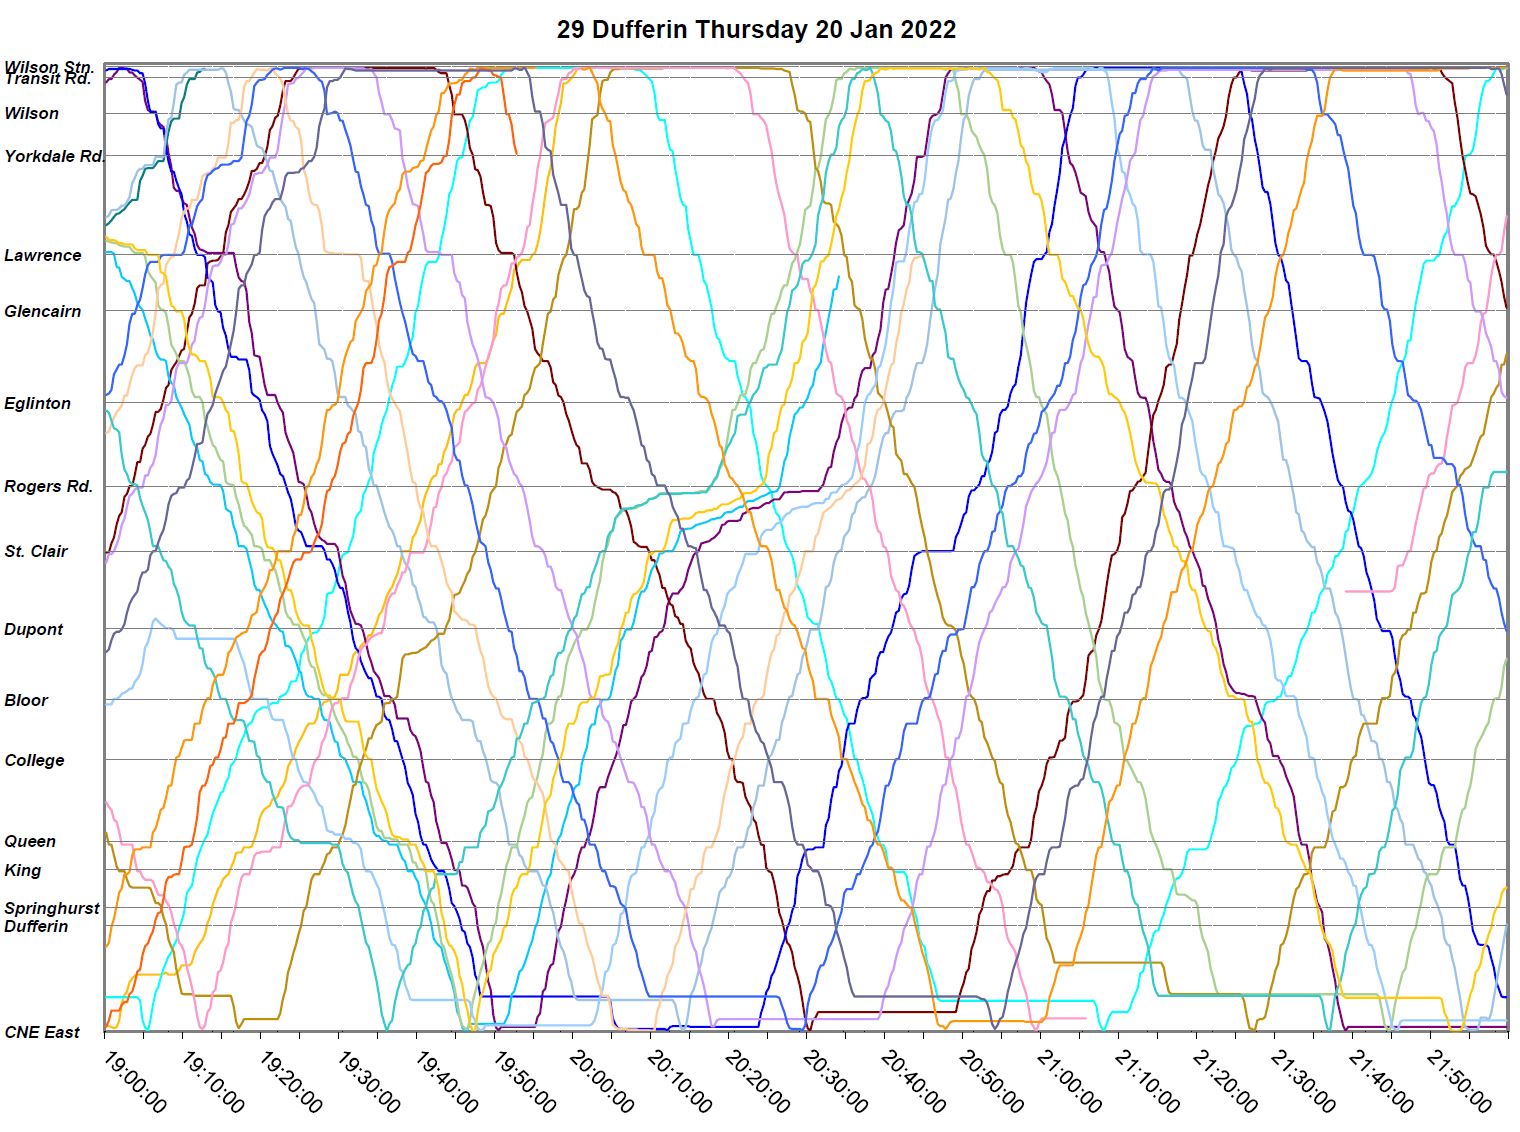
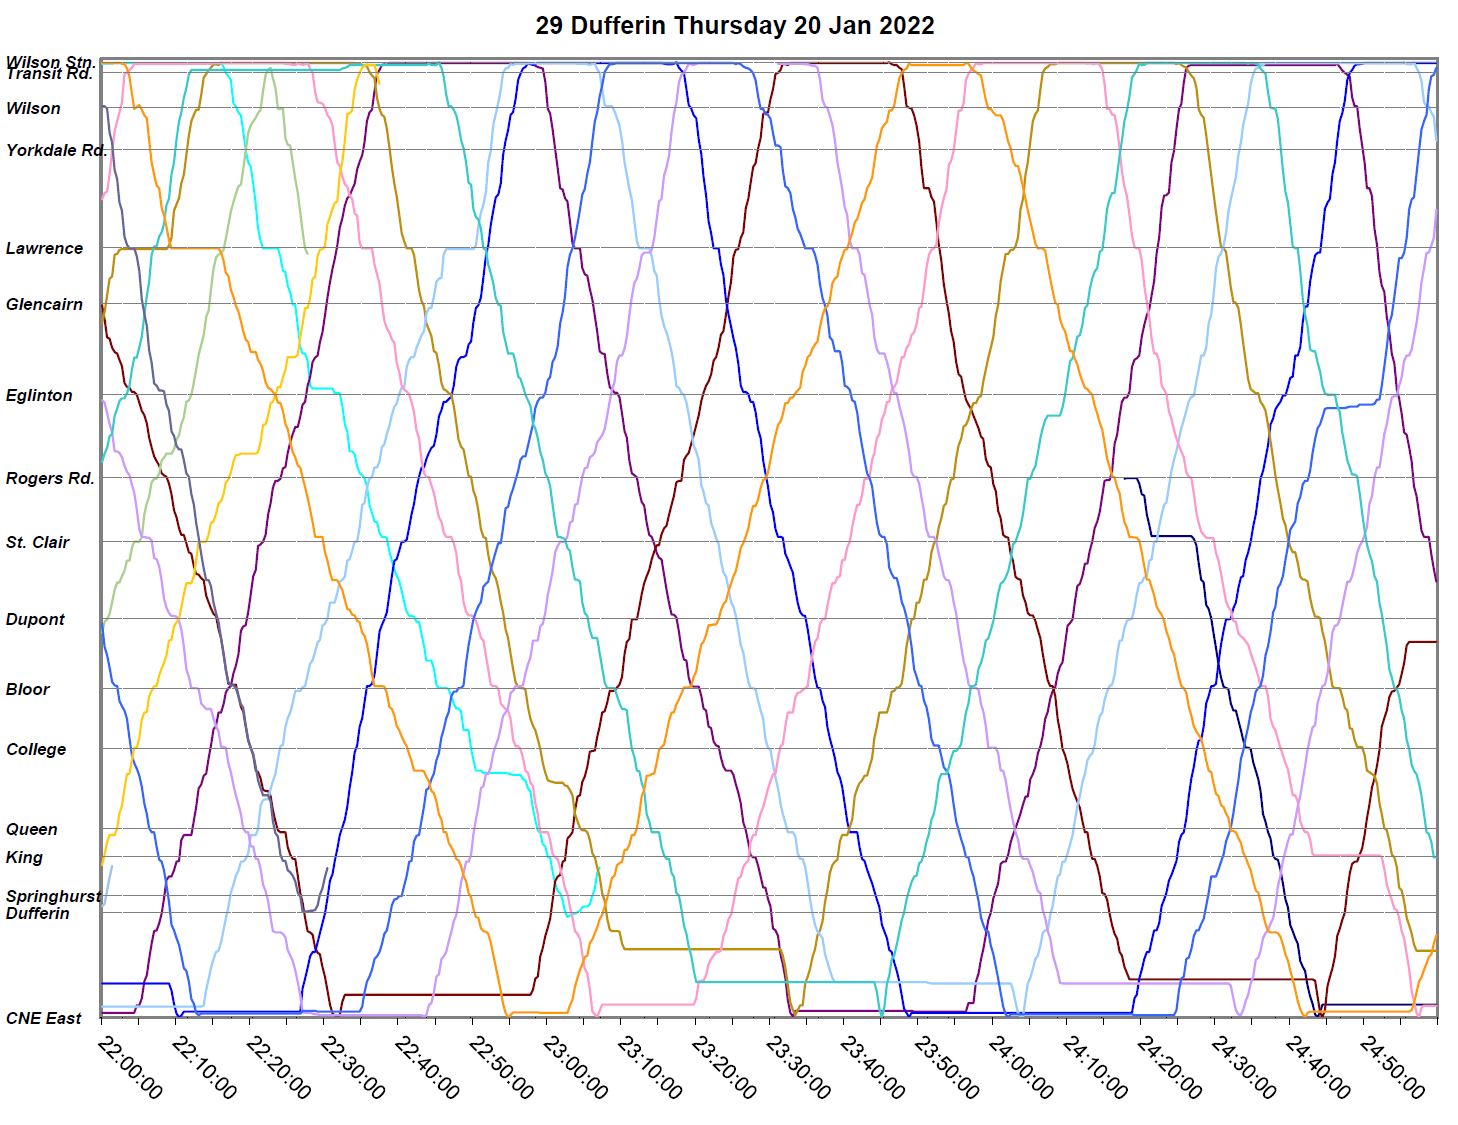
What was going on at the north end of the route? For this, we turn to a detailed chart of operations for individual days.
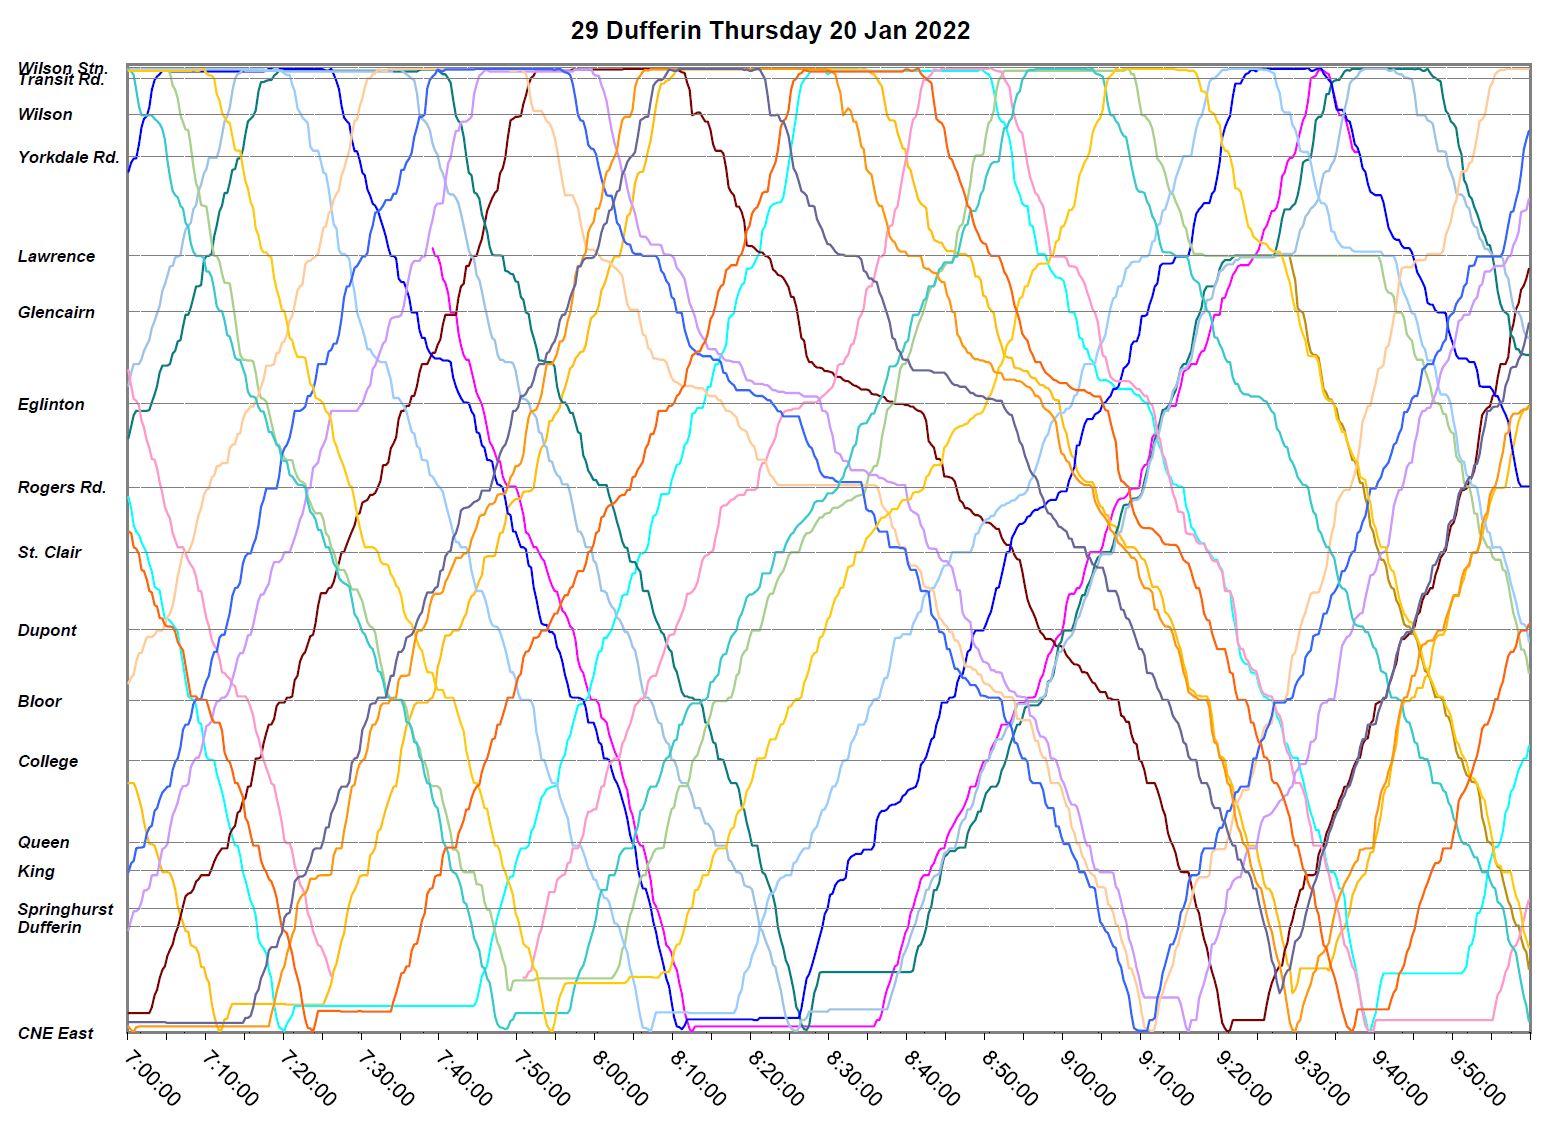
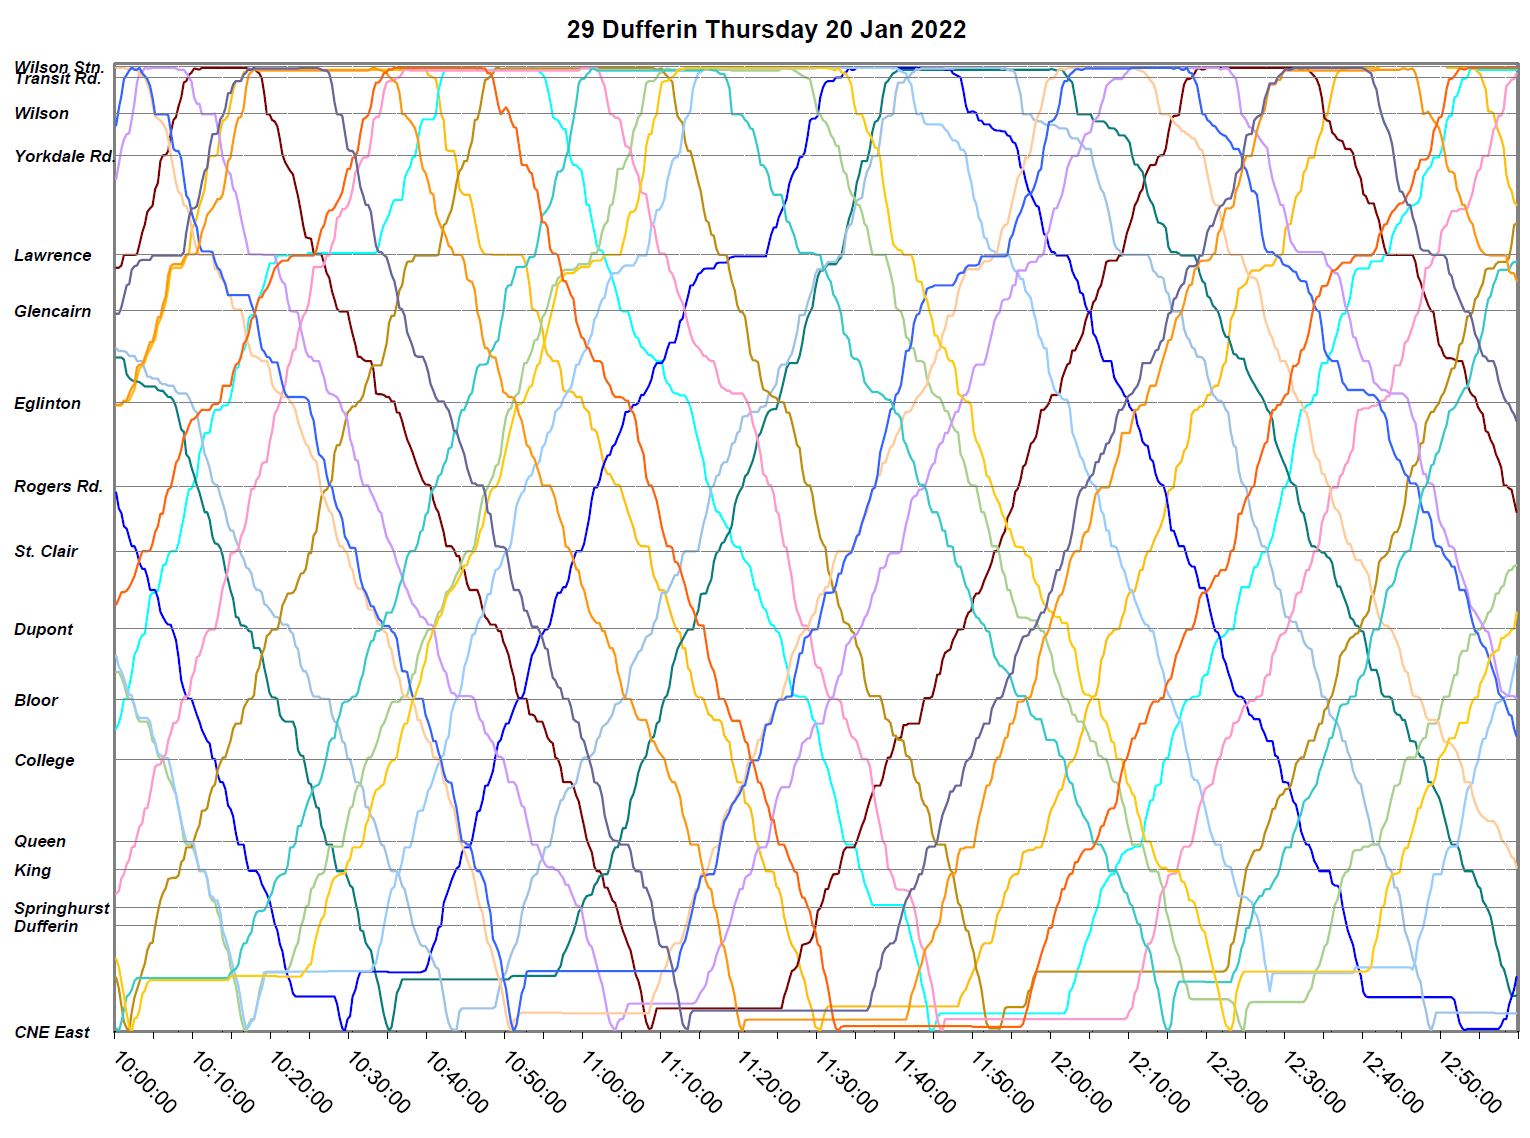
Thursday, January 20, 2022
This chart shows the condition three days after the storm. Some congestion is visible at Lawrence, but more so between Lawrence and Yorkdale Road northbound in the PM peak. In spite of this, the service is not bunched most of the time with a few obvious exceptions.
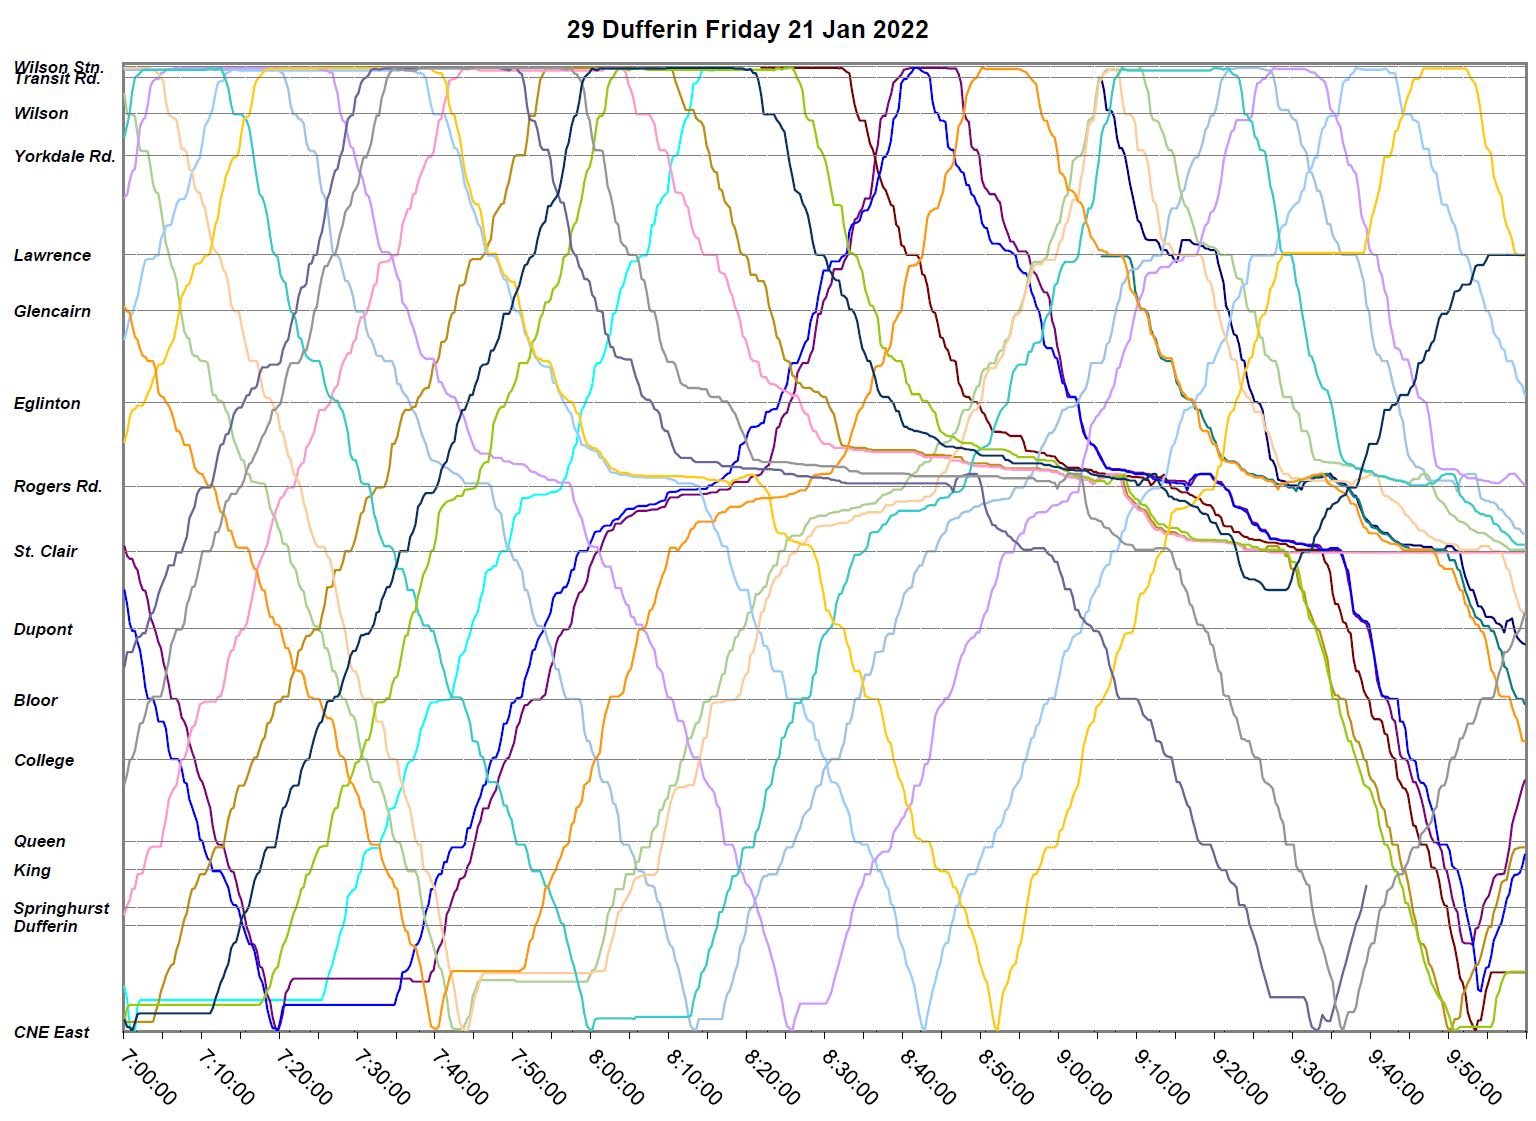
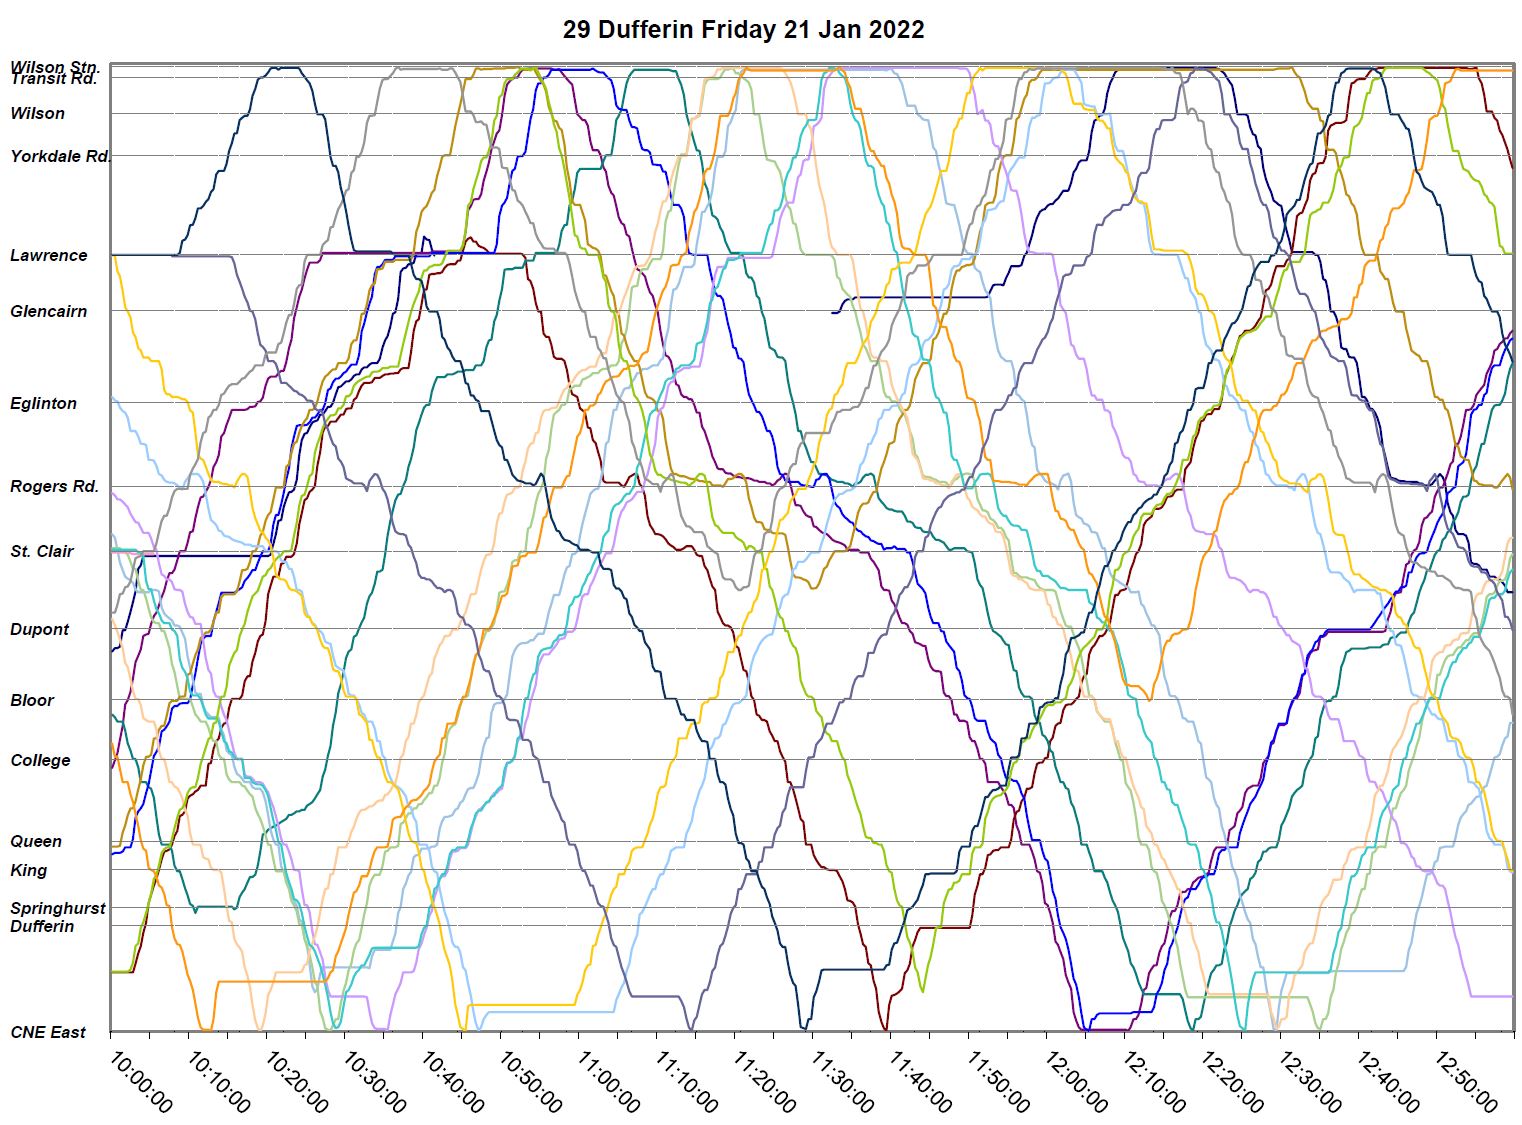
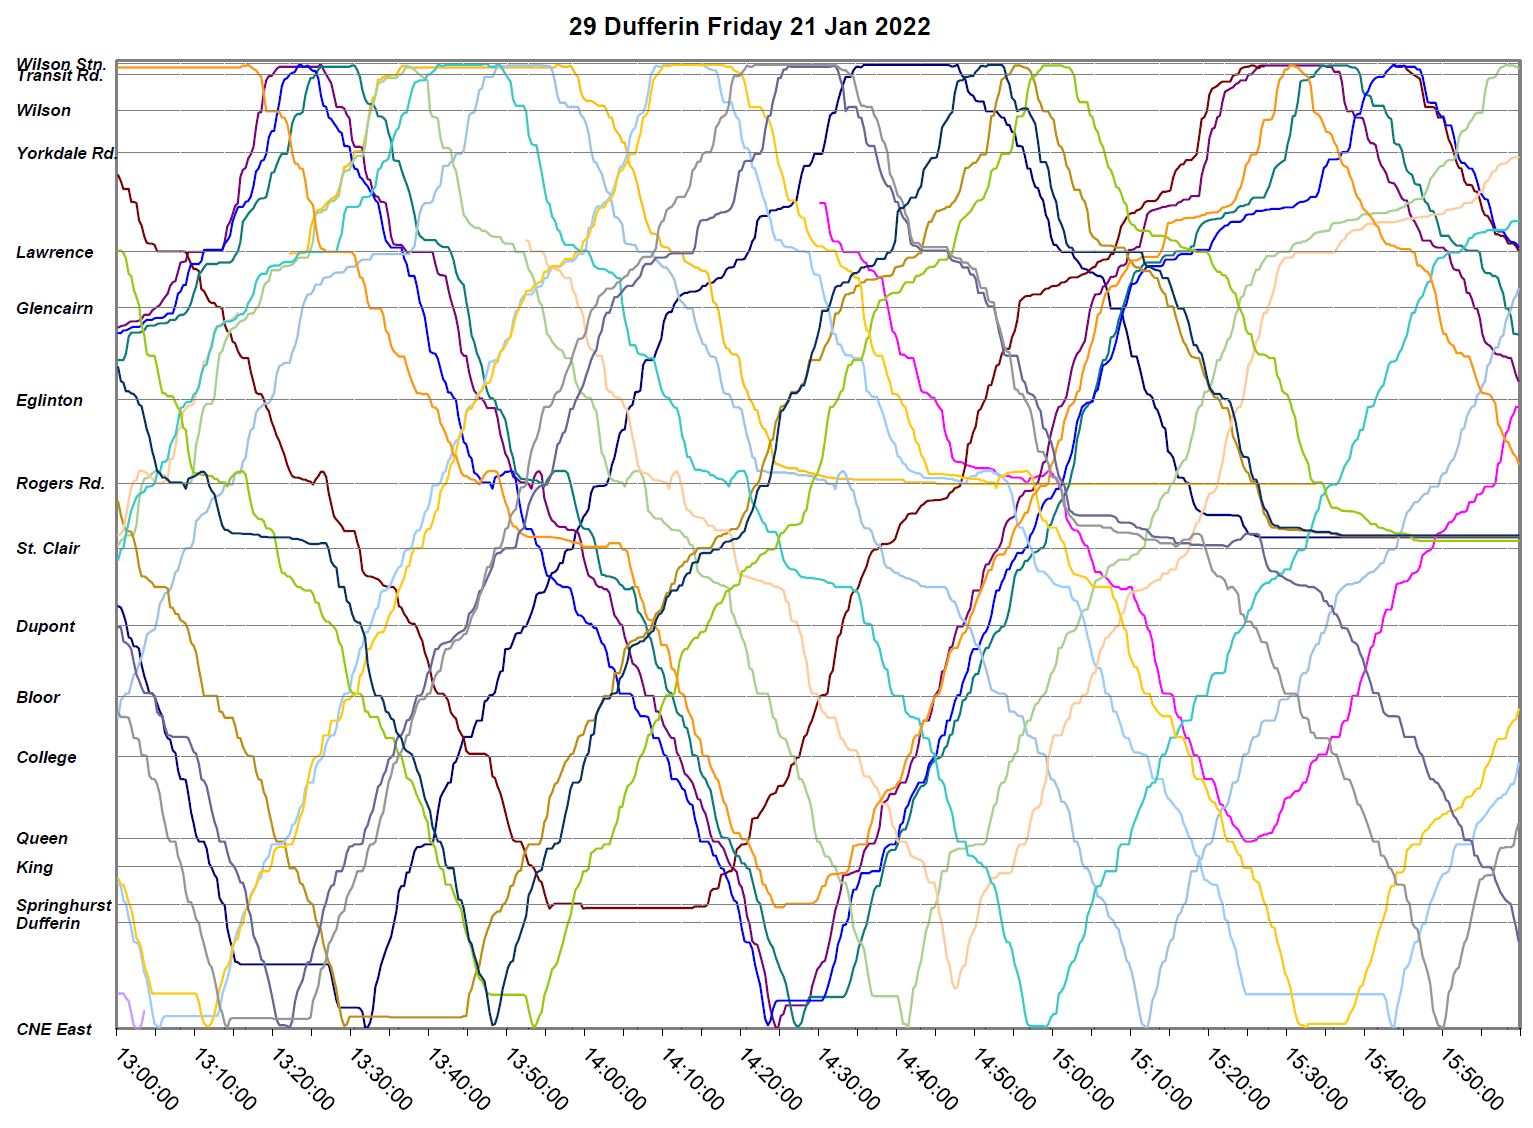
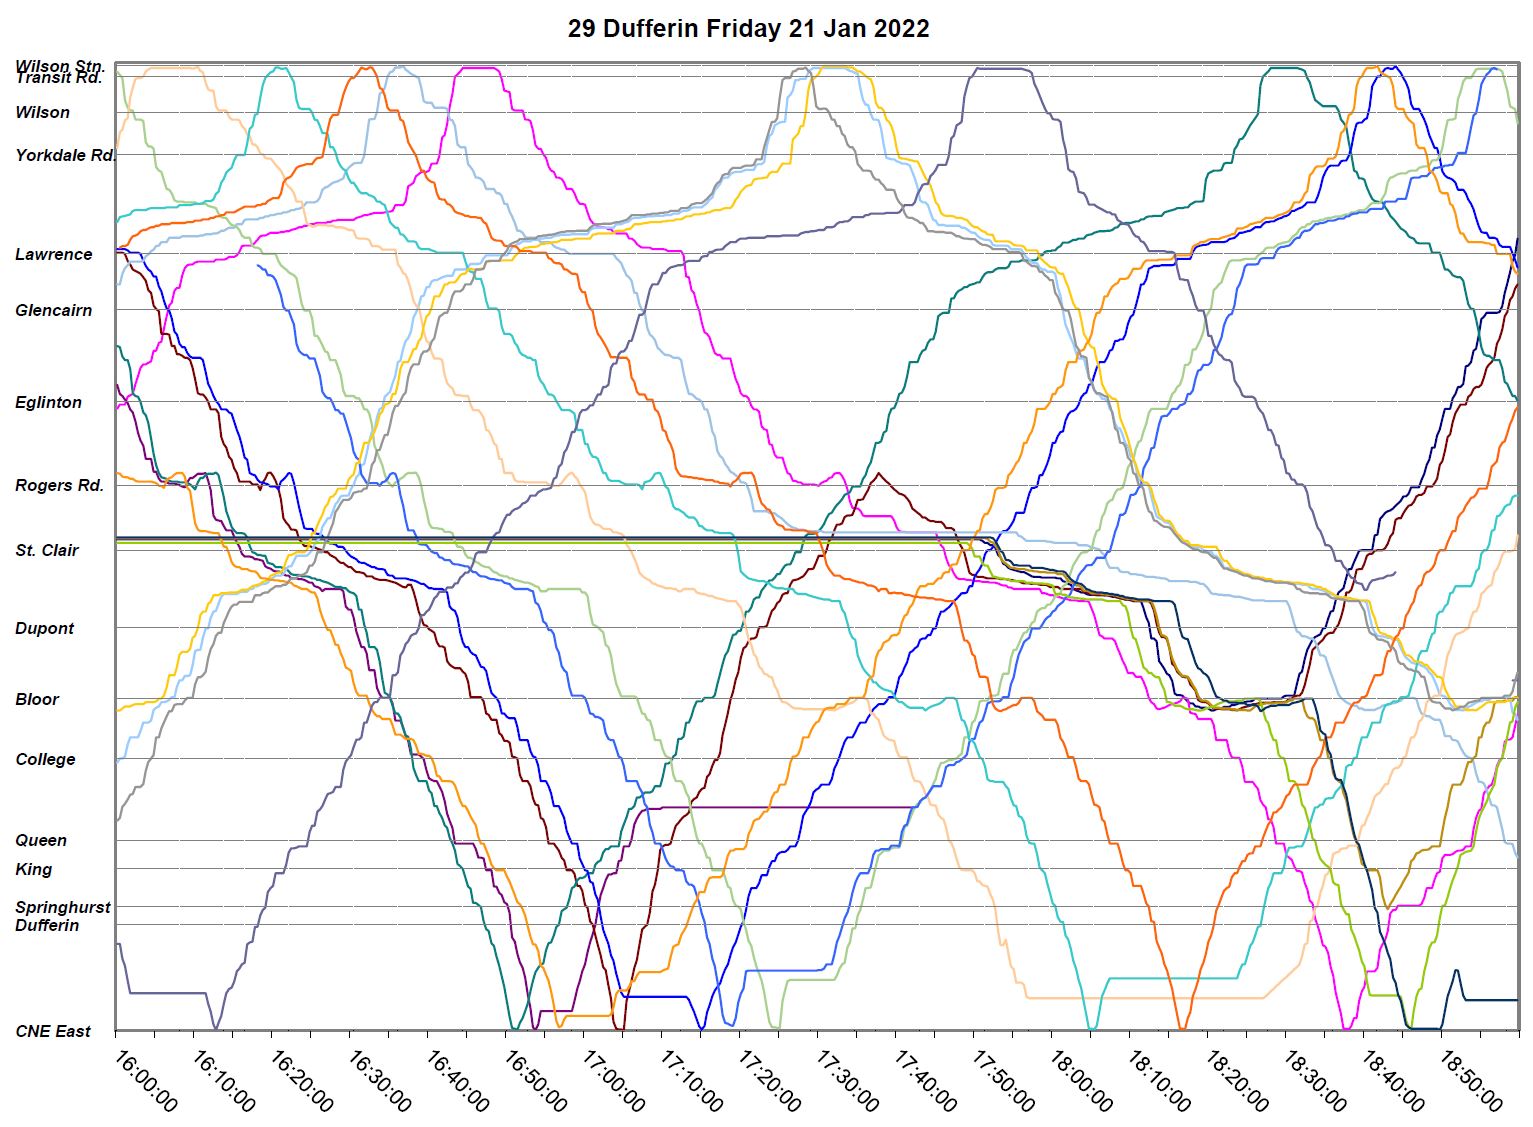
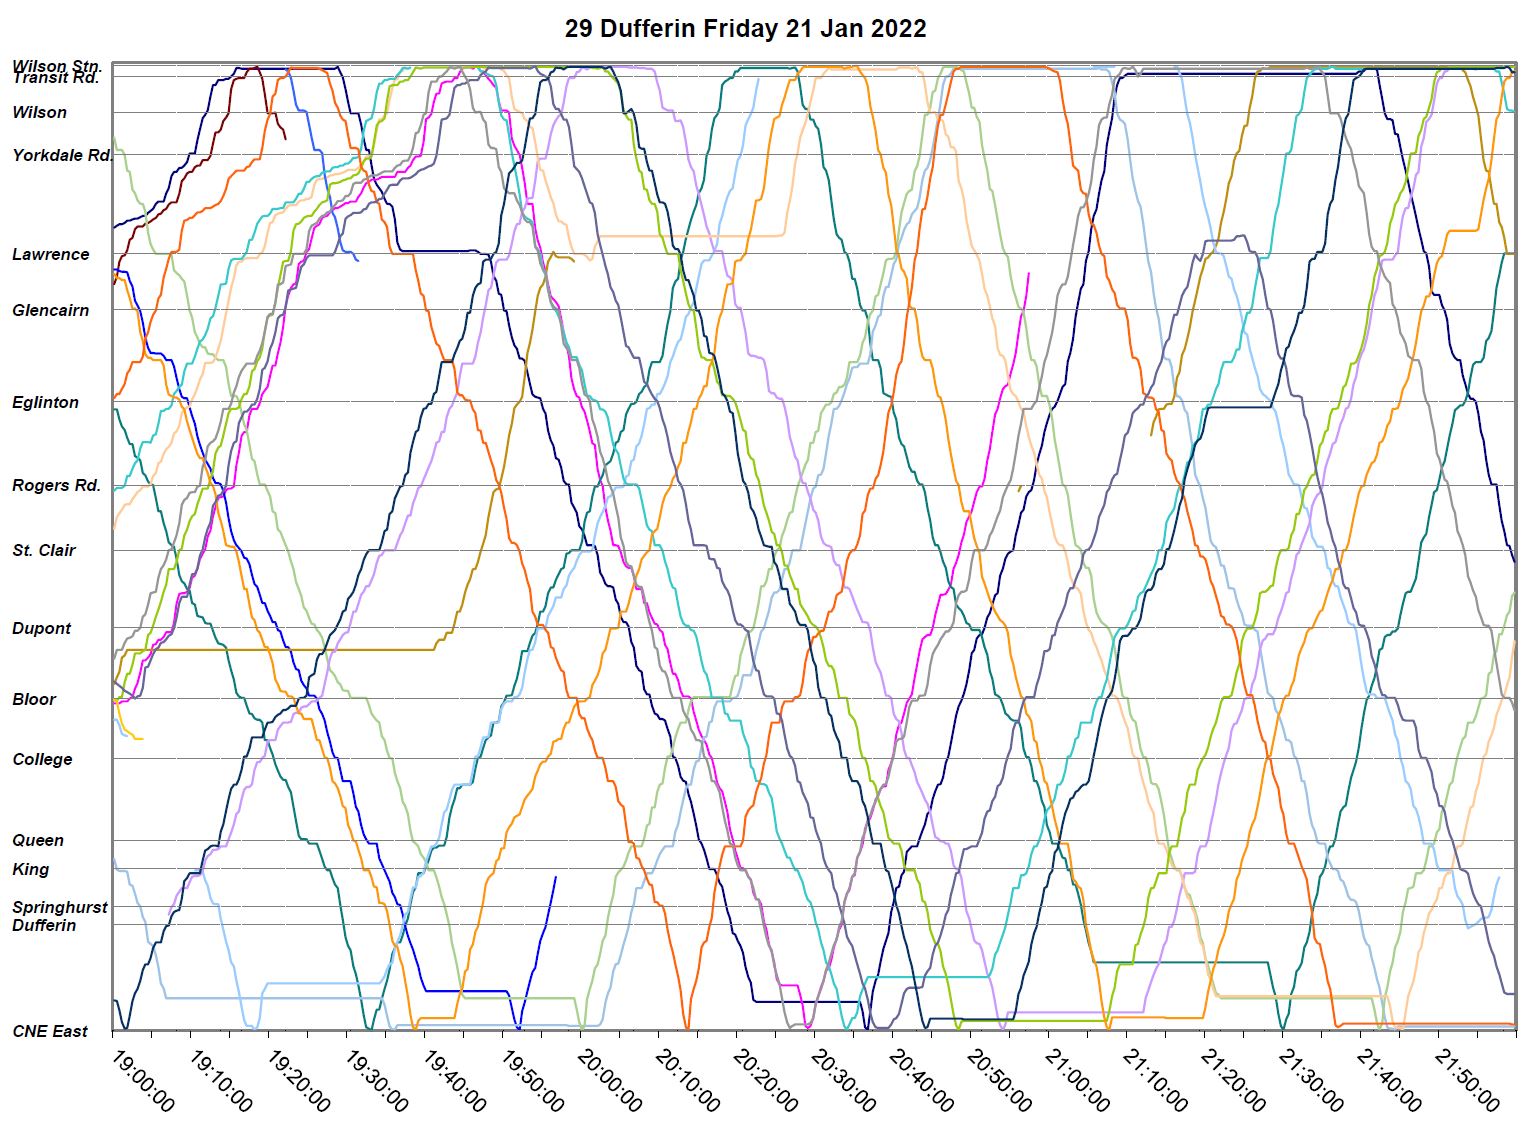
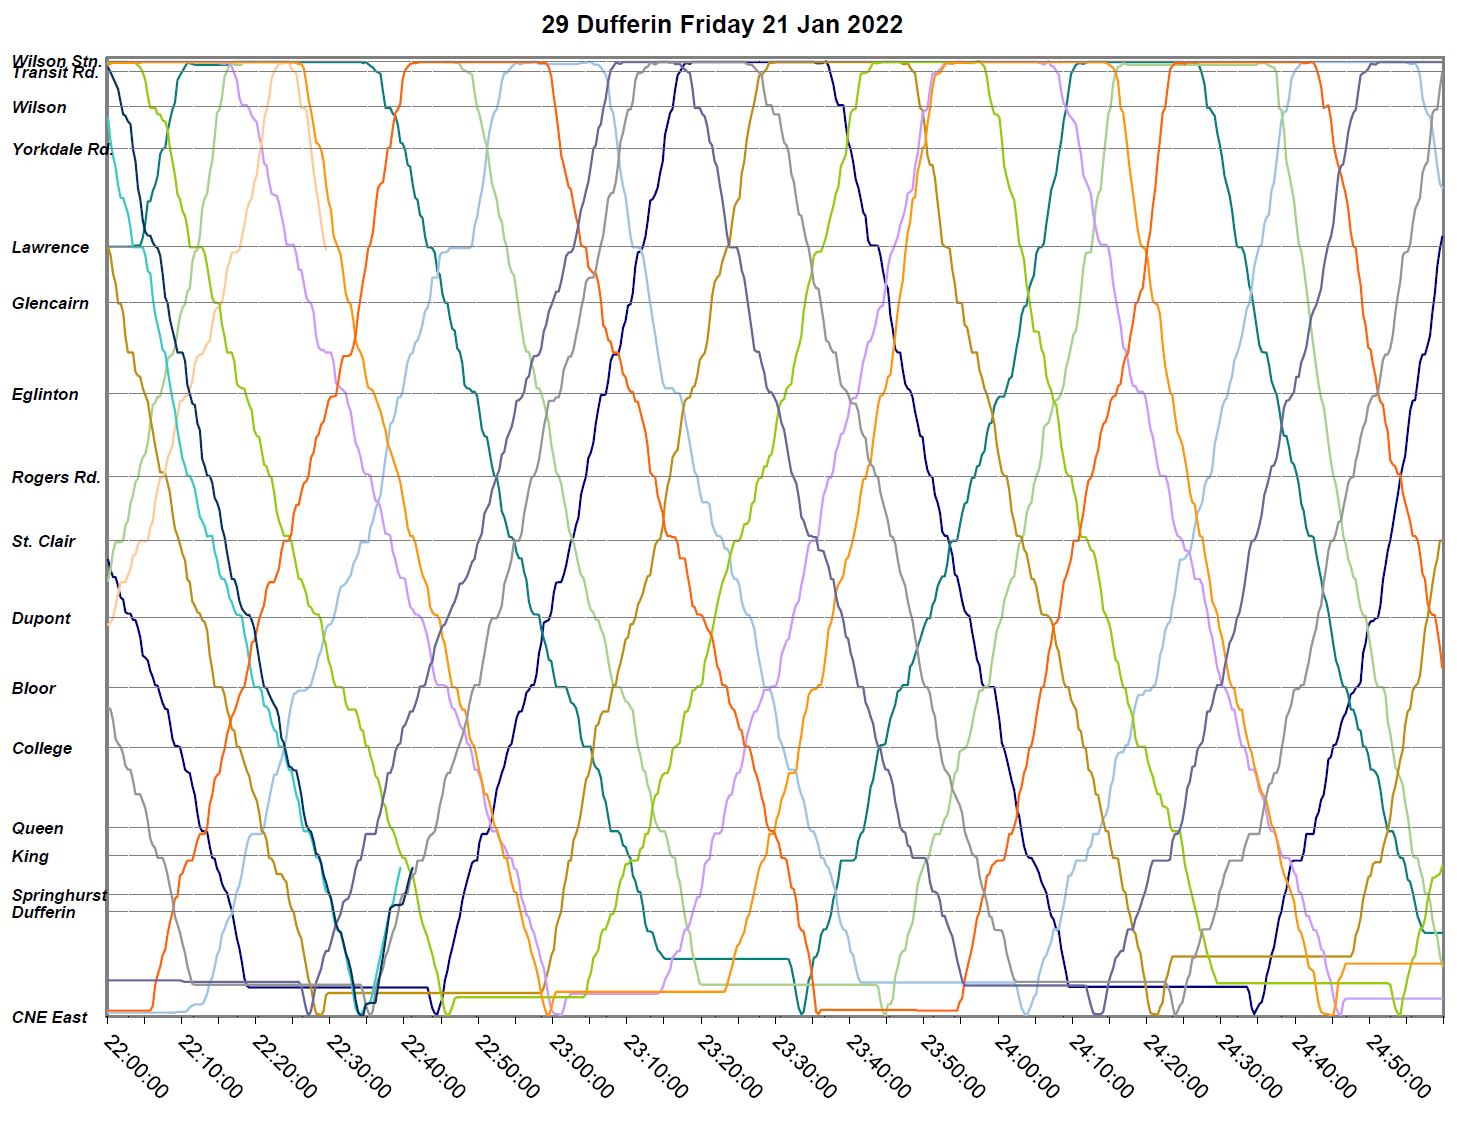
Friday, January 21, 2022
On January 21, two major blockages affected operations on Dufferin southbound, and service diverted via Rogers, Oakwood and St. Clair.
- In the morning, snow removal required that buses divert. The effect on southbound travel times from about 8 to 10am is clear. This created some bunching that was not sorted out for many hours afterward.
- Another blockage trapped several buses just after 3pm. These show up as a block of horizontal lines ending after 5pm. Some of these buses turned back from Bloor, and some continued south to the Exhibition. By 8pm, service on the route was operating fairly normally.
On top of these problems, congestion northbound from Lawrence to Yorkdale s evident from about 3pm to 6:30pm.
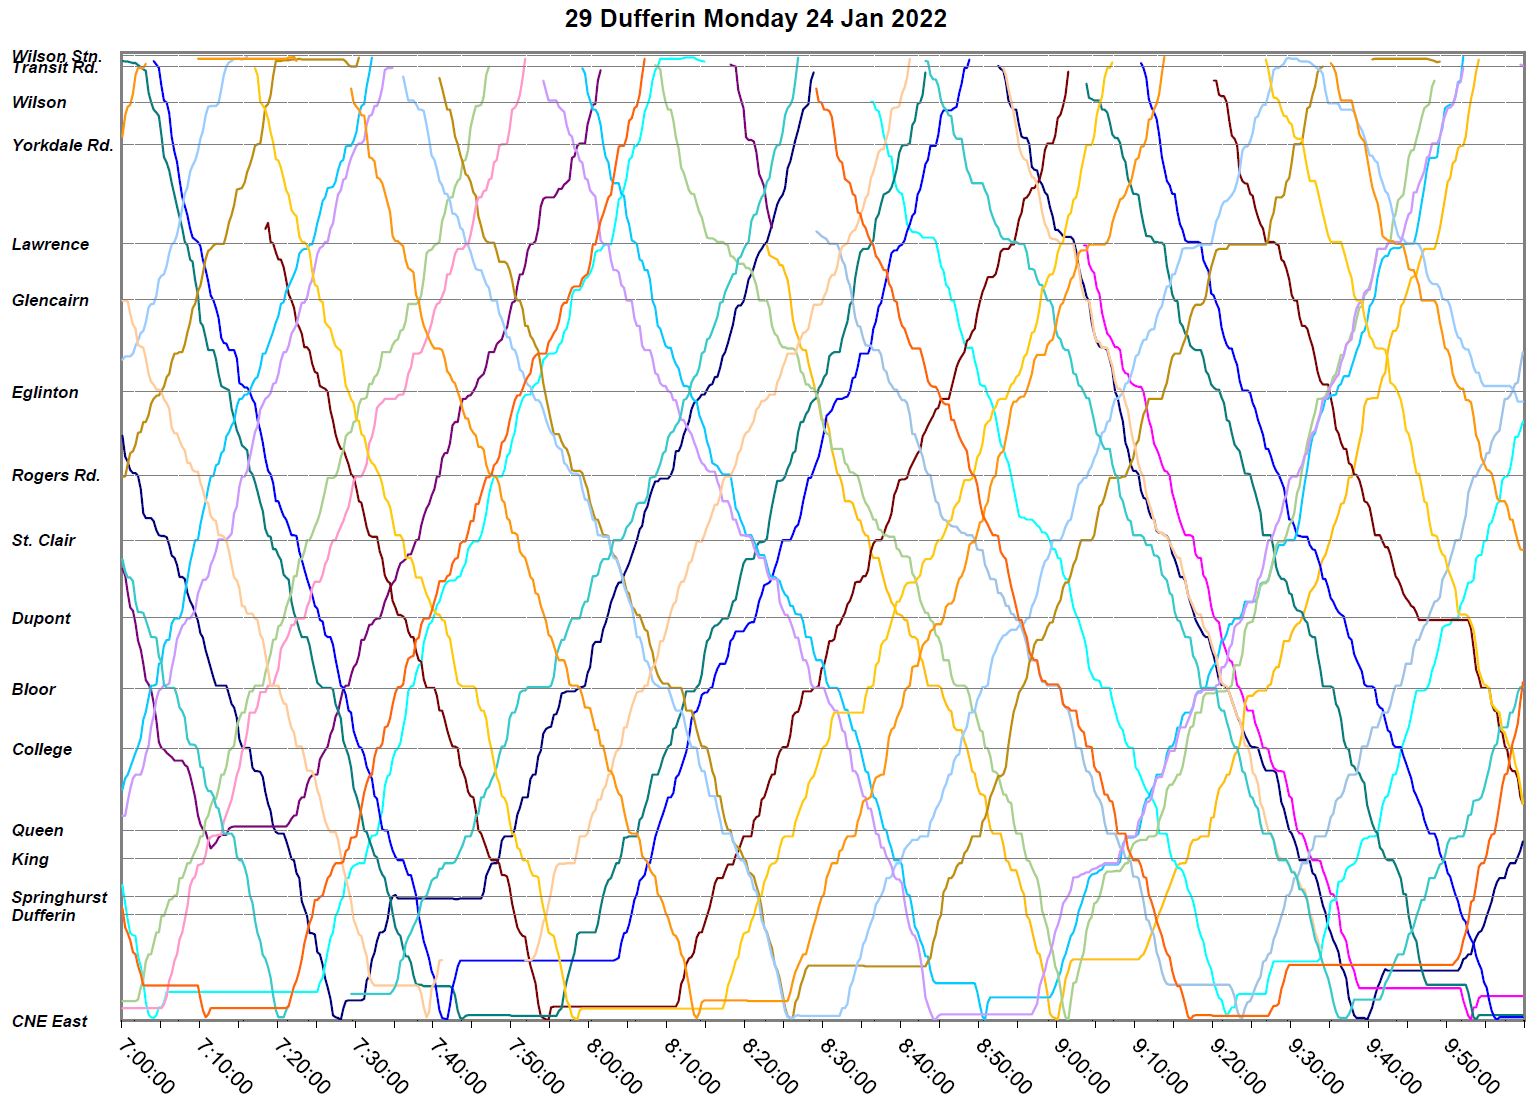
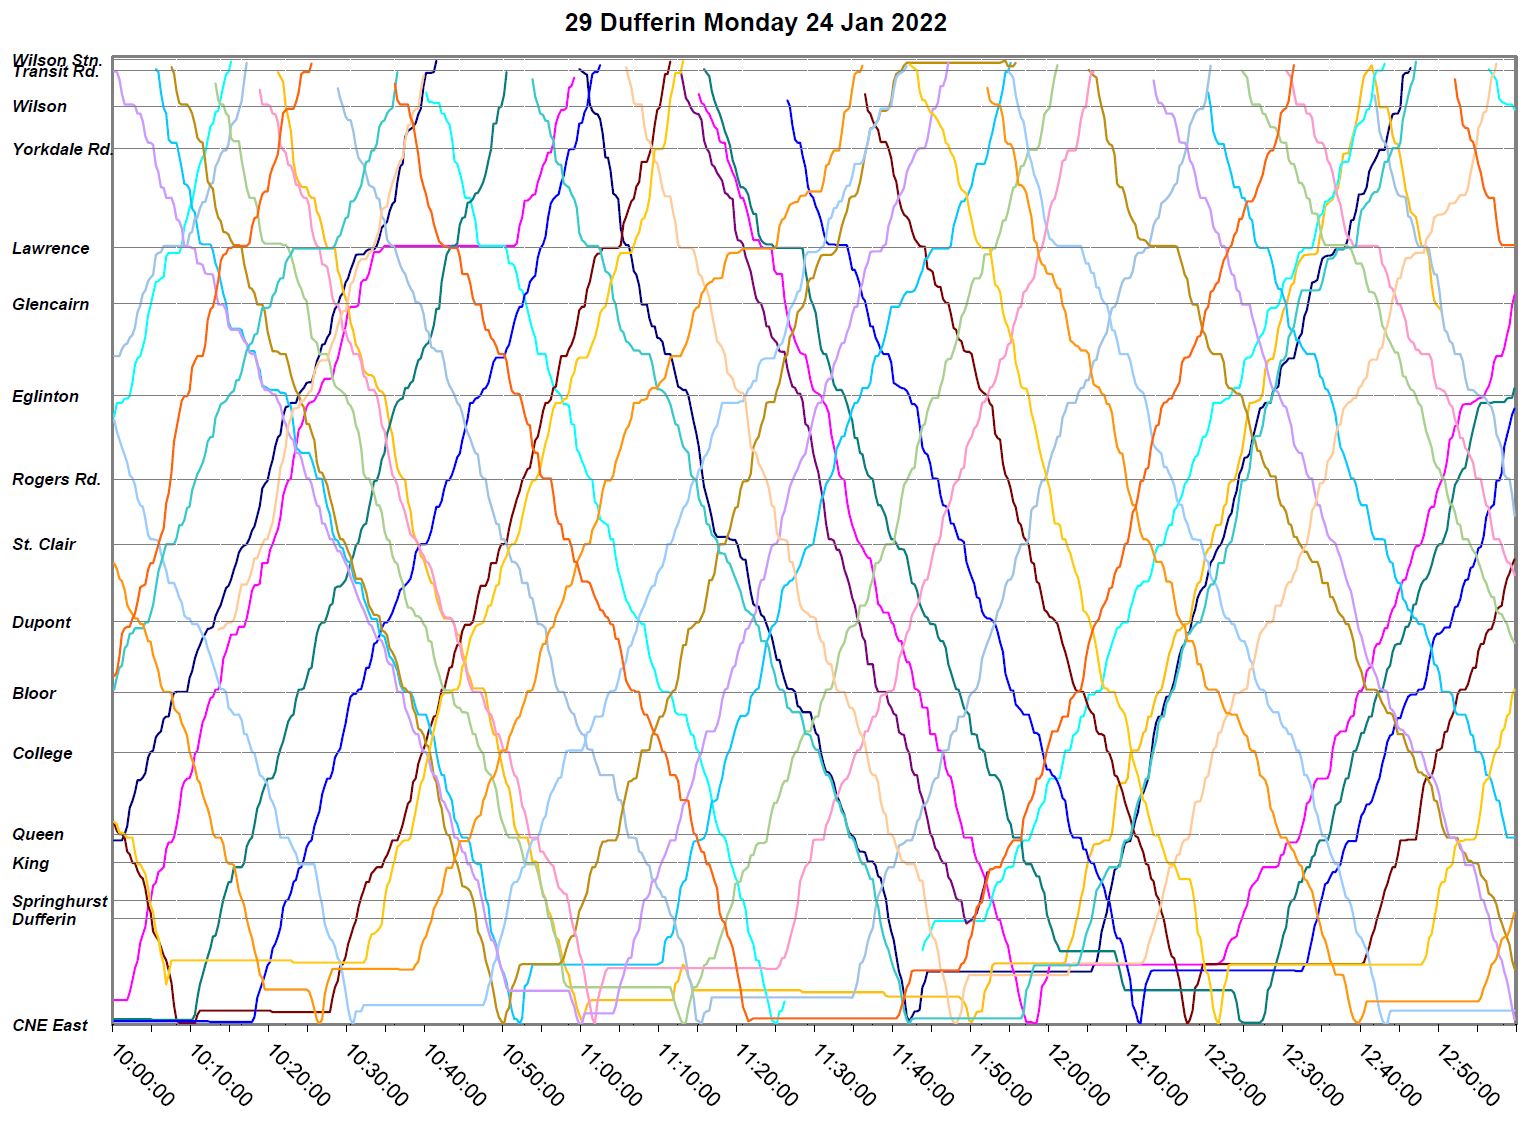
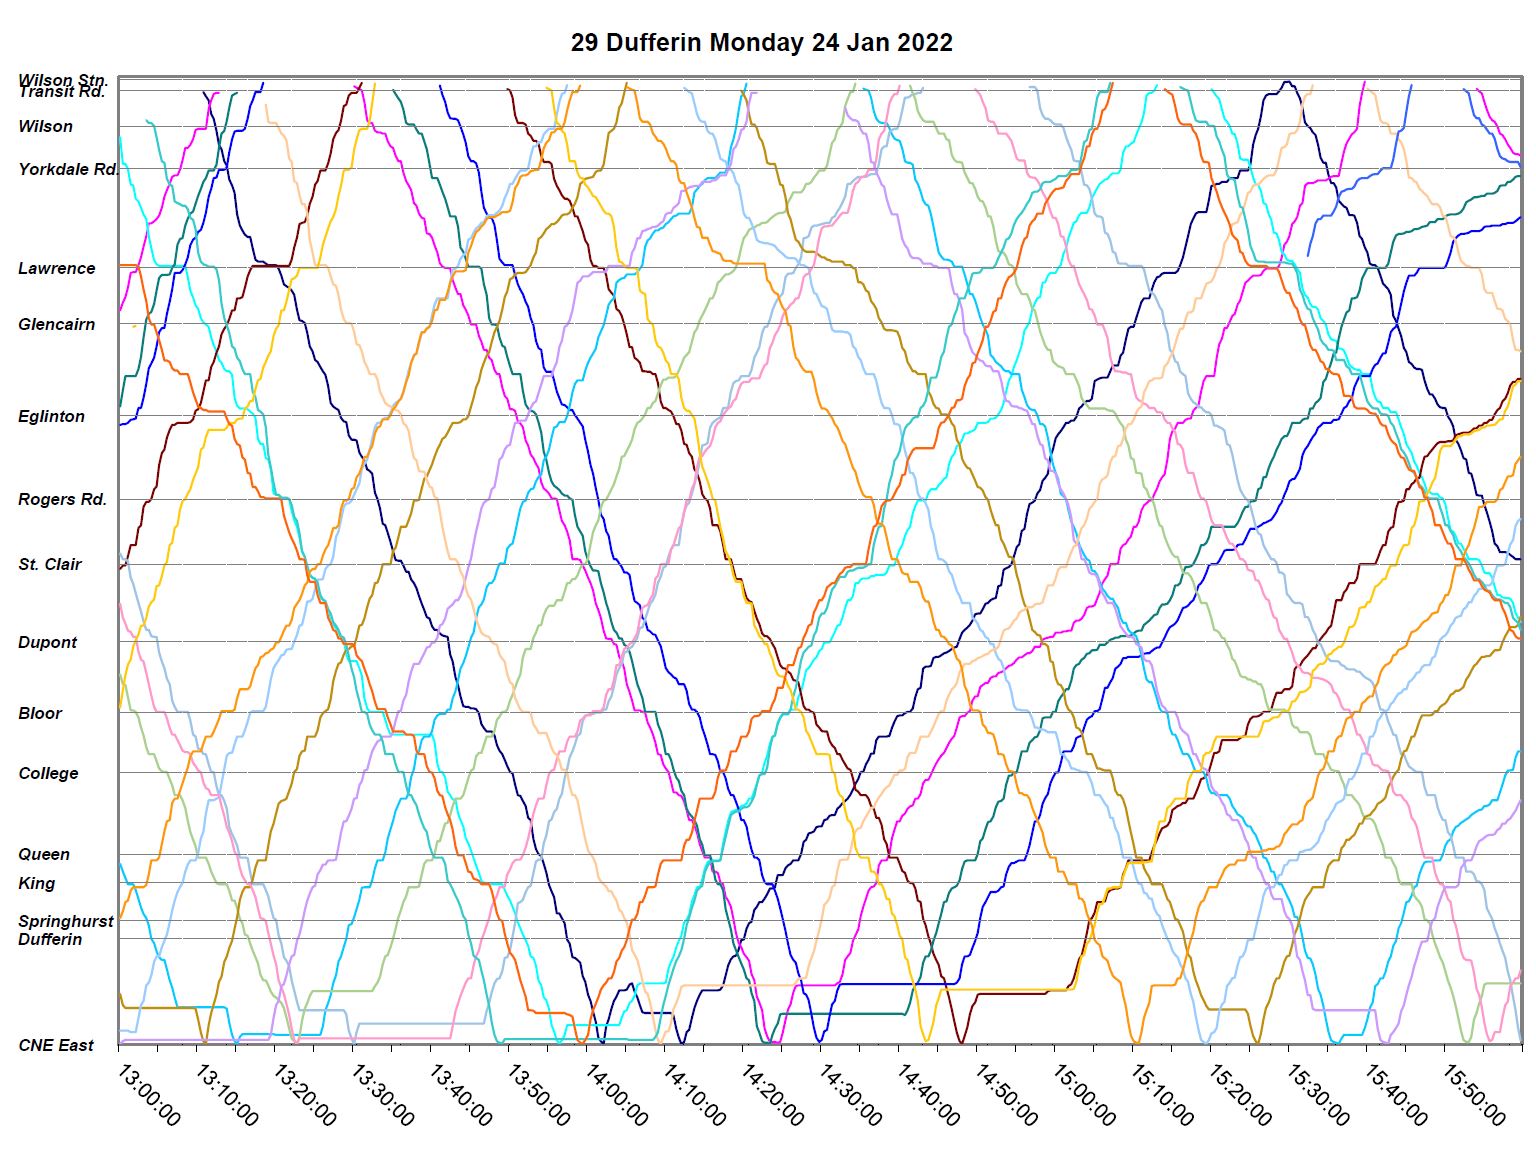
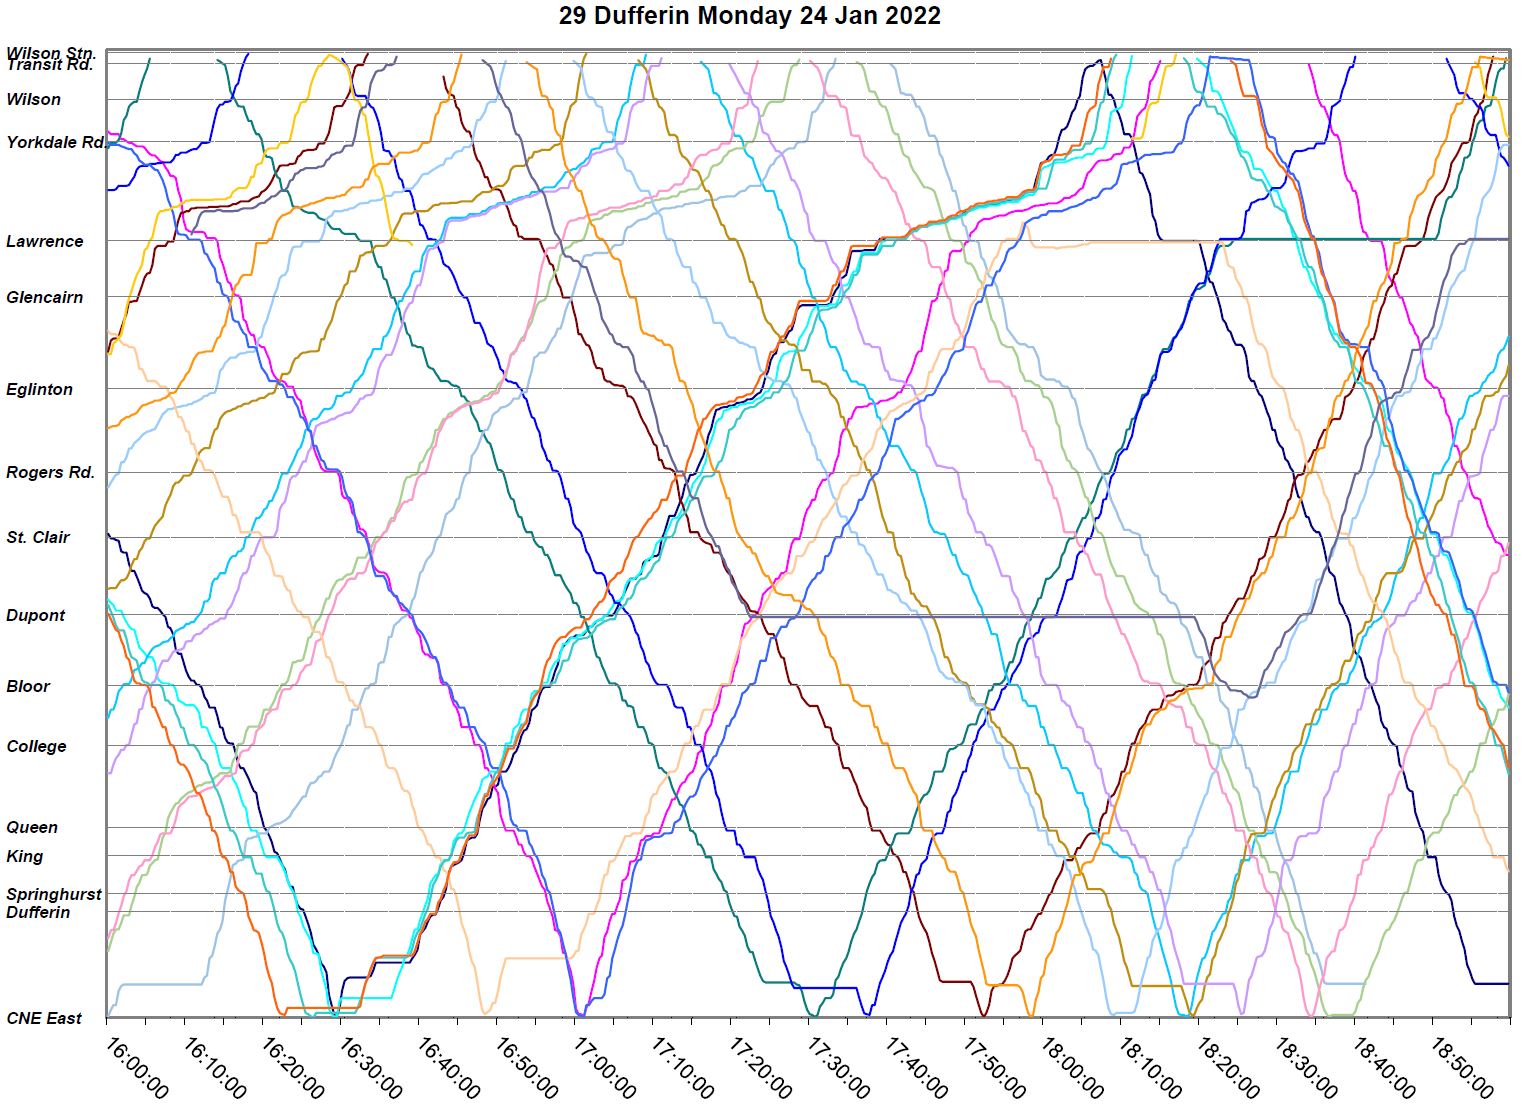
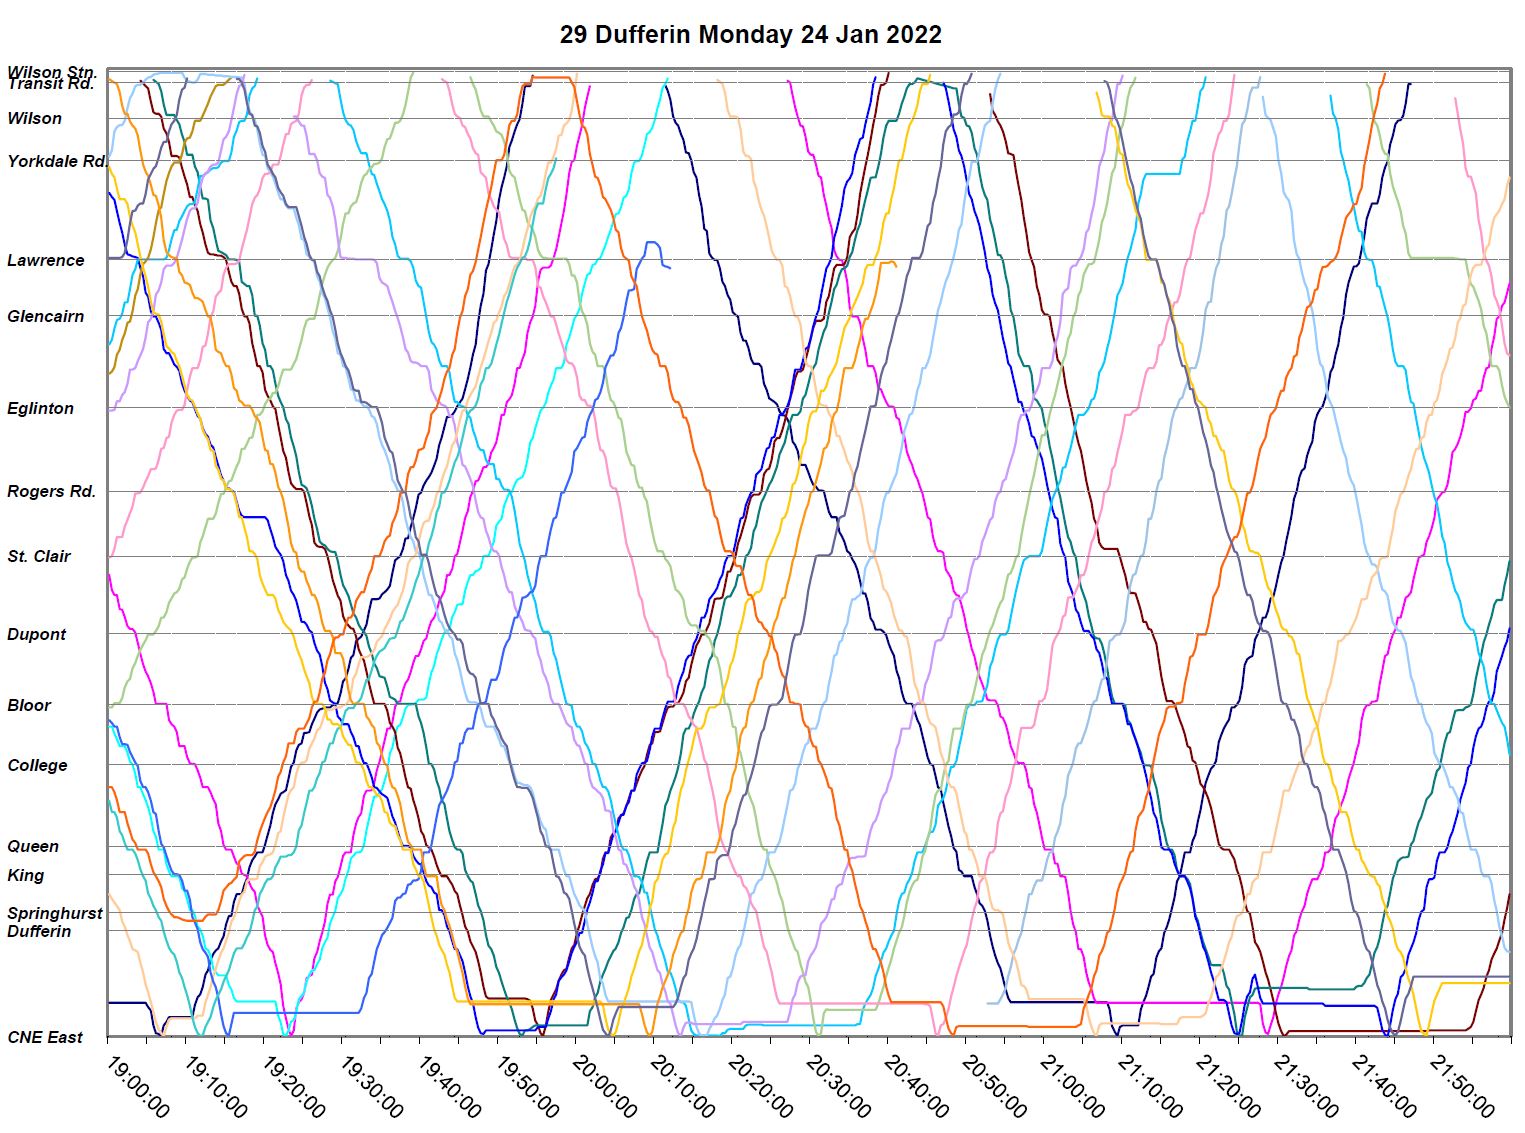
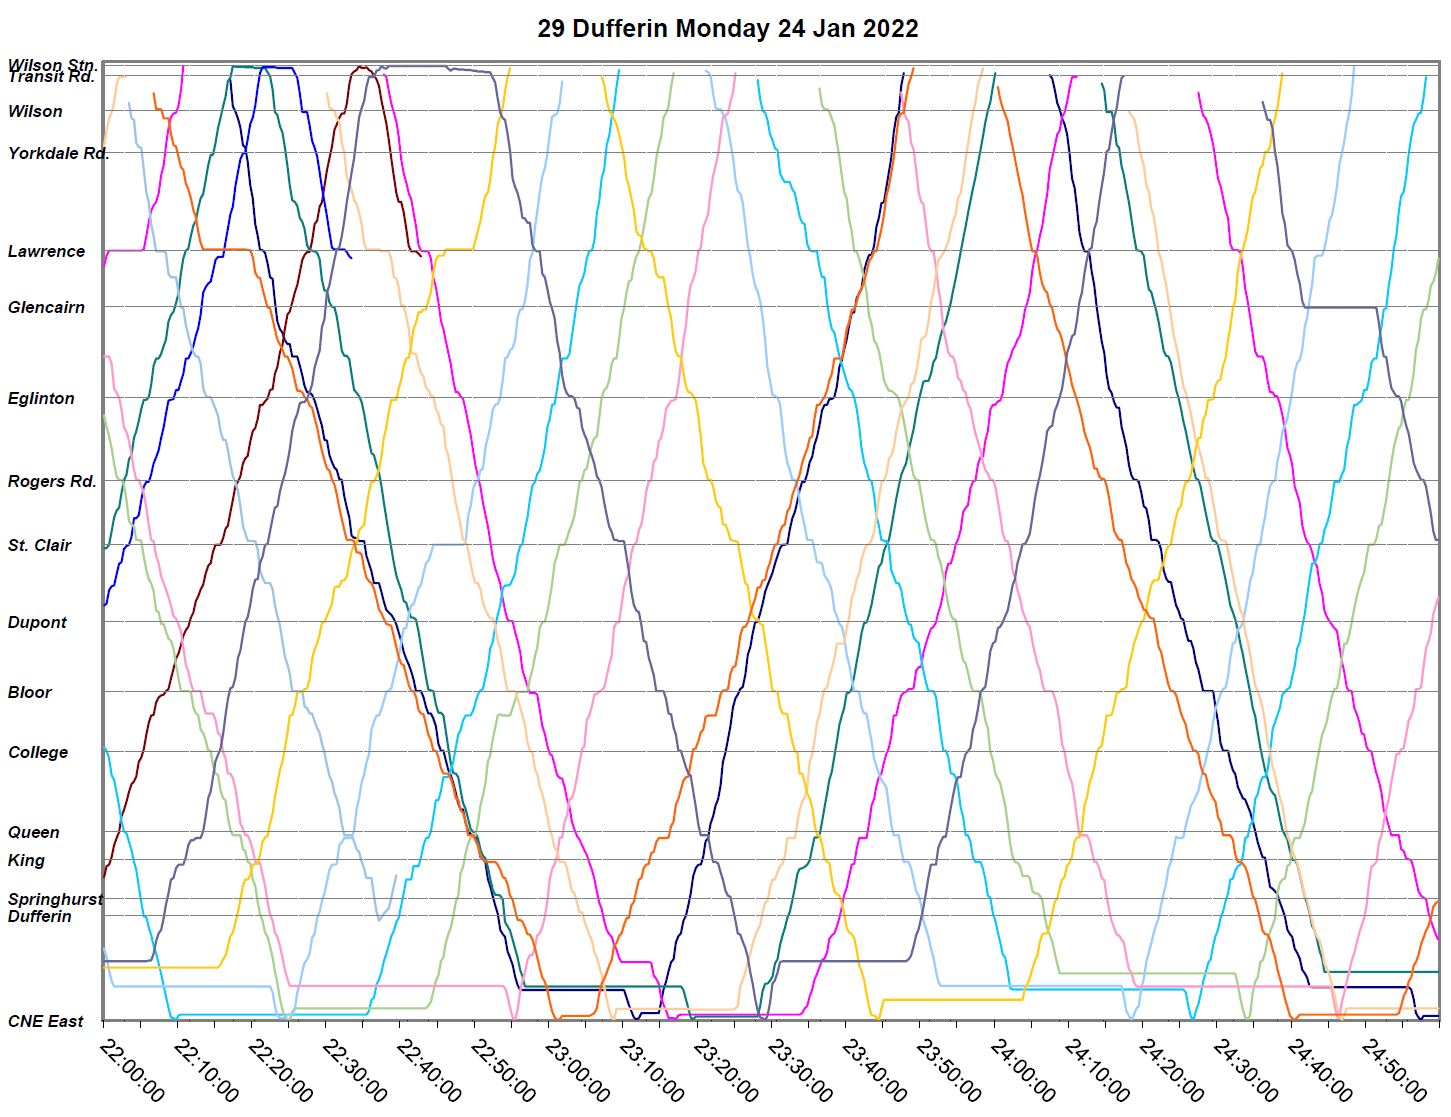
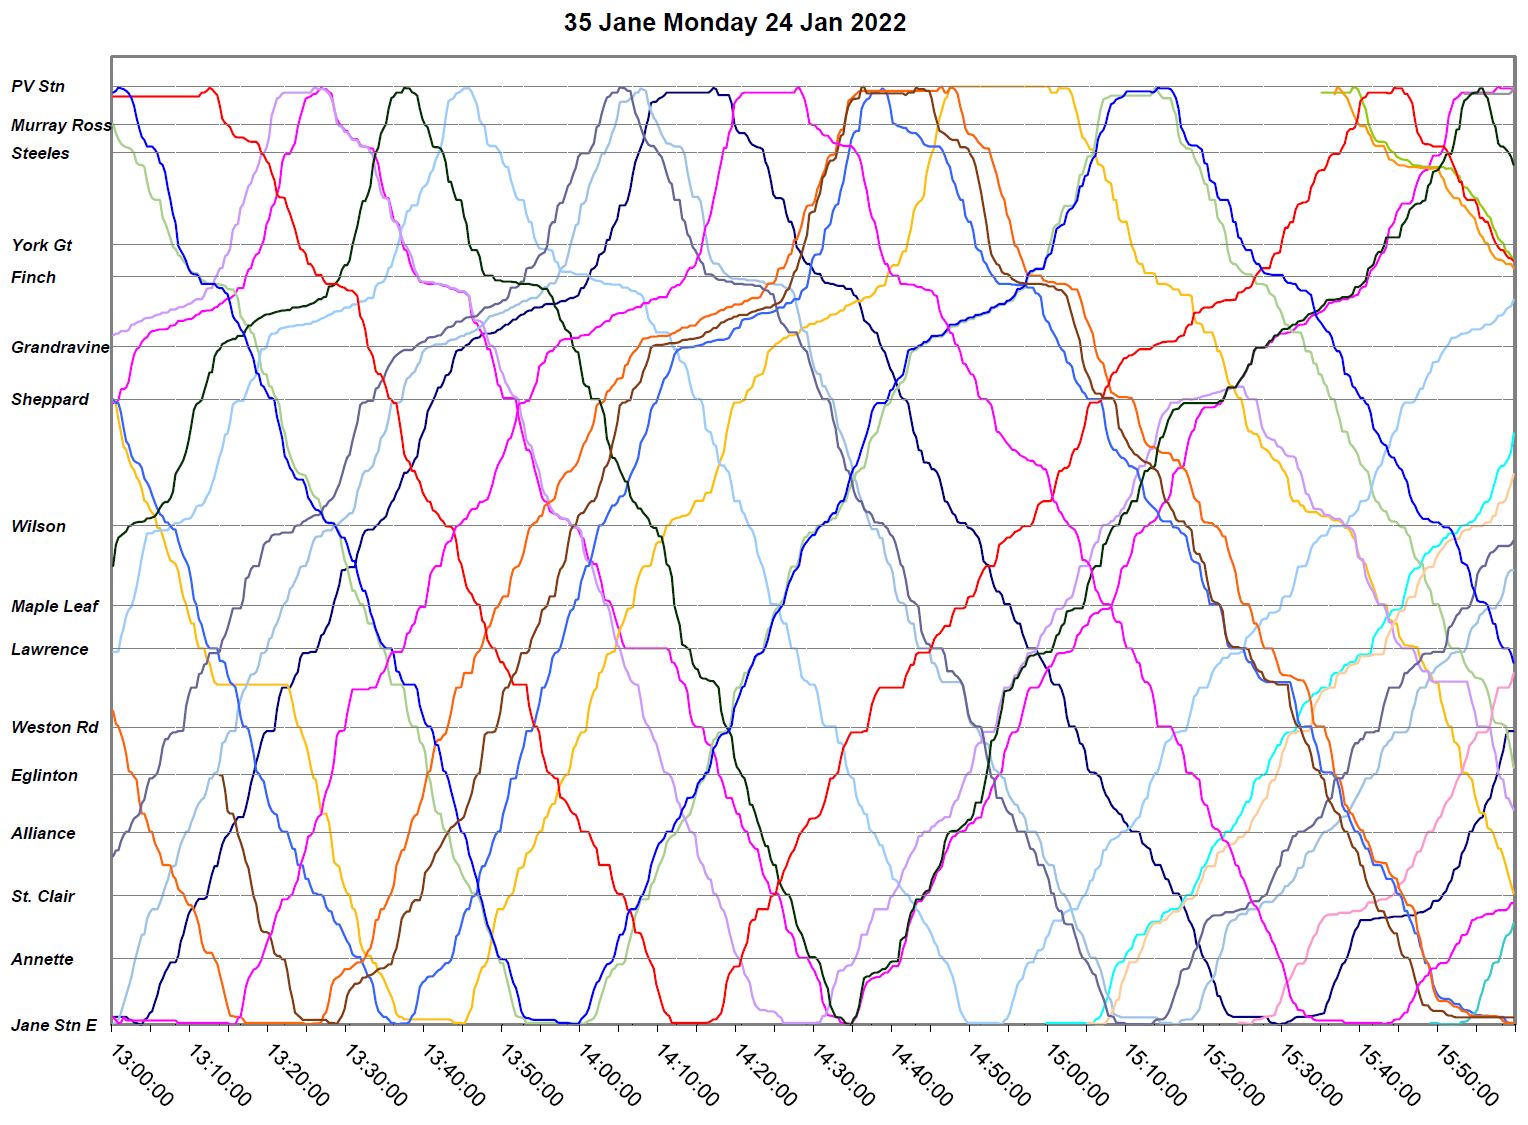
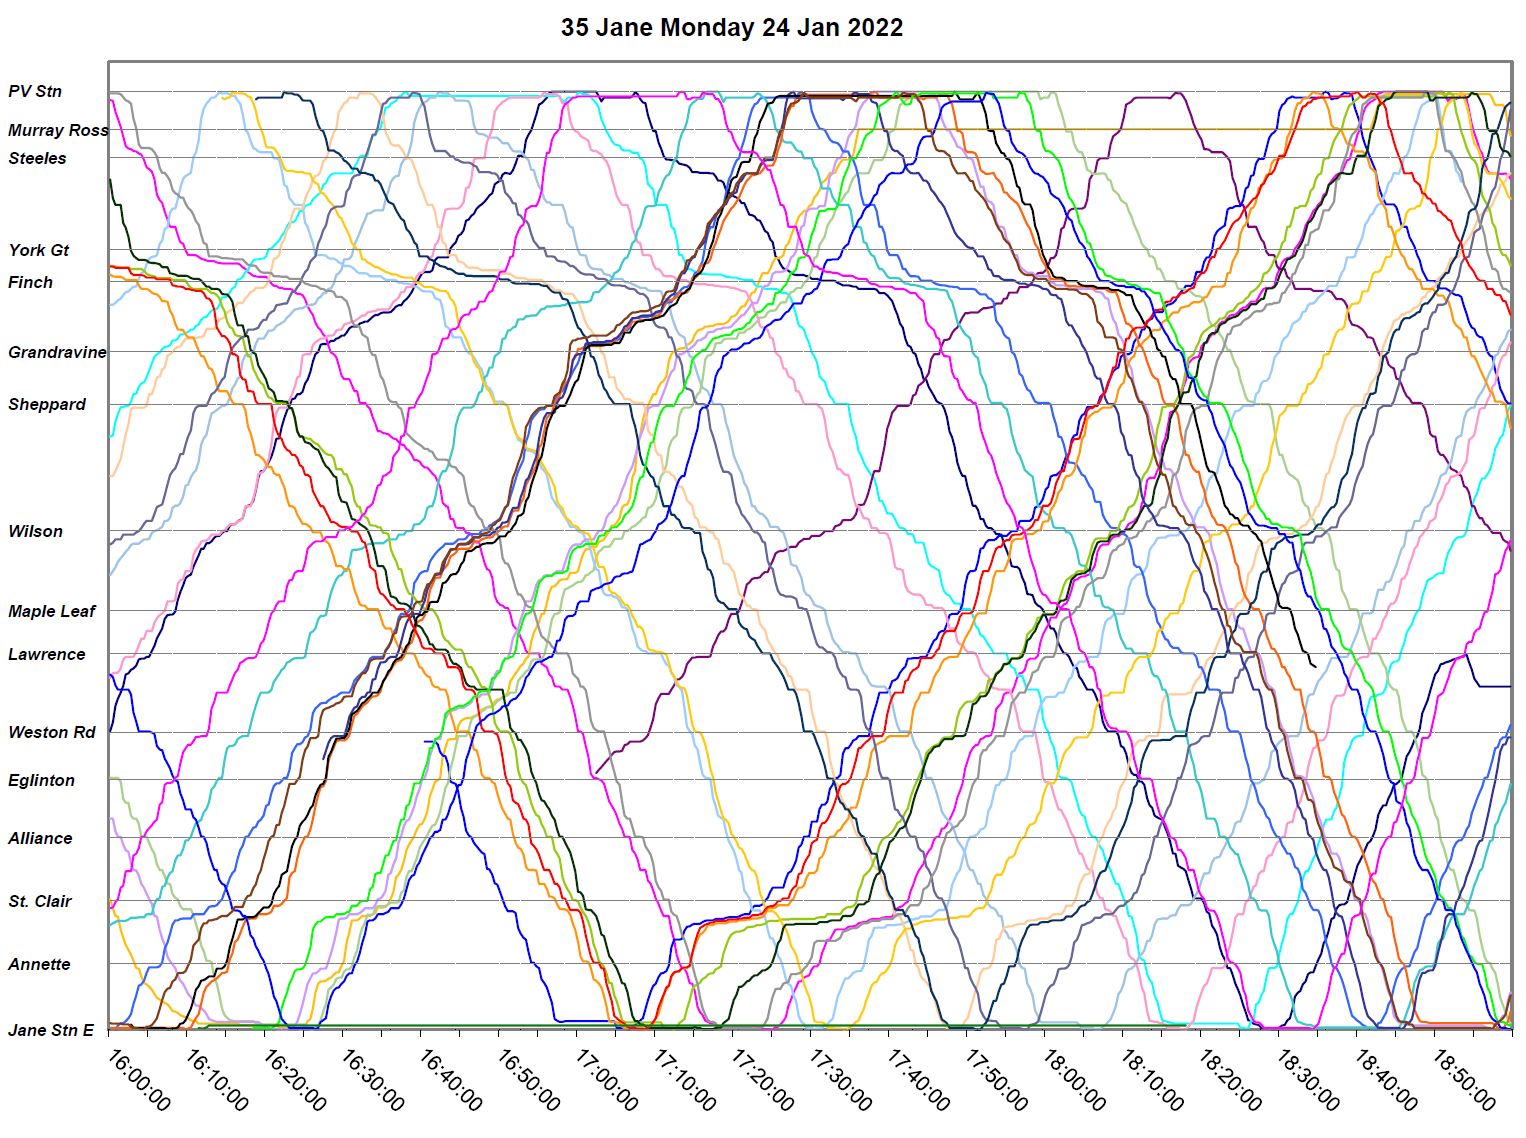
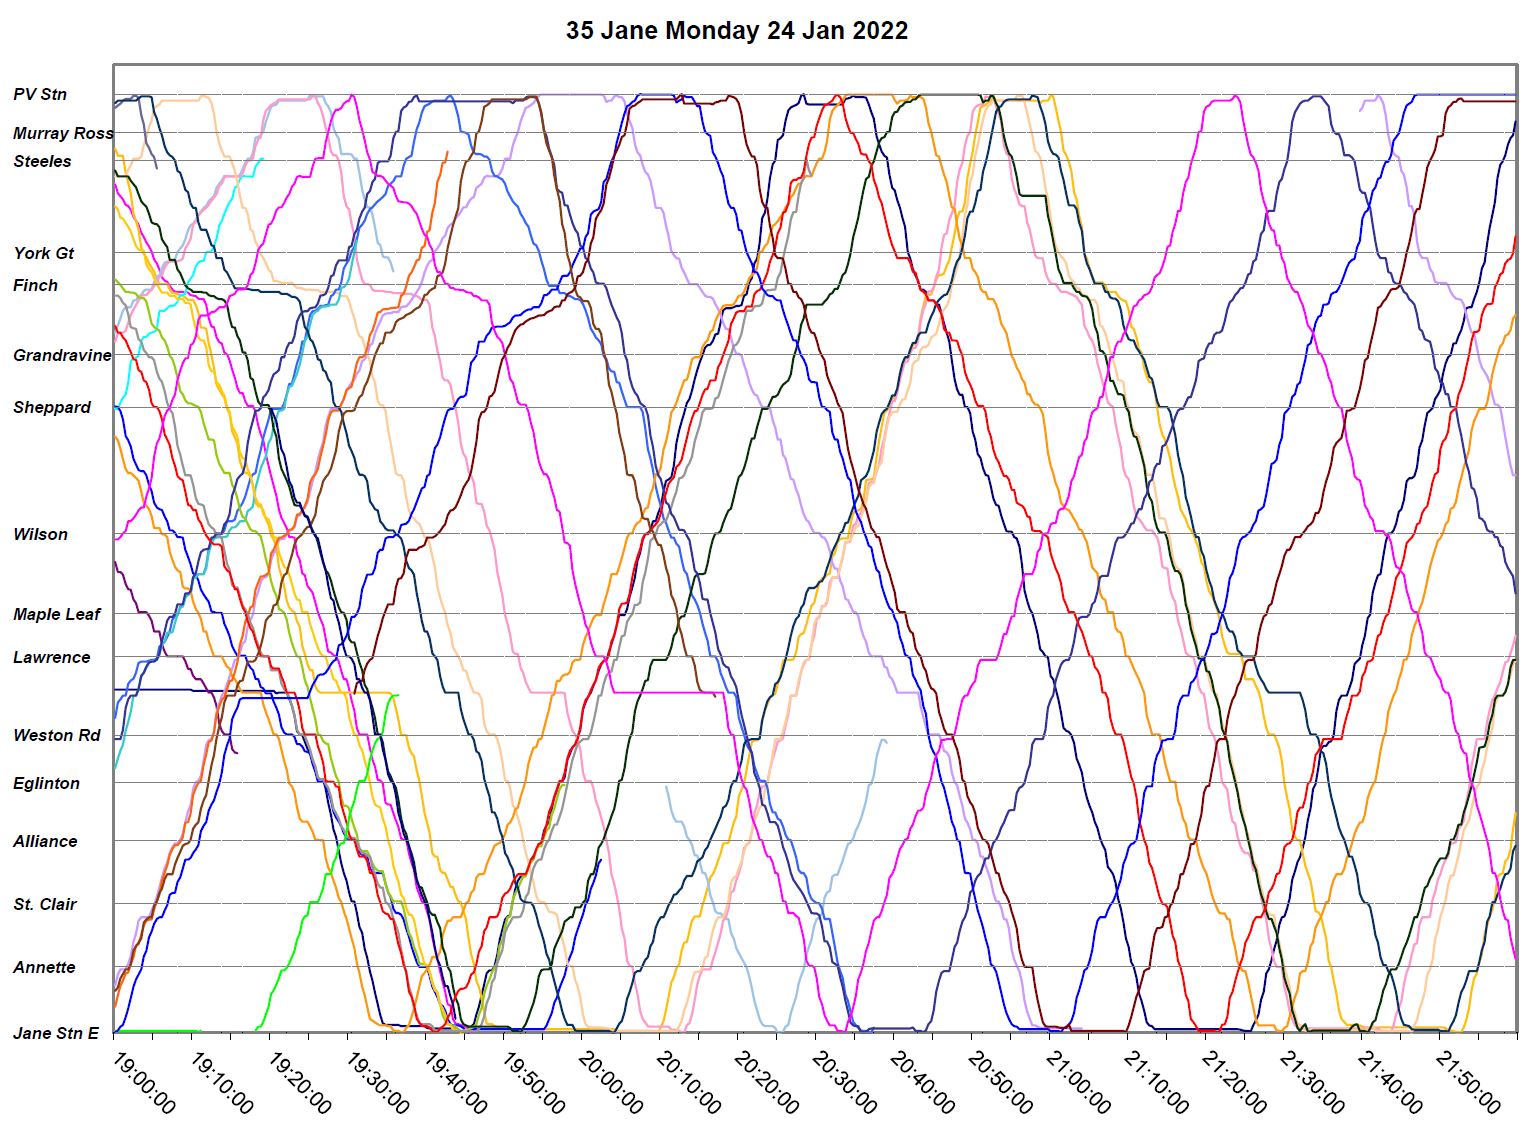
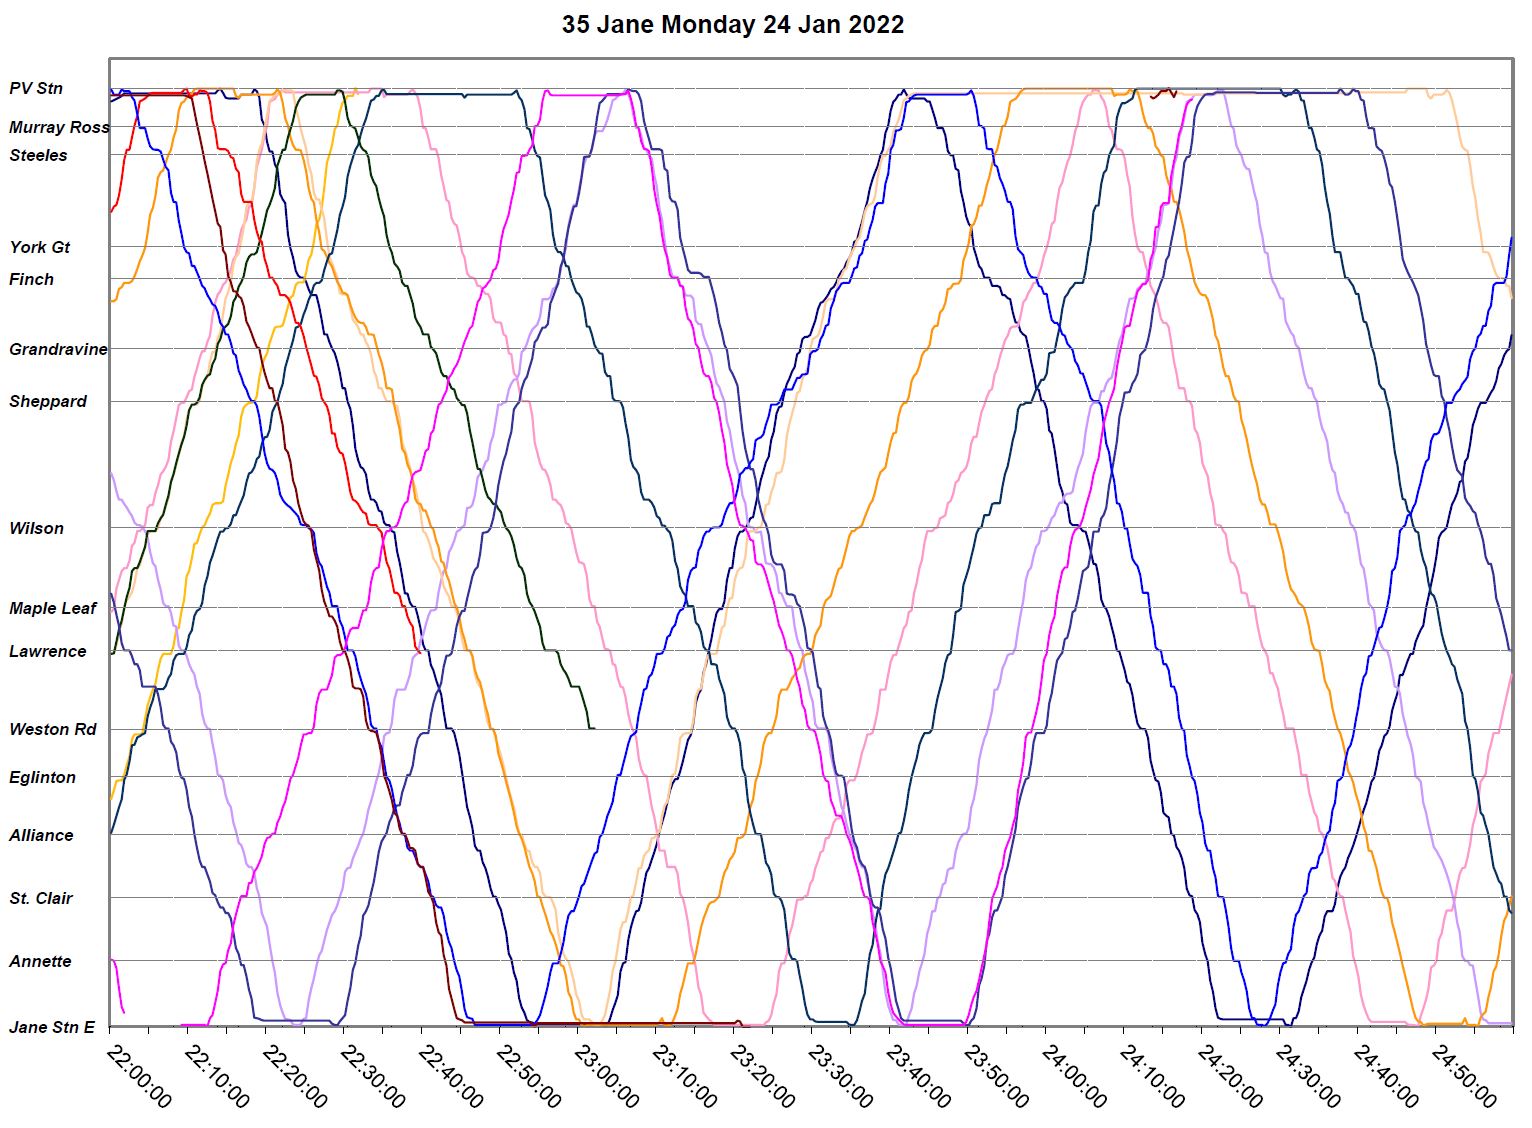
Monday, January 24, 2022
These charts show the service as operated one week after the storm, and congestion is concentrated on one part of the route. During most of the day, buses travel freely and at consistent speeds (indicated by the slope of the lines).
As with many of these charts, some bunching of service is evident, notably when a parade of buses leaves the Princes Gate Loop together at about 4:30pm.
However, the interesting point is that most of the congestion (seen as lines that become more horizontal than vertical) occurs in the afternoon northbound between Lawrence Avenue and Yorkdale Road.
This is a typical congestion location on busy shopping days when traffic backs up to get into Yorkdale Mall’s parking lot, and it was at its worst on Boxing Day in pre-pandemic times. This pattern continues on other days showing that the congestion was mainly concentrated at one spot, not an effect along the route.
A Look At Other Routes
For various reasons including monitoring of potential “red lane” routes and to keep track of the changing state of the streetcar system, I have been collecting data on certain routes through the winter. This is normally not a representative period for service analysis except to see how well, or not, service fared under difficult weather conditions. The routes shown below were selected to give a sense of behaviour among the routes for which I have data.
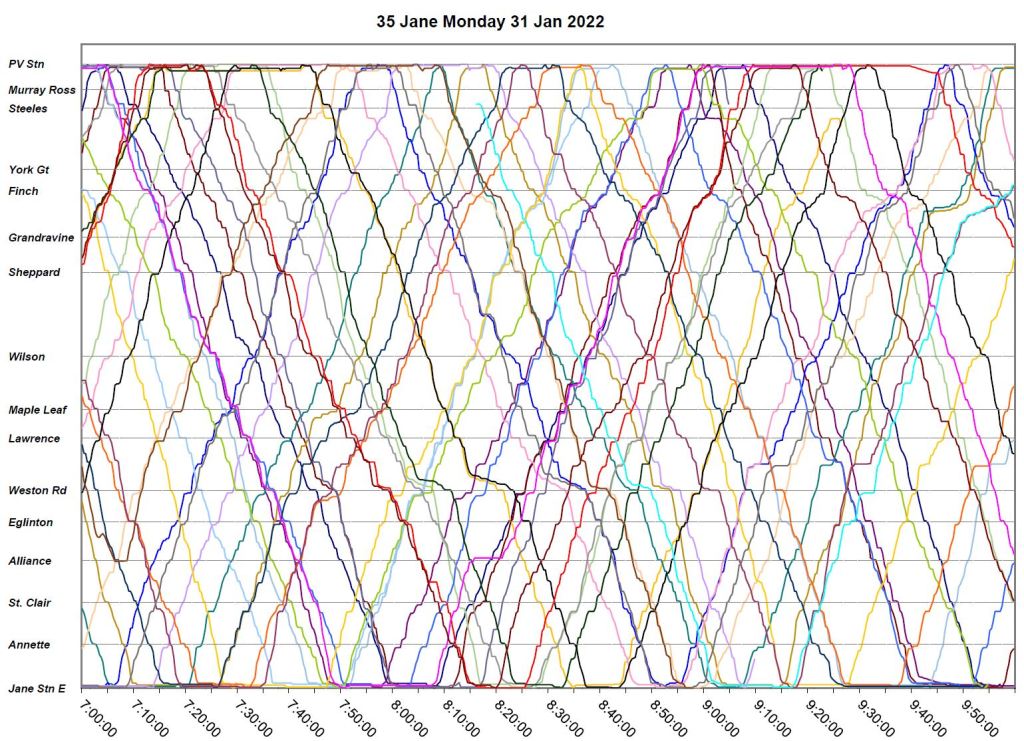
35 Jane
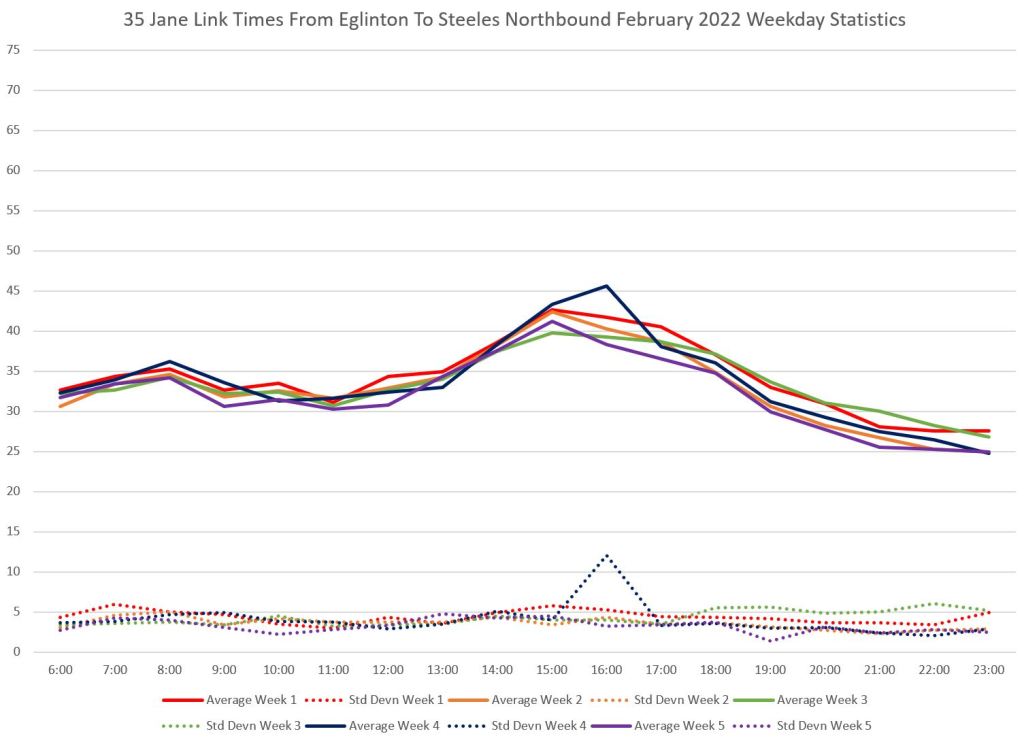
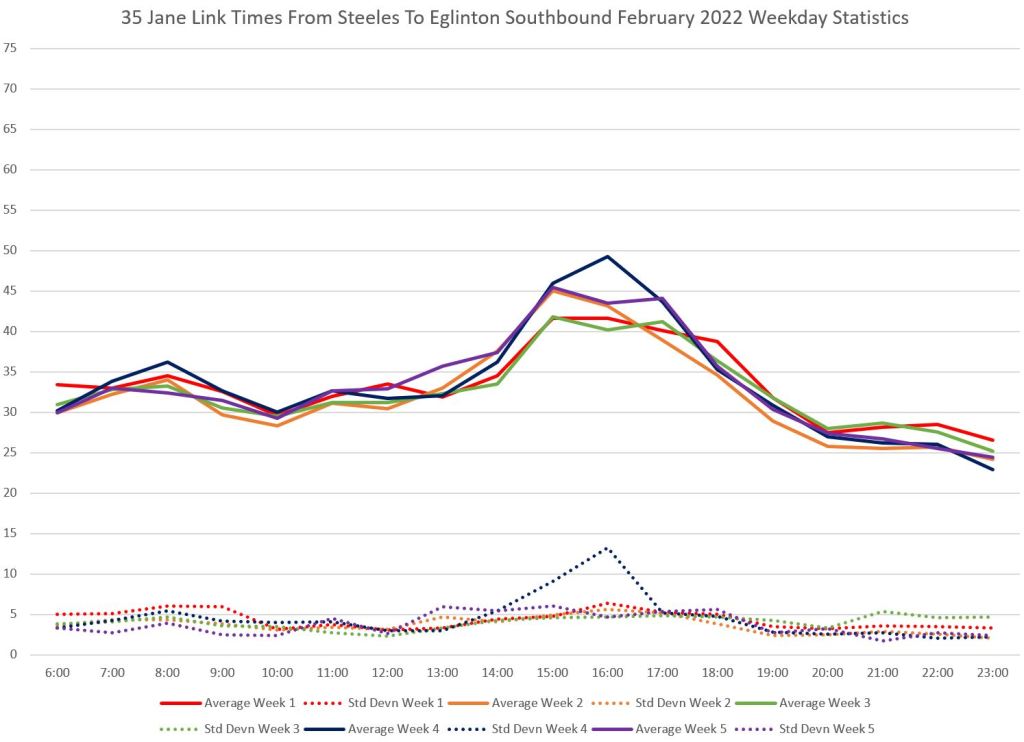
As a comparison, I looked at the 35 Jane bus, a north-south route in similar territory and not far away. It shows the same bump in travel times in January Week 3, but the travel time averages stay higher through to the end of February.
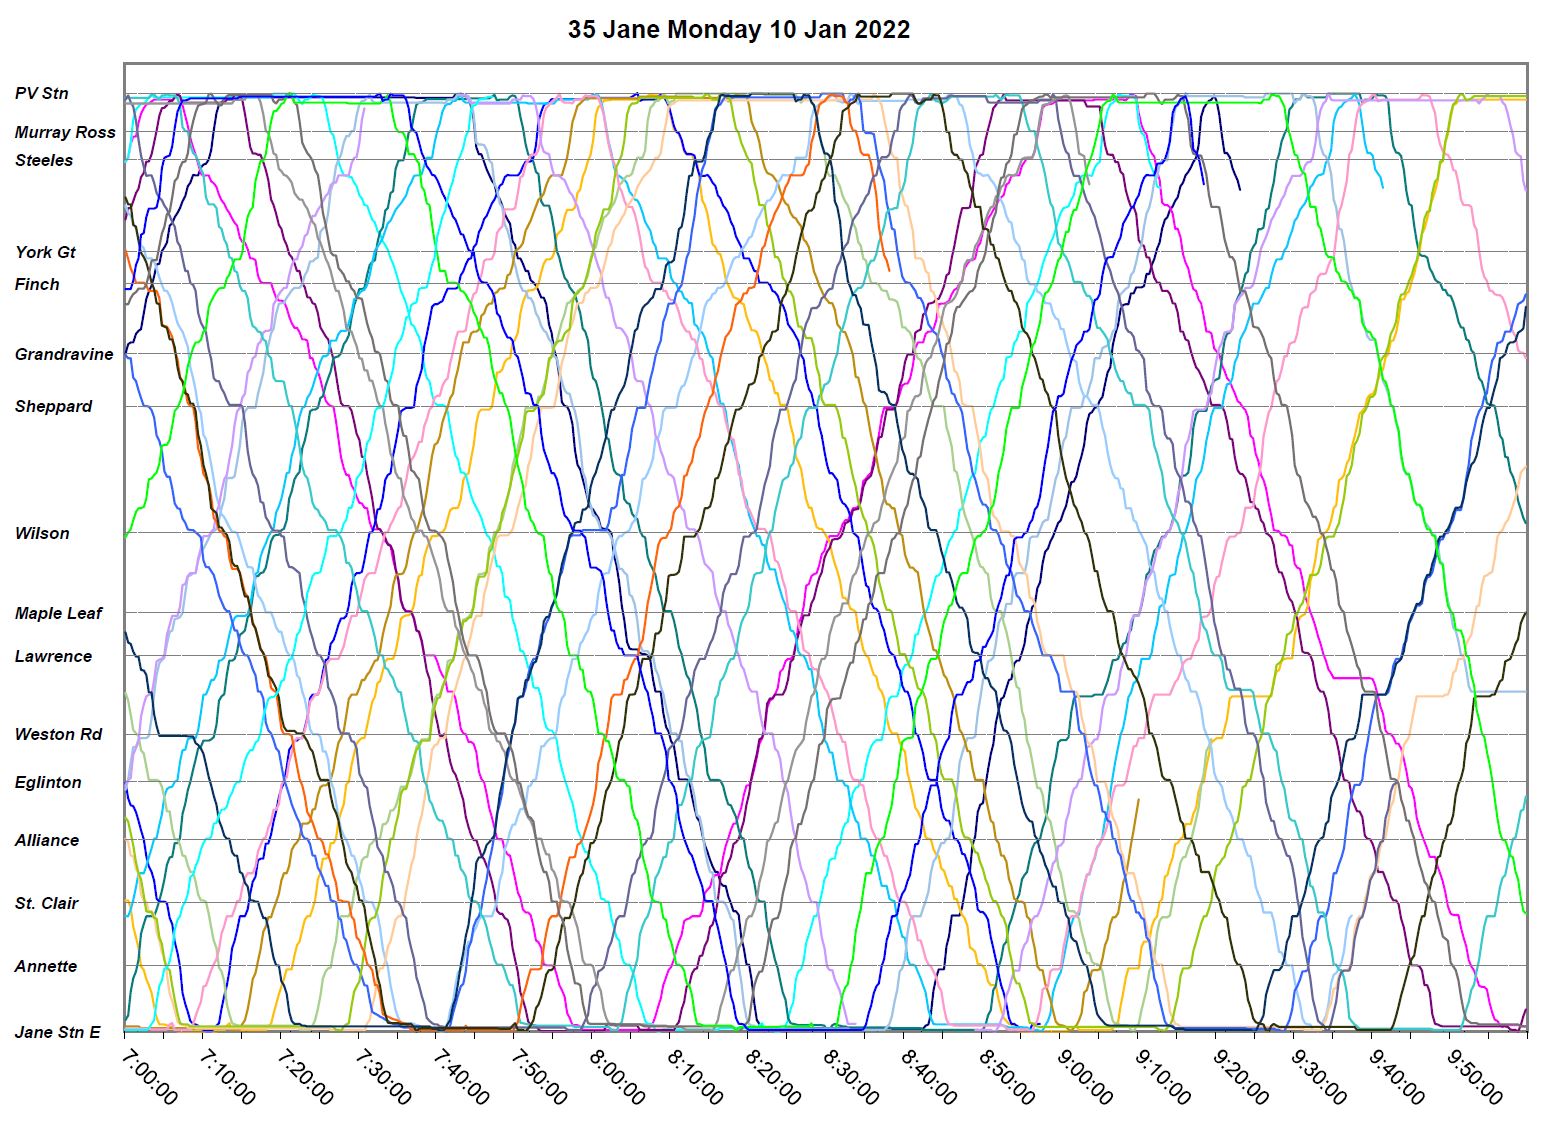
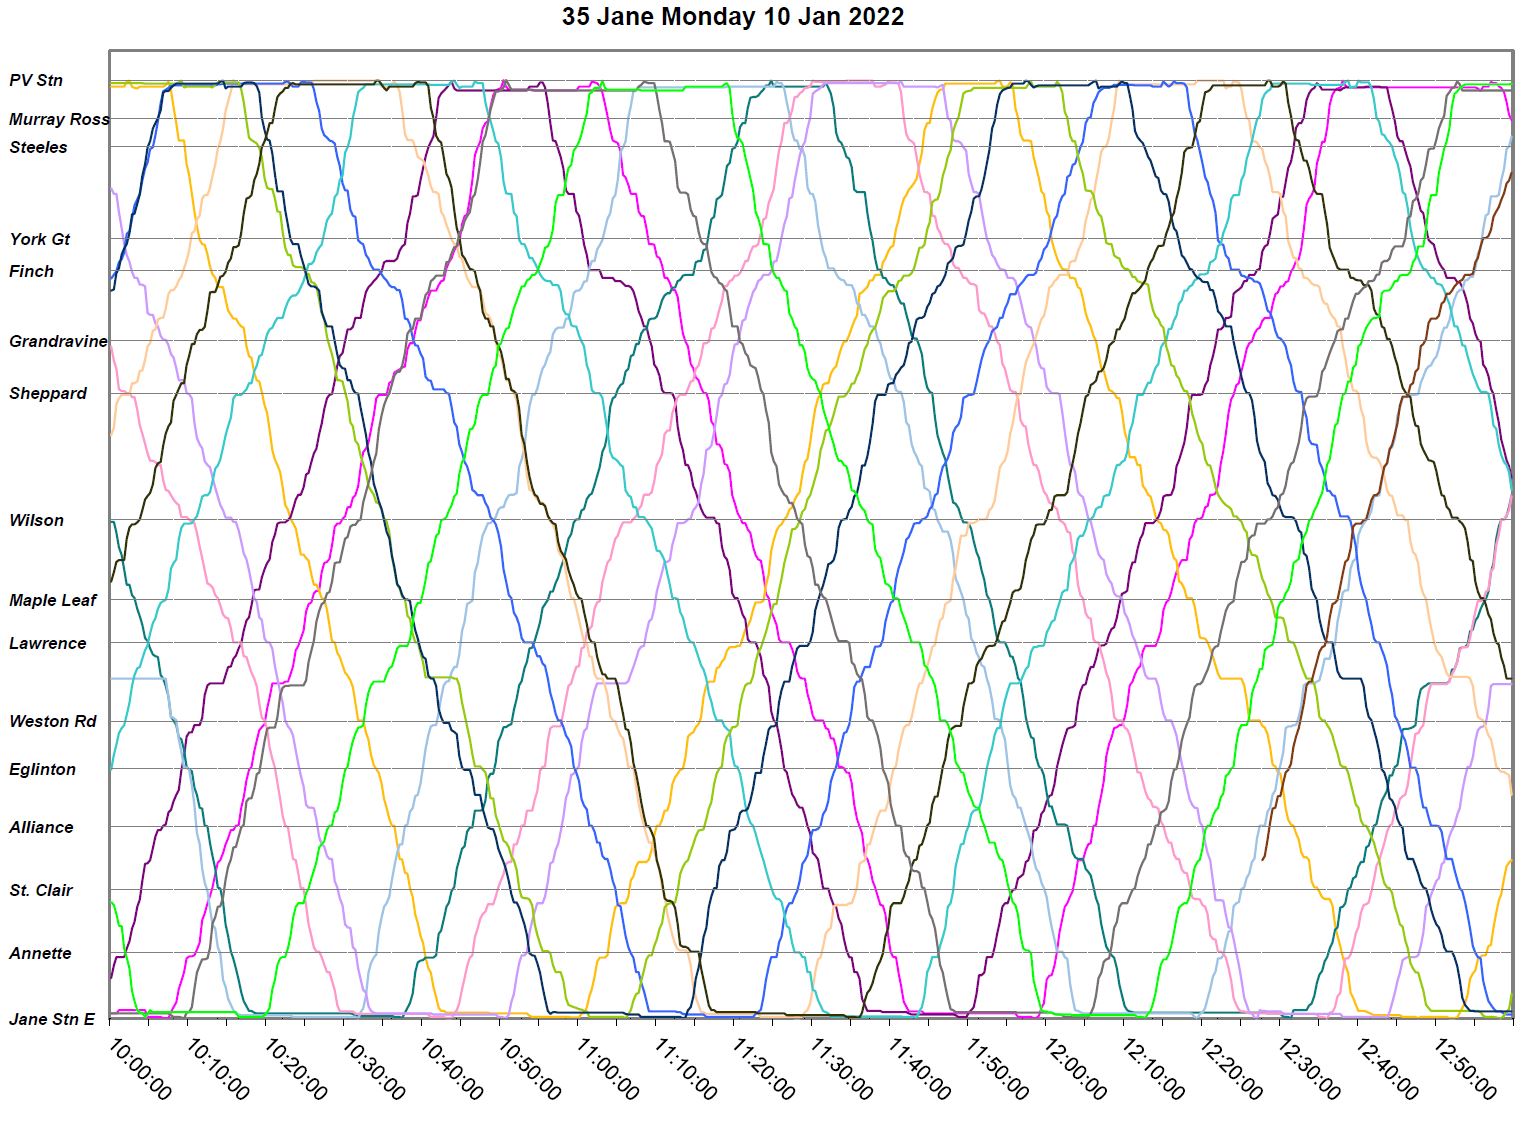
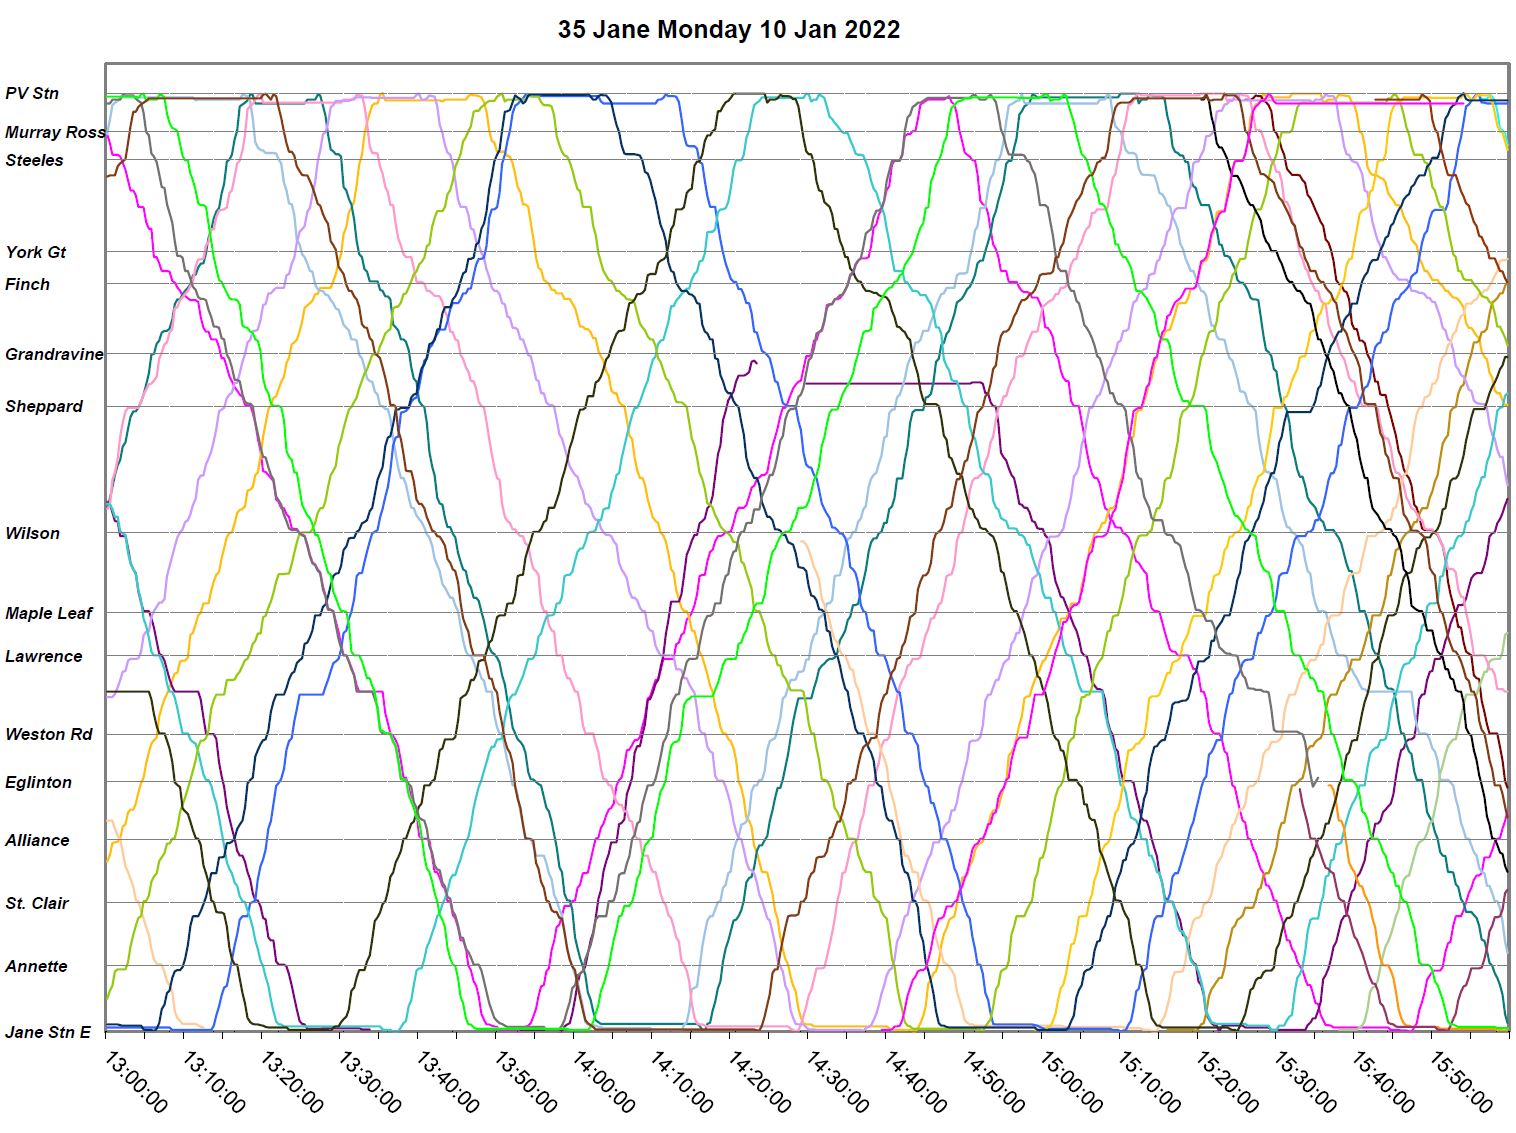
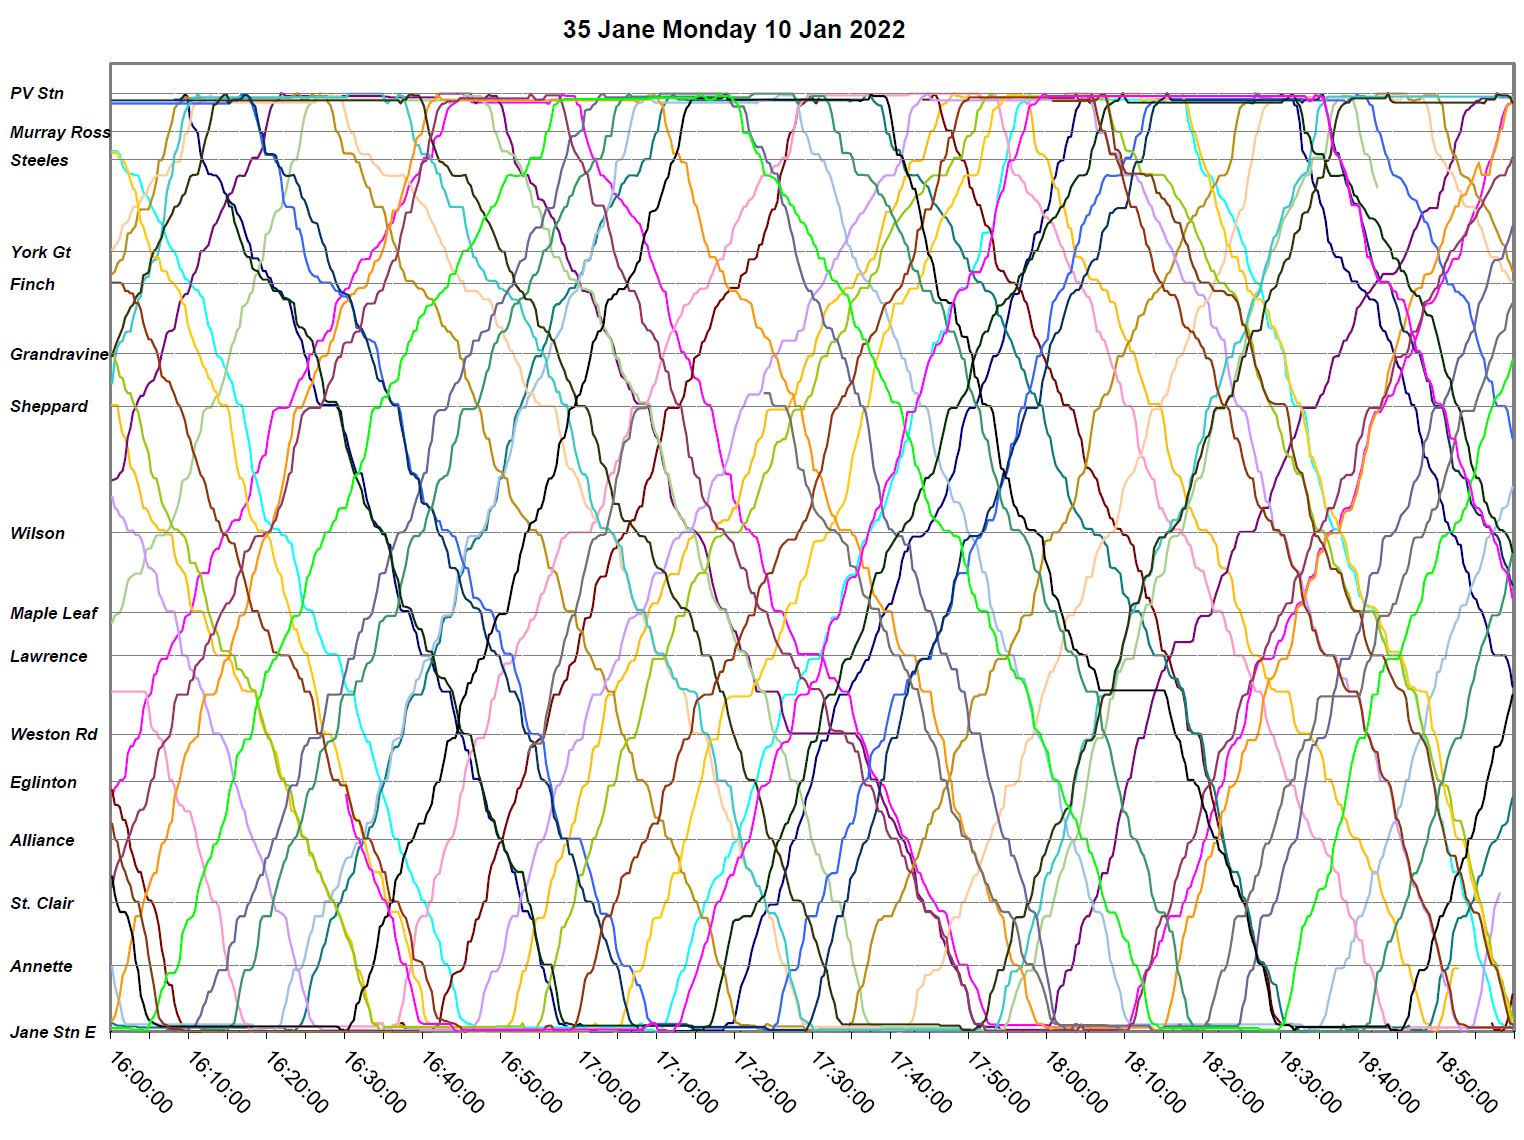
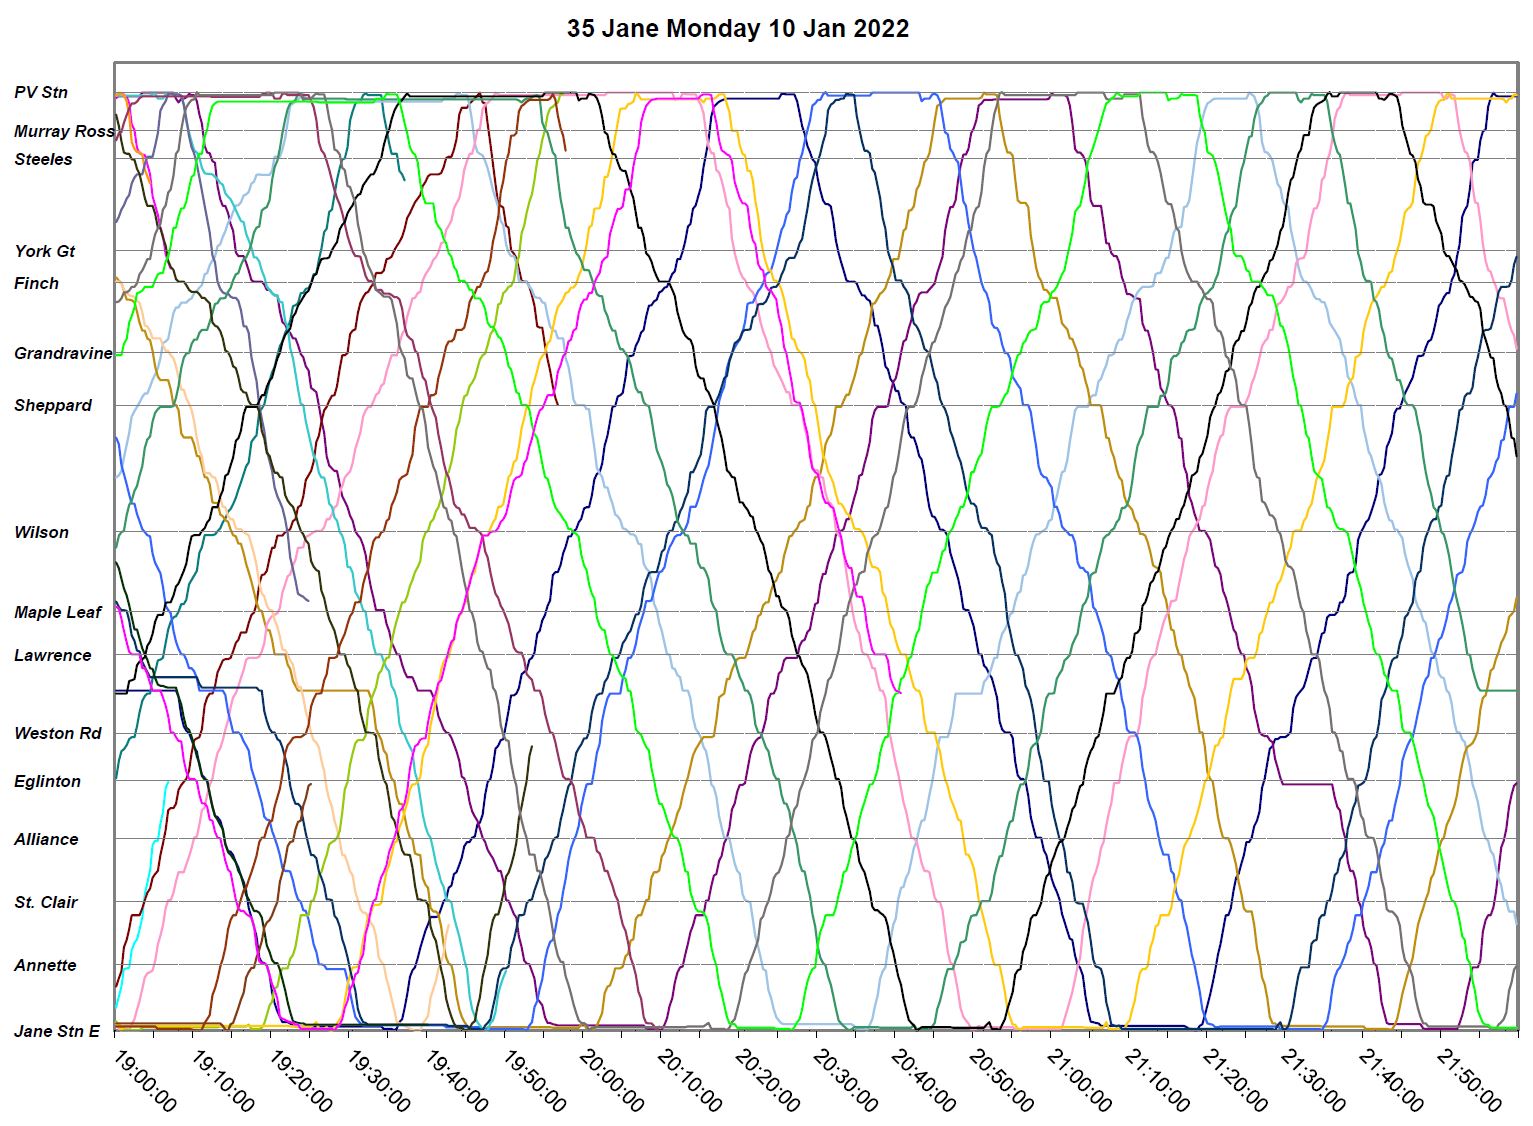
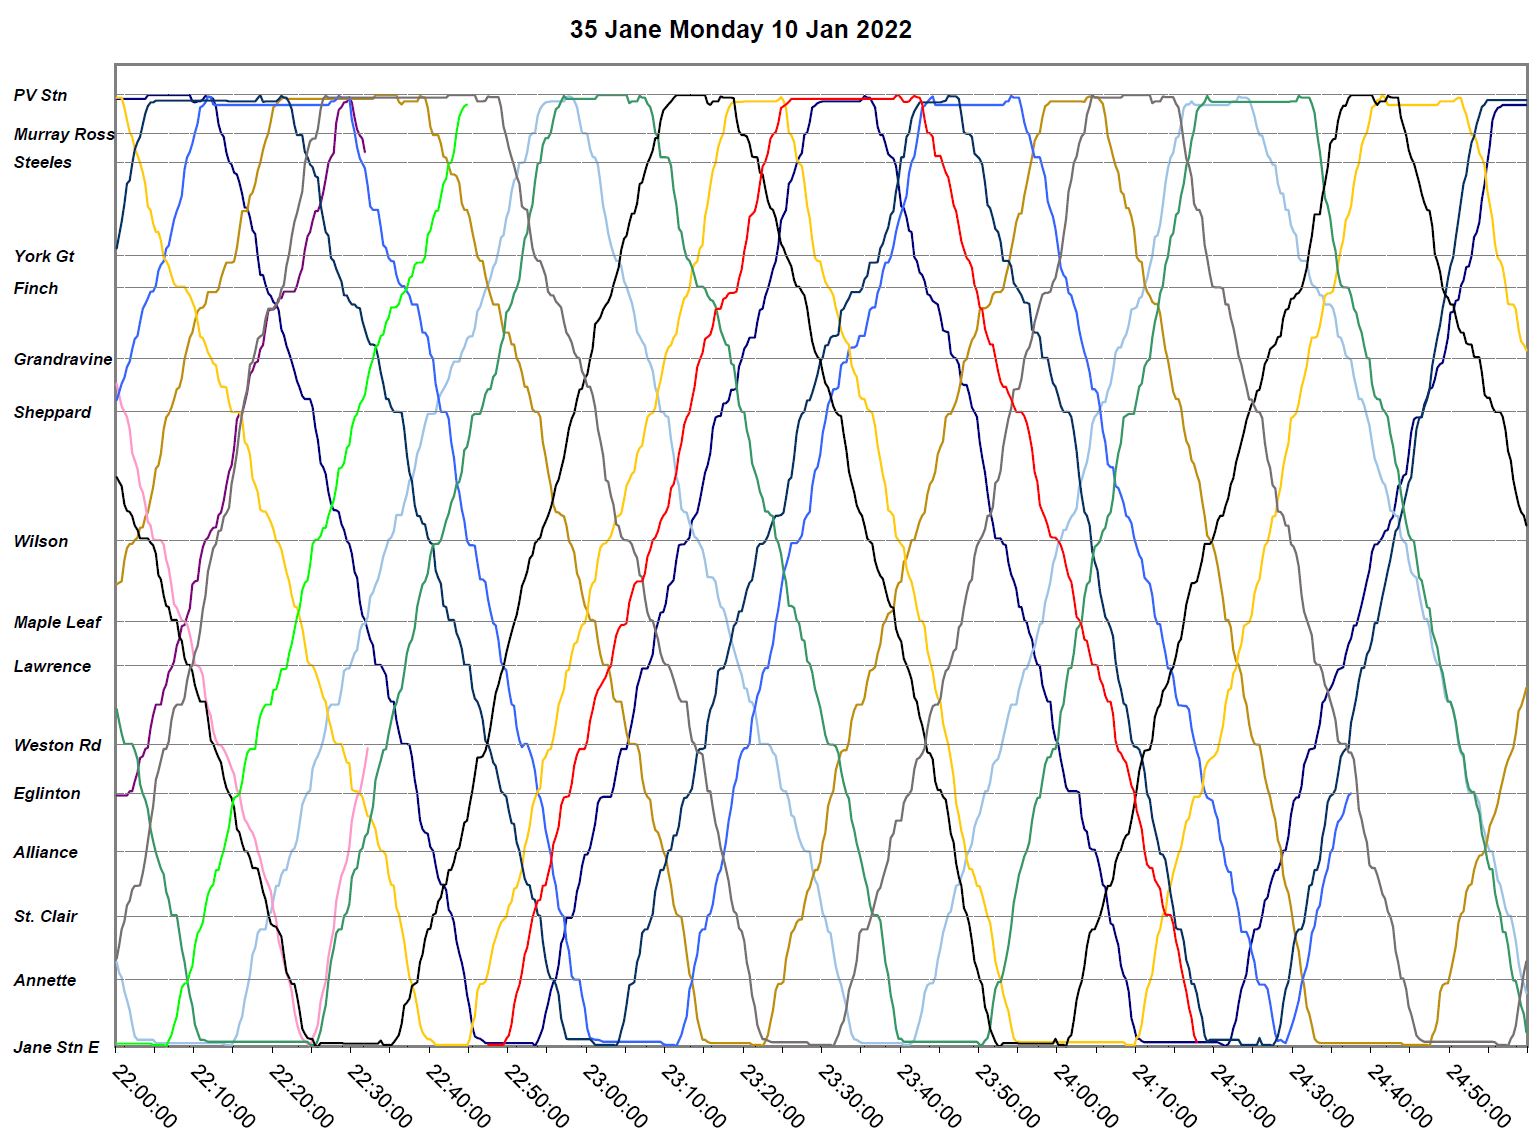
January 10, 2022
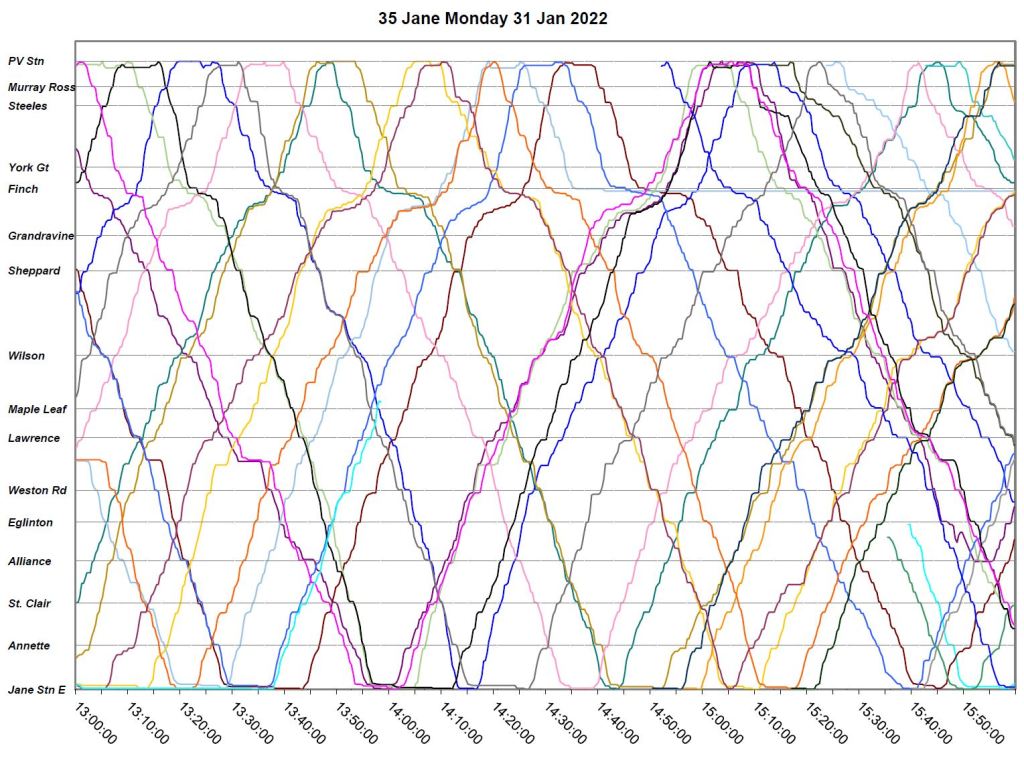
Here is the 35 Jane local service one week before the storm. There is some bunching and a few short turns, but no obvious signs of congestion.
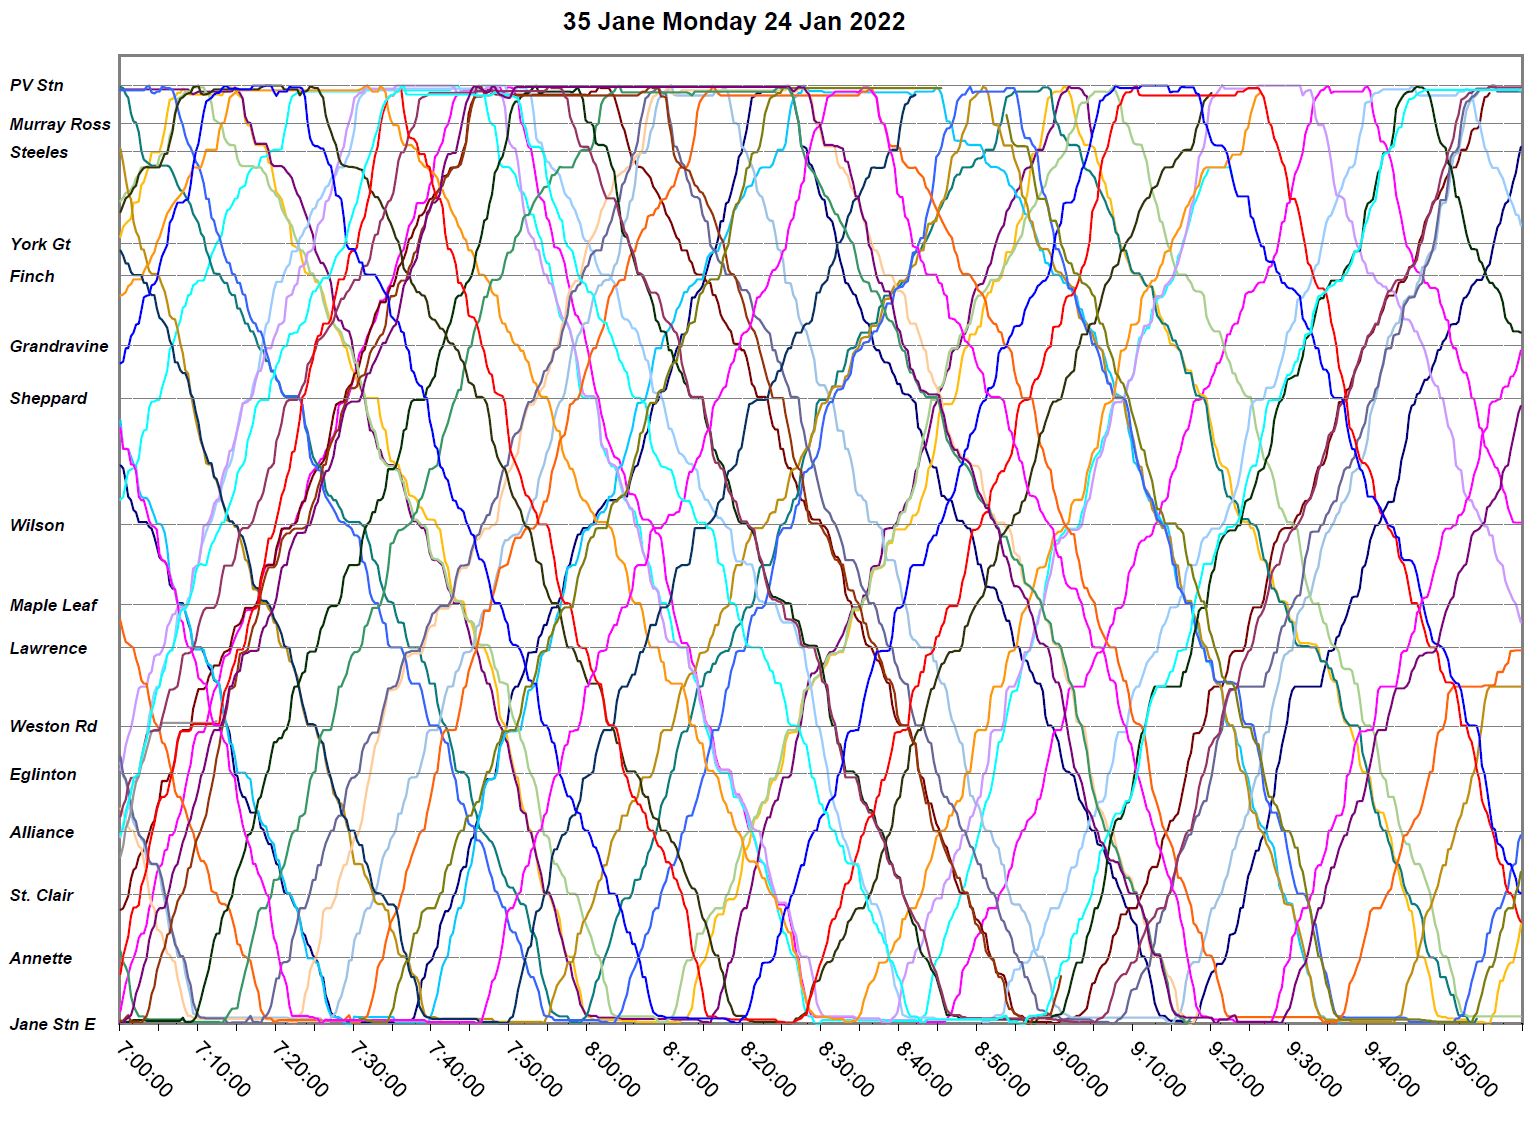
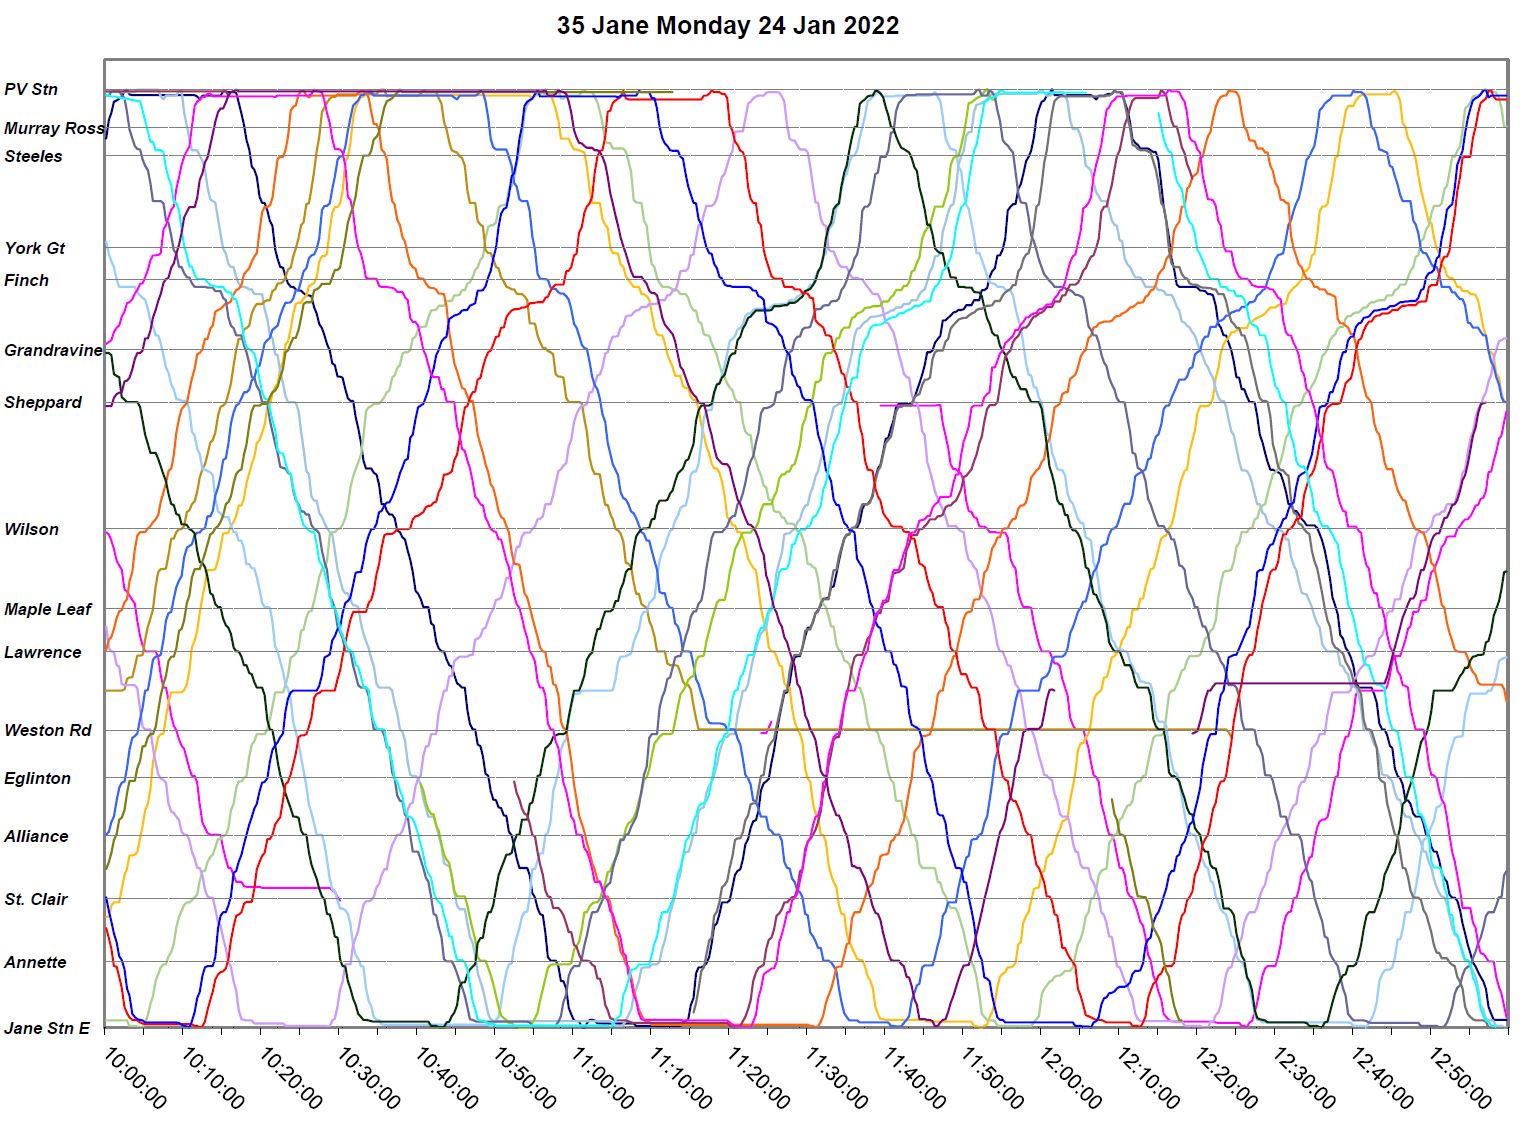
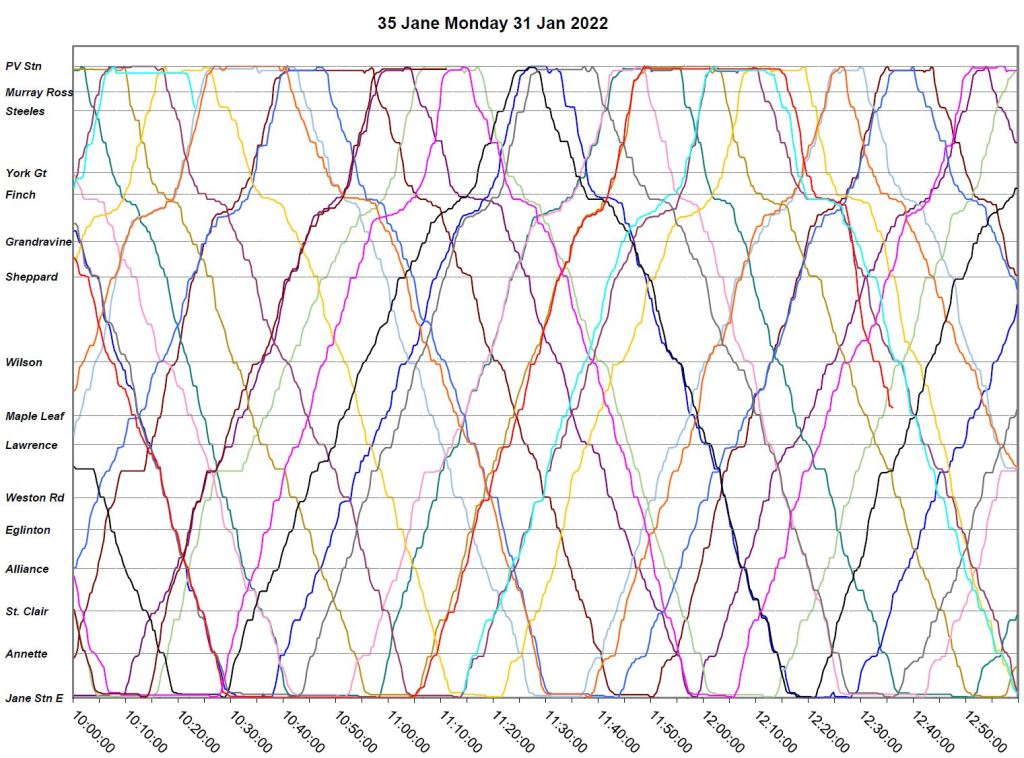
January 24, 2022
Here is the local service one week after the storm. There are several locations of congestion notably at Finch, Wilson and St. Clair in various periods.
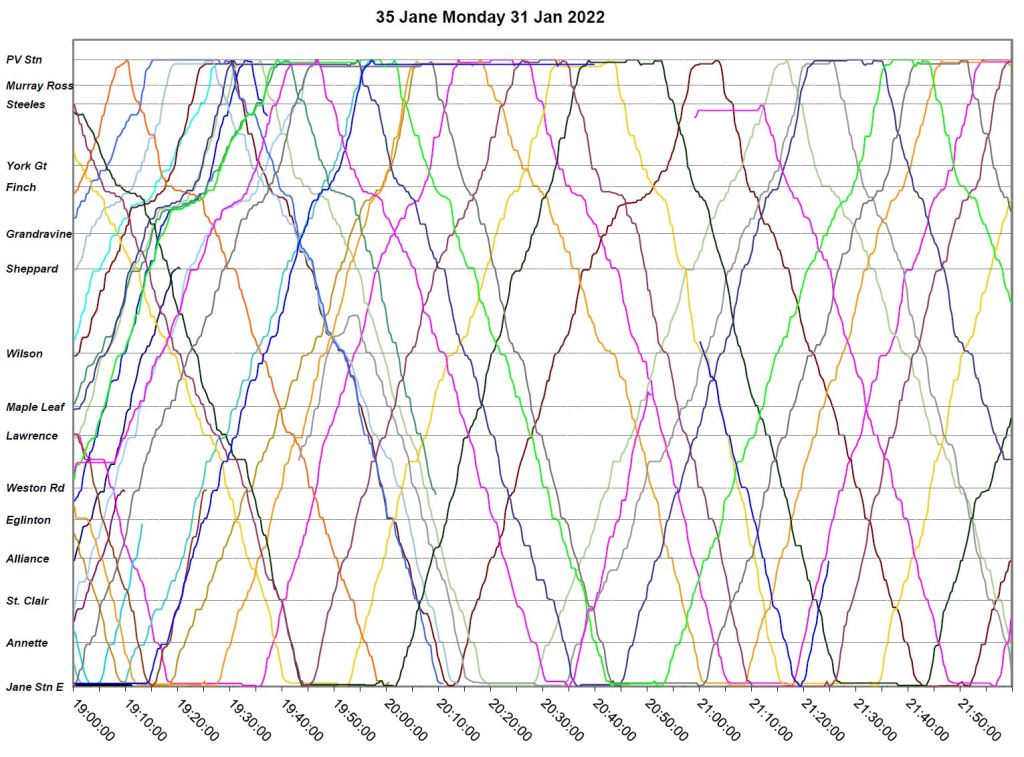
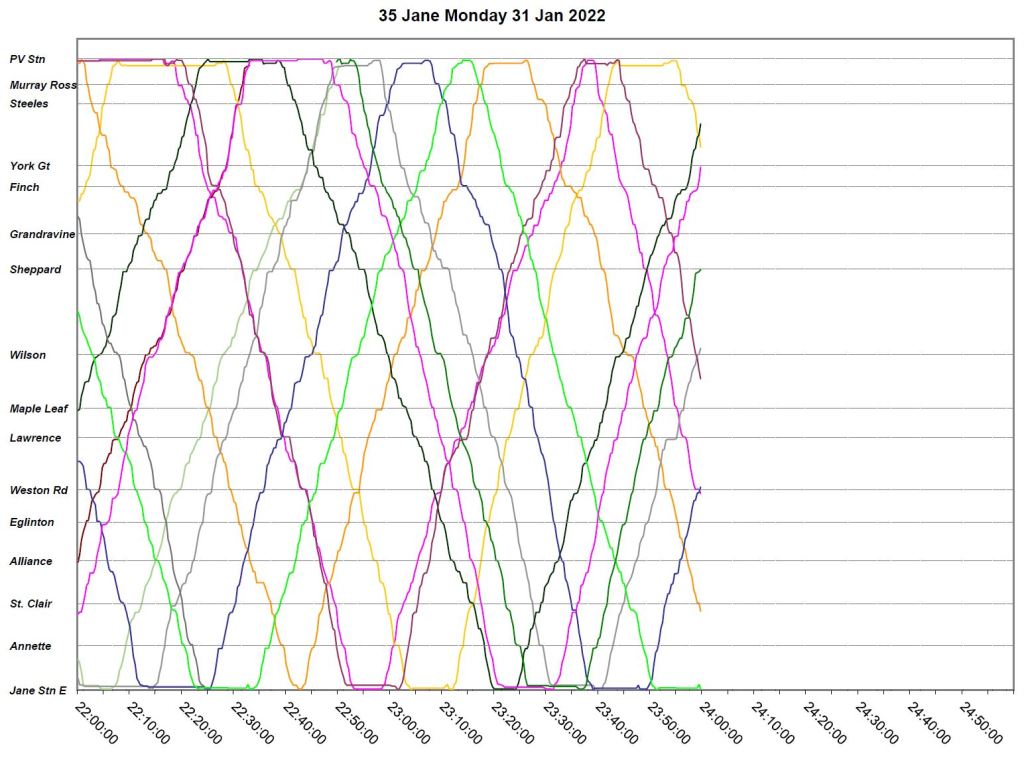
January 31, 2022
After another week, congestion at Finch has worsened, and there is now also congestion on Steeles in the PM peak.
86 Scarborough
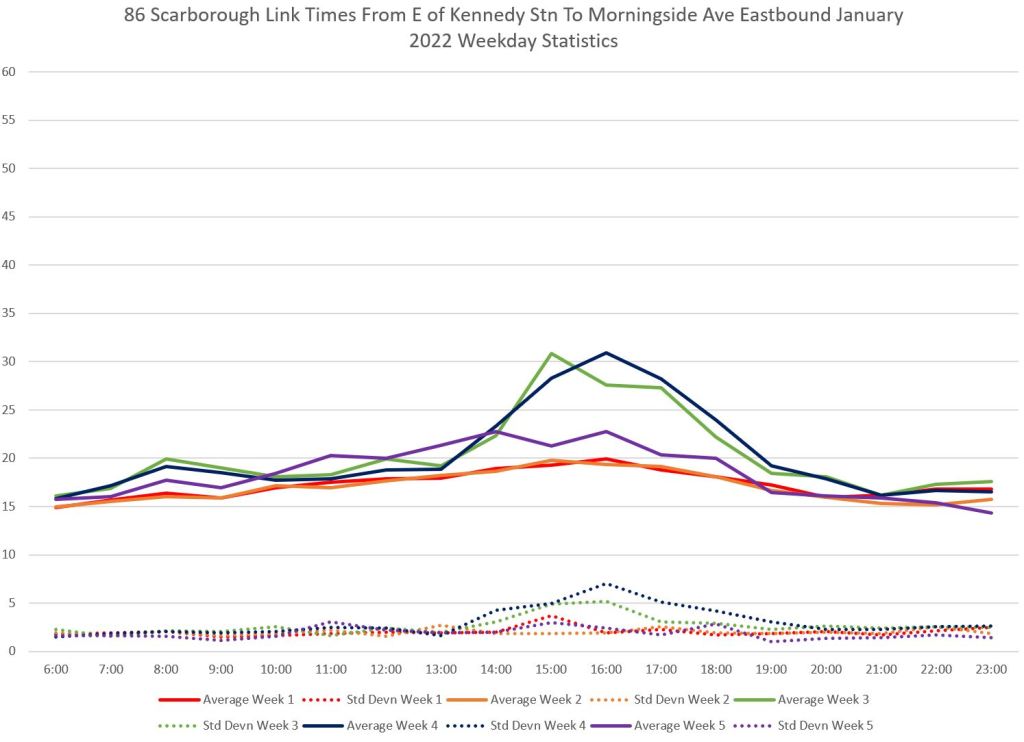
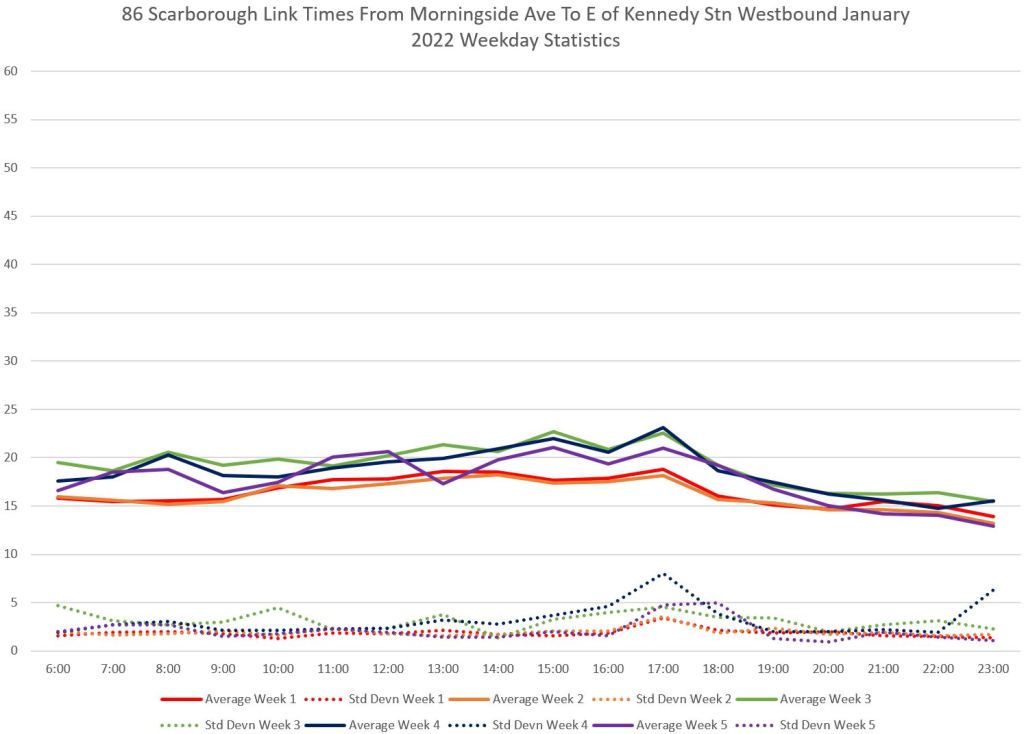
A quick look at 86 Scarborough local service shows that it was affected, mainly eastbound, in the two weeks after the storm, but that conditions returned more or less to normal afterward.
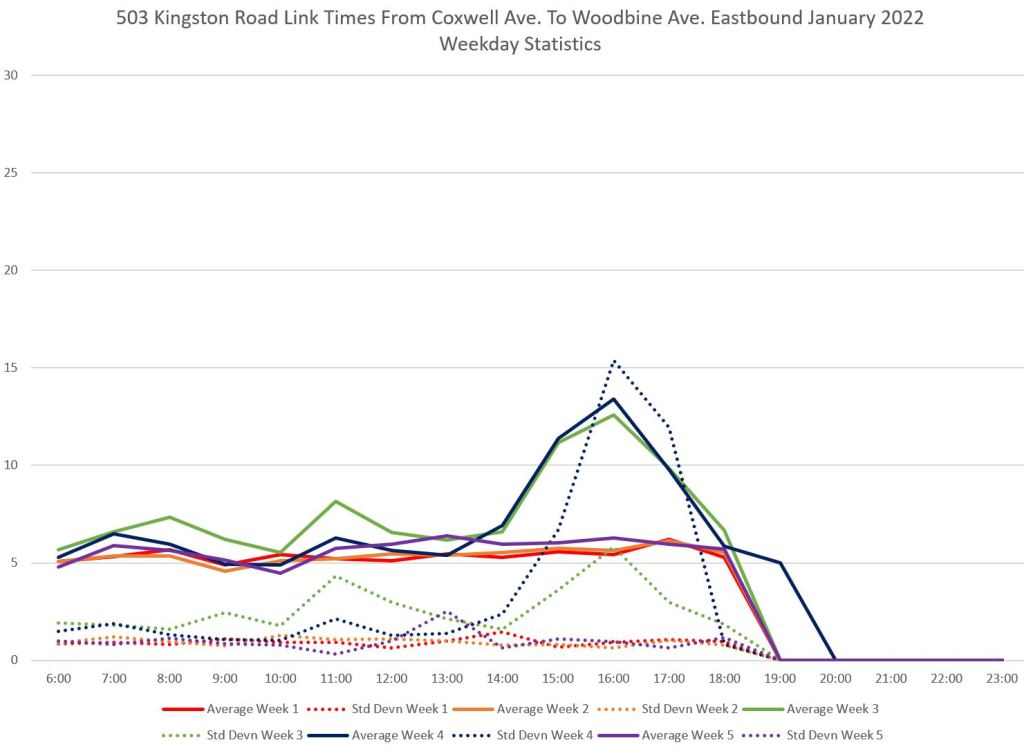
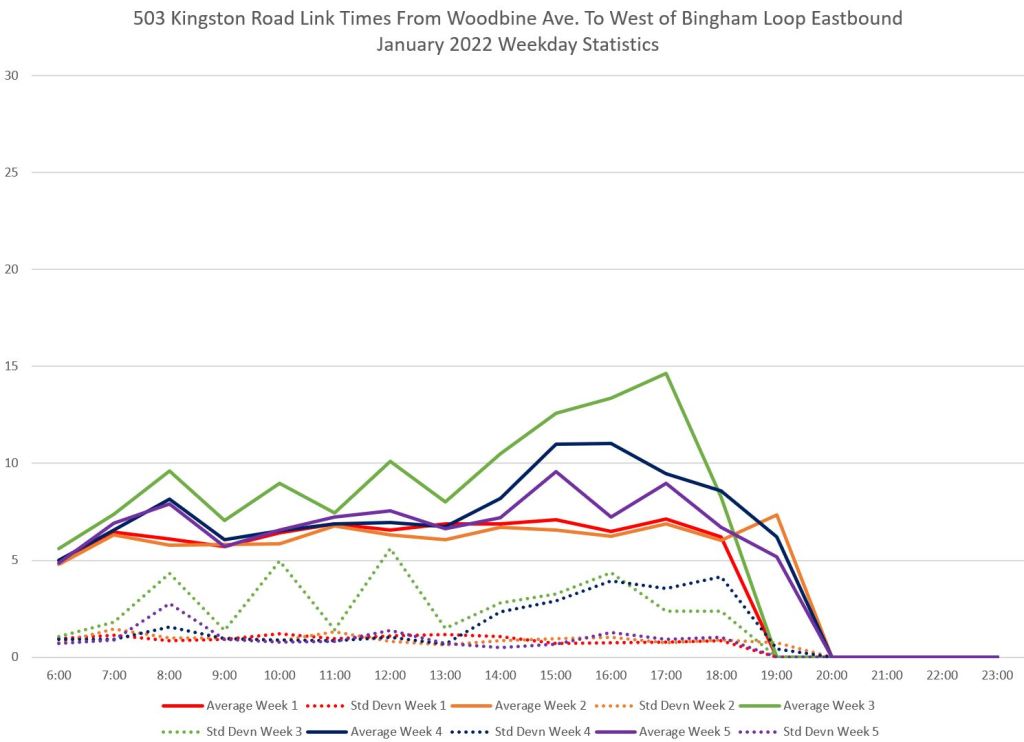
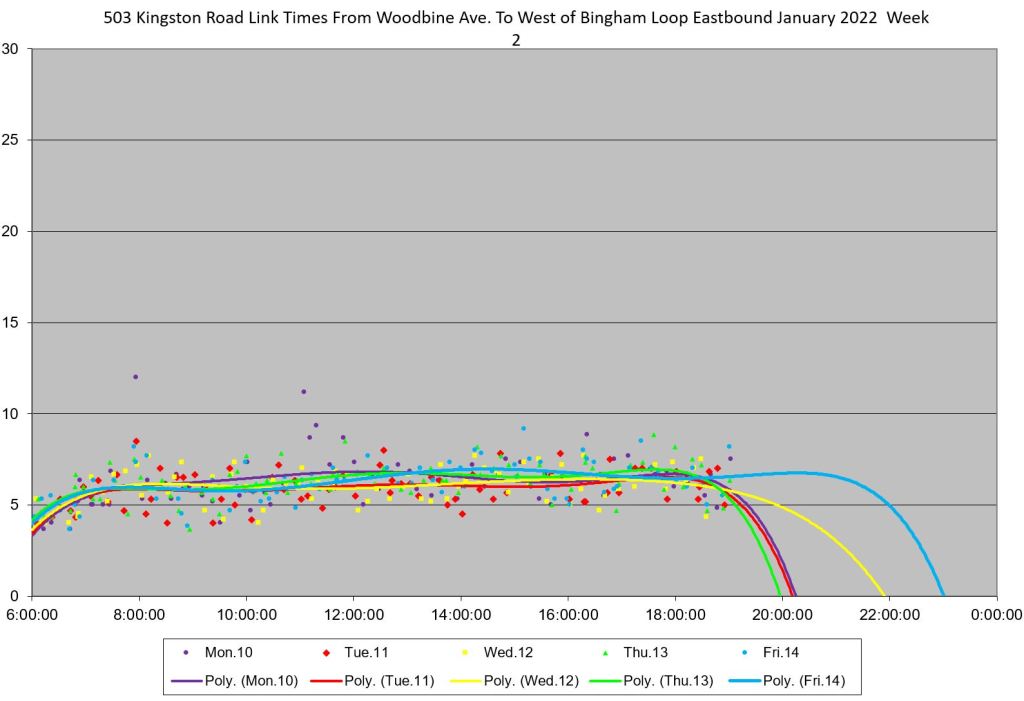
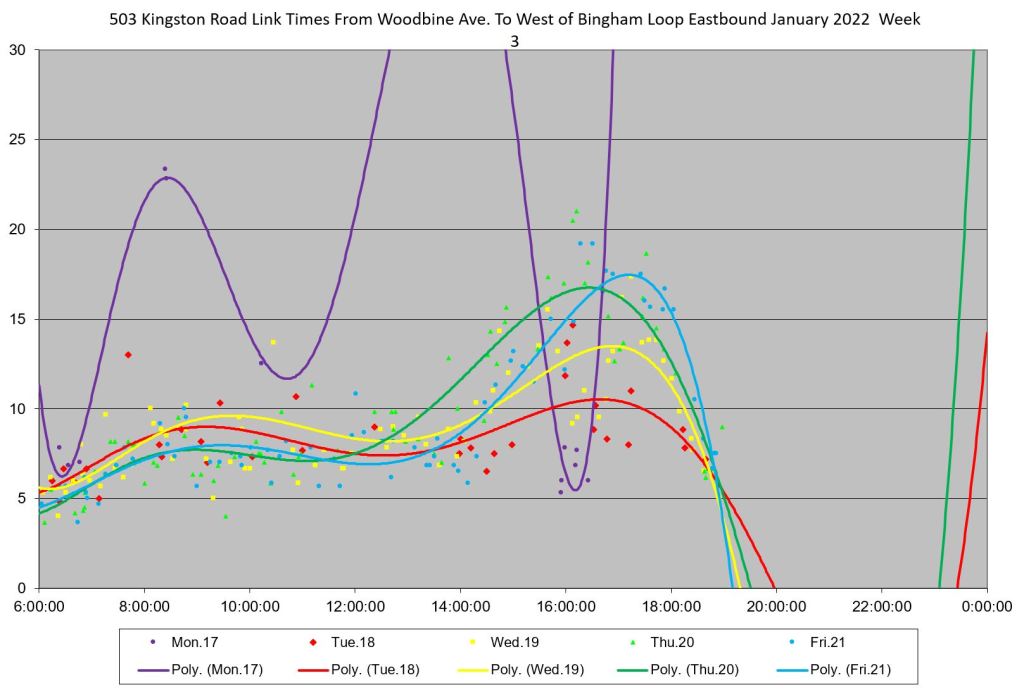
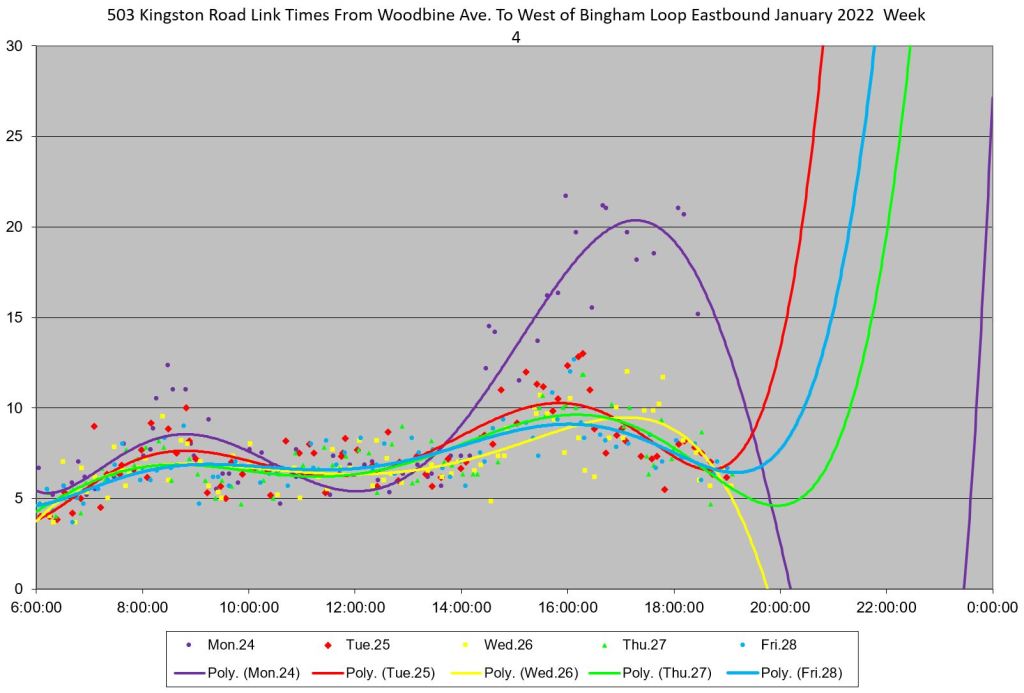
503 Kingston Road Car
Kingston Road is a busy route into southern Scarborough, and it is used by the Kingston Road streetcar. For the two weeks after the storm, travel times were higher than normal in both directions, but they recovered mostly to normal. Note that evening service here is provided by 22 Coxwell and so the data points only cover daytime hours.
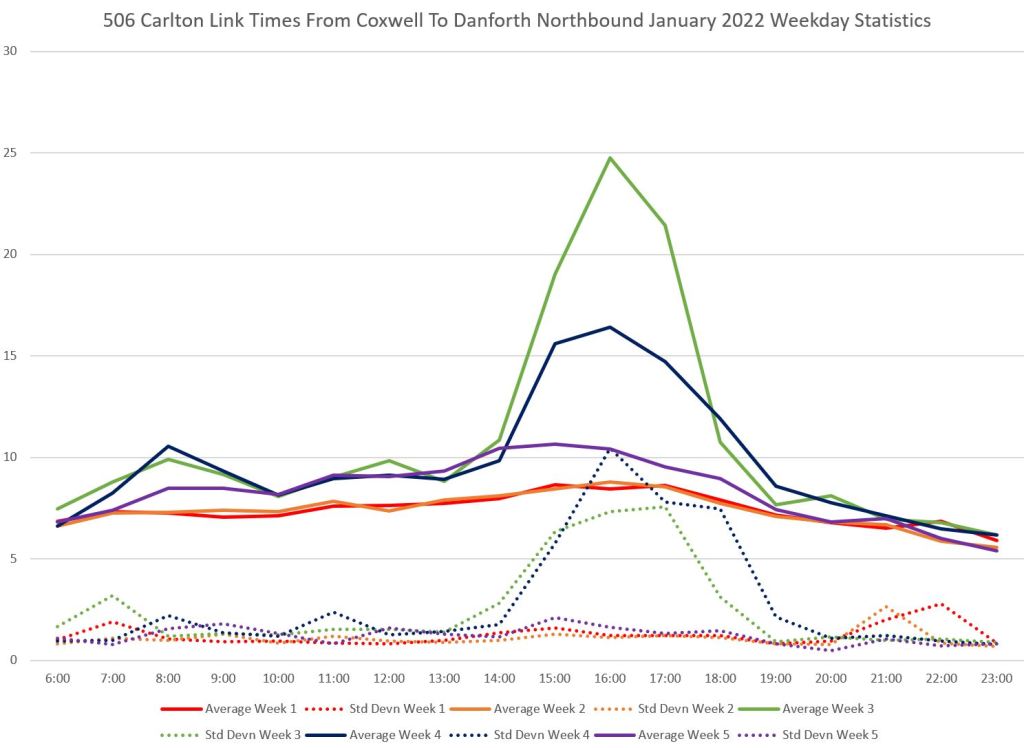
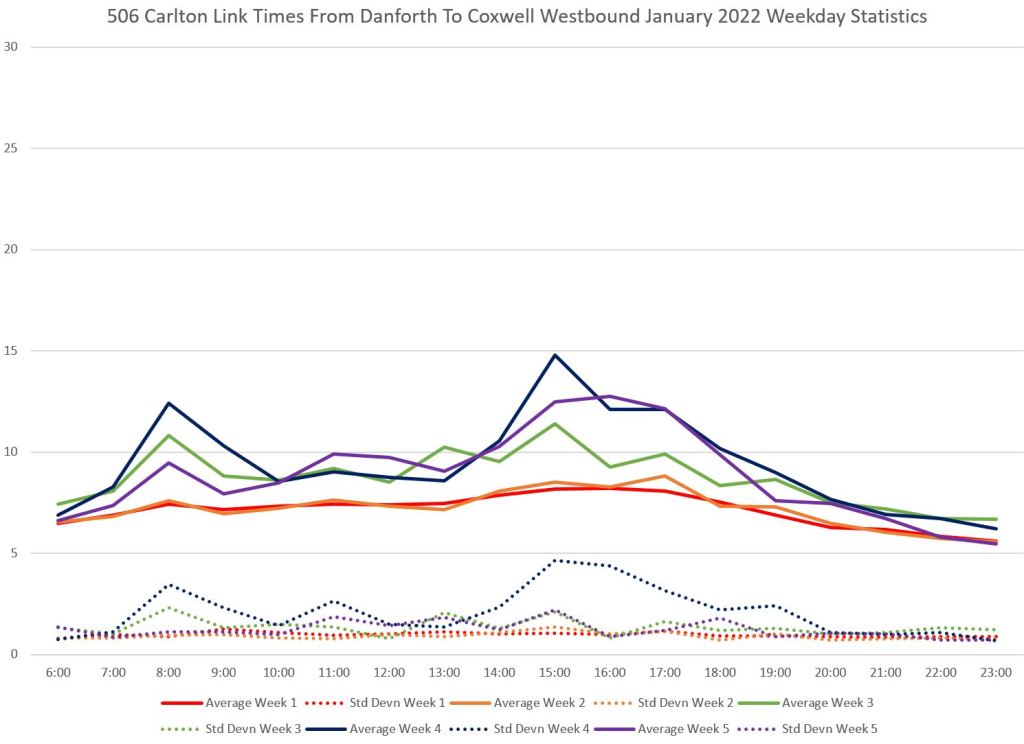
506 Carlton Shuttle Bus
During January, the east end of the 506 Carlton streetcar route was operated with buses. The hill on Upper Gerrard east of Coxwell proved a challenge to traffic here with substantially higher travel times especially eastbound (uphill).
501 Queen Car
The Queen car had many problems with cars parked foul of the tracks in the east end of the route, particularly in The Beach. I will review that in more detail as part of a future article on the 501 and its many route changes and shuttle services for the past year.

About snow plowing. Before the 1920’s or early 1900’s, the city did NOT plow the streets. The streetcar companies (IE. Toronto Railway Company) did plow their own streetcar tracks, AT THEIR EXPENSE. Horses could be used in winter, sometimes pulling sleighs.
The automobile are not snowmobiles. They cannot be used in winter, if the roads were not plowed. The rich discovered they could use their play toys in winter on the plowed streetcar tracks. The rich demanded that all the streets be plowed, at the cities expense of course.
Nowadays, all the roads must be plowed, so that, especially the rich, can use their play toys all year long. The rich also argue against sidewalk plowing, or snow windrow removal at intersections or transit stops, because they don’t use them.
Steve: This is a simplistic answer to a much more complex problem.
LikeLike
One of the things I noticed this year while in a city that gets more snowfall than Toronto is that during times of expected storms they just left bright red shovels at each stop…not that they weren’t well maintained anyways, but it allowed for customers to do a quick shovel while they waited if they were so inclined, or if the plow had come by…Toronto should do the same – buy 8570 shovels (number of stops…for around 100k)…bright red and branded…so people are less likely to steal them…and drop them off before a major storm, then pick them up afterwards (drivers could each take a few and drop them off or pick them up)…even if all the shovels are lost each year, the cost is only 100k…
LikeLike
Look, I haven’t lived there in decades, but growing up in Montreal *requires* me to do nothing but laugh at Toronto snowstorms and their aftermath. My sister lives in your town and just shakes her head. Were the Canadian Armed Forces alerted this time?
But you are not alone in your inability to remove snow (in a timely manner or at all). I lived in Boston, and they were OK. Google around for “trash cans” and “folding chairs” as parking spot markers – blood has been shed. When we moved south (AR, now OK) it was and is just a joke. The weird thing is that here, they don’t even make the effort beyond a couple of sanders (and now that fluid – not sure which chemical) and *maybe* a dump truck with a plow (but usually pickups with same). And yet, it snows at least once every year and it’s a spit show.
It’s the one thing I regret not doing a project on in grad school – what is the cost of having even rudimentary snow-clearing ability vs the cost of additional car wrecks and personal injury (above a normal day)? I bet it’s cheaper to just buy some plows and sanders that are only used once a year. The city where I am now already owns dump trucks and, somewhat unusually, trash compacting trucks – both of which have hydraulic systems that could be tapped into … Chicagoland was not as good as you’d expect. ‘Burbs tended to plow into the middle. I *guess* it’s better to store snow in the middle of the road rather than on the sidewalks but … Most streets are not really designed for “pop-up medians”.
And then there are sidewalks. In Montreal (and burbs) the municipality clears the street and the sidewalks because, media reports to the contrary, they are not monsters. Yet they seem to be pioneers in this (for >50 years, and surely longer). I am glad to hear that Toronto has seen the light. OK and AR are no example at all but in IL, we were expected to clear the municipal sidewalk that crossed our property! My attitude was, it’s your sidewalk, you clear it … you know, like you do for people in cars by clearing the street. IIRC, Boston area was same.
*Completely* ridiculous.
LikeLike
One thing to consider here is our newer fleet of Nova buses which are much lighter than the older GM buses which were around 20 years ago in 1999 when we had out last major snow fall. The lighter bus could not handle driving / plowing through the snow and did they have snow tires??? It was interesting driving around the city and seeing dead buses everywhere. I don’t remember seeing that from 1999.
Steve: I believe that the TTC fleet does not have snow tires.
LikeLike
This is an example of a problem that is widespread in society, and absolutely key for transit advocacy. Social goods that rich people do not use are inevitably politically defunded so that they become crappy. This sets off a downward spiral where the upper middle class stops using them because they have become crappy and so on down the social ladder.
For example, in places where rich people use private schools to educate their children, the public schools are defunded so that they become crappy. There are several examples in the USA.
The same is true for health care. Steve and I am old enough to remember when medical doctors in Ontario were allowed to engage in “extra-billing.” This was quite rightly banned, because a two-tier health care system inevitably results in the tier for poor people being defunded so that it becomes crappy. Once again, the USA provides an example of this.
The same is true for transit in Toronto. This is why it is critical that Toronto follow the example of so many European cities to have a car-free or car-light downtown, particularly in the financial district. When rich people have to use transit, I can give an iron-clad guarantee that sidewalks and transit stops will have an excellent standard of snow clearing even in the worst winter weather.
LikeLiked by 1 person
Am glad to hear of a call for a car-free/reduced core, as my grandfather opined about a half- century ago as being needed. But in order to do that we need improved transit, which is not really the Ontario Line (Lyin’, perhaps), and it needs to get out to that pinch point at base of High Park or into Etobicoke for a Large Parking garage, ahead of tolls on the highways.
Meanwhile, with Sufferin’ Dufferin, is the ridership good enough for a subway from Yorkdale to Bloor? (and I guess down to the Ex area too, because of the above paragraph?) Or would that be too much in the right place for Caronto/Moronto, though there would be malls at both ends if done to Bloor-ish.
Steve: Yorkdale already has a subway — that’s why the “Spadina” subway and expressway are located where they are, to serve the land Trizec owned all those years ago. I think that anyone dreaming of yet another subway should plan on living at least two more decades, and that’s assuming some politician gets out his crayons and adds it to whatever “regional plan” is then current.
LikeLiked by 1 person
The big snowfall was followed by a hard freeze. The snow was about as tough as styrofoam. This did not help in removal. Also, the days of dumping snow in the lake are over. I saw a mountain of snow at one storage spot on New Toronto street, with five or six large excavators (the kind used to dig out high-rise foundations) perched on the pile to manage it. I also saw a stream of dump truck queued up to get into another snow dump at Black Creek and Eglinton. There were dozens of loaded trucks.
There is only so much you can do to remove snow. Perhaps Toronto was not planned in such a way as to be able to immediately push snow somewhere where it’s not in the way.
As far as bus weights go, the weight of buses is constantly increasing. The old GM “New Look” buses were of a very light monocoque construction, and did not have air conditioning. It’s hard to find bus weight statistics online, but the New Looks were about 30,000 lbs more or less. The Nova LFS 40′ diesel is more like 40,000 lbs, and the artics and hybrids have to be more than that.
I have heard that the articulated buses do receive snow tires in winter, being so prone to jacknifing. But really, with so much snow, everything was getting stuck. And even if you have wonder winter tires, when the vehicles scattered over the roadway ahead of you don’t, you’re just as stuck as them.
LikeLike
The snow fell on January 17th during the day, and the freeze started overnight between 19th and 20th. If the city can’t clear major roads in over 2 days (17th during the snowfall, all of 18th, all of 19th), there’s a wonderful British phrase: “not fit for purpose”.
Streets in Montreal aren’t any wider, and they seem to manage. But then I think they actually do have plans for regularly removing snow, rather than storing it on shoulders, boulevards, bike lanes, or crossings. We’ve seen shortcomings of the Toronto method whenever there’s been a snowier winter.
LikeLike
Though I certainly cut the City some slack about the ‘big snowfall” as it was both large and followed by a long freeze, I would suggest that if they had been quicker getting their equipment out on the streets and sidewalks there would have been far less snow lying and freezing. Certainly in my area (St Lawrence) their efforts at sidewalk ploughing were pathetic (and late) and by the time the City ploughs appeared (days later) the sidewalks on the blocks which property owners had not cleared were solid ice which was very hard to remove. Having lived in Montreal for 30+ years I know that snow clearing can be done MUCH better and I hope we learned a few lessons this year so that next time we will be ready! Better to make a ‘one-lane’ pass on every road and sidewalk ASAP and thus have one lane well cleared than aim to clear all lanes on busier roads while the smaller ones are ignored.
Steve: Toronto is too used to the idea that benign neglect will get rid of snow simply by melting it, and of course they did not have their full complement of sidewalk ploughs in time for the 2022 season. They also need a much more aggressive approach to towing if only to shift cars out of curb lanes so that they can be properly cleared.
The PlowTO app needs some work too. Just because they drive up and down a street does not mean that they actually move any snow while they’re there.
LikeLike
Predictably, most streetcar stops again had only a small 3-4 foot area of the sidewalk near door 1 of the car stop cleared. The boarding/alighting areas for doors 2, 3, and 4 were left to nature. I’m still waiting for the day the city gets sued for not clearing the curb cuts.
For that matter, a lot of the minor bus stops suffered from the same issue.
LikeLike
I wonder if no small part of our ‘problem’ is all the contracting out, and with 7 year contracts? And we had just signed a new batch, with some controversy about missing info/time in the December Council, if I remember hazily. What’s the structure of Montreal’s plowing regime? Do other large cities have such contracting out with 7-year terms? And while some respect to those operating the plows etc. as it’s less-easy work at awkward times, are they tending to be from the car-oriented suburbs and beyond?
LikeLiked by 1 person
When the windrow plow came around my parents’ place, it managed to make things worse. My Dad called 311, and when the guy (who’s a City employee) came to fix it, he told my Dad that before snow clearing was contracted out, the guys were paid by the hour, so it was in their best interest to take their time, and do a good job, because they’d get paid more. Now, I forget if he said they’re paid by the km, or by the street, or something like that? But whatever it is, the incentive is to cover as much ground as quickly as possible.
LikeLiked by 1 person
Thanks for the article. Good analysis of how the Dufferin bus route performed. I am hoping that you can also do an analysis on how the streetcar network performed during the snowstorm.
Steve: I included charts for Kingston Road (streetcar) and Upper Gerrard (bus at the time) as a quick comparison. One observation is that the storm completely stopped streetcar service on St. Clair on the day of the storm, and it was very erratic one day later, but from the second day onward (Jan. 19), things were back to normal because the line was not subject to blockage by parked cars. Certain areas had a lot of problems with this for a few weeks after the storm because curb lane snow piles were not cleared even though the roads were supposedly “snow routes”.
LikeLike
The performance of buses during the blizzard may have been bad but at least some buses ran whereas all streetcars came to a screeching halt for days on end. Streetcars may provide okay service in warmer climates but do not belong in highly snowy places.
Steve: Actually, the streetcar system was more or less back to normal a day and a half after the storm with the primary problem being parked cars in areas where the city did not clear snow. The streets are signed as “snow routes” but that is more a matter of decoration than actual practice.
Bathurst was back to normal by 5 pm on January 17, the storm day. Spadina was running by 3 pm although service to Union was spotty. Harbourfront was back by 6 pm.
King was back to normal by the evening of the 18th. Dundas was somewhat back to normal by January 19, but there were many cases of tracks blocked by parked cars or collisions. Carlton was back to normal by January 19, although the buses running on Gerrard at the time had the same problem.
Queen had a rough time with autos parked on the tracks in The Beach until a few days after the storm, but the west end of the line, operating with buses, also had extremely irregular service with many buses running in pairs and triplets separated by wide gaps.
Kvetch about streetcars all you like, the bus system had its problems with the weather too. A common problem on particularly bad stretches was as much the operation on four lane roads with parking and inadequate snow clearing.
LikeLike
I will now point out that the world’s second largest streetcar system is in Moscow. 208 km of streetcar tracks provide for a ridership of 220 million people per year. By comparison, Toronto’s 82 km of tracks provides for a ridership of 64 million people. So the Moscow system is quite a bit bigger. Last time I checked, winter is very cold and snowy in Moscow.
Source
The world’s third largest streetcar system is also in Russia, in St. Petersburg. Other extensive streetcar systems in snowy northern European cities include Stockholm, Oslo, Cologne, Berlin, Budapest, Brussels, Leipzig, Prague, Bucharest, Dresden, Warsaw, Stuttgart, Zurich, The Hague, Amsterdam and Munich.
Finally, in Finland’s capital of Helsinki, streetcars are the main means of transport in the city centre. And yes, winter is very, very cold and very, very snowy in Finland.
LikeLiked by 2 people
Perhaps Jim would like to ride some trolley cars instead?
LikeLike