Service Standards, Metrics and the CEO’s Report (II)

This article continues a review of what the TTC aims for, at least on paper, in service quality, and how their success (or lack of it) in providing good service is reported for public and political consumption. The framework for this commentary is the CEO’s Report, using the August 2022 version as a reference point.

I deliberately broke this discussion into two parts. The first looked at the various figures related to system performance are presented and how they reveal or hide critical information.

See: Service Standards, Metrics and the CEO’s Report (I)

The TTC Board is notoriously unwilling to get into the weeds on system statistics, operations and finances. Superficial analyses in the CEO report give them nice pictures and charts to look at, but that is not the same as a discussion of key issues and future risk. This is vital in any planning for recovery from a pandemic that will continue to affect the TTC in 2023 and beyond. There is a separate detailed quarterly report that reviews finances and the state of major capital projects, but it does not address many issues notably the cost and capability for growth as ridership returns to the system.

While it may suit those who run the TTC and the City to keep this discussion under wraps, that cannot be done for long as the 2023 budgets will be upon us immediately after the coming municipal election. There is a lot of great talk about the importance of transit, but this does not translate into real understanding and support beyond a few very large construction projects. (That statement applies equally to Metrolinx and GO, but my focus here is on the TTC.)

Key points:

  • Although fare revenue recovery is reported, this is not matched against cost growth. Fares have been frozen through the pandemic. Even at recovery to 100 percent of pre-pandemic ridership, the proportion of costs borne by fares will have fallen and the need for subsidy will be higher. “Full service” will cost more in 2023 than it did in 2020, even without the added cost of improving beyond historic levels.
  • Ridership recovery takes place at a different rate on different routes and modes, not to mention time-of-day.
  • Underutilized fleets provide a reserve for service improvements, provided there are drivers for the vehicles, up to the point where the need for spare buses and streetcars limits service growth. After that point, growth hits a knee in the cost curve as new capital assets must be acquired.
  • Asset reliability is reported as the proportion of scheduled service actually operated, but with no sense of how much reserve exists in the fleet.
  • Fleet reliability is reported in a way that prevents direct comparison between segments, notably various types of buses. Although there is a target for reliability, the degree to which this is exceeded (in effect the headroom for better utilization) is not reported.
  • Service reliability and quality are reported on broad averages across routes and days, with no indication of the variation across the system. Purported “on time” metrics do not reveal actual rider experience.
  • There is no report of:
    • the amount of scheduled service that does not operate because no driver is available;
    • the utilization and effectiveness of Run-As-Directed buses;
    • the amount of bunching and gaps as a proportion of service operated;
    • routes with demand, service levels, crowding and headway reliability issues.

This review does not look at the WheelTrans system and accessibility in general because it has a raft of issues of its own on matters such as adequacy of service, dispatching, the online booking interface, qualification for service and the TTC’s attempt to shift riders at least partly onto the “conventional” system through the “Family of Services” program. An important issue for WheelTrans overall is that it is entirely funded by the City of Toronto with no assistance from other governments. This makes it particularly vulnerable to penny-pinching efforts by those who guard our “precious tax dollars”.

Continue reading →

Service Standards, Metrics and the CEO’s Report (I)

Some of the material in these articles will be familiar to readers, but my purpose here is to consolidate many thoughts, some old, some new, in one piece. My hope is to inform discussion about transit’s recovery in Toronto and in particular to provide context for the inevitable political debate about what we should attempt, and the managerial issues of knowing whether we have succeeded.

Updated Aug. 30/22 at 1:25pm: Sundry typos and grammatical faux pas corrected. No substantive change to the text.

Since early 2020, the TTC and transit systems everywhere have wrestled with the ridership and revenue losses of the pandemic era. The goal of both management and politicians has been to just “keep the lights on” and provide some level of transit service. Toronto, with the aid of Ontario and Canadian governments, has worked particularly hard to continue an attractive service, at least on paper.

Service quality is a real bugbear for me, and the widening gap between the advertised service and what is actually provided should be a major concern. Next year, 2023, Toronto will likely see the end of special Covid-related subsidies, and a growth in demand back to pre-pandemic levels, although the timing of these events could prove challenging. Meanwhile, City Council “net zero” emission plans call for a major shift of travel onto transit. This will not happen with a business as usual approach to transit.

The focus must shift from muddling through the pandemic to actively improving the transit system, and to doing that with more than a few subway lines whose first riders are almost a decade away.

Key to running more and better transit is a solid understanding of how the system performs together with a planning rationale for growth. This brings me to two documents: the TTC’s Service Standards and the monthly statistics included in the CEO’s Report.

In this first of two articles, I will review the Service Standards and discuss some general principles about reporting system behaviour. In the second, I will turn to the CEO’s Report.

There are two essential problems:

  • The actual machinery of the Service Standards is not well understood, and the current document was endorsed by a previous TTC Board almost without debate. Superficially, the standards appear to call for good service, but in practice they hide as much as they show in reporting on quality. The Board did ask for follow-up information on improving standards (more service, less crowding), but management never delivered this feedback.
  • To the degree that management reports system performance, this is done at a summary level where the day-to-day reality of transit service and rider experience are buried in averages that give no indication of how often, when or where the standards are not achieved.
Continue reading →

TTC Service Changes Effective September 4, 2022

Updated:

  • The spreadsheet detailing all of the changes has been added at the end of this post.
  • The number of the Mimico GO shuttle has been corrected to 176.
  • Transfer arrangements at Queen & Dufferin for the 501 bus and streetcar services have been clarified.
  • Transfer arrangements at Queen & Roncesvalles for the 501 and 504 bus services have been added.

Updated September 5, 2022:

  • The spreadsheet listing all of the changes has been corrected for route 504 King. The original version included a description of the route carried over from the August version. This has been changed to reflect the September arrangements.

The TTC will make many changes to its scheduled service on September 4, 2022 with restorations of previous service levels on many routes. This will not get the system back to 100% of pre-pandemic levels.

An important distinction is between three values:

  • The amount of service scheduled before Spring 2020
  • The amount of service budgeted for 2022
  • The amount of service scheduled for 2022

The TTC plans to be back to 97% of budgeted service for bus, 84% for streetcar and 92% for subway. The overall numbers are compared below.

Hours/WeekRegularConstructionTotal
January 2020 Scheduled185,8257,068192,893
September 2022 Budgeted186,3796,398192,777
September 2022 Scheduled177,9304,965182,895

In the original 2022 service budget, the TTC planned to be back to roughly the same level of service as in January 2020 by September 2022. However, slower ridership recovery coupled with staffing constraints produced a lower scheduled service expressed as hours/week.

There are further caveats:

  • The distribution of hours by time of day might not be the same in 2022 as in 2020 because of changing demand patterns.
  • Changes in running times to deal with congestion or service reliability can mean that the same service hours are stretched over wider headways. Not all vehicle hours are created equal.

All that said, there are many changes in service levels, and with the bus network being back to 97%, the schedules for September 2022 are often based on old versions before service cuts were implemented. Another change for this month is the reintroduction of school trips on many routes.

Continue reading →

TTC Green Bus Program Update, July 2022

At its meeting of July 14, 2022, the TTC Board received a Green Bus Update. By the time a contract is awarded later this year, it will be almost five years since the TTC began this process.

Among the issues not yet resolved are the status of various potential vendors, the degree to which the head-to-head comparison of buses will actually influence product selection, and the financial arrangements in the short and long term for a major shift in bus propulsion technology.

Continue reading →

The Varying Strength of Ridership Recovery (2)

In a recent article, I reviewed route-level ridership data cited in the 2023 Annual Service Plan as well as the 2019-2021 numbers posted on the TTC’s Planning web page.

During debate at the July 14 TTC Board meeting, an issue came up about the unexpectedly poor performance during the pandemic era of 25 Don Mills. This got me thinking about how the “results” could be influenced by when counts were done and particularly on routes that have both express and local branches under different route numbers.

To explore this, I recast the 2019-2021 stats in tables with and without the express 9xx routes consolidated into their local equivalents.

First, here are the stats with the local and express routes separate. The gallery below contains the first set of routes, but the complete list is in the following pdf. The data here are the same as presented in the previous article, but reformatted for easier browsing.

Here are the stats with the 9xx routes’ data rolled into their local equivalents.

The three express/local routes on these sample pages show the differing effects.

Route201920202021% Recov 2020% Recov 2021
Victoria Park
24 local22,75112,23314,07754%62%
924 express6,4723,66357%
24/924 local+express29,23312,23317,74042%61%
Don Mills
25 local27,98816,48118,71959%67%
925 express16,6249,07455%
25/925 local+express44,61216,48127,79337%62%
Dufferin
29 local27,48723,02122,08784%80%
929 express15,72213,23884%
29/929 local+express43,20923,02135.32553%82%

In all three cases, the express service did not operate in 2020, and so all of the riding, such as it was, occurred on the local route number. This inflated the apparent ridership retention of the local route over the actual level on the corridor considering the two routes as one operation.

The effect was so strong on Dufferin that its local recovery rate went down slightly in 2021 because growing demand on the corridor was not enough to offset the shift of riders back to the express service.

The moral of the story here is that looking at stats in isolation can lead to incorrect conclusions if the underlying network and service plan are not taken into account. This applies to simplistic rankings such as “top 20” and “bottom 20” that can exclude routes with almost identical performance. A better metric would be the collection of all routes above or below a certain recovery rate.

Politicians who fund and, nominally, direct transit systems love easy-to-understand metrics that often hide or even distort what is going on. I will turn to TTC measurement indices and standards in a future article.

Toronto Transit Funding and Development Charges

The real estate industry, their acolytes and even the affordable housing advocates went into meltdown when the 2022 update to the Development Charges landed at Toronto’s Executive Committee. This proposal was approved recently by City Council, but with a few carve outs such as exempting certain types of housing (up to 4 dwellings on a lot) from these charges.

The main trigger for the uproar was that the new DCs are much higher than those they replaced. With transit being the primary driver of this increase, it is worth understanding how DCs work and what the new charges will and won’t fund.

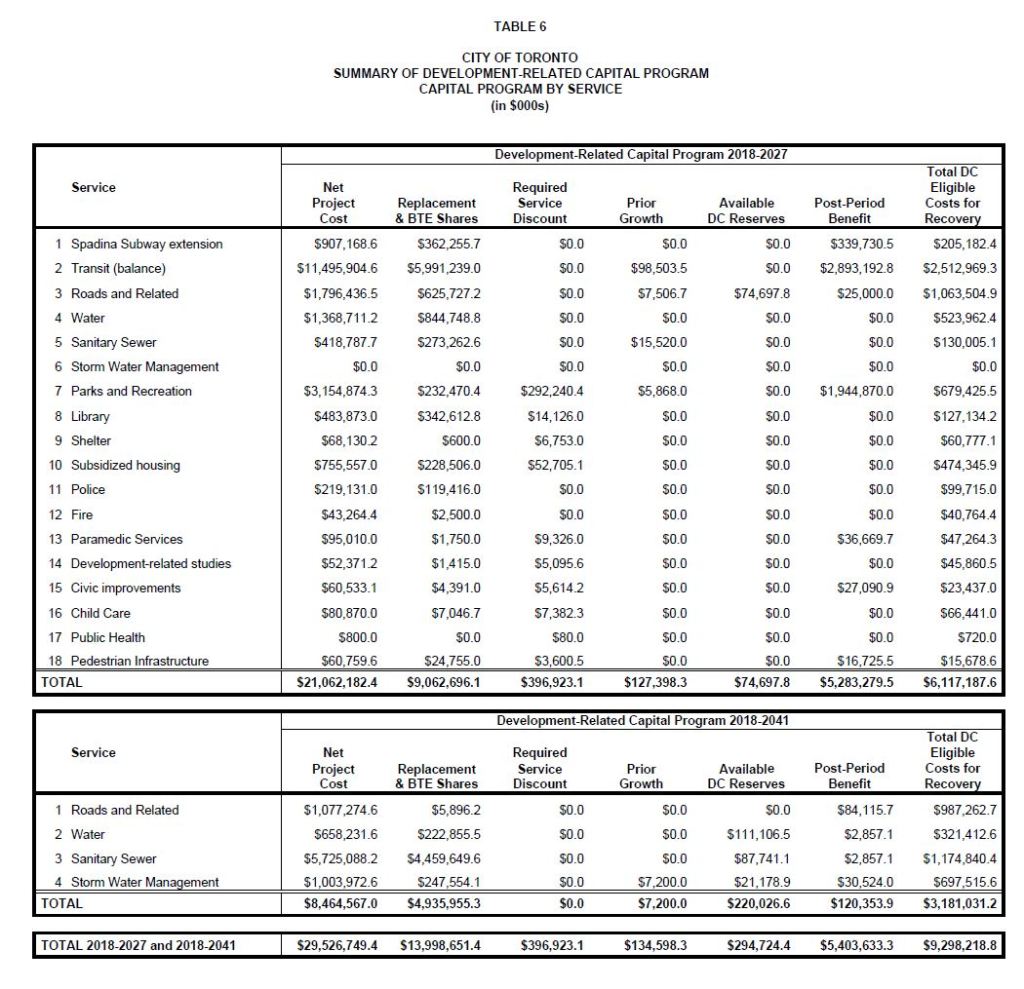
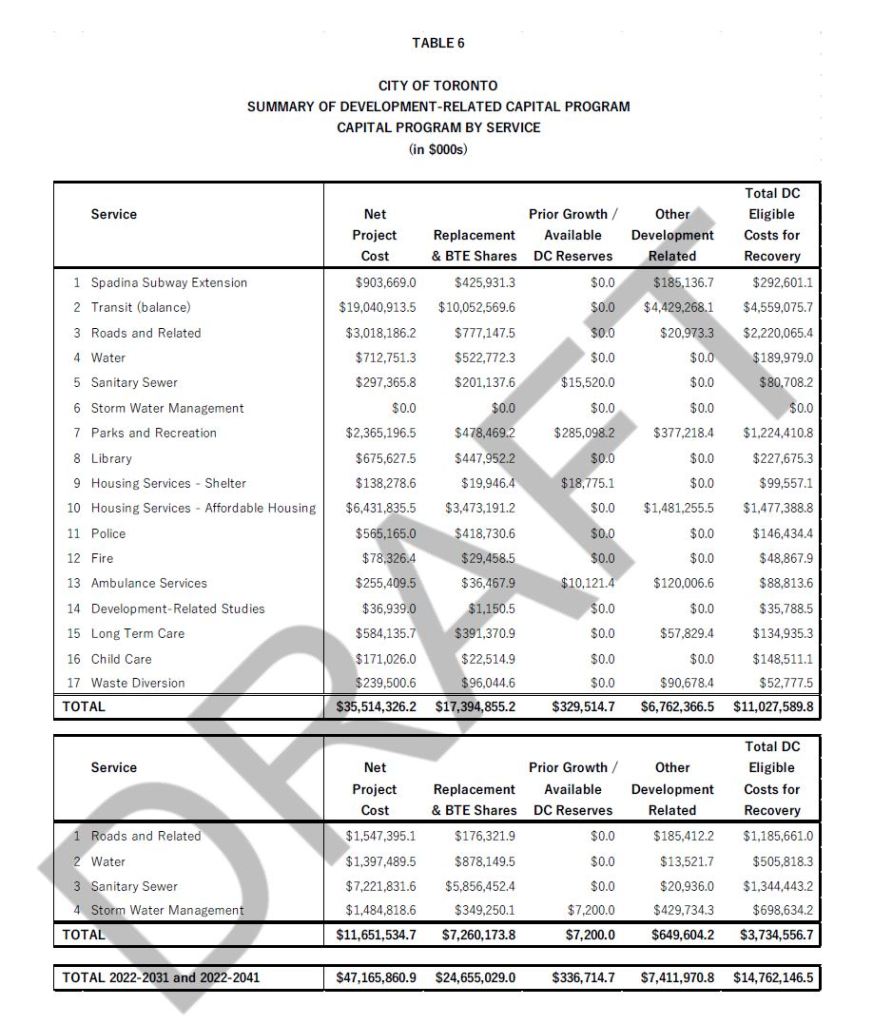
First, a comparison of the base data for the 2018 and 2022 reports. The tables below are in almost the same format making comparison easy.

The important column is on the right end of both charts “Total DC Eligible Costs for Recovery”. The total in 2018 was $9.3 billion while in 2022 it is $14.7 billion.

Yes, we are still paying for the Spadina Subway which gets its very own line in the table, and the Sheppard line shows up in the details under “Transit (Balance)”. Large increases lie in:

  • Transit, about $2 billion
  • Roads, about $1.2 billion
  • Housing Services, about $1 billion
  • Parks & Recreation, about $550 million

Some lines go up by a lot proportionately, but the dollar amount is comparatively low. For example, Pedestrian Infrastructure went from $15.7 million to $52.8 million, over triple, but the actual dollars pale by comparison with transit.

A major difference between 2018 and 2022 is the proportion of total costs recovered from subsidies and contributions from other parties.

In the 2018 DC calculation a grand total of $43.5 billion gross was reduced by $14.1 billion to a net value of $29.4 billion.

In the 2022 DC calculation, a grand total of $66.9 billion gross is reduced by $19.8 billion to a net value of $47.2 billion.

The increase in gross figures, 54 percent, is much higher than the increase in recoveries through subsidies and other revenue, 40 percent. This causes a disproportionate growth in the net of 61 percent.

Where Do Those Numbers Come From?

The background study that recommends new Development Charges starts with a list of every capital project in the City. The TTC has the biggest capital budget, even with some major projects taken over by the province, and it therefore generates the biggest part of the DC tithe.

For each project some costs are included and others are excluded. The headings on the charts above show the breakdown:

  • Net Project Cost: The cost of the project borne by the City after deducting provincial and federal subsidies and contributions by others (for example, York Region’s contribution to the Spadina Subway). (The gross costs for those who are interested are in the detailed tables.)
  • Replacement: Costs to replace existing infrastructure (such as new buses that replace old ones) are not eligible for DCs because this cost does not address growth, only worn out assets.
  • Benefit to Existing (BTE) Share: Demand that would rise if the improvements were already in place determines the portion of the benefit that is not due to new development.
  • DC Reserves: Some groups of projects did not manage to spend all of the money collected for them, and this sits in a carry over reserve offsetting new charges.
  • Other Development Related: Some costs are deferred to future rounds of DCs as reflecting the value of a project like a new subway line well beyond the five year cycle of DC updates.

The BTE share is calculated from existing and projected ridership (see below).

Looking at the 2022 chart above, of the $47.2 billion in net project costs, only $14.8 billion will be recovered in the current period from DCs. (The gross cost, by the way, is $66.9 billion.) This does not include provincial projects like the Ontario Line and Scarborough Subway which are no longer on the TTC’s books. It also does not include much of the Green Bus plan because that is mostly replacing existing buses, not adding to the fleet for ridership growth.

Continue reading →

TTC Board Meeting: July 14, 2022

The TTC Board held its last scheduled meeting of the current term on July 14. Barring an emergency requiring a special meeting, the next regular meeting will follow reconstitution of the Board after the municipal election in the Fall.

Some items on the agenda have already been covered in previous articles:

This article covers:

  • The CEO’s Report
  • Outsourcing of non-revenue automotive vehicle and equipment maintenance
  • Automatic Train Control for Line 1 Yonge-University
  • Five and ten year service plans
  • Transit network expansion update

I will review the Green Bus program update in a separate article.

CEO’s Report

The CEO’s Report contains many charts purporting to show the operation of the system. Unfortunately some of these hide as much as they tell by giving a simplistic view of the system.

I have already written about the wide discrepancy between actual short turning of vehicles and the reported number. A distortion this major calls into question the accuracy and honesty of other metrics in the report.

In a future article, I will turn to the appropriateness of various metrics, but here are some key areas:

  • Averages do not represent conditions riders experience. Data that are consolidated across hours, days, locations and routes hide the prevalence of disruptions. Service that is fairly good on average can be terrible for riders who try to use it at the wrong time.
  • Values for some metrics are reported with capped charts that show only that a target is met, but not by how much it was exceeded. This gives no indication of the room to improve the target value, nor of the variation that could make a higher target difficult to achieve consistently.
  • Reliability is shown only for vehicles that actually operate in service, but there is no measure of actual fleet utilization and the headroom for service growth using available buses, streetcars and subway trains.

In discussion of the report, Commissioner Carroll noted that the TTC still has a problem with on time performance for streetcars. CEO Rick Leary replied that there is an On Time Performance team who are looking at details including recognition that there are three types of routes: those that run well, those affected by construction and those with other problems.

Carroll replied that people are quick to complain about King Street and wondering why they are still waiting for the 504. The TTC says that construction is the reason, but do they have a strategy to deal with bunching and communicate with riders. Management replied that they have strategies for keeping riders informed during planned diversions, but for unplanned emergencies there are service alerts. Changes are coming and service should improve.

This discussion was frustrating to hear because, first off, the central part of 504 King between Dufferin and Parliament is not affected by construction. Only the outer ends in Parkdale/Roncesvalles and on Broadview have (or had until recently) bus shuttles. As for keeping riders informed, irregular service plagues all routes in the system as I have documented in articles here many times. The problem is line management, or the absence of it.

On another topic, Carroll noted that the TTC seems to have a lower standard for the condition of stations than it does for vehicles, or at least tracks the latter at more detail. Leary replied that a summer blitz using student workers will scrub down all stations to bring the system back to a better quality for riders returning in the Fall.

Continue reading →

TTC Service Changes: July 31, 2022

There will be a small number of changes on July 31 for the schedule period running through to the Labour Day weekend.

Line 2 Service Improvement

Service on Line 2 Bloor-Danforth will be improved during all operating periods, notably off-peak and weekends. This will not fully restore pre-pandemic levels on the route, but should reduce crowding that has become a problem over past weeks.

King & Sumach Track Repairs

The intersection of King and Sumach (the point where the Distillery line branches off) will be rebuilt in an attempt to reduce noise and vibration.

During this work, all 504 King service will operate to Broadview Station via Parliament and Queen Streets. The 503 Kingston Road route will also use this diversion.

A shuttle bus will operate to provide access to the Distllery, and it will also provide coverage for the 506 Carlton line during construction at Church Street (see below).

Church & Carlton Track Repairs

The intersection of Carlton and Church will be rebuilt as part of the regular maintenance program. This work will not include the addition of missing curves in the southeast quadrant.

506 Carlton service will divert around construction via Parliament, Dundas and Bay both ways. A replacement bus service will operate from Spadina Station to the Distillery District. The map below shows a proposed alignment for this service. This is subject to change depending on possible modifications to turn restrictions due to construction at College & Yonge.

Updated July 28, 2022: This diversion has been changed. See Revised 506 Carlton Diversion Effective July 31, 2022.

Other Changes

Running times on 32 Eglinton West will be adjusted to provide for delays due to the Line 5 Crosstown Extension construction, as well as to restore covid-era service cuts.

A planned reconstruction of the terminal at Kipling Station will require consolidation of loading areas and move of some routes to stops outside of the station. This project has been deferred to 2023, but a schedule change to support this work was already in the pipeline for the coming period. The 40 Junction and 49 Bloor West routes will be interlined.

Route 172 Cherry Beach will shift from “Old” Cherry Street to the “New” street across the future path of the Don River between Commissioners Street and the Ship Channel. Buses will use Old Cherry Street north of Commissioners Street, then jog west to New Cherry Street to cross the new river course.

Route 174 Ontario Place weekend and holiday service was dropped in June due to conflicting activities at the CNE and Ontario Place grounds. This change is now officially in the schedules.

Details of the new service levels are in the spreadsheet linked below.

Major Construction at Russell Carhouse

Reconstruction of Russell Carhouse will begin both to make it fully compatible with the Flexity fleet, to improve the quality of yard paving and convert the overhead system for pantograph operation.

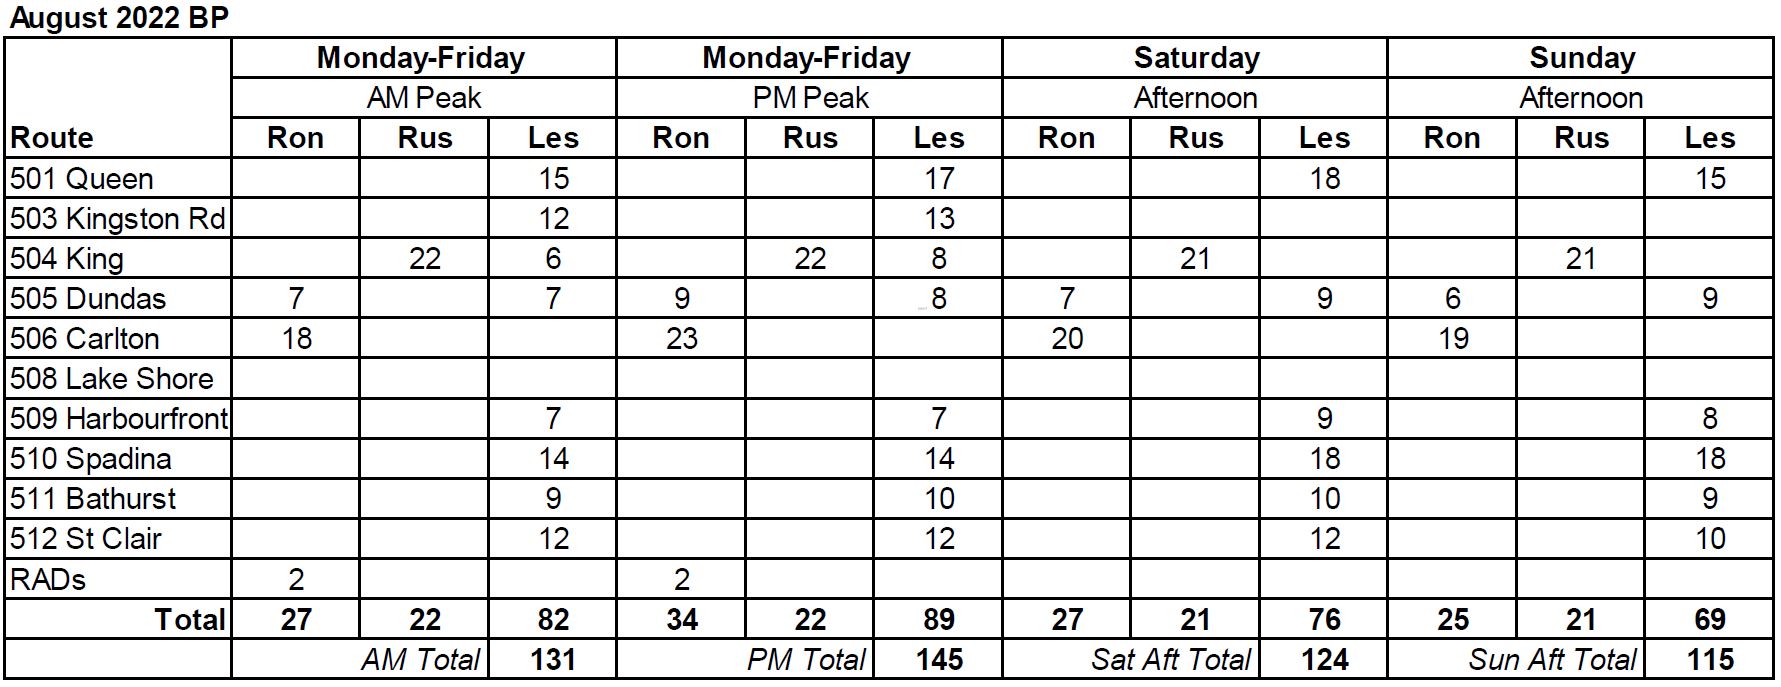
In the first phase of this work, the site’s capacity will be reduced to 28 cars including spares. Only the 504 King service will operate from the yard. Here is the new allocation of routes to the three carhouses.

Note that the maximum number of cars in service is well below the fleet of 204. Bus substitutions on portions of 501 Queen, 504 King and 506 Carlton will continue through the balance of 2022.

As the work at Russell progresses, the capacity of the site will change.

TTC 2023 Service Plan Survey

The TTC’s online survey for their 2023 Service Plan is now available.

It contains three sections, and you can submit answers to any or all of them.

  • Lessons learned from the Covid-19 era
  • Route changes associated with the shutdown of Line 3 SRT (November 2023)
  • Route changes associated with the opening of Line 6 Finch West

There may be added route changes proposed in a second consultation round later this year.

This consultation is for 2023 changes. A separate 2024-2028 Service Plan and Ten-Year Outlook is under development.

Note that the route arrangement for Line 5 Eglinton Crosstown’s opening is already settled from previous consultation in the 2022 Service Plan.

The Varying Strength of Ridership Recovery

This article continues and enlarges on information in TTC 2023 Annual Service Plan Preview with additional material from a report on the July TTC Board agenda Advancing the 5-Year Service Plan (2024-2028) & 10-Year Outlook Reset. That is a long report with several components, and I have pulled chunks of it out as they relate directly to information in the earlier article.

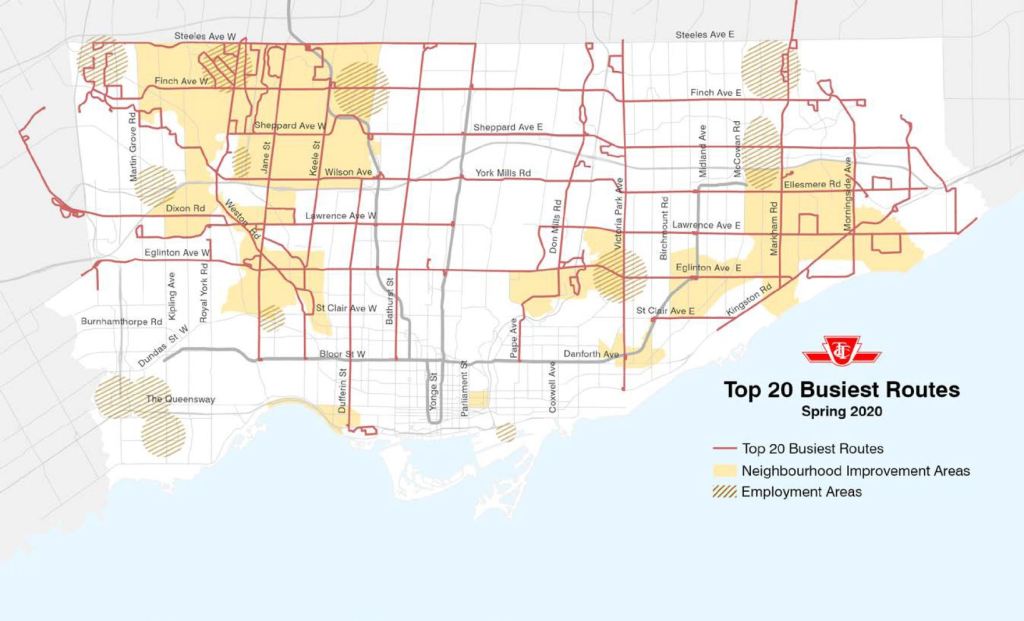
Of particular interest in the restoration of service to the transit network is the fact that recovery has been underway in some locations and times much more strongly than others. This corresponds to the difference in areas where work or study-from-home replaced commuting to an office or school. Maps in the previous article showed the top and bottom 20 routes for ridership relative to pre-pandemic levels in Spring 2020 (the point of lowest ridership) and in Fall 2021. For convenience, they are repeated here.

These ranking are by percentage of pre-pandemic ridership with no reference to absolute numbers. The busiest routes by ridership are shown in the maps below. This presentation inevitably displays the long routes which have a large number of boardings. Short routes like 65 Parliament may have recovered a large proportion of their demand, but the base number is necessarily small because of their smaller service territory.

This shows the danger of looking at absolute numbers out of a context such as riders per route kilometre (in effect, the density of demand), not to mention possible variations in the level of demand and boarding patterns along a long route.

Continue reading →