The real estate industry, their acolytes and even the affordable housing advocates went into meltdown when the 2022 update to the Development Charges landed at Toronto’s Executive Committee. This proposal was approved recently by City Council, but with a few carve outs such as exempting certain types of housing (up to 4 dwellings on a lot) from these charges.
The main trigger for the uproar was that the new DCs are much higher than those they replaced. With transit being the primary driver of this increase, it is worth understanding how DCs work and what the new charges will and won’t fund.
First, a comparison of the base data for the 2018 and 2022 reports. The tables below are in almost the same format making comparison easy.
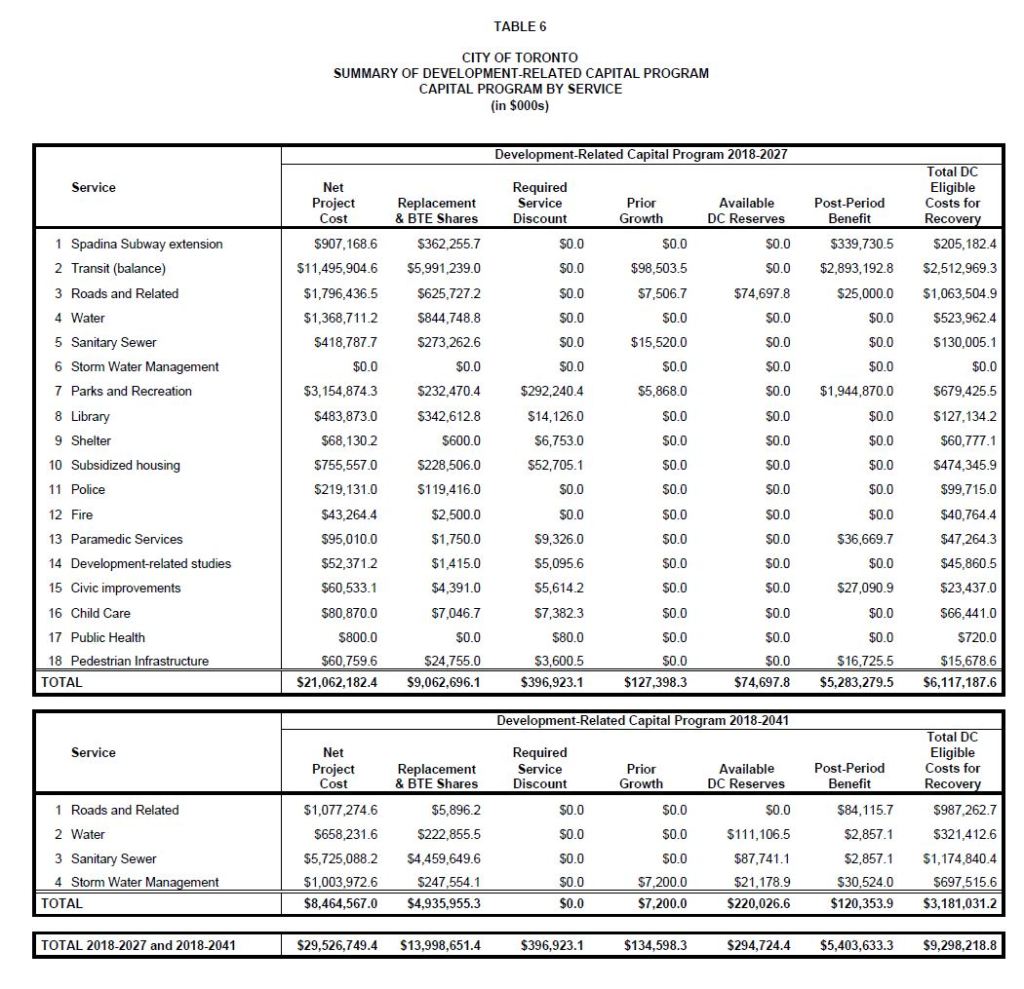
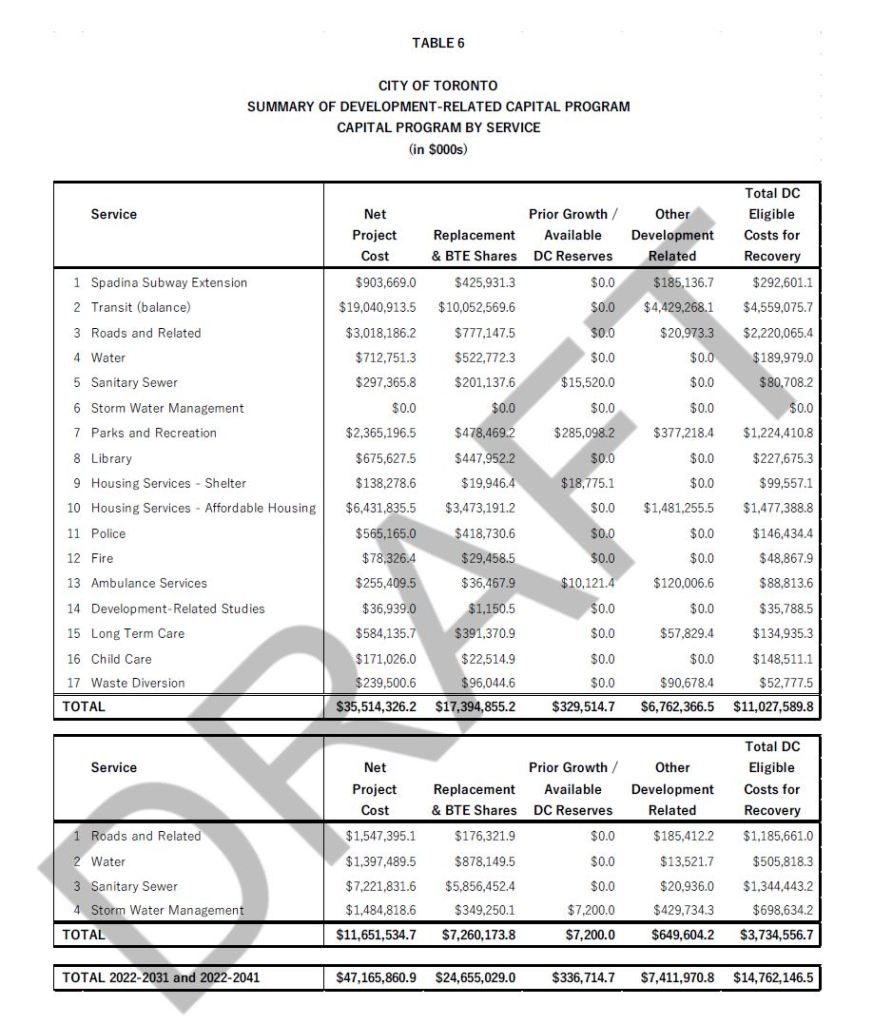
The important column is on the right end of both charts “Total DC Eligible Costs for Recovery”. The total in 2018 was $9.3 billion while in 2022 it is $14.7 billion.
Yes, we are still paying for the Spadina Subway which gets its very own line in the table, and the Sheppard line shows up in the details under “Transit (Balance)”. Large increases lie in:
- Transit, about $2 billion
- Roads, about $1.2 billion
- Housing Services, about $1 billion
- Parks & Recreation, about $550 million
Some lines go up by a lot proportionately, but the dollar amount is comparatively low. For example, Pedestrian Infrastructure went from $15.7 million to $52.8 million, over triple, but the actual dollars pale by comparison with transit.
A major difference between 2018 and 2022 is the proportion of total costs recovered from subsidies and contributions from other parties.
In the 2018 DC calculation a grand total of $43.5 billion gross was reduced by $14.1 billion to a net value of $29.4 billion.
In the 2022 DC calculation, a grand total of $66.9 billion gross is reduced by $19.8 billion to a net value of $47.2 billion.
The increase in gross figures, 54 percent, is much higher than the increase in recoveries through subsidies and other revenue, 40 percent. This causes a disproportionate growth in the net of 61 percent.
Where Do Those Numbers Come From?
The background study that recommends new Development Charges starts with a list of every capital project in the City. The TTC has the biggest capital budget, even with some major projects taken over by the province, and it therefore generates the biggest part of the DC tithe.
For each project some costs are included and others are excluded. The headings on the charts above show the breakdown:
- Net Project Cost: The cost of the project borne by the City after deducting provincial and federal subsidies and contributions by others (for example, York Region’s contribution to the Spadina Subway). (The gross costs for those who are interested are in the detailed tables.)
- Replacement: Costs to replace existing infrastructure (such as new buses that replace old ones) are not eligible for DCs because this cost does not address growth, only worn out assets.
- Benefit to Existing (BTE) Share: Demand that would rise if the improvements were already in place determines the portion of the benefit that is not due to new development.
- DC Reserves: Some groups of projects did not manage to spend all of the money collected for them, and this sits in a carry over reserve offsetting new charges.
- Other Development Related: Some costs are deferred to future rounds of DCs as reflecting the value of a project like a new subway line well beyond the five year cycle of DC updates.
The BTE share is calculated from existing and projected ridership (see below).
Looking at the 2022 chart above, of the $47.2 billion in net project costs, only $14.8 billion will be recovered in the current period from DCs. (The gross cost, by the way, is $66.9 billion.) This does not include provincial projects like the Ontario Line and Scarborough Subway which are no longer on the TTC’s books. It also does not include much of the Green Bus plan because that is mostly replacing existing buses, not adding to the fleet for ridership growth.
Continue reading