
Service quality and reliability are, as regular readers here know, central to many of my critiques of the TTC.
Whether a route is short or long, busy or not, the TTC seemed incapable of accepting much less addressing service problems. For years, long before the pandemic, riders have complained about long, unpredictable waits and crowded buses, but the answer has always been that things really are not that bad. This is demonstrably not true.
The TTC relies on metrics based on averages, not on individual vehicle behaviour and this masks the wide variation in rider experience. 26 Dupont is an infrequent route with few riders, and it does not figure in the high end of the TTC’s attentions.
We have been through two years where the pandemic and the need to keep something, anything running took precedence. Now, with the hoped-for recovery, the TTC must address long standing problems that predate covid.
Looking ahead to their 2023 Service Plan, the TTC will attempt to deal with this issue as it is essential to improving transit’s attractiveness and luring riders onto the system.
The Dupont Bus
The 26 Dupont (formerly 4 Annette) operates between St. George and Jane Stations via Bedford, Dupont, Annette and Jane Streets. Dupont is itself stitched together from older, previously separate streets. It passes through a light industrial area south of the CPR corridor to the CN/GO and CP junction at West Toronto. From there to Jane Street, the neighbourhood around the line is residential. Much redevelopment is now happening on the former industrial and commercial properties.
Service today is infrequent, although this was not always the case. Over the years, employment declined and riding reoriented to the Bloor subway only 1km to the south.
The most recent schedule change was in November 2019. Running times were shortened, and some buses were removed AM/PM peak, weekday late evening, and Sunday early evening.

Half-hourly scheduled service is rare, especially on a route in the old city where demand tends to be better than in the suburbs. One big problem, as we will see later, is that the new scheduled trip tims canot always be achieved and this throws service into disarray.
Screen Lines
For the purpose of analysis, the route is divided into three segments: the two terminals and the route in between them. Two “screen lines” marking these divisions are the points where headways and travel times are measured:
- Bedford north of Prince Arthur: north limit of loop via Prince Arthur, St. George Station and Bedford Road.
- Jane north of Loop: north limit of loop via Jane Station, Armadale Avenue, Bloor Street West and Jane Street.
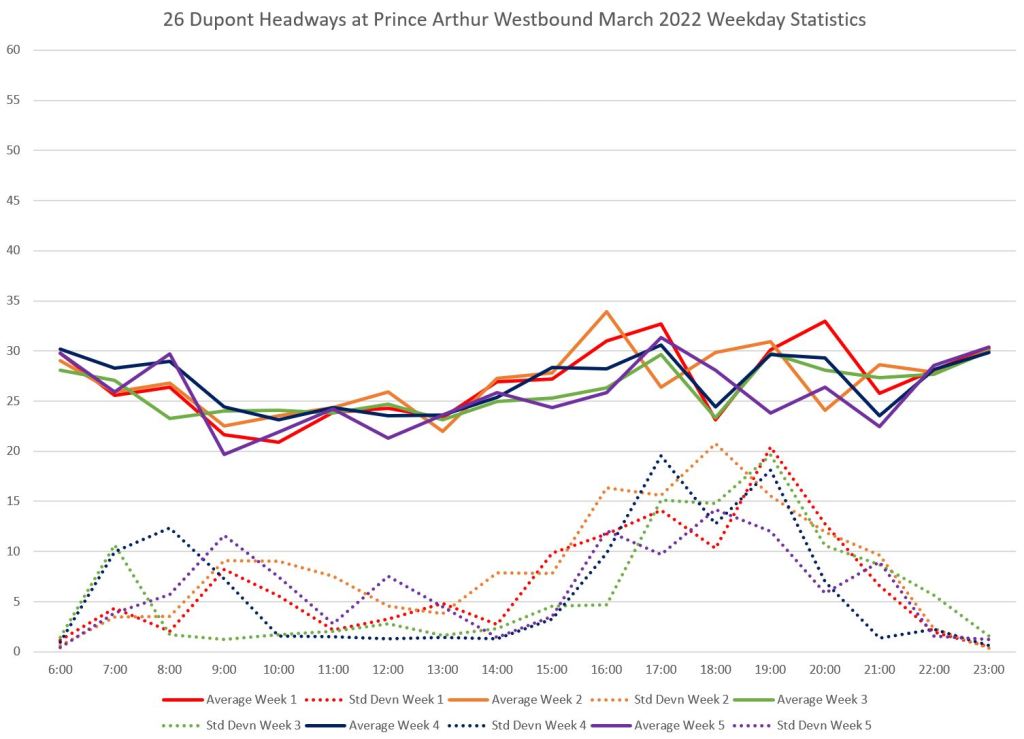
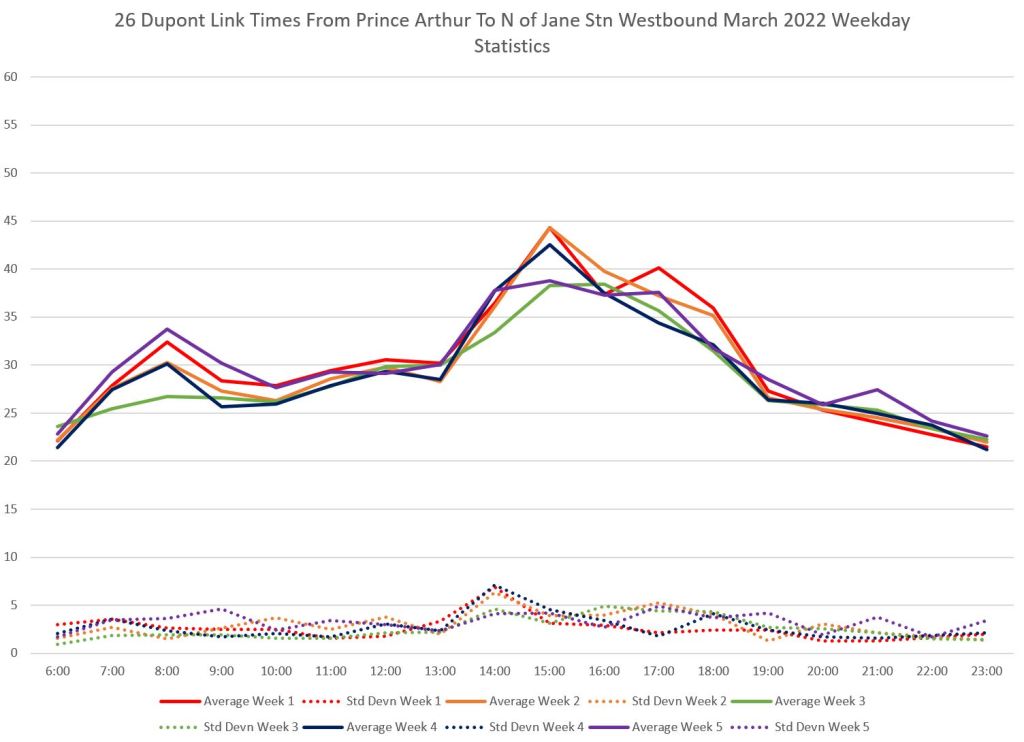
Headways at Prince Arthur Westbound
These charts show the headways (interval between buses) leaving St. George Station.
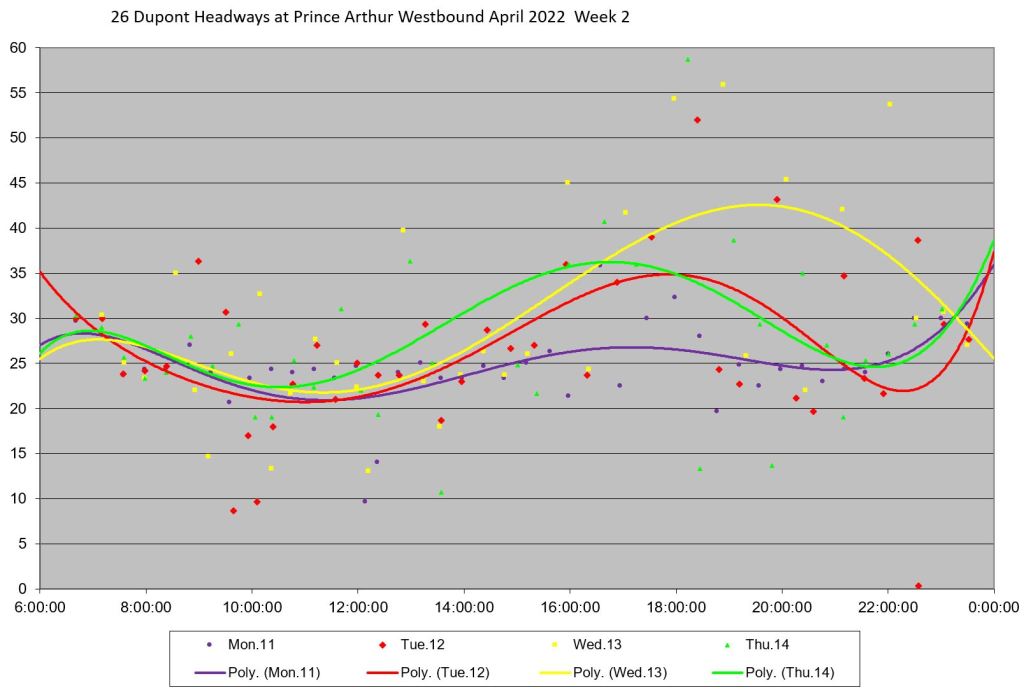
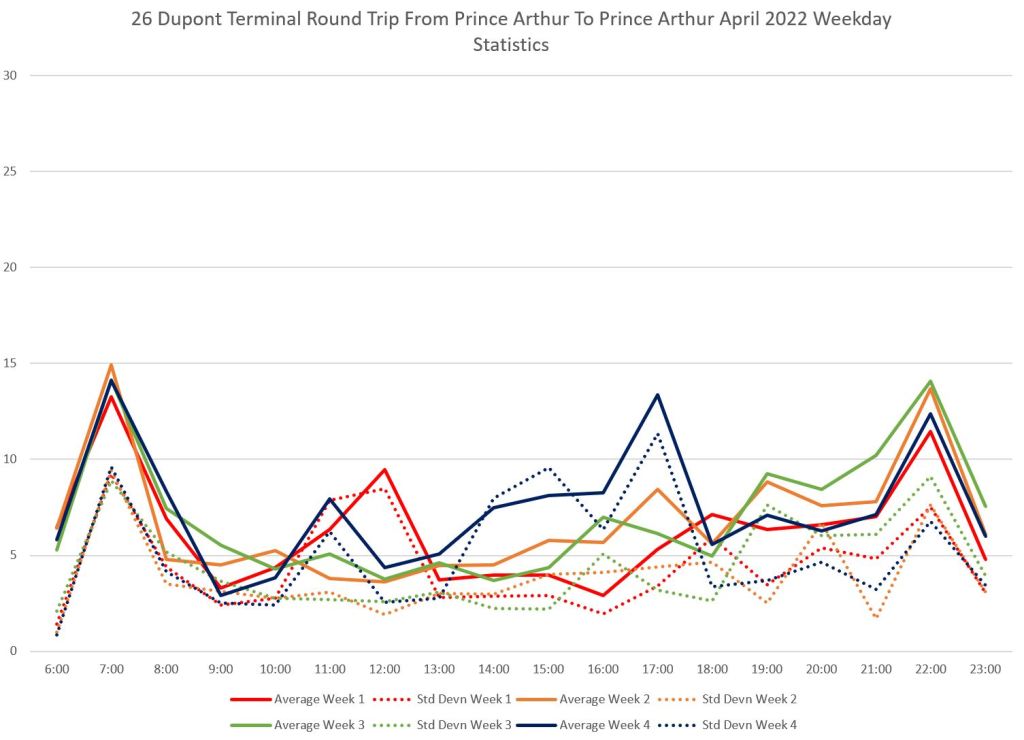
The first chart in each set shows weekly averages for weekday operations. Broadly speaking, the lines for each week stay in the same range and follow the scheduled headways through the early part of the day, but in the late afternoon and evening the averages pull apart. At the same time, the standard deviation of values (a measure of their dispersion) becomes very large. This is a red flag that service is very disorganized before we even look at the fine details.
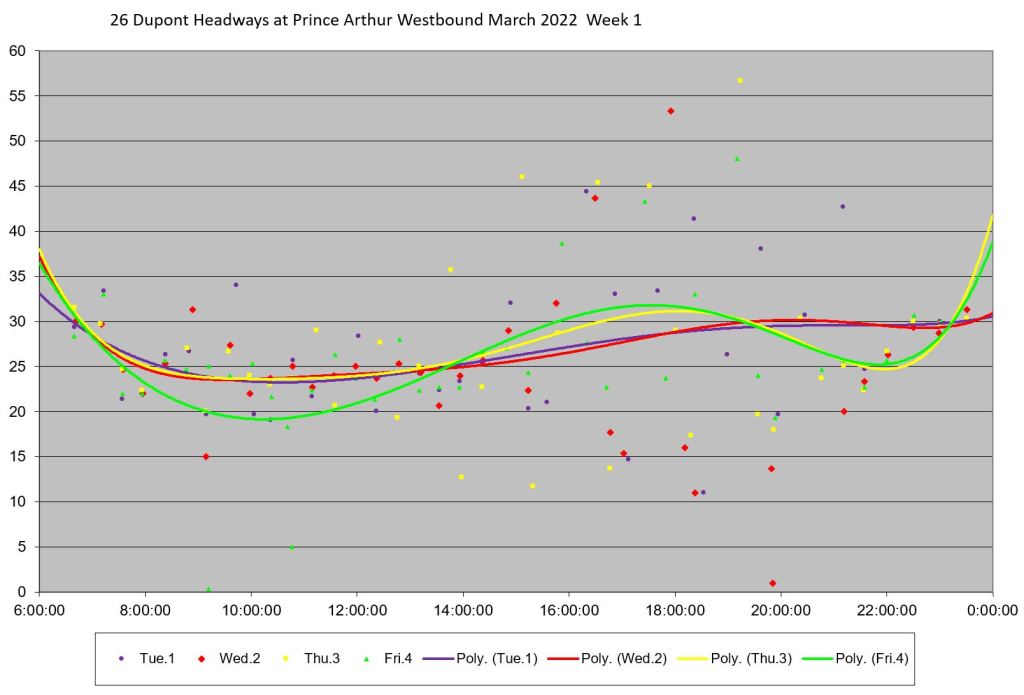
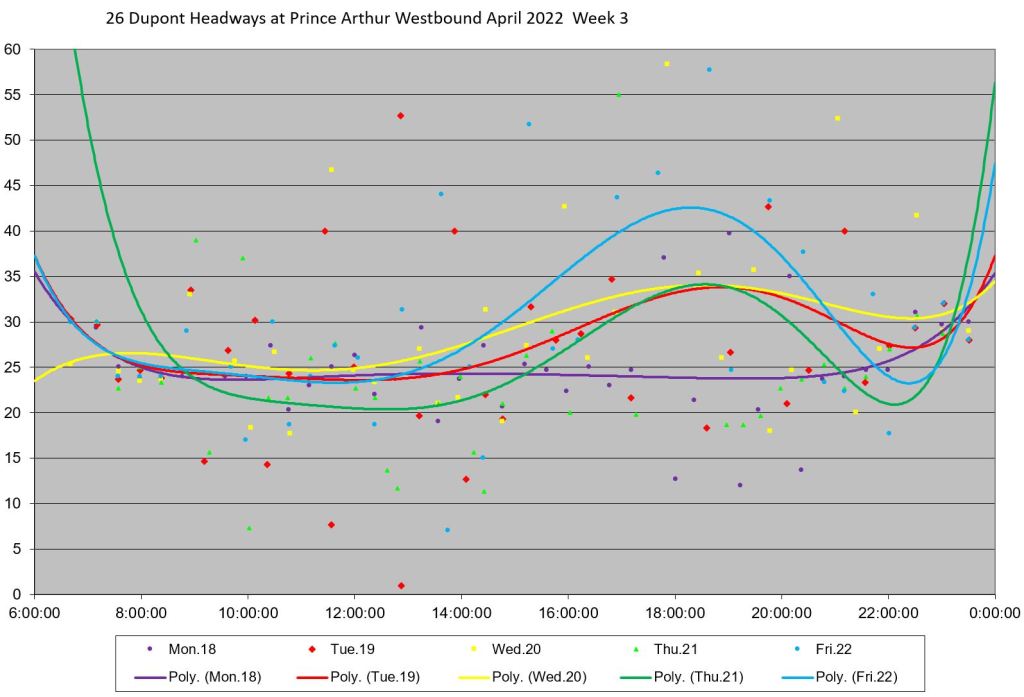
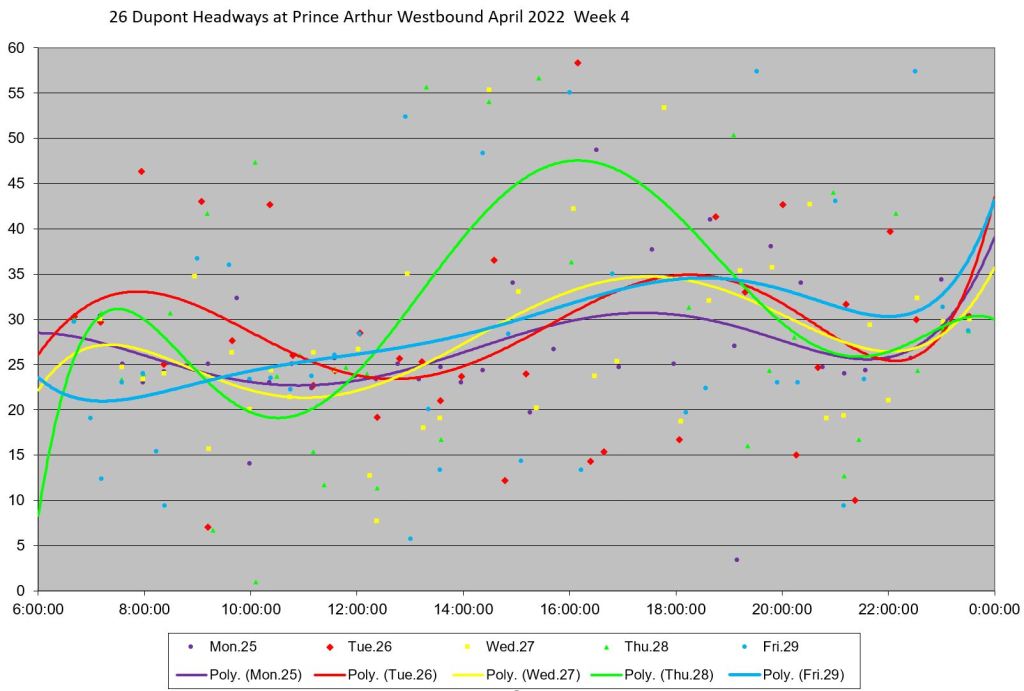
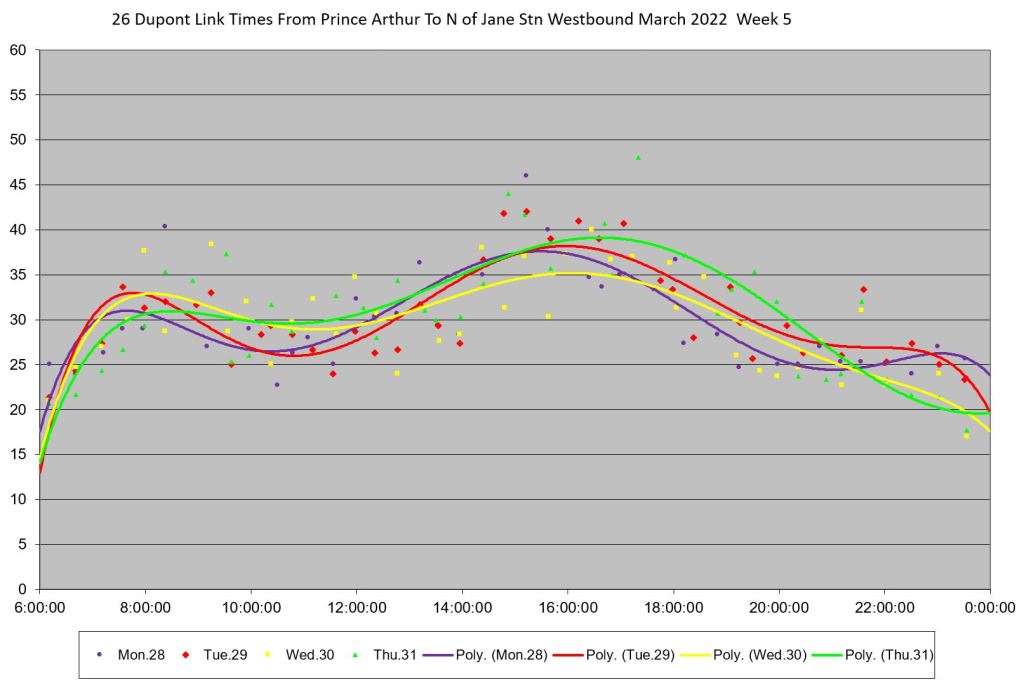
The next five charts show the data on a week-by-week basis with each dot representing one bus. Trend lines show the overall shape of the data, and in many cases these lines stay close together. Note that these are not averages, but rather “best fits”. Where these wander substantially, this indicates a period where service on the affected day was quite different from others.
Headways well above half an hour are common, and it is hard to understand why anyone would actually wait for this service. My purpose in showing so much detailed data is to illustrate that the ragged service is not an occasional event, but something riders experience every day.
In detailed reviews of selected days later in the article, we will see that service at St. George Station is affected by two common problems:
- Buses, even though there may only be a few on the route, run in packs, sometimes for extended periods.
- Some buses short turn without ever reaching St. George, indeed without serving much of the route. This is a direct result of scheduled running times that are shorter than the time actually needed to traverse the line.
Yes, dear readers, buses do short turn, despite the TTC’s claims that this practice has been so thoroughly eradicated that they are considering dropping the count of such events as a service quality metric.
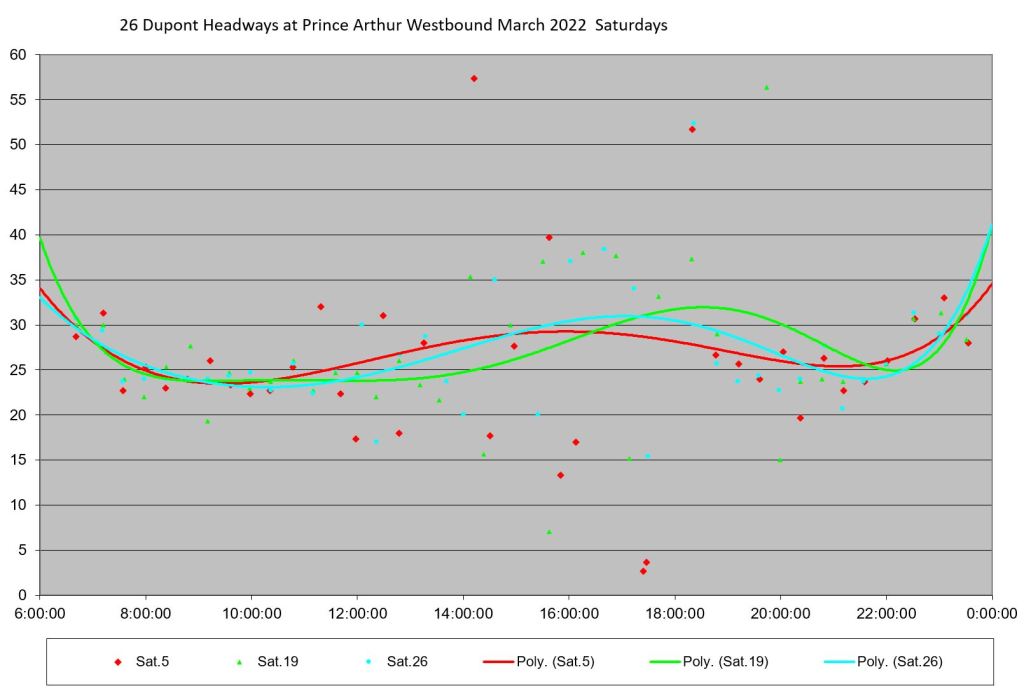
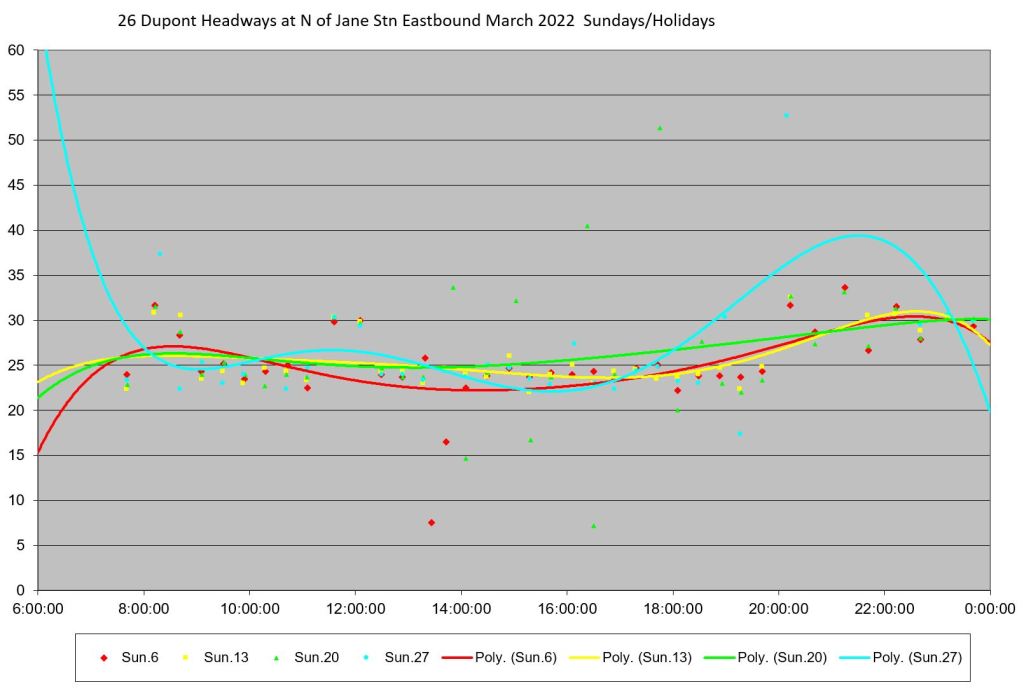
The final two charts show the data for Saturdays and Sundays. Note that the Sunday values are much better behaved with headways staying quite regular throughout the day.
Clicking on any chart will open the collection in a scrollable gallery.
March


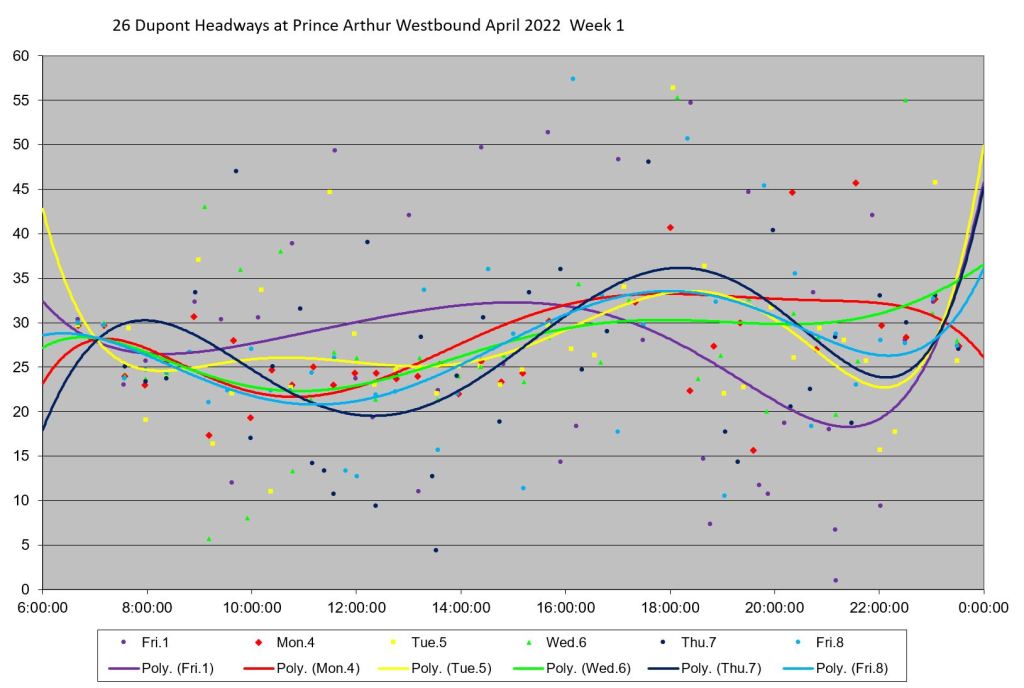
April
Data for April have the same overall shape as in March.


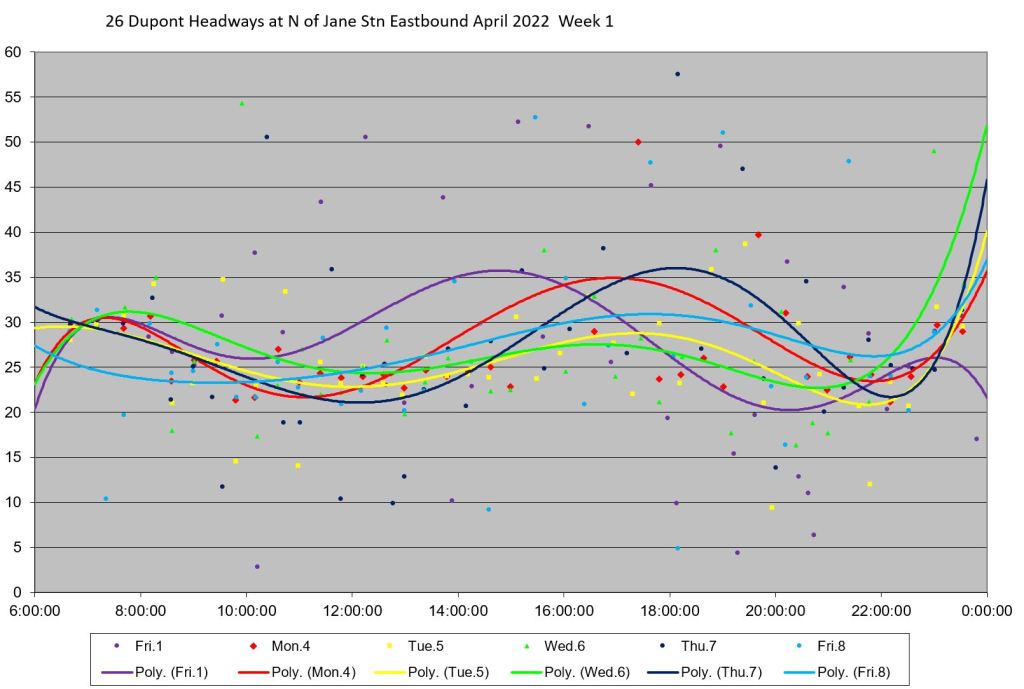
Headways at Jane Station Eastbound
These charts show the headways measured just north of Jane Station Loop. The pattern is similar to the service at the east end of the route with the averages and standard deviations becoming quite irregular in the afternoon and early evening.
March


April


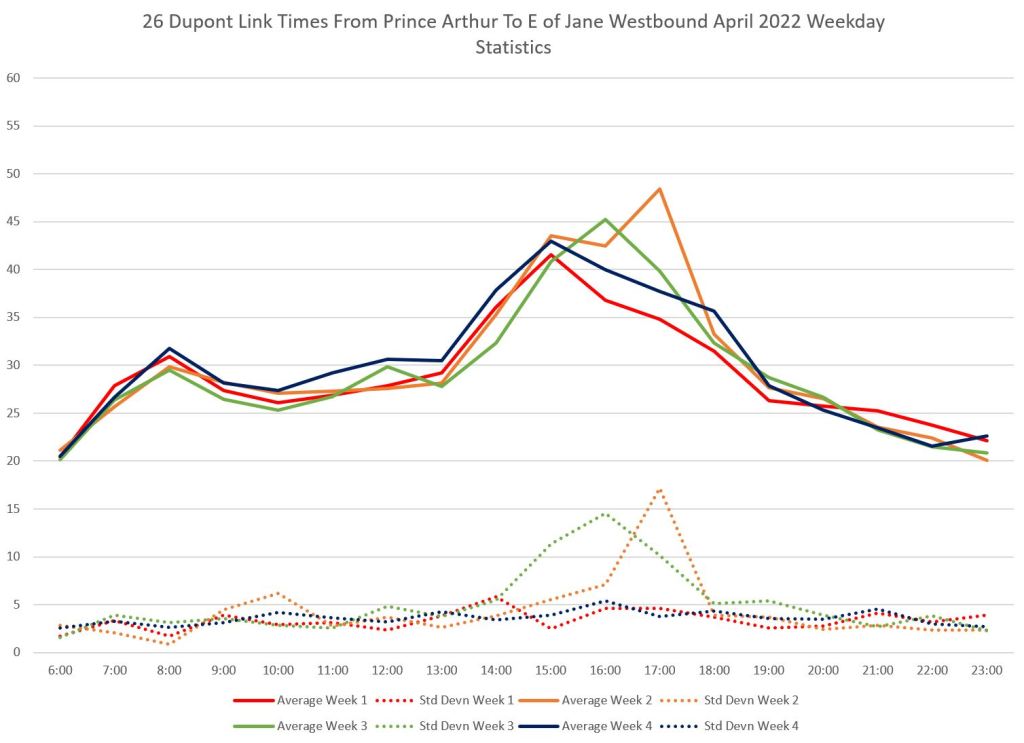
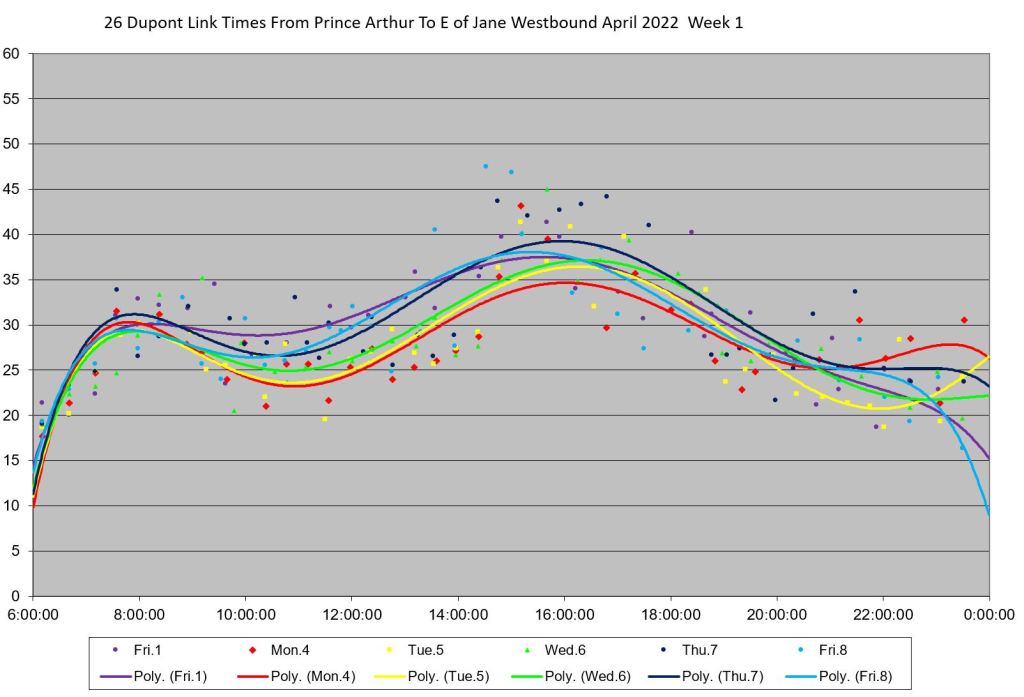
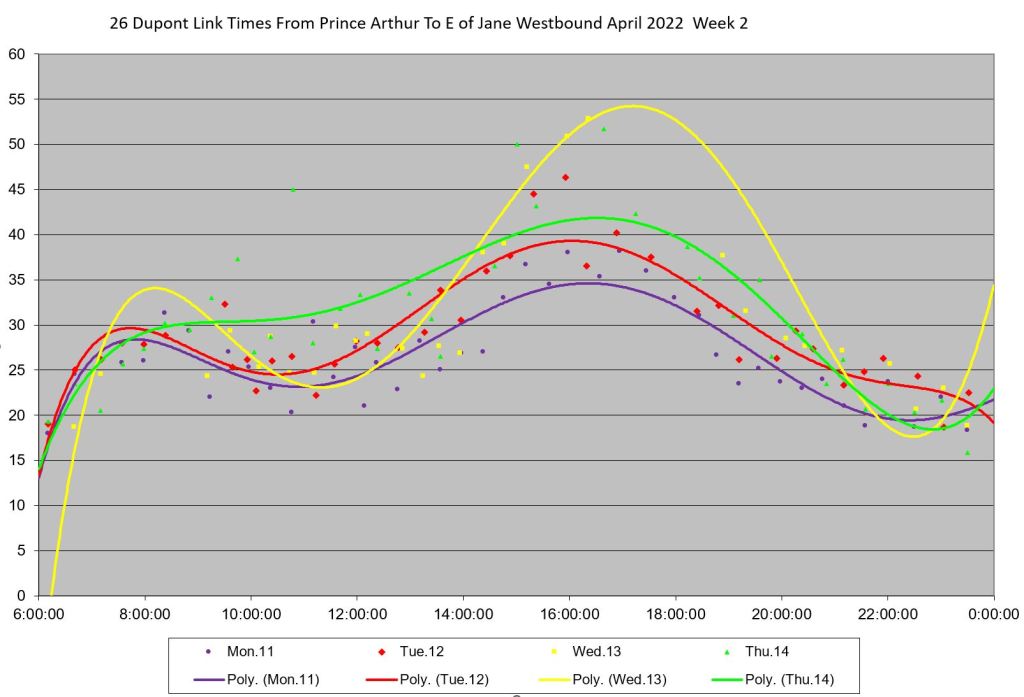
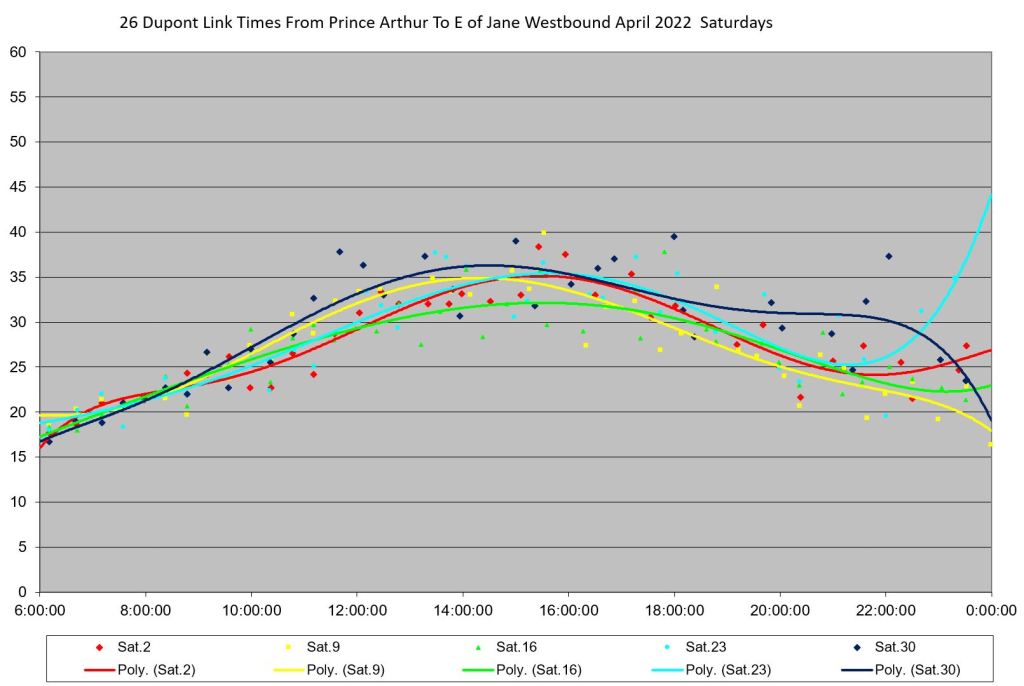
Travel Times Westbound
The plots of travel times measure the time needed to get between the two terminals. These charts have a very different character from the headway charts in that the daily and weekly averages are similar over the two months, and trghe standard deviation values are quite low reflecting consistent values. To put it another way, the travel times are predictable within a fairly small range of values, although they do vary by time of day.
Of particular note are the values in the weekday afternoon and early evening. The scheduled round trip time, including terminal layovers, during this period is 72 minutes (36 each way) but the actual time required just to traverse the route exceeds this regularly. The buses simply cannot stay on time. There is a similar problem on Saturdays, but not on Sundays when the travel times stay within the schedule.
March


April


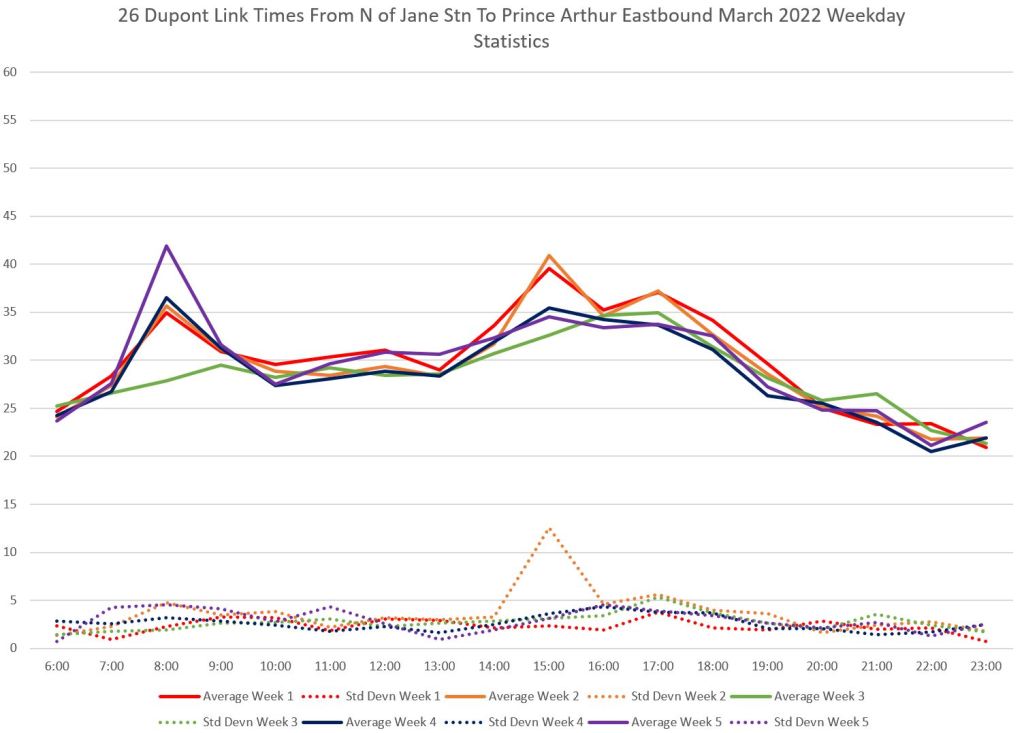
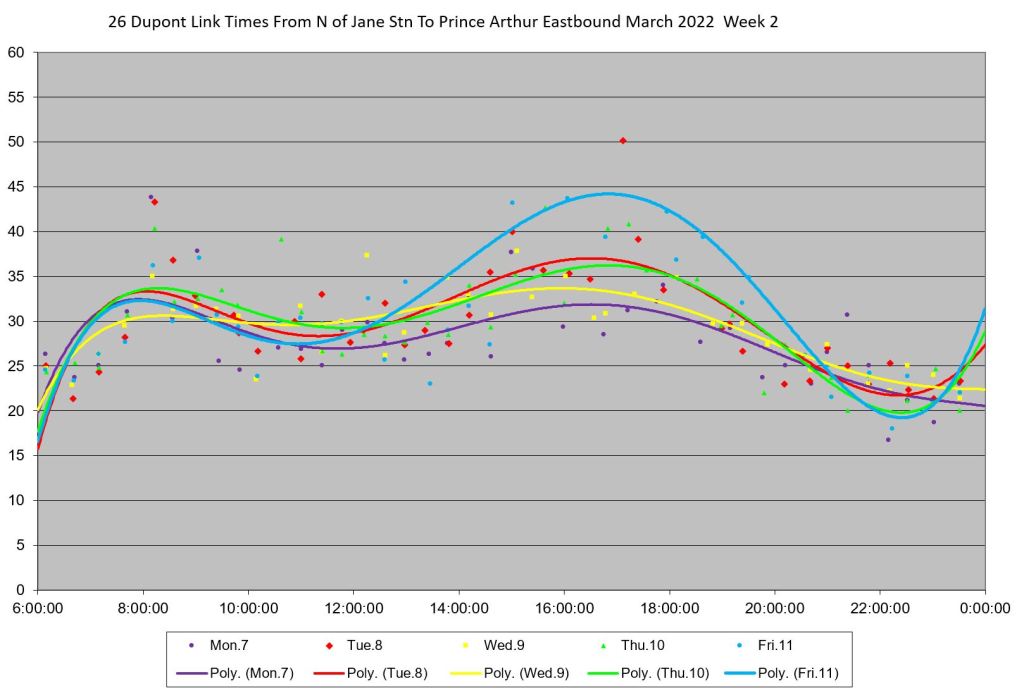
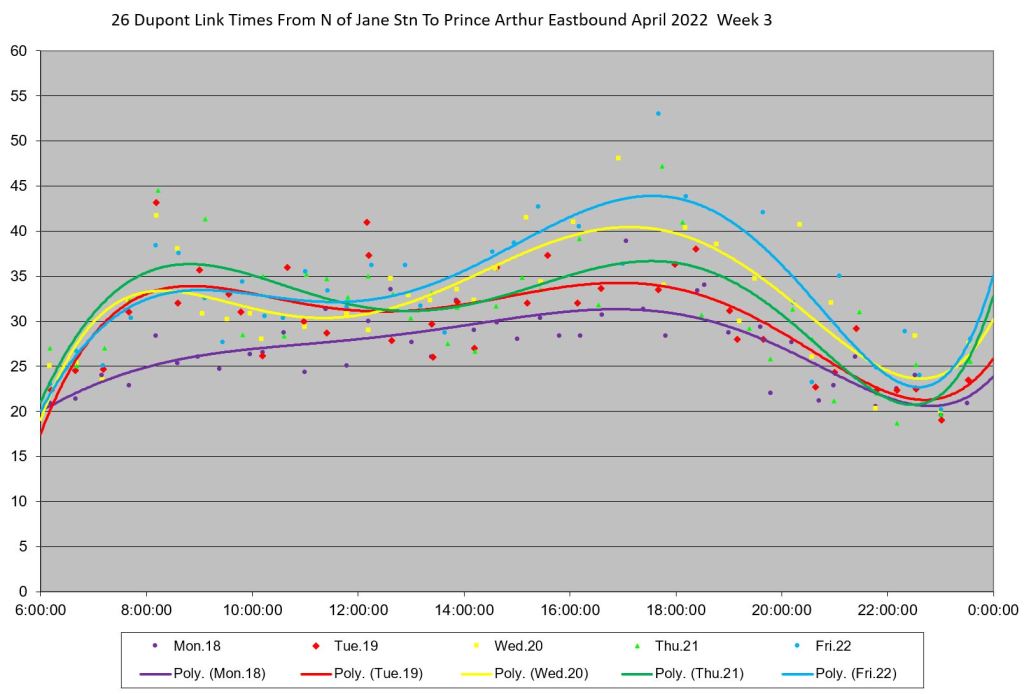
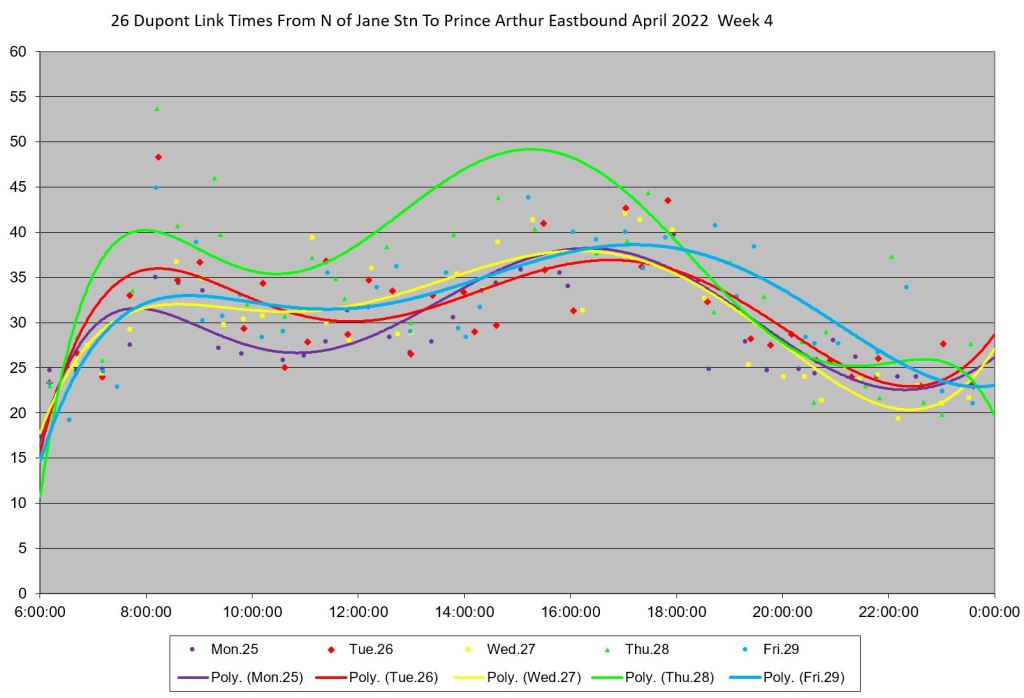
Travel Times Eastbound
Eastbound travel times have the same overall problem as westbound values, but they show a different pattern including an AM peak.
March


April


Terminal Times
Terminal times are measured from the point where a bus crosses the screenline on its approach to the station and the point where it crosses again on departure. These values will reflect both the time taken on the platform, as well as travel time making the loop. Where these values are large, typically this indicates that there is padding in the schedule. However, on 26 Dupont, some of this reflects long layovers to adjust for the inadequate schedules.
Only the weekday averages for each terminal and month are shown to illustrate the irregularity of these values.
At St. George Station

At Jane Station


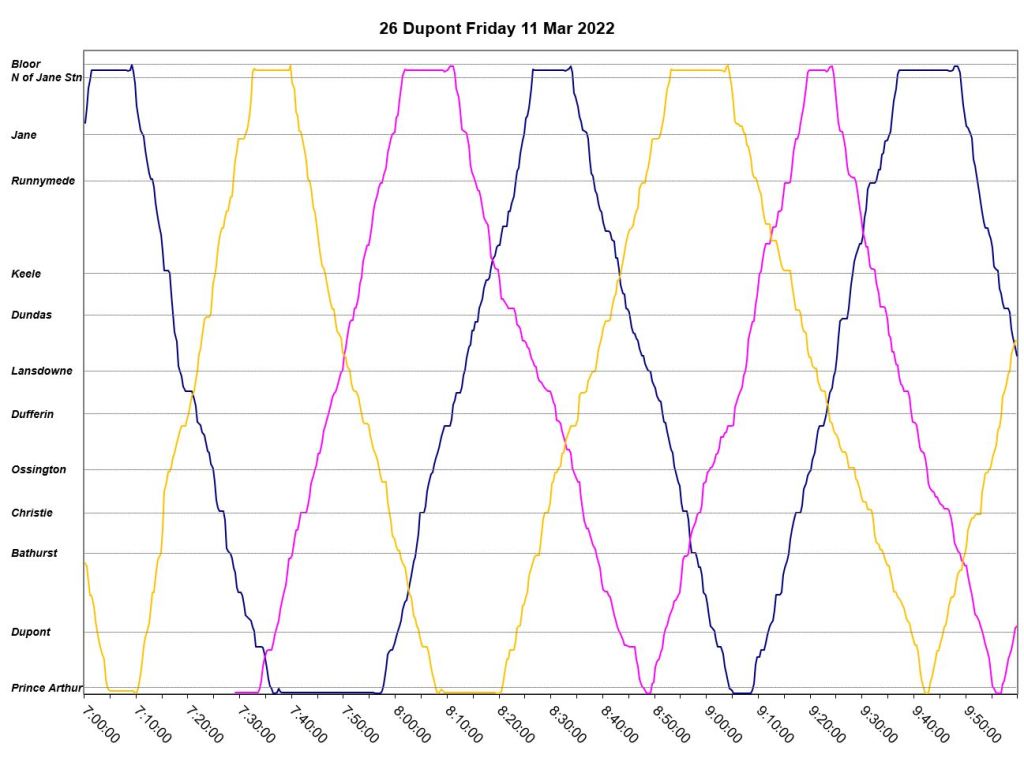
Service Charts
The service charts track the movement of buses back and forth along the route. During most of the day, there are supposed to be three buses in service except for the early morning and late evening when there are two.
Friday, March 11
The day begins fairly regularly and the third bus (pink) appears at St. George Stationat 7:30am. Note that buses tend to take longer layovers (horizontal sections of the lines) at the west end of the route. Problems begin after 3pm (1500) when travel times lengthen as shown by the change in the slope of the lines. Headways stretch out and there is a travelling gap of one hour on the route that persists into the early evening. One bus, “Yellow”, takes a one hour layover in an attempt to get back on time, but only manages to rejoin the pack for a round trip after 8pm. Similarly “Pink” takes a long layover starting at about 9:25pm. Regular headways are not restored until after 10pm when only two buses remain.


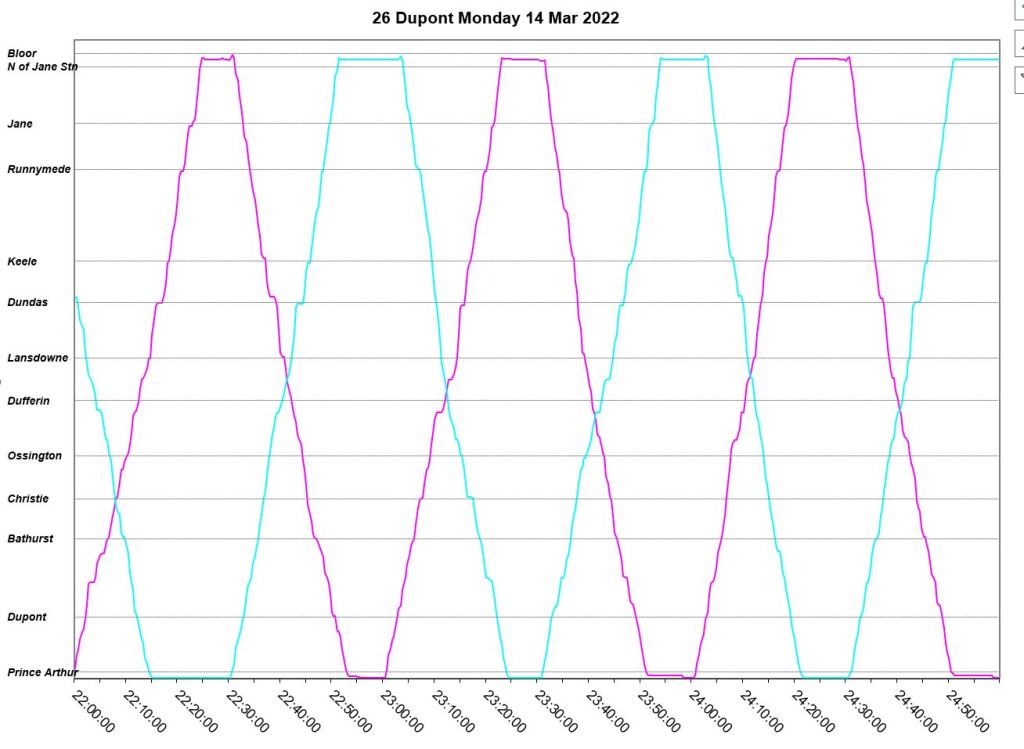
Monday, March 14
The day begins reliably enough, although two buses show up at St. George Station at 7:30am when the service builds up to three buses. One of them (“Dark Blue”) vanishes shortly afterward (possibly a change off for a defective bus).
After 3pm, a gap opens up behind “Yellow”, and two buses run together for 1.5 trips causing a travelling gap of about 50 minutes.
In the early evening, “Yellow” disappears from service leaving a gap where it should be until after 10 pm when the remaining two buses establish a regular headway.


Monday, March 21
March 21 begins with one of two buses out of service. There appear to be two change offs in the attempt to get this run operating. (On the chart this shows up as “Dark Purple”, then “Pink”, then “Yellow”.) Service does not settle down until about 9:30am.
After 4pm, congestion appears westbound between Ossington and Keele, and again two buses form a pair that persists through the PM peak. In the evening, “Yellow” takes a few long layovers to get back on schedule.


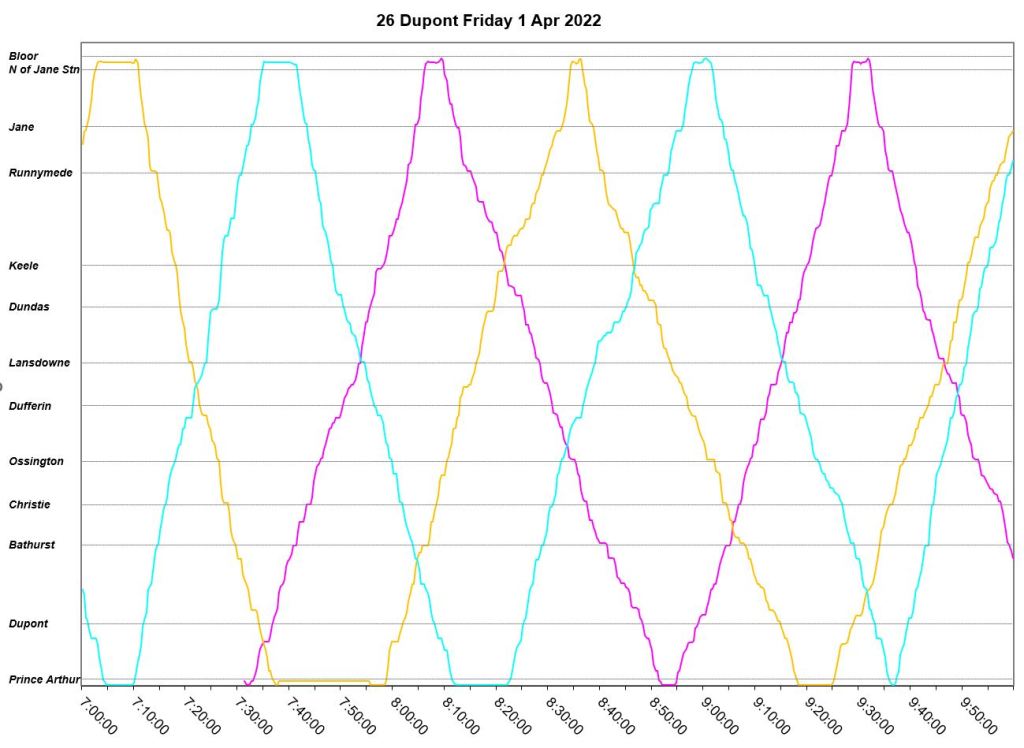
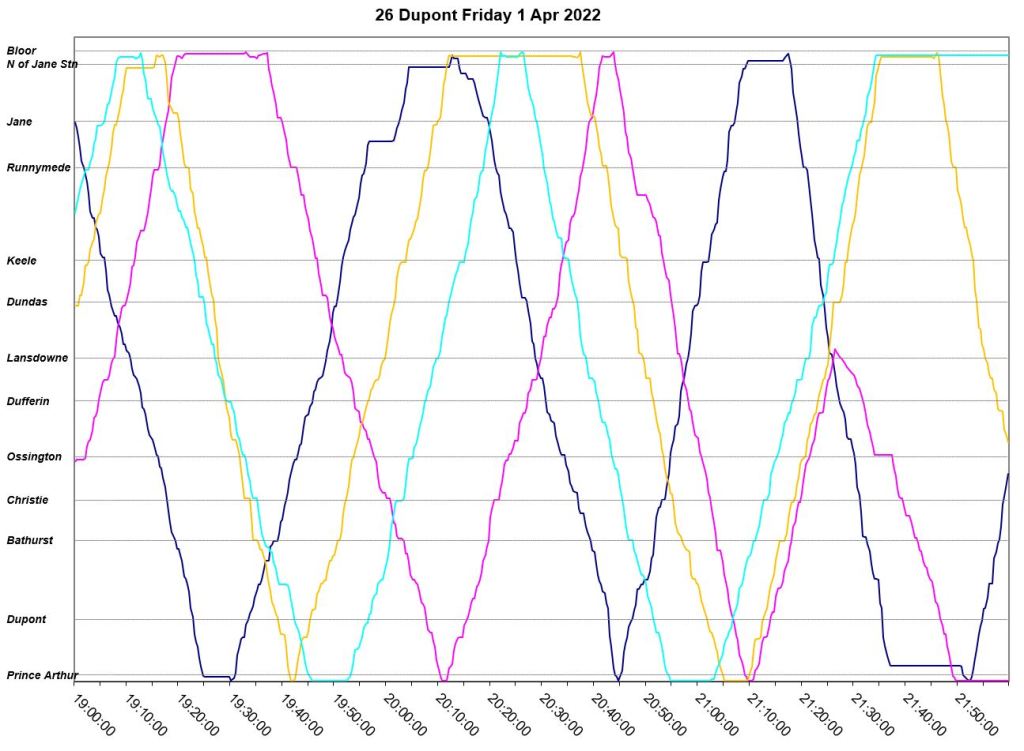
Friday, April 1
Service gets off to a worse than usual with two of the three buses bunched before 10am. One of them, “Yellow” appears to make a dead head trip from St. George to Jane to restore proper spacing at about 11am. Meanwhile “Pink” drops an entire trip at St. George from 11:10 to 12:20.
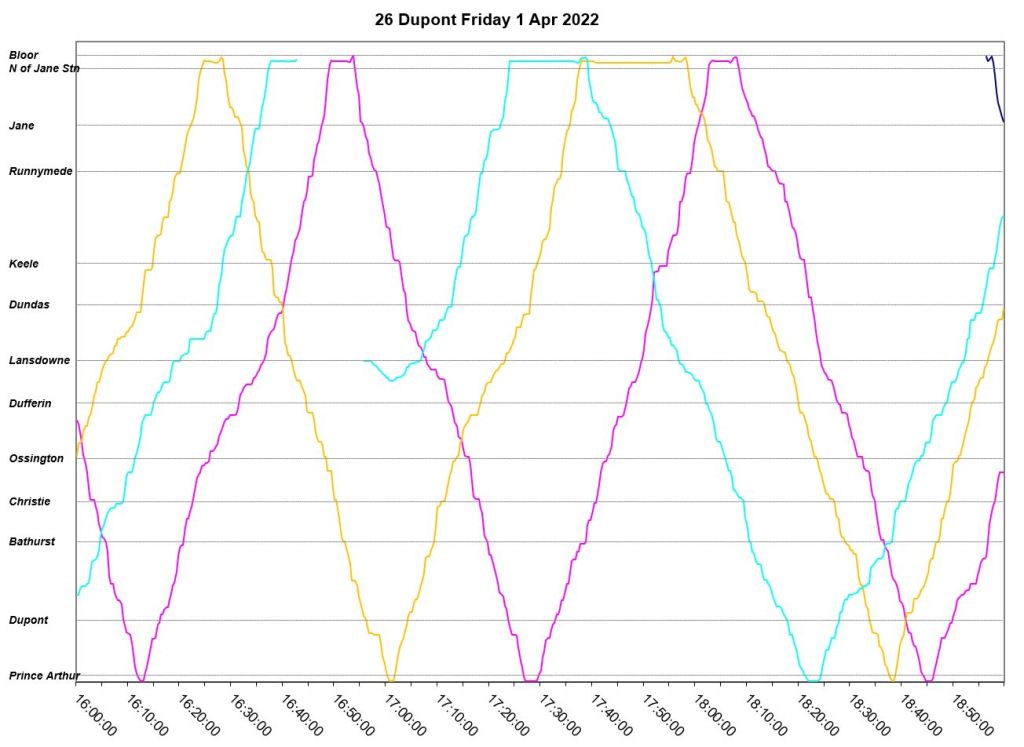
Service continues to be irregular through the early afternoon, and “Yellow” makes another dead head trip westbound. During the PM peak, “Turquoise” short turns eastbound at Lansdowne. By 6:30pm, all three buses are at or near the east end of the route with a corresponding large gap.
An unscheduled fourth bus, “Dark Blue” appears at Jane Station just before 7pm, but even this does not correct the headway problems. The two late evening buses adjust their trips to get on time for service after 10pm. “Pink” short turns westbound at Lansdowne at about 9:20pm, and “turquoise” takes a long layover at Jane.


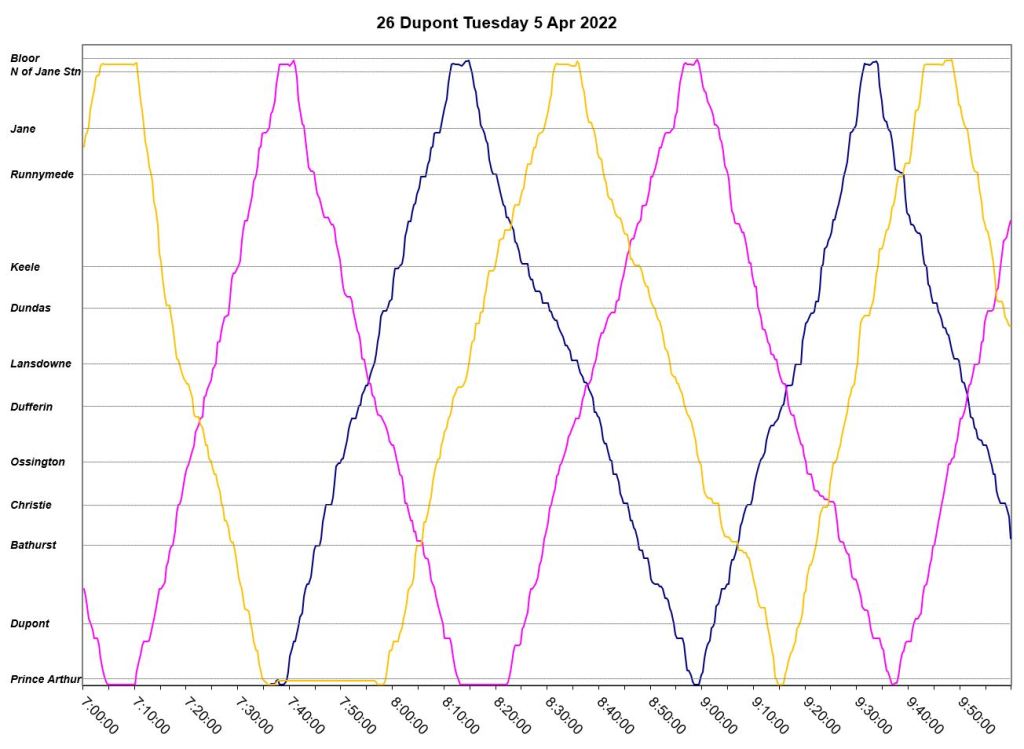
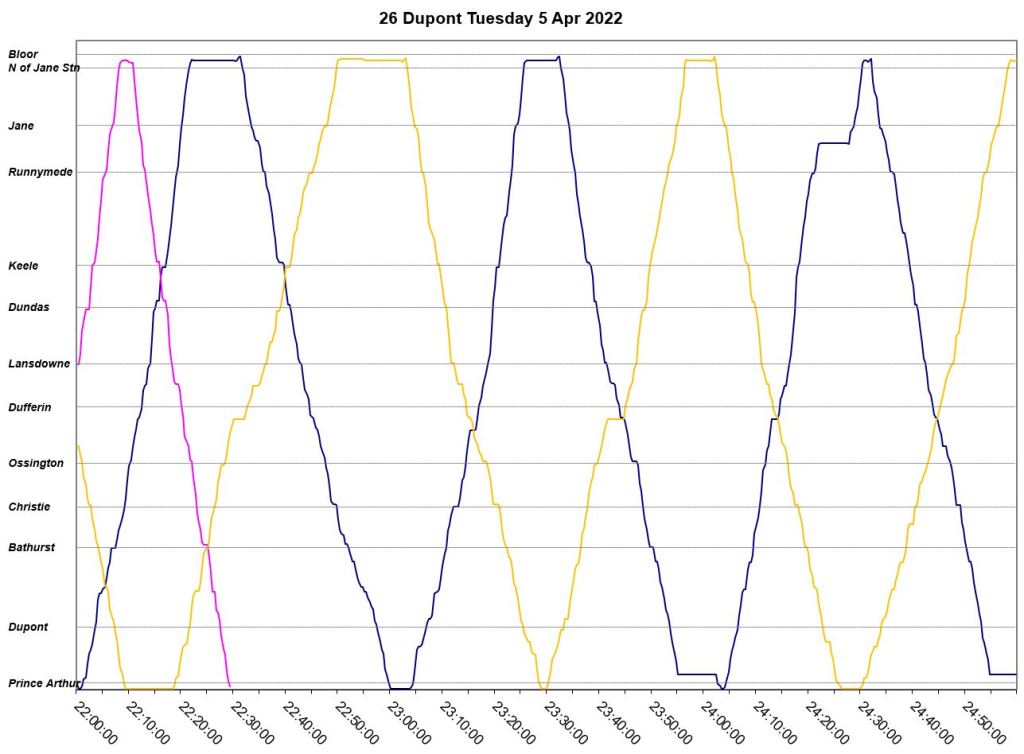
Tuesday, April 5
April 5 shows no bunching, and there are three short turns over the course of the day to put buses back on time. However, with an infrequent scheduled service, these cause wide gaps .


Saturday, April 9
Saturday April 9 begins well enough with fairly even service spacing. Buses have generous layovers at both terminals.
Just after noon, “Blue” vanishes for half a trip eastbound from Jane, and emerges again westbound. In the afternoon, headways become uneven with “Yellow” carrying a widening gap until the early evening. Note also how terminal layovers shorten through the midday and early afternoon and then lengthen again in the evening as more of each trip is consumed by driving time.


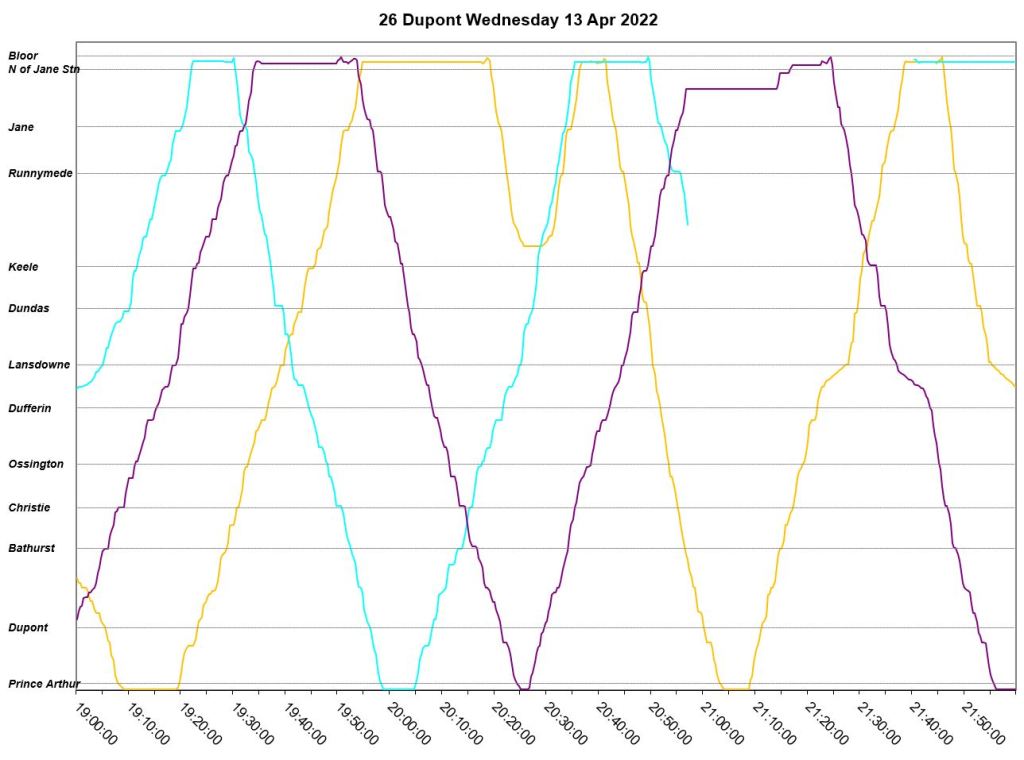
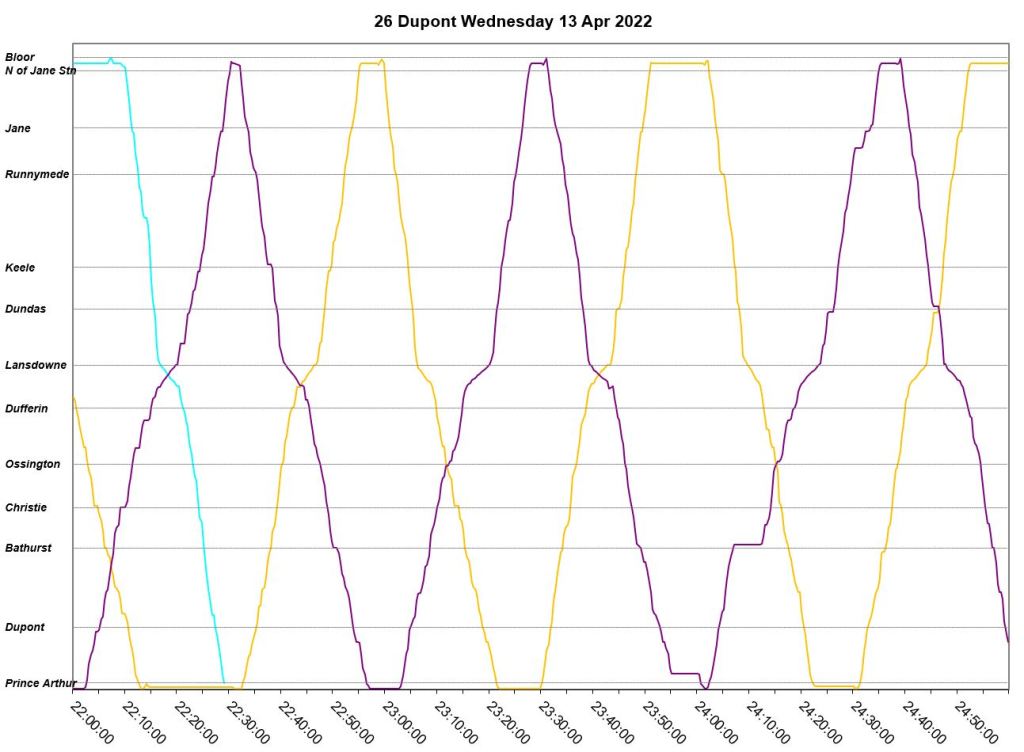
Wednesday, April 13
On April 13 there was a fire at Jane Station causing all service to be diverted for about two hours. Buses turned back at various locations.
Through the day there were other problems including:
- The first bus east from Jane Station after the fire is “Pink”, but t makes only a partial trip.
- “Dark blue” vanishes eastbound at Ossington at about 11am and does not reappear until 1:10pm westbound from St. George. It disappears for good after leaving Jane Station, but is replaced by “Mauve”.
- By the PM peak, there is a large gap after “Yellow” compounded by “Turquoise” taking a long break after 6pm, and “Mauve” short turning at Keele/Dundas at 5:40pm.
- Both “Yellow” and “Turquiose” take short turns eastbound between 8 and 9pm, and “Turquoise” does not re-enter service until 10:15pm for its final half trip.


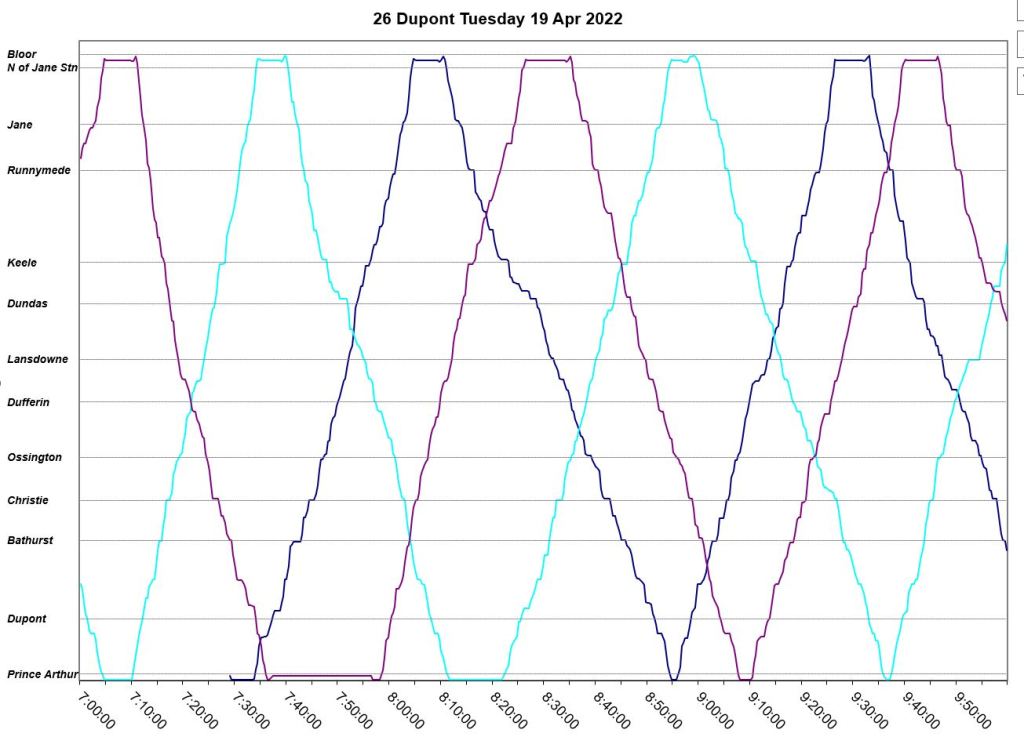
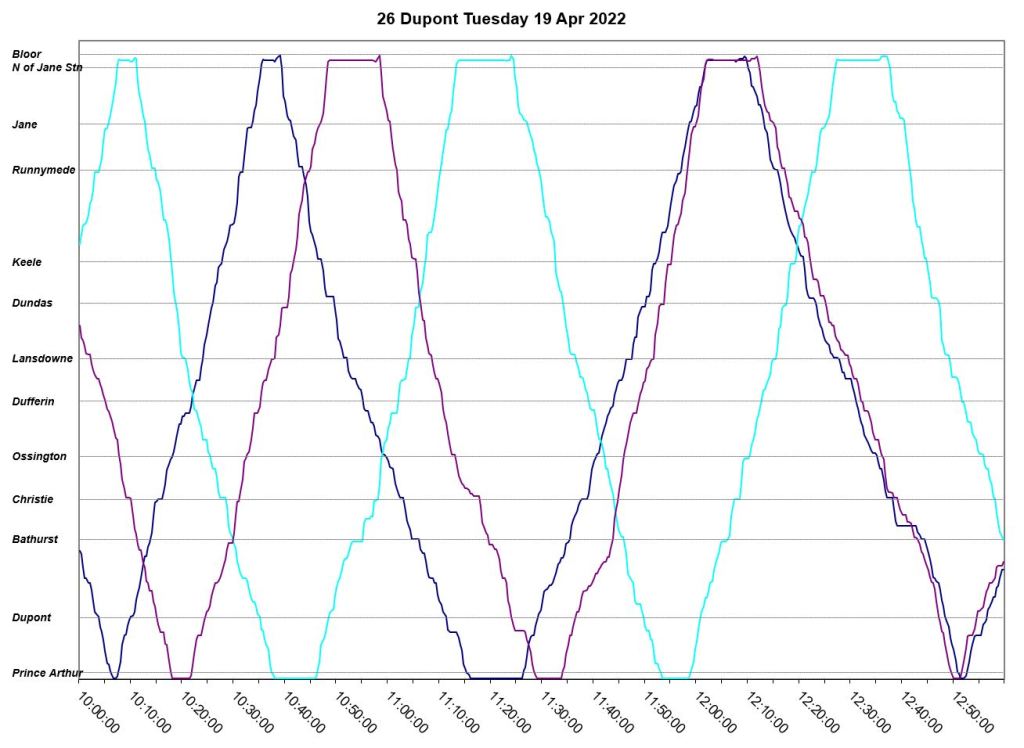
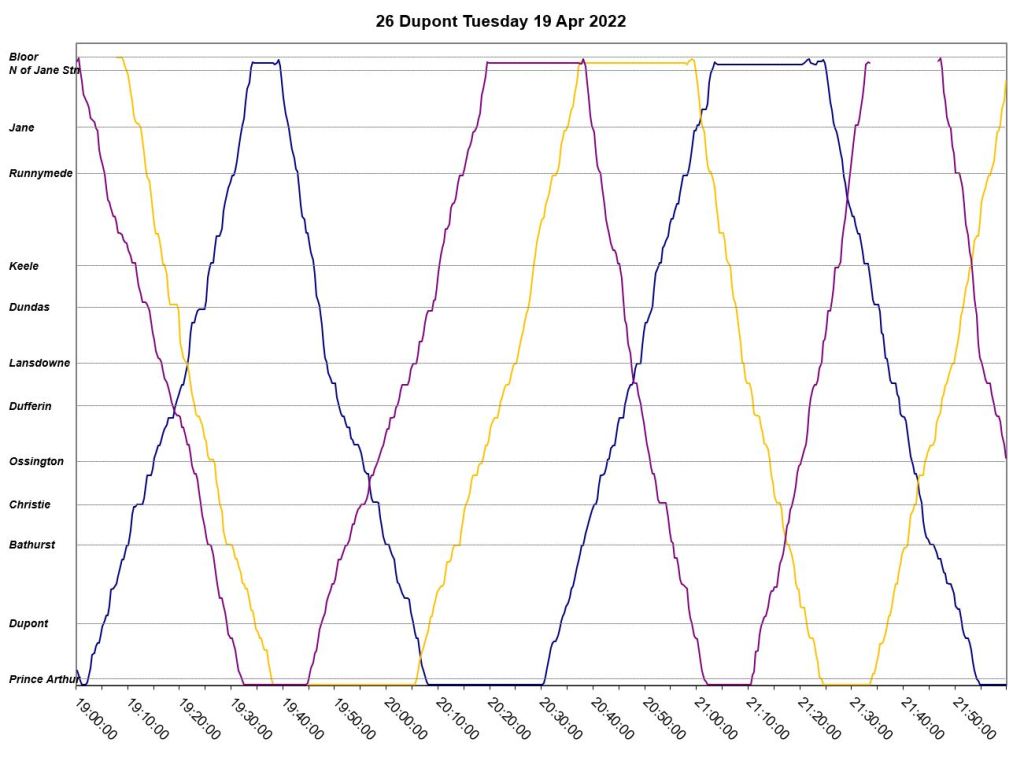
Tuesday, April 19
April 19 was not a good day. By 11:30am, two buses are running as a pair (“Blue” and “Mauve”). “Pink” joins the parade eastbound from Jane Station at about 1:30, and “Blue” short turns at Lansdowne. “Pink” is probably an extra, and it appears and disappears on the route.
Service is not running evenly until about 8pm.


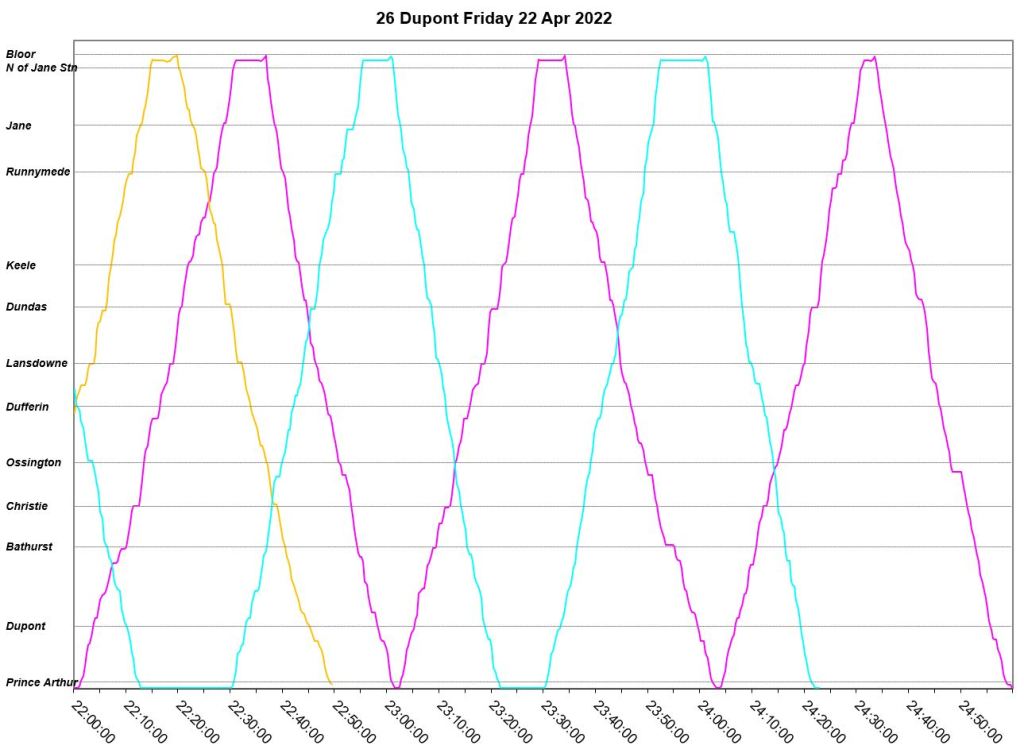
Friday, April 22
On April 22, an extra (“Blue”) joins the route for one round trip roughly between 10 and 11am, then disappears. This allows “Turquoise” to short turn eastbound at Christie.
“Yellow” becomes late through the afternoon, and short turns westbound at Lansdowne. Even after this, the spacing of buses is uneven. This is complicated by severe traffic congestion between Dufferin and Keele westbound through the PM peak. During that peak, the only buses from St. George Station leave at 4:10, 4:55, 5:42 and 6:39.


Consistently been one of the worst bus routes in the city that I use. Once waited almost a full hour during a snowstorm for the bus (at a stop without a shelter), even though I arrived 5 mins before it was scheduled/before their next bus arrival system indicated. With all of the new density between Symington and Davenport, it’s time for a re-think of how service is provided on this stretch.
I have thought one decent solution could be to split up the service: a most frequent branch (10 min headway?) that runs primarily on Dupont between Rosedale station and Ossington stations, a more frequent branch (20-min headway?) that runs primarily on Annette/Dupont between Jane station and Ossington station, and a less frequent branch (30-min headway?) that runs across the full stretch of Annette/Dupont.
LikeLike
Why do the 26 runs not have any layover scheduled at all? Example from TransSee. It’s no wonder why they can’t stay on time starting in the PM peak, Dupont comes to a crawl yet the running time is still the same as midday. And with no layover scheduled, of course the delays will snowball. I regularly noticed all 3 buses in the PM peak be 20-40 min behind. However, it wasn’t always like this, I remember in fall 2021, the headways were 30 min instead of 24 now because there were layovers scheduled. Despite the lower frequency, buses ran much much more reliably.
Steve: There are several routes where the TTC has adjusted travel times sometimes to good effect, sometimes not. When it’s a route with only three buses, mistakes can be disastrous, and this should have been corrected long ago.
LikeLike
I used to live near Annette Street, and used the 4 ANNETTE trolley bus. It was much more frequent. Frequent enough for me to use as an alternative route if there was a problem on the Bloor-Danforth Subway line. It required 7 buses to provide 10 minute headways.
It went downhill with the conversion to compressed natural gas buses (CNG), for a short time, and then diesel buses. It became worse with the Mike Harris downloading of services to the city, and the cutting back in service subsidies. Rob Ford was no help, either.
Still go to Annette Street sometimes, from Jane Street. However, when I see that I have to wait 20, 30, or 40 minutes for the next bus, I’m walking. Occasionally, the transit app shows a bus coming in 2 minutes, but (no surprise) none comes.
Steve: A problem with predictions at stops near a terminal is that they can be based on a scheduled departure that never happens. It is a very frustrating “feature”.
LikeLiked by 1 person
How could this be? Across the bus system the TTC CEO’s report purports roughly 5.5 short turns daily for April 2022 and 4 short turns daily for March 2022 and some how this tiny insignificant route can claim 2 or 3 short turns on any given day?
Steve: Let us say that the CEO is very badly misinformed. He has been in that position long enough that either he really does not know his own system, or he is deliberately misleading the TTC Board and public so that he can get a gold star for accomplishments he did not achieve.
LikeLike
This route has a problem at Huron St. For the thirty years I lived here there was a bus stop indicator on the north side of Dupont adjacent to the LCBO parking lot. That’s where you were dropped off and picked up for the Huron stop going westbound. During the pandemic there was some road work and the sign was removed and never replaced. When you’re going westbound Huron St is still indicated as the next stop; it’s still listed on all schedules as being extant and the Huron stop on the south side of Dupont going eastbound is still clearly visible. Getting the bus to stop at Huron when I’m on it isn’t the problem. The stop is called; I ring the bell and each driver seems to have a different spot to drop you off or will just ask you where you want to be let off. The problem is getting picked up. You’re basically reduced to standing on the street waving your arms trying to get a drivers attention. Drivers tell me that to be sure of being picked up I should go to the previous stop or the next one. I’m elderly and in poor health and that is easier said than done. Last winter I called the TTC about this and after about 6 weeks a temporary sign was put up but it only lasted a little while. I phoned again last week so maybe something will be done but this has been going on about a year so I’m not very hopeful. Thanks for letting me vent.
Steve: You’re welcome. It is details like this that over and over annoy would-be riders.
LikeLike
Yep, the glory days of Dupont service was covered by trolleybus with a connection to streetcar at Christie. After that, a decade or two of good service by trolley bus, and then, pbbbbpt.
LikeLiked by 1 person
You know I alluded to it on a previous post but I think there’s something to it.
Placing a streetcar running behind schedule into deadhead mode from the terminal and racing to the midpoint or beyond looks like a management practice invented only to game the CEO’s benchmark metrics. At best the customer effect is neutral but it can often end up being worse if a car ends up providing no service as opposed to a partial service.
Similarly I remember your analysis of the Pape route and its interlined service between the A and B branches. It showed buses running behind simply sitting at one of the terminals and skipping entire trips. A bus that might have otherwise provided a short turned partial service ended up providing zero service. That looks exactly like another way of gaming the CEO metrics.
In any event nobody should believe the rosy BS coming out of Leary’s office when it comes to the elimination of short turns.
LikeLike
Thanks Steve for your dogged work to document and prove lapses in TTC service which mistreat passengers yet are not even acknowledged by the TTC. We all understand unpredictable traffic conditions will affect service but the TTC does not manage timely release of buses from terminals nor document operator misbehaviour. There is much wasted money on ineffective route management personnel and sophisticated tracking assets.
The TTC board is failing the interest of passengers.
LikeLiked by 1 person
All the redevelopment of the industrial areas results it a lot of general traffic delays. Curb lanes are occupied by trucks or scaffolds, and construction workers stop all traffic to allow cement mixers or dump trucks in an out of the sites.
While that’s new, the bottleneck at Dupont/Annette/Dundas has been like that for years.
Dupont can be a fine trip at 6 AM, but during the day, it’s frustratingly slow. Davenport is a much better alternative. Unfortunately, that’s not an alternative for transit riders.
Steve: Looking at the details, there are some days when delays that are likely construction related are quite visible, but in many cases there is no visible congestion point, just slower travel times. Basically the schedule is too tight and everything falls apart when ops cannot make the running time. Often there is no visible effect of line management to sort this out. With only three vehicles on the route and very wide scheduled headways, there is no wiggle-room for dealing with delays.
LikeLike
I drive this route and I speak for all the drivers on this route.
26 DuPont is very vulnerable to traffic congestion. From Dundas St until Davenport Road. The on-street parking must be removed and the construction near Christie street needs to stop hogging the curb lane in both directions.
It takes 45-55 minutes each way during peak hours, middays and weekends in which the TTC has failed to account for hence why buses are all over the place. Maybe during early morning hours like 5am, it takes 25 mins to make each trip. Heck the drivers don’t even have time to stop for bathroom breaks.
Steve: Yes, this is a route where the schedules are clearly out of whack with actual on street conditions, but nothing is done about it and riders suffer from terrible service. That said, there is no excuse for buses that are supposed to be 20 minutes apart making round trips as if they were coupled to each other.
LikeLiked by 1 person