
This article continues and enlarges on information in TTC 2023 Annual Service Plan Preview with additional material from a report on the July TTC Board agenda Advancing the 5-Year Service Plan (2024-2028) & 10-Year Outlook Reset. That is a long report with several components, and I have pulled chunks of it out as they relate directly to information in the earlier article.
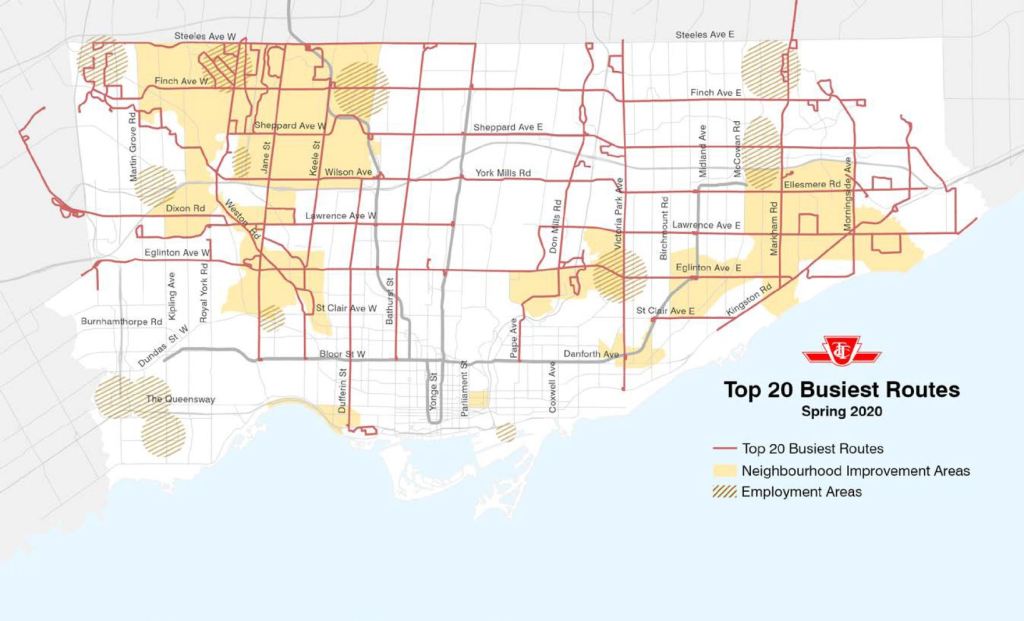
Of particular interest in the restoration of service to the transit network is the fact that recovery has been underway in some locations and times much more strongly than others. This corresponds to the difference in areas where work or study-from-home replaced commuting to an office or school. Maps in the previous article showed the top and bottom 20 routes for ridership relative to pre-pandemic levels in Spring 2020 (the point of lowest ridership) and in Fall 2021. For convenience, they are repeated here.


These ranking are by percentage of pre-pandemic ridership with no reference to absolute numbers. The busiest routes by ridership are shown in the maps below. This presentation inevitably displays the long routes which have a large number of boardings. Short routes like 65 Parliament may have recovered a large proportion of their demand, but the base number is necessarily small because of their smaller service territory.

This shows the danger of looking at absolute numbers out of a context such as riders per route kilometre (in effect, the density of demand), not to mention possible variations in the level of demand and boarding patterns along a long route.
Continue reading