
The real estate industry, their acolytes and even the affordable housing advocates went into meltdown when the 2022 update to the Development Charges landed at Toronto’s Executive Committee. This proposal was approved recently by City Council, but with a few carve outs such as exempting certain types of housing (up to 4 dwellings on a lot) from these charges.
The main trigger for the uproar was that the new DCs are much higher than those they replaced. With transit being the primary driver of this increase, it is worth understanding how DCs work and what the new charges will and won’t fund.
First, a comparison of the base data for the 2018 and 2022 reports. The tables below are in almost the same format making comparison easy.
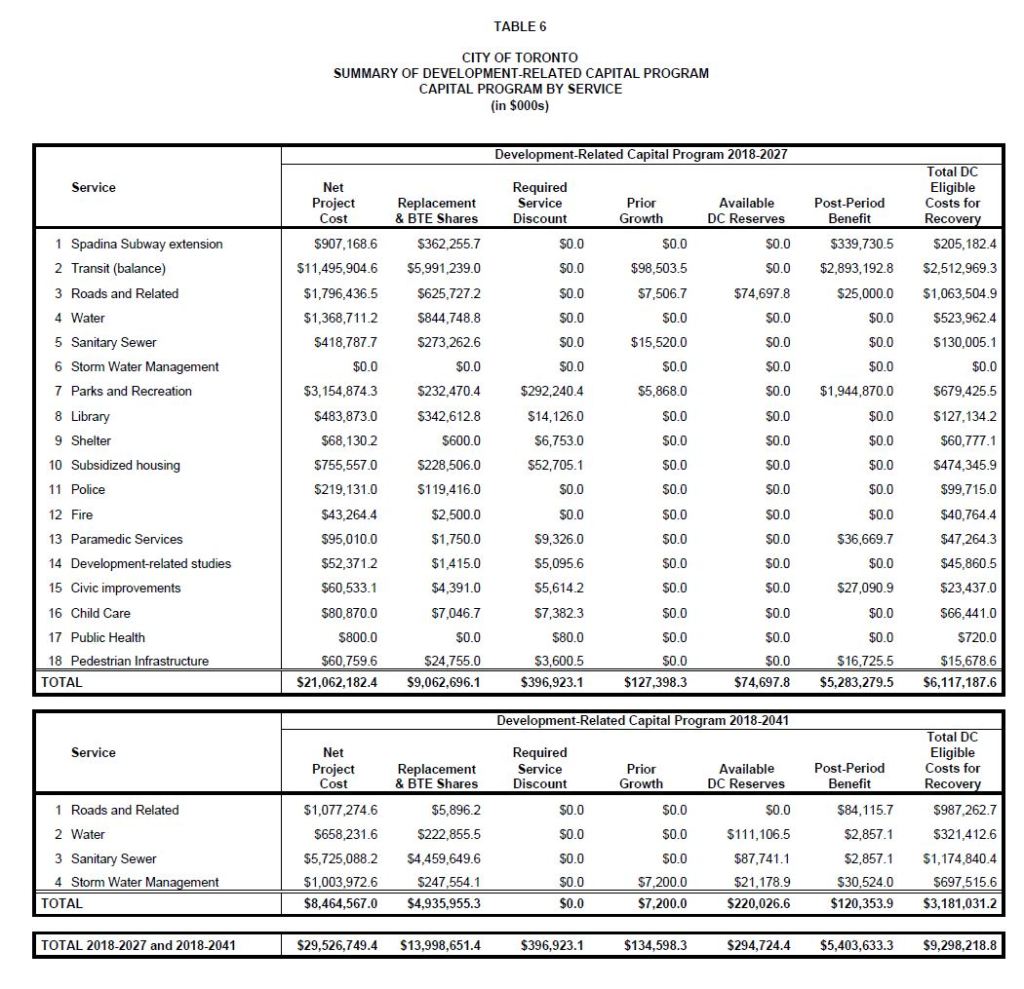
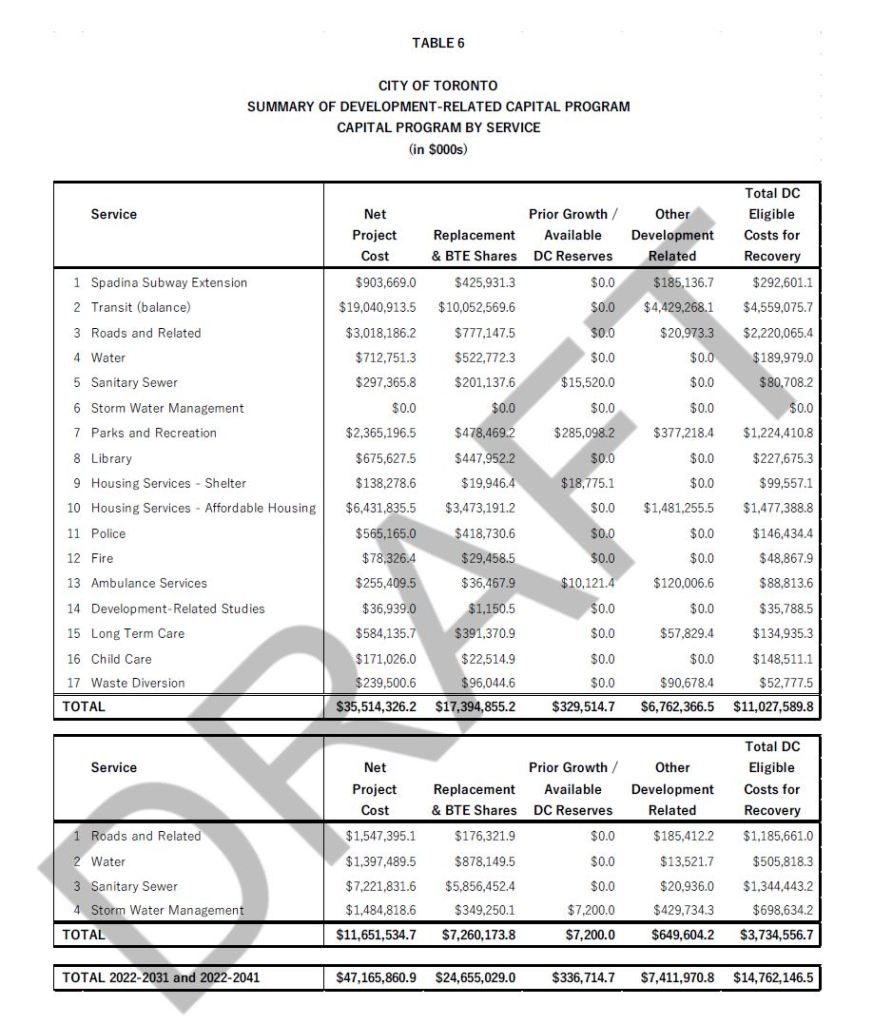
The important column is on the right end of both charts “Total DC Eligible Costs for Recovery”. The total in 2018 was $9.3 billion while in 2022 it is $14.7 billion.
Yes, we are still paying for the Spadina Subway which gets its very own line in the table, and the Sheppard line shows up in the details under “Transit (Balance)”. Large increases lie in:
- Transit, about $2 billion
- Roads, about $1.2 billion
- Housing Services, about $1 billion
- Parks & Recreation, about $550 million
Some lines go up by a lot proportionately, but the dollar amount is comparatively low. For example, Pedestrian Infrastructure went from $15.7 million to $52.8 million, over triple, but the actual dollars pale by comparison with transit.
A major difference between 2018 and 2022 is the proportion of total costs recovered from subsidies and contributions from other parties.
In the 2018 DC calculation a grand total of $43.5 billion gross was reduced by $14.1 billion to a net value of $29.4 billion.
In the 2022 DC calculation, a grand total of $66.9 billion gross is reduced by $19.8 billion to a net value of $47.2 billion.
The increase in gross figures, 54 percent, is much higher than the increase in recoveries through subsidies and other revenue, 40 percent. This causes a disproportionate growth in the net of 61 percent.
Where Do Those Numbers Come From?
The background study that recommends new Development Charges starts with a list of every capital project in the City. The TTC has the biggest capital budget, even with some major projects taken over by the province, and it therefore generates the biggest part of the DC tithe.
For each project some costs are included and others are excluded. The headings on the charts above show the breakdown:
- Net Project Cost: The cost of the project borne by the City after deducting provincial and federal subsidies and contributions by others (for example, York Region’s contribution to the Spadina Subway). (The gross costs for those who are interested are in the detailed tables.)
- Replacement: Costs to replace existing infrastructure (such as new buses that replace old ones) are not eligible for DCs because this cost does not address growth, only worn out assets.
- Benefit to Existing (BTE) Share: Demand that would rise if the improvements were already in place determines the portion of the benefit that is not due to new development.
- DC Reserves: Some groups of projects did not manage to spend all of the money collected for them, and this sits in a carry over reserve offsetting new charges.
- Other Development Related: Some costs are deferred to future rounds of DCs as reflecting the value of a project like a new subway line well beyond the five year cycle of DC updates.
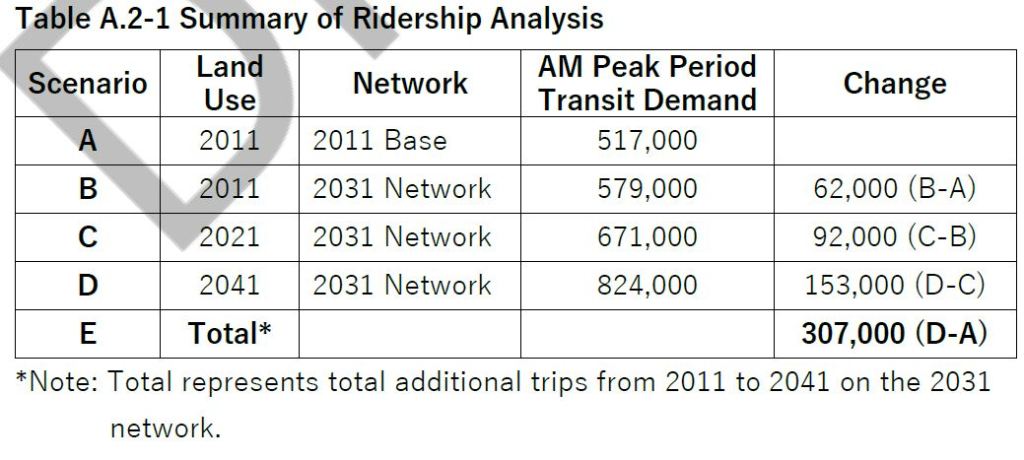
The BTE share is calculated from existing and projected ridership (see below).
Looking at the 2022 chart above, of the $47.2 billion in net project costs, only $14.8 billion will be recovered in the current period from DCs. (The gross cost, by the way, is $66.9 billion.) This does not include provincial projects like the Ontario Line and Scarborough Subway which are no longer on the TTC’s books. It also does not include much of the Green Bus plan because that is mostly replacing existing buses, not adding to the fleet for ridership growth.
Ridership Growth and Allocation of Charges
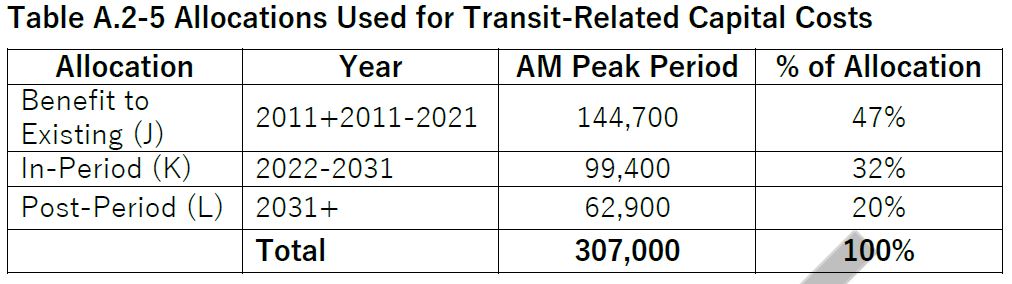
The portion eligible for inclusion in the DC charges is, for most transit items, set at 47 per cent of the net cost. This formula is derived by estimating the proportion of system expansion that is driven by population and employment growth as opposed to being a benefit to existing riders.
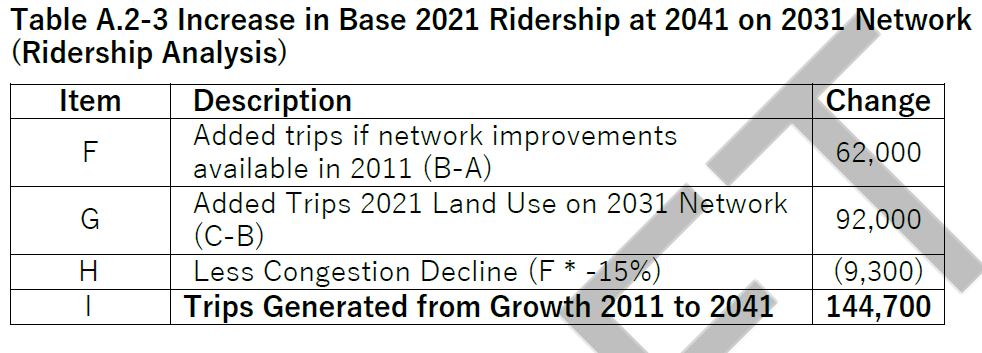
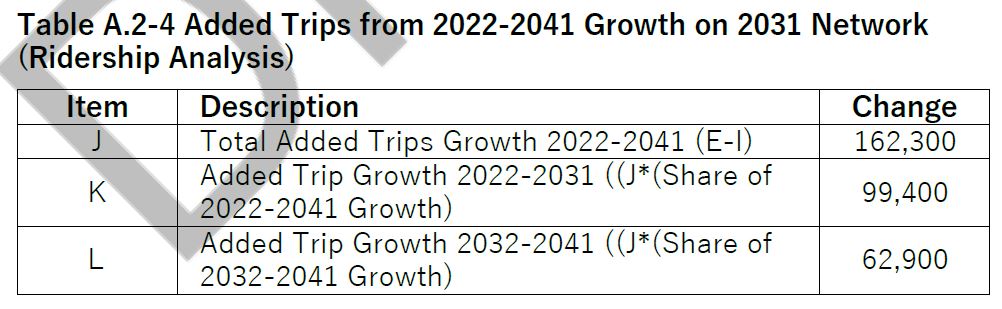
First, the ridership change that would have occurred if the planned network were already in place is calculated. This 144,700 AM peak trips are considered as a benefit to existing riders and developments, and therefore are not due to new developments for the period of the 2022 DC bylaw.
Second, the projected growth to 2041 based on the existence of the 2031 network is subdivided by decade. This results in 47 per cent of projected ridership growth being classed as a “benefit to existing”, 32 per cent as the growth in the decade that the bylaw covers, and 20 per cent beyond 2031. Unless there are special considerations for a project, that is how the net cost will be divided. For example, a $100 million project (net) would be divided $47 million as BTE, $32 million to current period DCs, and $20 million to future. (There is $1 million left over due to rounding, but the principle is evident.)
It is simpler to use one factor across all projects rather than trying to drill down individually. Only a few use a different factor because they clearly are much more about growth (more subway trains) or are only replacements.
Based on projected residential and commercial/industrial growth, the total DC charge, with a few adjustments, is divvied between residential units and commercial space. 67 percent goes to residential in the current allocation, with 33 percent to commercial, because much more residential growth is projected.
Looking at the Transit Details
Where does all that projected transit spending come from? The list is many pages long, and for simplicity I have boiled it down to consolidate related projects, and keep the minor items at a summary level.
Here are the high rollers sorted in descending order by their contribution to the DC total. Only items of $100 million or more are included. Note that these figures are consolidated from the city’s DC study as shown in a spreadsheet linked later in the article. Refer to that spreadsheet if you are attempting to cross-check the city report to the values shown here.
Several points worth noting:
- This list includes some projects that remain at the “gleam in the eye” stage and are not yet fully funded or approved beyond preliminary planning and design. Notable among these is the Egliniton East LRT, the Waterfront LRT extensions East and West, some of the Transit Priority projects, and some future maintenance facilities for subway.
- Although the TTC has a new bus garage in its project list, construction is not planned until 2029 or later. Therefore, most of its cost is charged to years beyond the span of the 2022 DC Bylaw.
- The TTC has a large program for replacement of its bus fleet and conversion to electric operation. However, most of the associated costs are for replacement vehicles and they do not count against the DC calculation.
Although DCs will eventually provide the money to finance part of these projects, in the absence of new subsidies, the City will have to eke out financing mostly on its own. There is a gas tax revenue stream from both the federal and provincial governments, but this amounts to only about $360 million annually, of which about $90 million is dedicated to the operating budget with the remainder going to capital. Over the course of 10 years, at current rates, this would generate about $2.5 billion.
| Project or Group | Gross Costs ($m) | Eligible for DCs 2022-2031 ($m) |
| Eglinton East LRT | $4,400.0 | $997.3 |
| Subway Capacity Enhancement | $2,583.3 | $838.3 |
| Waterfront West LRT | $1,243.0 | $401.9 |
| Spadina Subway Extension | $3,184.2 | $292.6 |
| SmartTrack | $1,359.2 | $265.4 |
| Subway Signal Systems | $826.3 | $253.3 |
| Subway Maintenance Facilities | $3,357.9 | $326.0 |
| Waterfront East LRT | $1,249.7 | $247.0 |
| Purchase of Buses (incl WT) | $207.7 | $207.7 |
| Subway Cars – Growth | $498.4 | $161.4 |
| Streetcar Infrastructure & Vehicles | $771.9 | $133.0 |
| Union Station Expansion | $750.8 | $127.0 |
| Transit Priority | $379.8 | $123.1 |
| Bloor-Yonge Station | $1,332.3 | $107.6 |
| Bus Equipment | $758.2 | $104.9 |
The amounts actually used for DC charges are adjusted to take into account existing reserves carried over from previous years, where applicable, but this does not change the basic calculation, nor the fact that part of the increase is due to the decline in external subsidies.
The detailed list is shown in the spreadsheet linked below. Note that the project order and groupings have been changed compared to the table in the DC Bylaw Report. TTC project numbering is linked to the owning major branch within the organization so that, for example, vehicle costs are in a separate category from the infrastructure needed to house and maintain them.
Many projects are in a separate “other” group in the report because they are not yet funded and approved by Council. However, for the purpose of DC calculations, they are included, and I have consolidated these lines with the approved projects.
The dates shown for each project are from the report and do not match current plans. They were estimated dates at the point, some time ago, when the TTC passed the project list to the team working on the DC calculations.
Source documents:

Maybe I missed the reasoning behind this, but why are projects which are already completed on this? Is it that we have not completely paid those expenses off yet, or is it just an artifact carried over from old data? Specifically looking at Union Station expansion and Spadina Extension.
Steve: The amortization period for some projects is more than 10 years, and so some costs are charged over multiple iterations of the DC calculation.
LikeLike
Thanks Steve. The cost of cement/concrete is going up, likely making most ‘estimates’ off, even if they’re not pre-fudged.
We also are happily ignoring the carbon impacts of all the concrete usage failing to include it in either our ghg profile or in EAs but like mere millions, what are mere molecules?
And if the devilopment doesn’t happen, for a set of reasons – will property taxes have to be raised? And wouldn’t it make more sense to have a Vehicle Registration Tax of say $500 a vehicle, allowable as it stands within the current City of Toronto Act, but likely the Pre-mayor would have some interest in ensuring not even a tenth of that happens, because, carservative auto-crats rule us.
LikeLike
I am glad that the EELRT is getting priority over the Waterfront LRT. I don’t see Waterfront LRT (east or west) getting built anytime soon. Neither the municipal nor the provincial government can afford to pay for the same. The only way Waterfront LRT (east or west) might get built is if Trudeau shells out money for it. But with the Trudeau-Singh coalition commanding a solid majority, there is no risk of an election anytime soon which means that Trudeau is unlikely to shell out any money for it.
Steve: Actually, the Waterfront East LRT is lot cheaper to build that EELRT, particularly now that the line has been extended beyond UTSC. There are also a lot of property developers in the waterfront who are jumping up and down wondering where their LRT network is considering how much in development charges their projects have contributed to funding for a line that isn’t getting built.
LikeLike
My friend Hamish wrote:
This is one thing that continues to amaze me. In spite of all the bovine effluent that gets emitted about carbon impacts, we are still not trying to get some measurement or estimate of the carbon impacts of proposed projects. Even projects such as the electric bus project which will have a very beneficial effect in terms of reducing carbon and, more importantly, reducing cancer-causing fine particles.
As a professional Accountant, one of my proverbs is “Management is measurement.” In other words, it is impossible to manage something or to set goals and try to meet them if we are not measuring whatever it is. Of course, the problem with actually measuring something is that inconvenient and politically incorrect truths may emerge. Requiring politicians to deal with reality as it actually is, rather than the way that they wish it would be.
LikeLike