
This article continues a review of what the TTC aims for, at least on paper, in service quality, and how their success (or lack of it) in providing good service is reported for public and political consumption. The framework for this commentary is the CEO’s Report, using the August 2022 version as a reference point.
I deliberately broke this discussion into two parts. The first looked at the various figures related to system performance are presented and how they reveal or hide critical information.
See: Service Standards, Metrics and the CEO’s Report (I)
The TTC Board is notoriously unwilling to get into the weeds on system statistics, operations and finances. Superficial analyses in the CEO report give them nice pictures and charts to look at, but that is not the same as a discussion of key issues and future risk. This is vital in any planning for recovery from a pandemic that will continue to affect the TTC in 2023 and beyond. There is a separate detailed quarterly report that reviews finances and the state of major capital projects, but it does not address many issues notably the cost and capability for growth as ridership returns to the system.
While it may suit those who run the TTC and the City to keep this discussion under wraps, that cannot be done for long as the 2023 budgets will be upon us immediately after the coming municipal election. There is a lot of great talk about the importance of transit, but this does not translate into real understanding and support beyond a few very large construction projects. (That statement applies equally to Metrolinx and GO, but my focus here is on the TTC.)
Key points:
- Although fare revenue recovery is reported, this is not matched against cost growth. Fares have been frozen through the pandemic. Even at recovery to 100 percent of pre-pandemic ridership, the proportion of costs borne by fares will have fallen and the need for subsidy will be higher. “Full service” will cost more in 2023 than it did in 2020, even without the added cost of improving beyond historic levels.
- Ridership recovery takes place at a different rate on different routes and modes, not to mention time-of-day.
- Underutilized fleets provide a reserve for service improvements, provided there are drivers for the vehicles, up to the point where the need for spare buses and streetcars limits service growth. After that point, growth hits a knee in the cost curve as new capital assets must be acquired.
- Asset reliability is reported as the proportion of scheduled service actually operated, but with no sense of how much reserve exists in the fleet.
- Fleet reliability is reported in a way that prevents direct comparison between segments, notably various types of buses. Although there is a target for reliability, the degree to which this is exceeded (in effect the headroom for better utilization) is not reported.
- Service reliability and quality are reported on broad averages across routes and days, with no indication of the variation across the system. Purported “on time” metrics do not reveal actual rider experience.
- There is no report of:
- the amount of scheduled service that does not operate because no driver is available;
- the utilization and effectiveness of Run-As-Directed buses;
- the amount of bunching and gaps as a proportion of service operated;
- routes with demand, service levels, crowding and headway reliability issues.
This review does not look at the WheelTrans system and accessibility in general because it has a raft of issues of its own on matters such as adequacy of service, dispatching, the online booking interface, qualification for service and the TTC’s attempt to shift riders at least partly onto the “conventional” system through the “Family of Services” program. An important issue for WheelTrans overall is that it is entirely funded by the City of Toronto with no assistance from other governments. This makes it particularly vulnerable to penny-pinching efforts by those who guard our “precious tax dollars”.
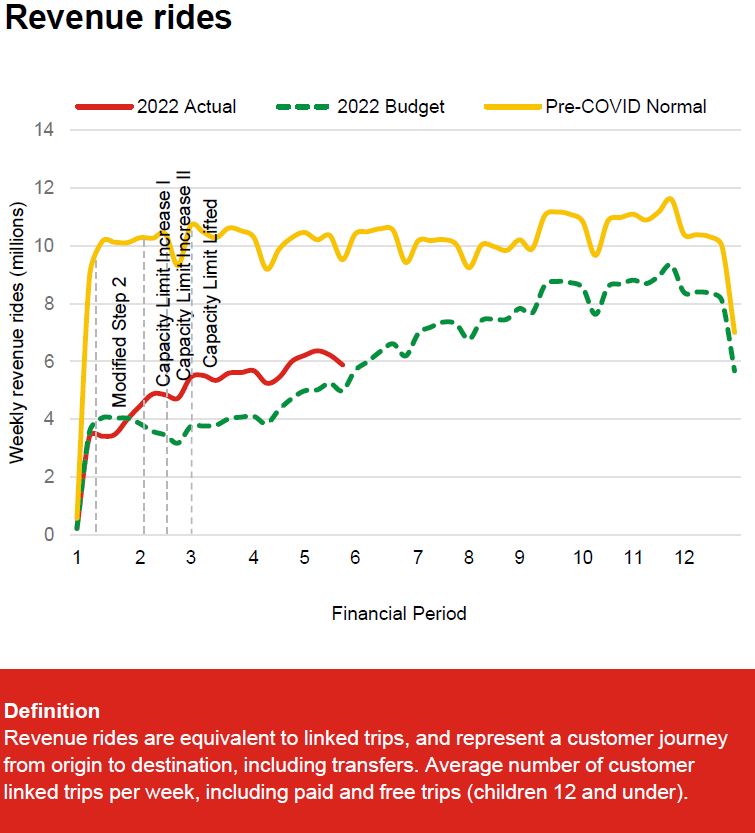
Rides and Revenue
In the pre-pandemic era, weekly ridership stood at roughly the 10 million mark with growth in the fall before a typical decline over the Christmas and New Year holidays. By June 2022, actual riding was running ahead of budget, but the lines (red and green on the left below) were converging. If the TTC actually attains its budgeted ridership in the fall, the system will be at or above 80 percent of its former level.
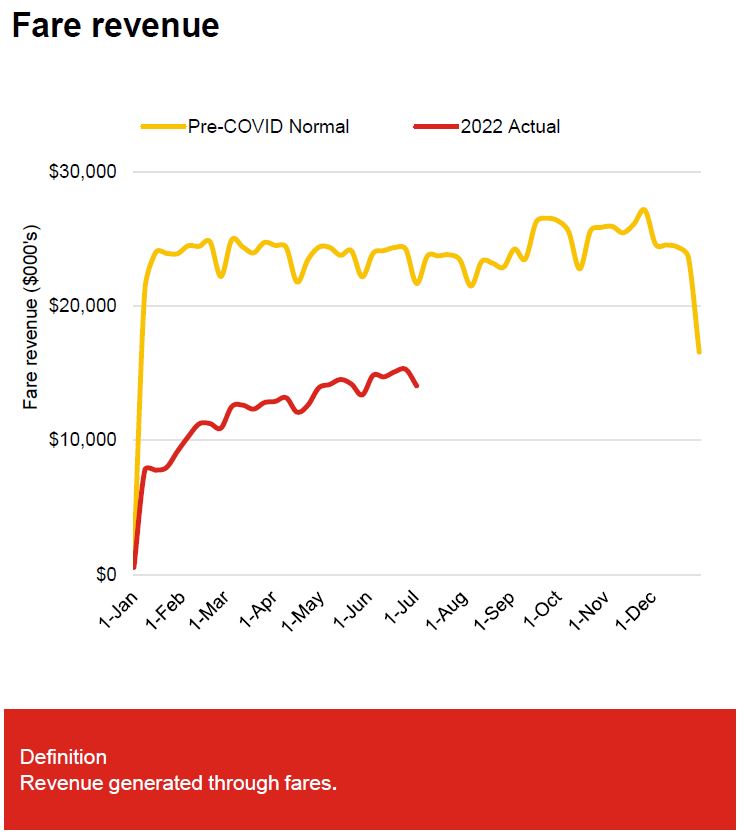
Fare revenue follows a similar pattern although the budgeted level is not included on that chart.
What is not shown is the operating cost compared to historic levels and to current revenues. The system might attain 100 percent of pre-pandemic riding in 2023, but with fares frozen for a few years, revenue will have fallen further below operating costs. This will be a significant pressure on the 2023 budget at a time special covid subsidies are withdrawn, and when new costs will appear on the TTC’s books such as operation of Line 5 Crosstown. The delay in opening that line could be a blessing in disguise at least for budgetary reasons, if not for riders.
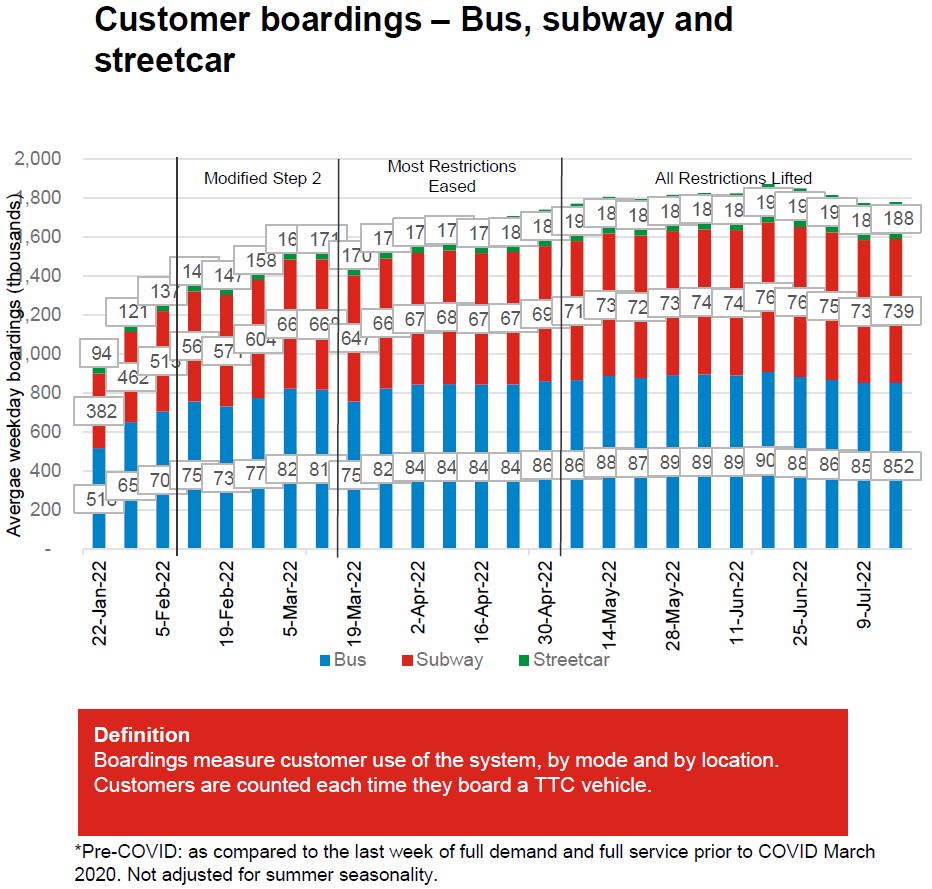
The chart of boardings by mode is useful in showing different patterns of recovery. The bus network recovered its riding faster than the rail modes because it served areas and jobs that were less affected by the work-from-home shift. By July 2022, bus ridership was over 60 percent of pre-pandemic levels while rail modes that serve the core area business district and academic institutions were in the 50s.
The lower growth rate for buses in 2022 does not reflect a slower recovery, but rather that the bus network did not fall as far and stay as low as the rail modes in 2020-21. Although figures for Fall 2022 have not yet been reported, anecdotal evidence of riding the system shows that demand growth continues and crowding has increased even with recent service improvements.
If growth continues, the bus network could exceed 100 per cent recovery in 2023. The last thing we need to hear is “we have no buses” as an excuse to constrain service improvements. Later in this article, I will review the bus fleet utilization and show the considerable headroom for growth. The real challenge will be political: increasing operating subsidies to pay for added service.
| Average Weekday Boardings (000s) | Bus | Subway | Streetcar |
| January 2020 (pre-pandemic) | 1381 | 1492 | 350 |
| January 2022 | 510 | 382 | 94 |
| July 2022 | 852 | 739 | 188 |
| January 2022 vs January 2020 | 37% | 26% | 27% |
| July 2022 vs January 2020 | 62% | 50% | 54% |
| July 2022 vs January 2022 | 167% | 193% | 200% |
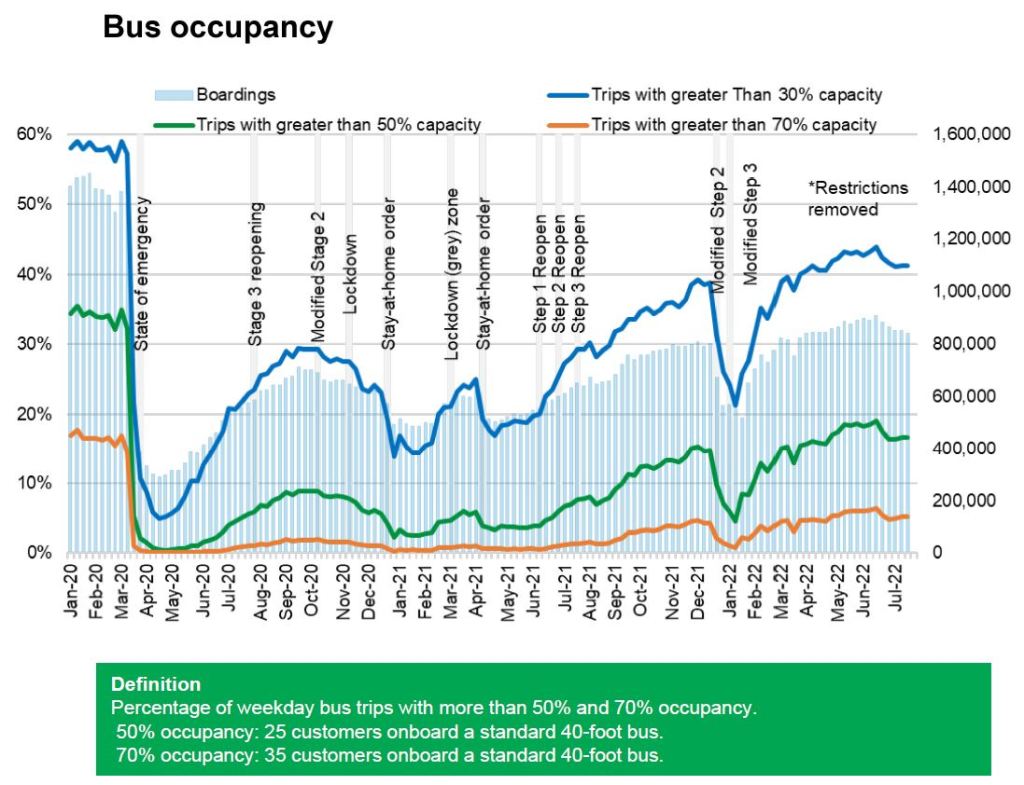
The chart of bus crowding below right shows how the proportion of trips at various crowding levels is returning to pre-pandemic levels. What this chart does not show is the distribution by route and time of day where crowding occurs. Some routes will almost never be crowded, others will be quite full. The average values do no show how promptly and successfully the TTC addresses capacity shortfalls.
Earlier in the pandemic, the TTC published “heat maps” showing the areas of strongest demand on the system. A comparable format could be used to summarize crowding data by route and time of day.
(There is no comparable chart for streetcar routes because that fleet is only now in the process of receiving automatic passenger counting equipment.)
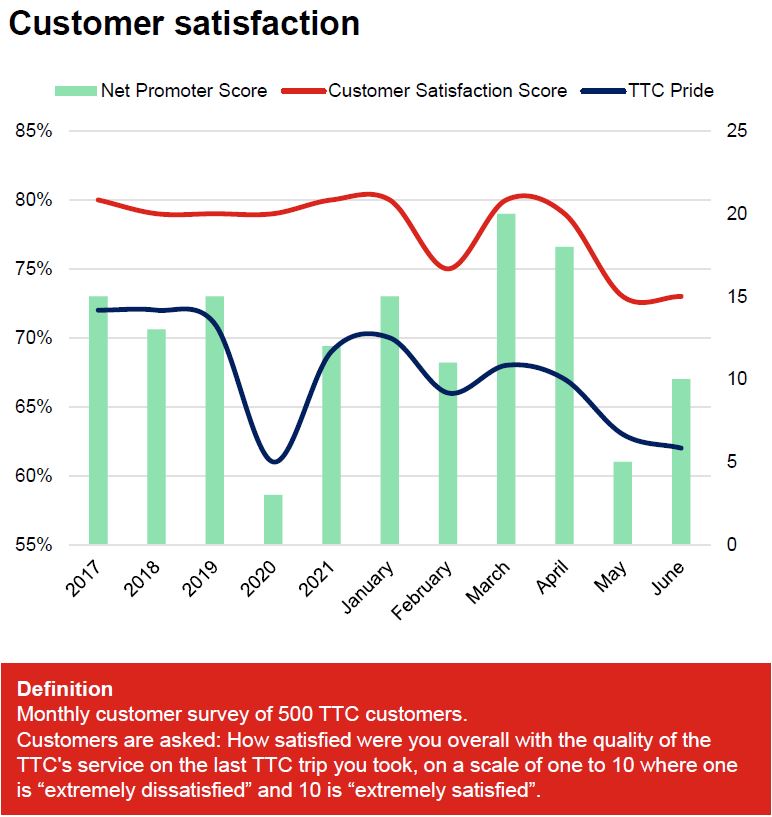
Customer Satisfaction
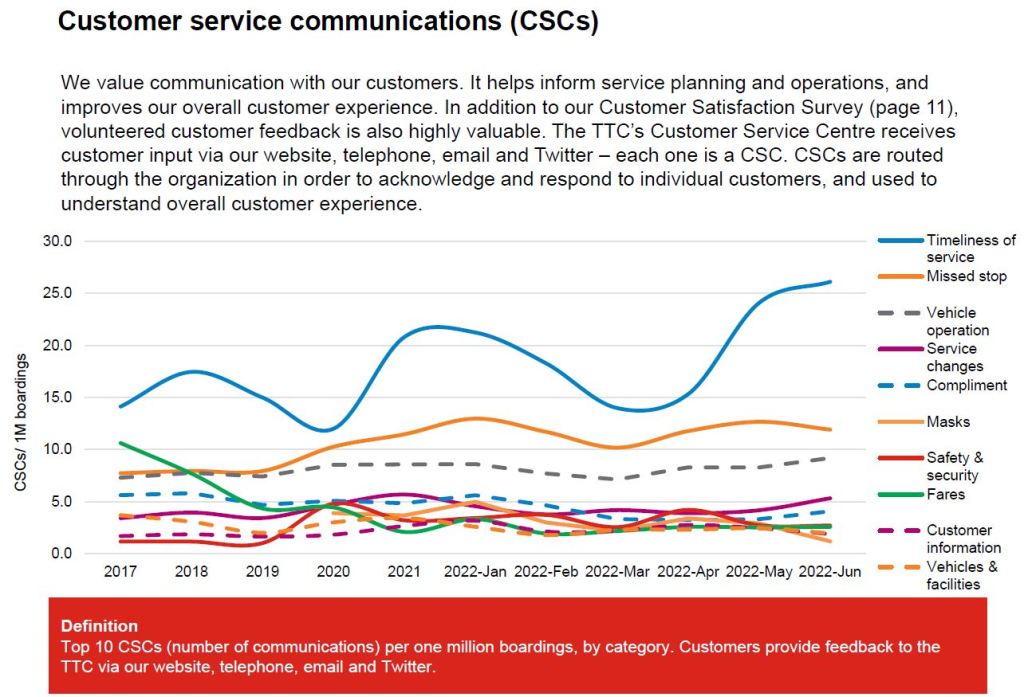
The CEO’s Report mentions crowding as an issue for riders, but not basic service levels, and there is a focus on customer security. While this should not be downplayed, it is noteworthy that service related complaints are the top four categories, and there is a clear upward trend in “Timeliness of service” as the most frequent complaint.
Readers of this site will know that service quality is an overriding concern among my articles. Bunching and gaps can produce extremely poor service, and yet there is little apparent effort by TTC management to either recognize or correct this. Many of the problems are not related to that old saw, traffic congestion, but to a combination of scheduling, operating practices, short-staffing and the desire to produce short-turn free operating stats, even to the point of fabricating them. (More about that later.)
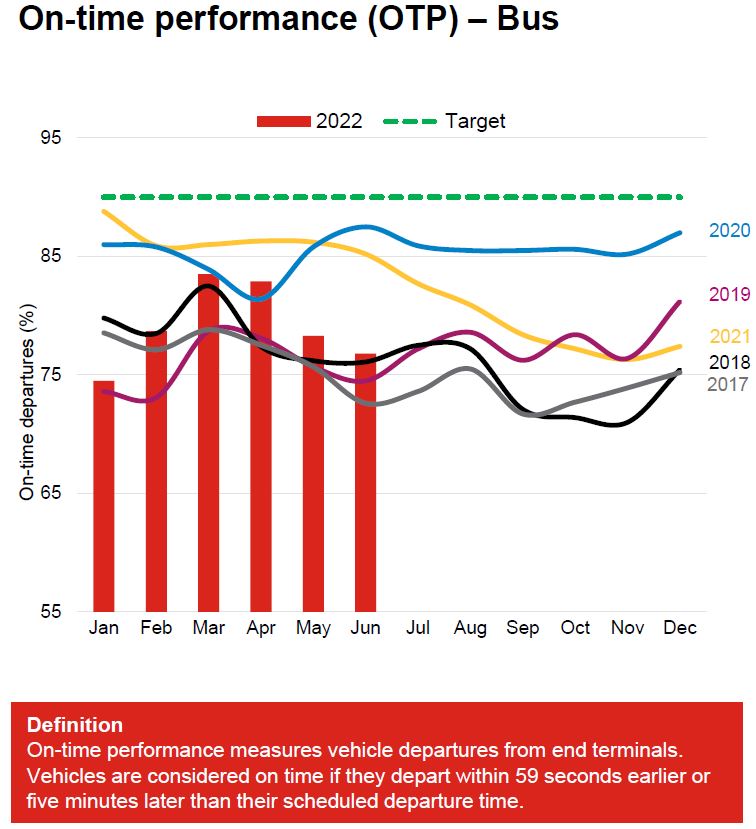
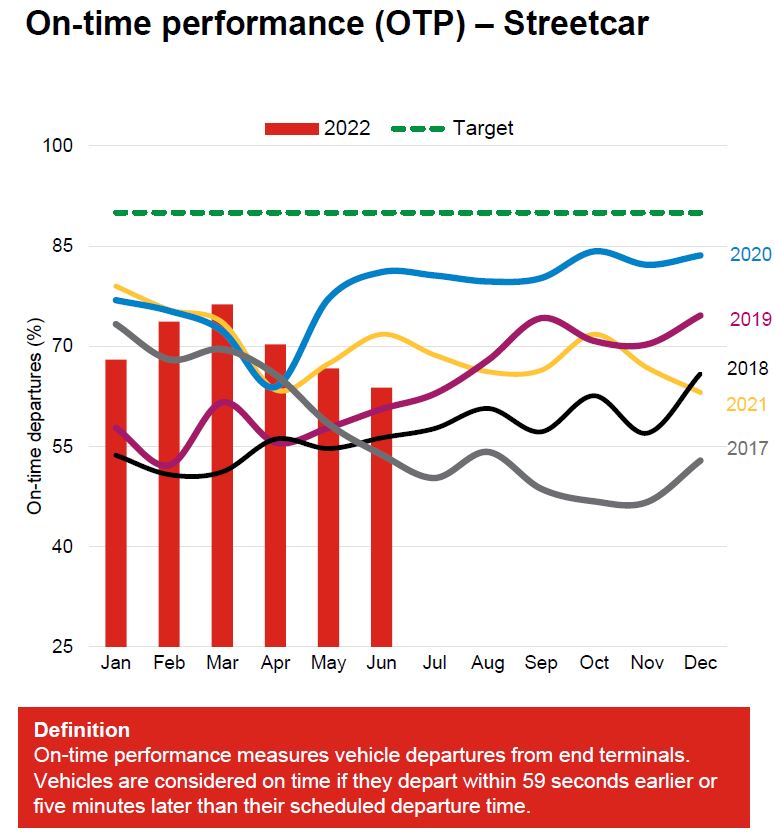
On Time Performance and Reliability
The TTC’s focus on on-time performance stems from the belief that this alone will magically correct problems. However, they have been woefully unable achieve this for several years. The definition of “on time” has sufficient latitude that erratic service can be counted as meeting TTC standards. There is no measure of service problems triggered by missing buses and streetcars as, after all, those remaining are “on time”.
A worse problem is that performance is reported on an average basis across all routes and times. This masks the situation on individual routes both for crowding and for service reliability.
To be clear, I do not expect the CEO’s Report to contain a raft of detailed reviews of routes, but this information should be readily available online so that anyone can check the stats for their service: ridership, propensity to crowding, recovery to historic levels, and service reliability at key locations along the routes.
The CEO’s Report should include exception reports of the worst routes and tracking of what will be done to remedy the problems. A happy side-effect of detailed reporting would be the ease with which exceptions exceeding criteria could be flagged. This should be an automatic process, not one that depends on rider complaints.
“Several actions to improve on-time performance are underway …”
The changes cited include :
- General:
- In September, service will be added across all modes as ridership is expected to increase. Many surface routes will have increased service, either through additional resources to improve on-time performance, new service, or improved frequency of vehicles. We are also preparing for school resuming by increasing resources on routes serving schools.
- Ongoing improvements to workforce planning aimed at decreasing cancellation hours, assessing options related to construction projects impacting routes, and a network-wide review of operator schedule adherence at end terminals.
- Streetcar:
- Adjusting streetcar workforce in order to align with planned service levels for this fall.
- Several schedules are also under review in an effort to improve network OTP.
- Infrastructure planning will be refined in 2023 with the goal of minimizing the number of bus branches required for construction-related projects to streetcar routes.
- Vehicle departure monitoring.
- Bus:
- An OTP program has been developed to approach performance improvement through a series of internal working groups. These groups will be working to improve planning and operational aspects of bus operational performance.This includes workforce analyses, schedule improvements, and Operator monitoring work as several examples of the numerous identified tasks.
The planned increase in weekly vehicle service hours in September was 3.8 per cent of which roughly half is simply a return to “winter” service levels after the summer cutbacks. Actual service has been running about five percent below budget since March 2022.
There is actually a budgeted decline in service over the remainder of 2022, although if service remains at the September level, the “actual” and “budget” values could converge. It is common for service to be constrained late in the year to hit City spending targets and reduce the call for subsidy. This is not formalized by public direction from the TTC Board, but the pattern over many years shows what happens in practice.
From the goals, it is clear that the TTC has not been able to field as many operators as it needs for the scheduled service. This shows up in many of my route analyses where missing buses are a chronic problem. This has two components:
- The effect of cancelled runs is to leave gaps in service, and in my analyses it is clear that TTC usually does not re-space vehicles to achieve even headways. This causes huge gaps on routes where the scheduled service is every 10 minutes or more.
- The extent of the problem is not reported to the Board, at least not publicly, and so the degree to which the TTC hits a target of operating all scheduled service is a mystery.
One response to the missing vehicle problem is that “Run As Directed” buses (aka RADS) are used to fill in. While this may be true in some cases, there are nowhere near enough RADs to fill all of the gaps, and moreover these buses do not show up on tracking apps causing riders to despair that service will ever appear. There is no report on the utilization and effectiveness of RAD buses.
A common response to poor on-time performance at the TTC has been to add running and/or recovery time to schedules. This can be counter productive if the typical operating speed drops in response to too-generous schedules (this is most common on streetcar routes). Conversely, excessive running time can encourage fast driving to get as much of a terminal break as possible.
Padded schedules cause vehicle bunching at terminals. Probably the most flagrant example is the 501L Queen bus at Long Branch Loop where half hour layovers are not uncommon. This is a waste of vehicles. Even with those lengthy breaks, some buses leave the terminal in pairs.
The challenge is to find a happy medium. If the TTC plans to adjust schedules, they need to also report on the result and benefit of their changes at a route level.
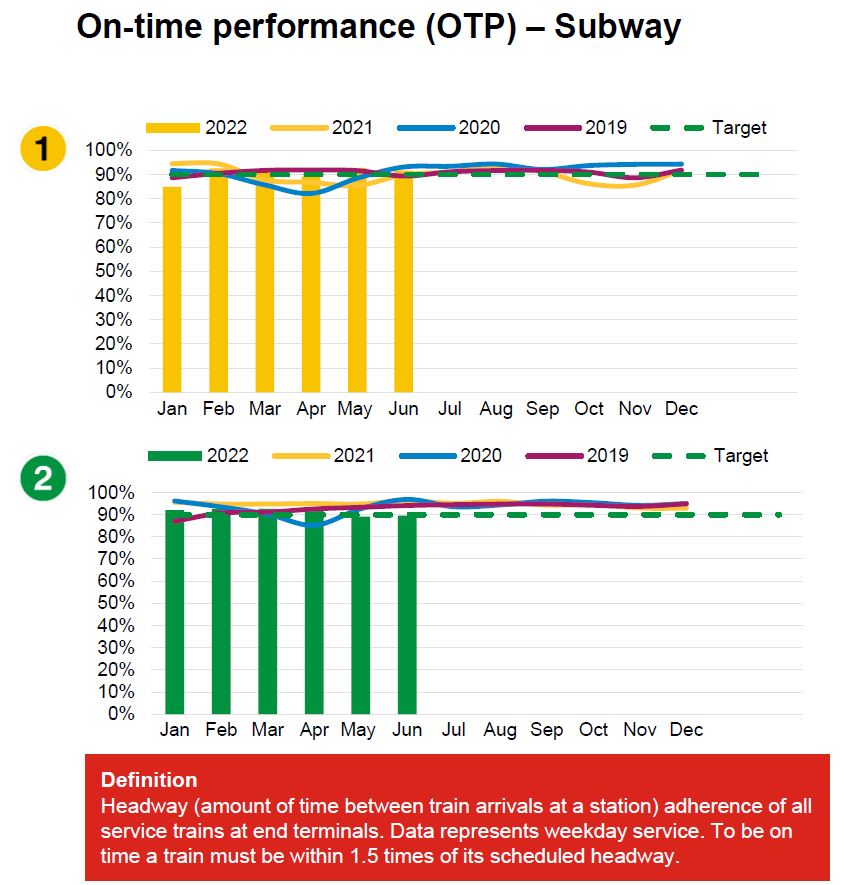
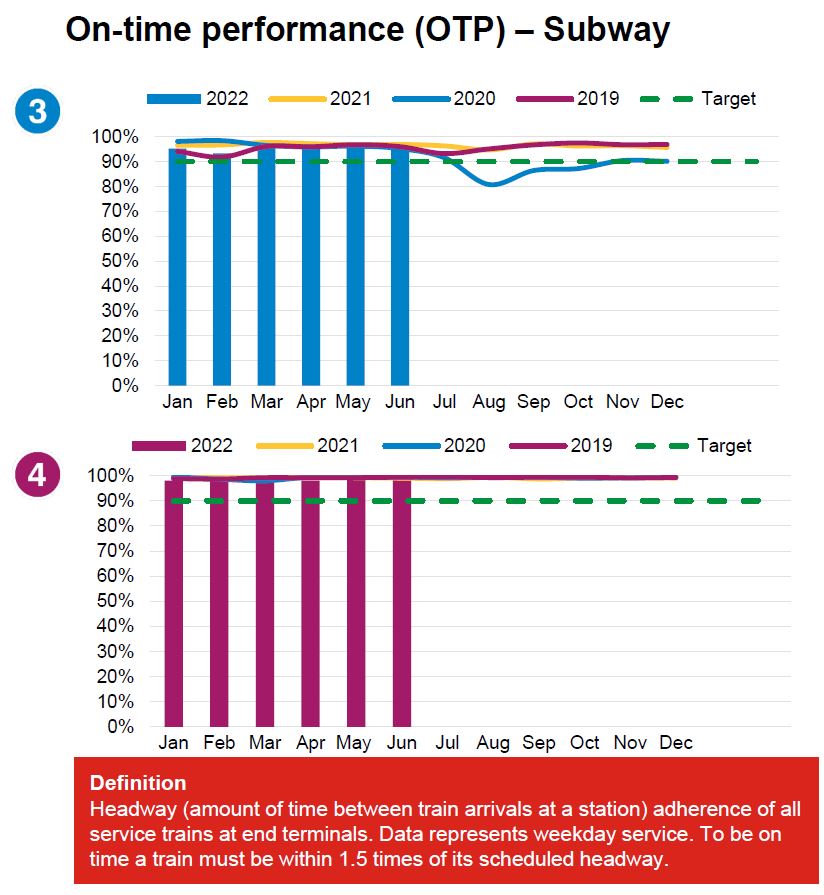
The on-time metrics for the subway are completely different from the surface system. In the subway, being “on time” is measured relative to the scheduled headway whereas buses and streetcars are measured against their scheduled times.
The subway standard has a gaping hole in that being “on time” with wider headways allows a great deal of service to be missing without triggering an “on time” problem. For example, a 15 train/hour service (every 4 minutes) might degrade to 10 trains/hour (every 6 minutes), but still meet the target of trains running at no more than 1.5 times the scheduled headway.
The performance is summarized by month and there is no indication of how many distinct events occurred or the length of the disruptions. A separate chart on “service delivery” (later in this article) does review actual vs scheduled capacity during peak periods, but again this is summarized on a monthly basis.
Rapid transit service delivery is reported relative to scheduled levels on the four lines. This is measured by counts of trains, although there is no indication of service reliability problems that could produce longer waits and crowding.
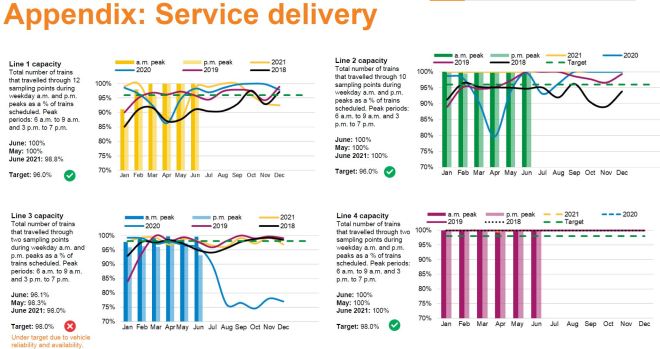
Streetcar and bus on-time performance is measured against the schedule with an allowance of 1 minute early and up to 5 minutes late in departure at terminals. There is no measurement of what happens along the line. Again, the standard has a hole because that six minute “on time” window allows vehicle bunching where one vehicle runs late, but not by more than 5 minutes. Its follower can be right behind, but both are considered to be “on time”.
If a vehicle is missing, there is a gap in service, but no penalty against the “on time” stats.
All of this is summarized on a monthly basis across all routes where the effect of time and route-specific problems disappears. Note that in the charts below, the y-axes are not at the same scale.
With some subway service still well below pre-pandemic levels, and below the maximum that can be achieved with the signal systems, it is possible for service to bunch just as it does on surface routes.
The table below shows current vs prepandemic service levels on the four rapid transit lines. Lines 1 and 2 remain below their historic levels, a headway that was fixed by the block signal system. Some improvement is now possible on Line 1 with Automatic Train Control notably allowing trains to be inserted on closer spacing and better service to be provided at stations like Bloor with long dwell times.
An offsetting problem on Line 1 is created by the split between one and two person train operation at St. George. Crew changes there can produce erratic service, although this problem will disappear when the entire line goes to one person operation later in 2022 or in 2023 (date TBA). This is an example of an operational problem that has nothing to do with technology. It is, as former CEO Andy Byford would put it, an “own goal”.
| Headways (Trains/Hour) | Line 1 | Line 2 | Line 3 | Line 4 |
| AM Peak Jan/20 | 2’21” (25.5) | 2’21” (25.5) | 5’00” (12) | 5’30” (10.9) |
| AM Peak Sept/22 | 3’00” (20) | 3’00” (20) | 5’00” (12) | 5’30” (10.9) |
| Ratio 2022 vs 2020 | 78% | 78% | 100% | 100% |
| Midday Jan/20 | 3’49” (15.7) | 3’20” (18) | 6’45” (8.9) | 5’30” (10.9) |
| Midday Sept/22 | 3’45” (16) | 3’45” (16) | 6’45” (8.9) | 5’30” (10.9) |
| Ratio 2022 vs 2020 | 102% | 89% | 100% | 100% |
| PM Peak Jan/20 | 2’36” (23.1) | 2’31” (23.8) | 5’00” (12) | 5’30” (10.9) |
| PM Peak Sept/22 | 3’00” (20) | 3’00” (20) | 5’00” (12) | 5’30” (10.9) |
| Ratio 2022 vs 2020 | 87% | 84% | 100% | 100% |
| Early Eve Jan/20 | 3’30” (17.1) | 3’42” (16.2) | 6’45” (8.9) | 5’30” (10.9) |
| Early Eve Sept/22 | 3’30” (17.1) | 4’52” (12.3) | 6’45” (8.9) | 5’30” (10.9) |
| Ratio 2022 vs 2020 | 100% | 76% | 100% | 100% |
There is no report of service delivery for the surface network.
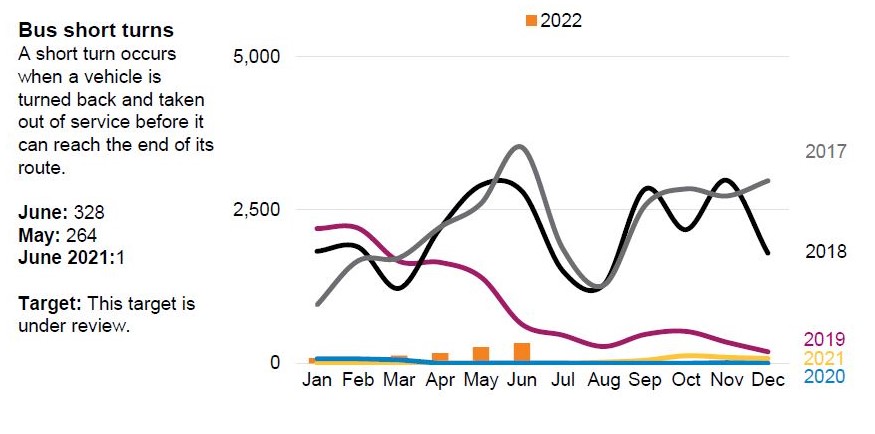
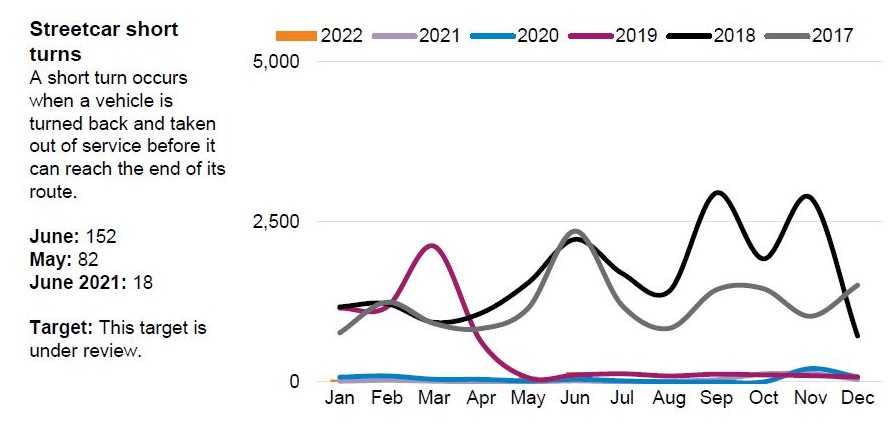
Finally, there is the issue of short turns. Since April 2019, it has been a matter of faith that there shall be no short turns, and the statistics obediently fell to a very low value. As I have shown from reviews of tracking data, these charts do not represent reality, notably on streetcar lines where short turns remain a common practice.
Properly used, there is nothing wrong with short turns especially when a major delay has caused vehicles to bunch and the service must be restored to a regular headway. However, short turns should not be used as a routine “fix” for schedules that are too tight for actual operating conditions.
As I have shown in previous analyses, there are cases where a failure to short turn led to extreme bunching with many vehicles running in a pack for extended periods. The stats might look wonderful, but the service is atrocious. The absence of metrics for headway reliability and bunching masks what is really going on, even if short turns were accurately reported.
The charts below simply do not reflect day-to-day practices as can easily be seen by looking at tracking data, and by riders who are unexpectedly turfed off of their vehicles. This raises the question of whether other reported statistics have been massaged to fit with a management goal.
See:
- The Myth of “No Short Turns” (July 2022)
- Service Analysis of 7 Bathurst for August 2022
- Service Analysis of 38 Highland Creek for August 2022
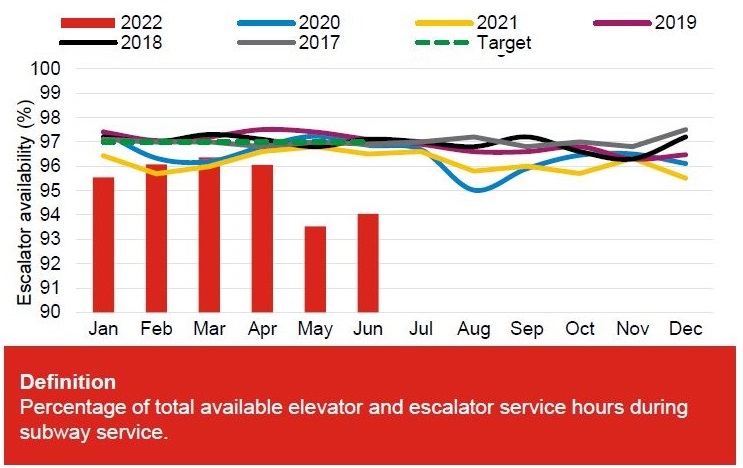
Escalators and Elevators
Escalator and elevator availability stats show another example of the problem of averaging.
When full month values are used, these will be dominated by whichever machines are out of service for extended periods as opposed to those that fail in service. These stats should be separated, and in-service failures reported as counts, not just as a proportion of time. In effect, the stats should be broken into three groups:
- Device out of service for overhaul or major repair
- Number of device failures
- Time-to-repair failures
This division would exposes day-to-day reliability figures as well as the speed with which their staff or contractors bring devices back online.

Vehicle Reliability
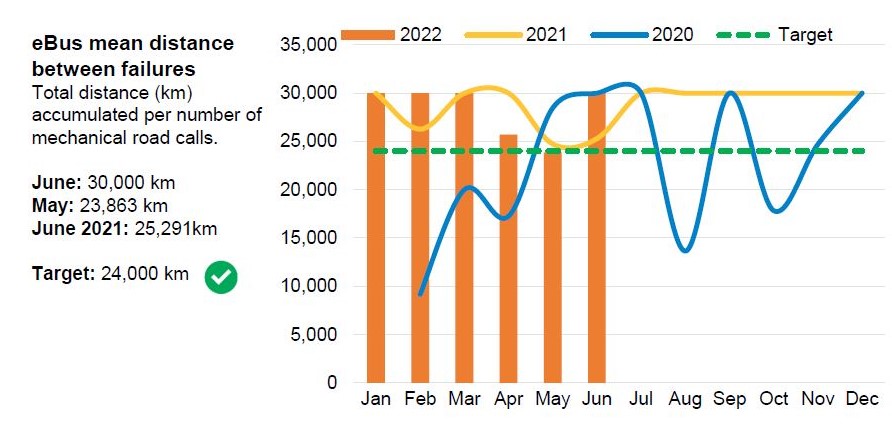
In recent months, the mean distance between failures for streetcars has dropped very substantially. According to the CEO’s Report:
Doors and ramp system failures were mostly caused by wiring issues and adjustments of component assemblies. Investigation into these failures is ongoing.
As a minimum, emphasis on quality of inspections and repairs is being communicated to staff. Adjustments to quality control processes are also being made to address workmanship issues.
There is a quite open admission here that repairs by TTC staff are not up to snuff, but that alone does not explain the precipitate drop in vehicle reliability over a short time. Moreover, it does not address the questions of whether work is being rushed, or if maintenance crews are short-staffed or otherwise ill-prepared to maintain vehicles.
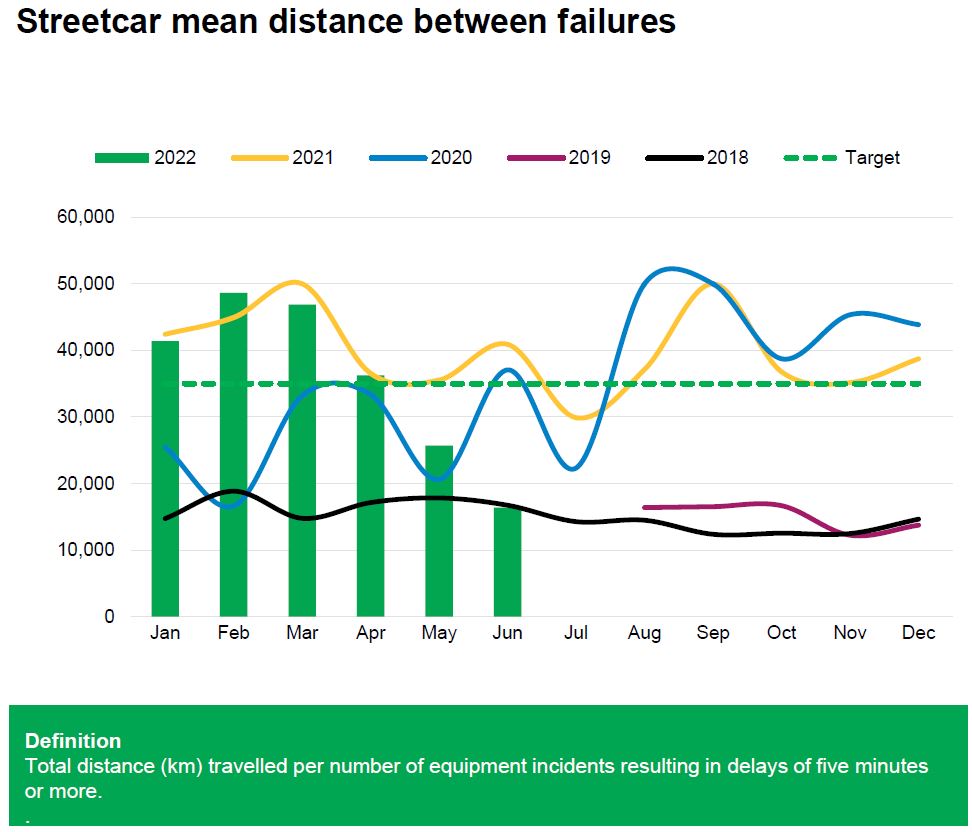
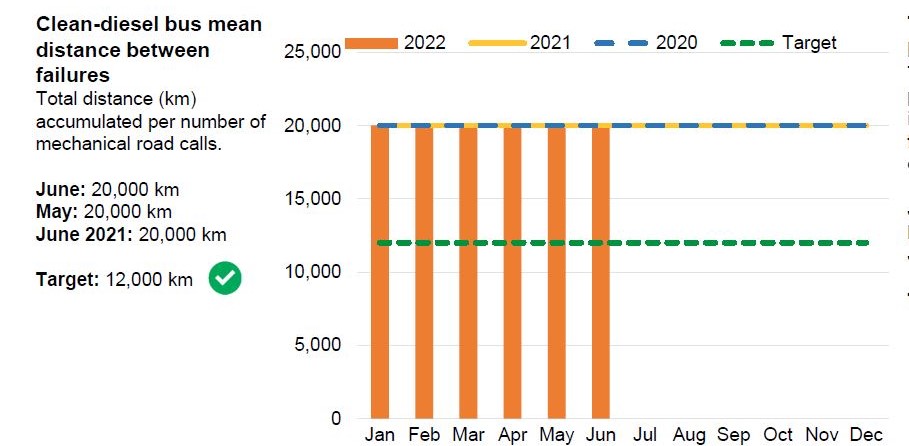
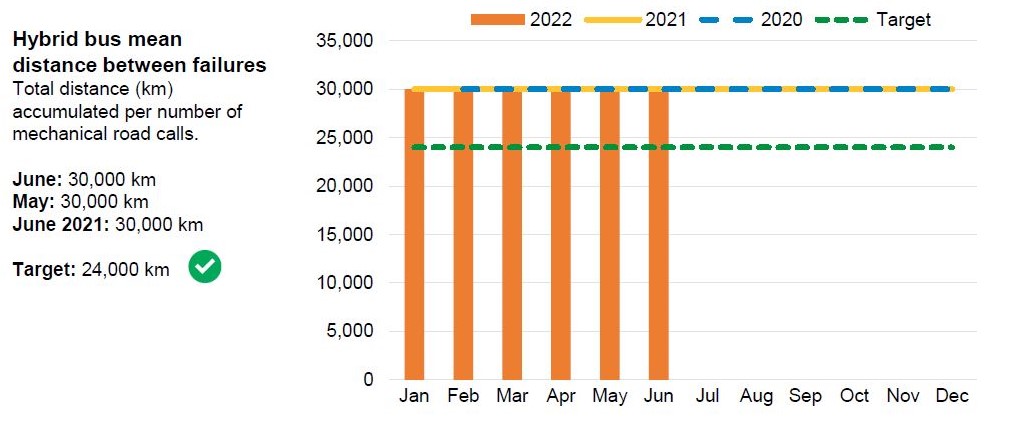
On the bus system, it is quite clear from the charts that there is an upper bound for reporting MDBF values of 20,000km for diesel buses, and 30,000km for eBuses and hybrids. (Compare the bus charts with the streetcar chart which shows the full range of actual value.) This could mask differences in performance between the modes because we do not know where the values “top out”. This is of particular importance with the planned move to battery eBuses as the mainstay of the bus fleet. If they cannot achieve the reliability of buses they replace, maintenance costs will go up, and the number of buses available for service will decline.
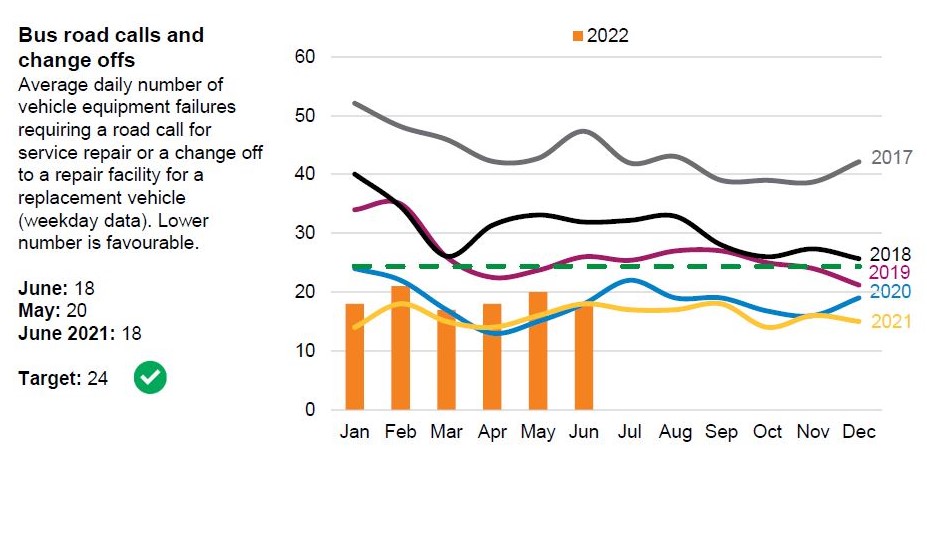
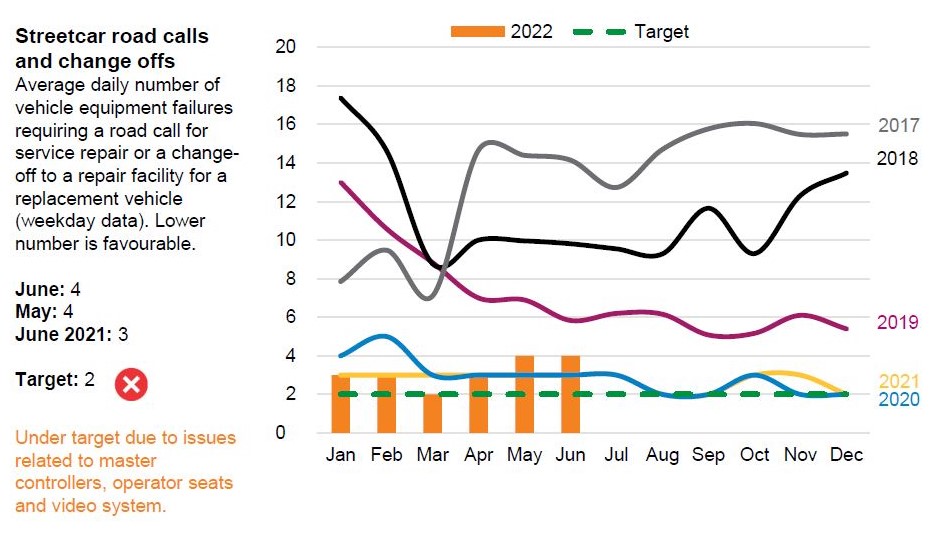
Another view into reliability is the number of road calls and change offs (the need to replace a vehicle in service with a spare). The target value is set proportional to the peak scheduled service. It is erroneously shown as a fixed value in the charts below although it would have varied over time depending on the then-usage of the bus and streetcar fleets.
The RCCO values should be subdivided by vehicle type to track whether there are problems with specific portions of the fleet. For example, in the declining days of the CLRV and ALRV fleets, they were prone to more frequent breakdowns than the Flexity cars. As the bus fleet migrates to eBuses, tracking how often each vehicle type fails in service will be important.
Vehicle Availability
Vehicle availability is not reported by the TTC and this hides a vital piece of information: how much service could be provided if only all available vehicles were actually used? The TTC has been running with generous spare ratios (the number of spare buses versus those in scheduled service) for many years, and pandemic-era service cuts accentuated this.
A related problem is one of long-term disabled vehicles. A bus or streetcar that never leaves the garage never fails in service. In effect the best vehicles can go out every day, but the MDBF values could misrepresent the overall fleet reliability and availability. The CEO’s Report begins with a page listing overall stats including the size of the fleet. Comparing this to the scheduled level of service is revealing.
The typical industry standard is in the range of 20 to 25 per cent, that is to say 1 spare vehicle/train for every 4 to 5 in scheduled service. Some of the high values below are the result of pandemic-era service cuts, some are due to long-term maintenance issues, and some are a combination of factors.
- Line 1 is running with less than full service, but a generous allocation of gap trains (6). When headways are restored to pre-pandemic levels, the number of gap trains and spares will fall.
- Line 2 has had a generous spare ratio ever since the entire T1 fleet was displaced from Line 1. Originally some of these cars were intended for the TYSSE, but the decision to implement ATC on Line 1 made them redundant for that purpose. Original plans for the Scarborough Subway Extension included using the surplus T1s to provide alternate peak period train service beyond Kennedy.
- Line 4 has a dedicated fleet of six 4-car TR trains. It has operated with four in revenue service at all hours since it opened, and there is headroom to add one train if necessary.
- Line 3 has a dedicated fleet of seven 4-car SRT trains. Even fielding five of these in peak periods can be a stretch, and that is one of several reasons the SRT will shut down in Fall 2023.
- The bus fleet has a spare factor of 45 per cent, over double the industry norm. This would allow a large proportion of the fleet to sit idle if there were many unreliable vehicles. The MDBF stats for those remaining would look good.
- Similarly the streetcar fleet has a spare factor of 43 per cent. Only two cars (those affected by the flood in the King/Atlantic underpass) are known to be out of service for an extended period, and the project to re-weld frames on the earliest cars in the fleet is almost complete.
| Total Fleet | Peak Scheduled | Spare | Spare:Scheduled Ratio | |
| Rapid transit trains | 150 | |||
| TR-6 car (Line 1) | 76 | 60 | 16 | 27% |
| T1 (Line 2) | 61 | 40 | 21 | 53% |
| TR-4 car (Line 4) | 6 | 4 | 2 | 50% |
| SRT (Line 3) | 7 | 5 | 2 | 40% |
| Bus | 2114 | 1460 | 654 | 45% |
| Streetcar | 204 | 143 | 61 | 43% |
Restoring scheduled service to bring the spare ratio down to 20 per cent would allow a peak service considerably higher than operated today. Even if the target were 25 per cent, the TTC could run 231 more buses and 20 more streetcars. Of course they would have to hire and pay operators to drive them, and a larger active fleet would increase servicing and maintenance costs.
| Bus | Streetcar | |
| Fleet | 2114 | 204 |
| Peak Service September 2022 | 1460 | 143 |
| With 20% Spares | ||
| Scheduled Peak Service | 1761 | 170 |
| Spares | 353 | 34 |
| With 25% Spares | ||
| Scheduled Peak Service | 1691 | 163 |
| Spares | 423 | 41 |
Almost two decades ago, the Ridership Growth Strategy included service improvements that took an inordinate amount of time to show up on the street. The TTC was always hamstrung by a shortage of vehicles and operators, and even if more vehicles were ordered, there would be no garage space for them. This is a major challenge for any substantial service increase, let alone the operating subsidy needed to get all of those spare vehicles out of garages and onto the street.
Streetcar service has been artificially constrained to fit the available fleet. The TTC has not yet published what a “full service” would look like on the streetcar and bus systems, whether this could be achieved with the available fleet and what spare ratio they expect to operate.

Pretty looking charts are the corporate version of grade school participation awards. Here’s something measurable: how far are they from the infamous state of disrepair in the mid-90s?
LikeLike
If LFLRV reliability drops any more it will be competing directly with the 35 year old CLRV fleet from the middle of the last decade.
LikeLike
This is the true root cause of why things are so crappy at the TTC while management is spraining their arms by patting themselves on the back. How about this for a proper statistic to measure: Total number of passenger hours spent on a TTC vehicle overcrowded to above loading standards. Tracking that number on a monthly basis would be very embarrassing for the TTC.
What!! That is a profoundly dishonest rigging of the statistics. So typically TTC. Sigh…
I will believe that as soon as the TTC stops ignoring the issue of sexual groping on overcrowded TTC vehicles. It is my opinion that the greatest harm caused by overcrowding is that it provides camouflage for sexual gropers to “accidentally” sexually touch someone when an overcrowded vehicle lurches to a stop or bounces over a pothole.
A good start for the TTC would be putting on their passenger surveys a question along the lines of “Have you ever been sexually touched on a TTC vehicle?” Unfortunately, TTC management’s current attitude is to never, ever, ever, ask a question if they might be embarrassed by the answer.
Other transit systems are not so shy about asking this question. I note that 63% of New York City subway riders report having been sexually harassed.
A survey in Paris, France found that every single one of its 600 female respondents reported experiencing sexual harassment on public transit.
So I conclude that any TTC “focus on security” that resolutely ignores the issue of sexual groping on overcrowded vehicles is nothing but a dishonest load of garbage. And any TTC report on overcrowding that never once mentions that overcrowding is a key factor in sexual groping is just plain evil.
LikeLiked by 1 person
As far as the streetcar system is concerned, over the past 6 calendar months or so, “mechanical problem” seems to have replaced “security incident” as the #1 posted service alert.
Right this morning during the early AM peak, a “mechanical problem” on King forced 503 cars to detour to McCaul loop and 504 cars to detour to Charlotte loop via Queen and Spadina.
And continuing with the tradition of poor dissemination of information, a service alert was posted early on for the 503 just before 7am but the alert for the 504 wasn’t posted until almost 8am, after the problem had been cleared.
Steve: Yes, I have noticed that. The length of some of these mechanical problems suggests a serious issue, and often the location is one where a derailment might have occurred. I am planning an article on the way the TTC bundles so many types of delays under a few rubrics thereby hiding what is really going on.
LikeLike
It’s Tuesday today and the October 9th board period changes begins next Sunday. The TTC seems to be slacking off with the service updates these days. As of now, I don’t see any October service change details from anywhere except for the new stop at the interim Scarborough centre GO terminal for the 985A on October 9.
Steve: The list of changes came out this afternoon. There are not many. My article just went up.
LikeLike
Well this is of no surprise to anyone….. except maybe to the inept and useless Board. Things just keep going further and further down hill. What good will a brand new line be without passengers to use it? At the rate the TTC is going people will just give up. Those that have to will stay with the system. I’d imagine this has already been taking place. When the crazy people and homeless outnumber the regular fare paying public, you know something is amiss.
Maybe we all need to collectively start complaining to the TTC’s customer service line, and to our elected officials. If we all inundated them with our daily accounts of the dysfunction of this once proud public agency has come to. Maybe then something will change … well either that or some genius will make the case for privatization … if that happens I’m moving to the middle of nowhere. The sad part is I personally used to defend the TTC to anyone who would badmouth it. But now, I have no argument.
LikeLike
John N. wrote:
Here is a better idea. Maybe we all need to collectively vote on October 24 and elect politicians who are committed to improve the TTC.
LikeLiked by 1 person
It’s absurd. Looking back at just the last 8 hours today there have been multiple interruptions to streetcar routes due to “mechanical problems”.
505/506 diversion via Parliament, Queen, and Spadina (to join the chaos of the 510B’s looping at McCaul and turning off at Spadina, and I assume 511 cars from the 511 disruption)
503/504/511 service at King and Bathurst blocked due to a mechanical problem.
LikeLike