
The TTC Board met to discuss various matters of which the most substantial were:
Continue readingMonth: October 2020
Measuring and Illustrating Headway Reliability
In recent articles, I have reviewed a pervasive problem on the TTC’s network with uneven headways (the time between vehicles). This is annoying enough in “normal” times, but with the concerns about crowding during the pandemic, anything that contributes to crowding is more than just an annoyance.
The CEO’s Report presents only a few measures of service quality:
- the proportion of service that is “on time” leaving terminals,
- the number of short turns, and
- the amount of service fielded compared to what is scheduled.
These metrics are utterly inadequate to showing how the system is behaving at the level seen day-by-day, hour-by-hour by riders for several reasons:
- Most riders do not board vehicles at or near terminals, and measures that look only at terminal performance do not reflect most of each route.
- “On time” is a meaningless concept for most routes because service is (or should be) frequent enough that riders do not time their arrivals at stops to meet their bus.
- A count of short turns only indicates that most vehicles reached their terminals, not whether the absence of short-turns contributed to poor service quality. Moreover, there is good reason to believe that the number of short turns is under-reported.
- Statistics are averaged on an all-day, all month basis and do not reflect route-by-route or hour-by-hour variations.
Riders to not ride “average” buses and streetcars – they take what shows up when they try to use the system. Indeed, if the TTC actually provided “average” service, a lot of problems would be solved because the service would be much more reliable.
At the recent TTC Board meeting, CEO Rick Leary noted that the metrics in his monthly report will be changed in the near future. This is long overdue, but it remains to be seen just how informative these will be.
This article includes displays of headway reliability in a new type of chart I have been working on recently. Reader feedback on this is welcome.
Continue readingThe Problem of Scheduled Service Irregularity: Update
In a recent article, I reviewed the scheduled service for several routes and the potential problems associated with uneven headways and crowding. As noted in that article, several routes had their schedules modified in recent months to reduce or eliminate these problems.
In my review, I only looked at a subset of routes across the system. The TTC has provided a full list of the routes with new schedules and their plans for coming months.
We have been actively working to reduce uneven headways created by the cancellation of crews in the May 2020 board period.
In most cases, we utilized the built-in recovery time at the end of the route, and by shifting departure times, we were able to minimize significant gaps in the schedule. This approach allowed us to improve on most of the last-minute changes implemented in the spring while continuing to develop multiple service level scenarios through the summer and fall. Unfortunately, due to time constraints (working well past normal deadlines), full schedule re-writes were not possible and we continued to provide suboptimal headways on some routes across the system.
The shifting of schedules was implemented on the following routes in the September board: 7, 11, 25, 29, 32, 34, 51, 61, 63, 68 (gaps remain), 72 (southbound only), 74, 75, 79, 86, 88, 89 , 90, 98, 102 (northbound only), 105, 116, 124, 160 and 163.
We are currently working on the January boards. Most routes will return to pre-pandemic levels and scheduling anomalies resulting from cancelled crews and extra trippers will be eliminated.
Mark Mis
Head, Service Planning & Scheduling
When the January updates are announced, I will publish the details as usual. Stay tuned.
A Travesty of Transit Service: 35 Jane Saturdays
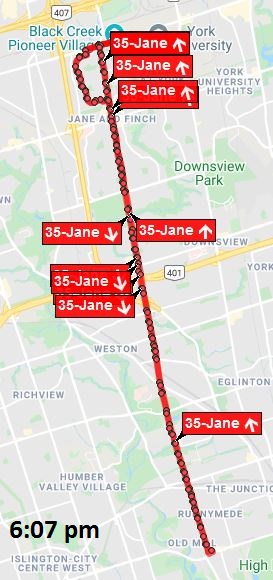
This post arises from a Twitter thread in the early evening on Saturday, October 17. Photos of crowded TTC buses are not rare these days, and one appeared from the 35 Jane bus. Intrigued, I took a look at NextBus to see whether bunched service might be the culprit.
The first snapshot at 5:09 pm was what I found. All of the buses on the route were clustered in three groups with wide gaps between them. Oh well, I thought, maybe the route supervisor will sort this out at the terminals by spacing the service, or possibly by short turning a few buses. This was not to be.
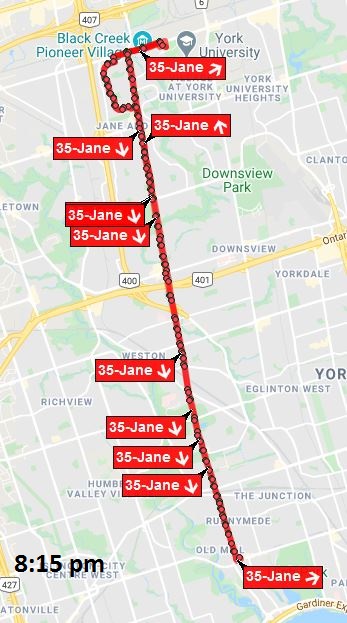
Half an hour later, at 5:41, the only change was that the three groups of vehicles had rotated positions on the route, and this continued for the next hour. It was not until 8:15 pm that I came back to see what was happening, and found that almost all of the service was running southbound with an enormous gap northbound.


Regular readers here will remember that I wrote about route 70 O’Connor which had a chronic problem with buses bunching late on Saturday afternoons.
- Analysis of Route 70 O’Connor for October 2019
- Analysis of Route 70 O’Connor for November 2019
- An Example of Service on Route 70 O’Connor December 20, 2019
At the TTC Board meeting of December 12, a motion by Commissioner Brad Bradford asked staff to report back in the first quarter of 2020 on my findings. The pandemic emergency intervened, and there has never been a report.
The situation on 35 Jane on October 17 prompted me to look at vehicle tracking data for past months. Because this is a route with a proposed reserved lane similar to the BRT red lanes recently installed in the Eglinton-Kingston-Morningside corridor, I have been collecting data for it for several months.
Continue readingExpanding Bloor-Yonge Station (Updated)
Updated October 25, 2020 at 9:30 pm: Illustrations have been added or replaced to provide higher resolution versions that were issued as part of the TTC Board Meeting presentation.
Plans for the expansion of Bloor-Yonge Station have reached another milestone with revelation that the project will have some effect on the buildings above and around the subway structure. This was not really a surprise, and some of the structural challenges have been acknowledged in past reports.
For this iteration, however, the need for more platform and circulation space triggered negotiation with affected property owners who may view this as an opportunity to reconfigure their buildings.
To put everything in context, here is a bird’s eye view of Bloor and Yonge showing the existing subway structure. North is at the top.
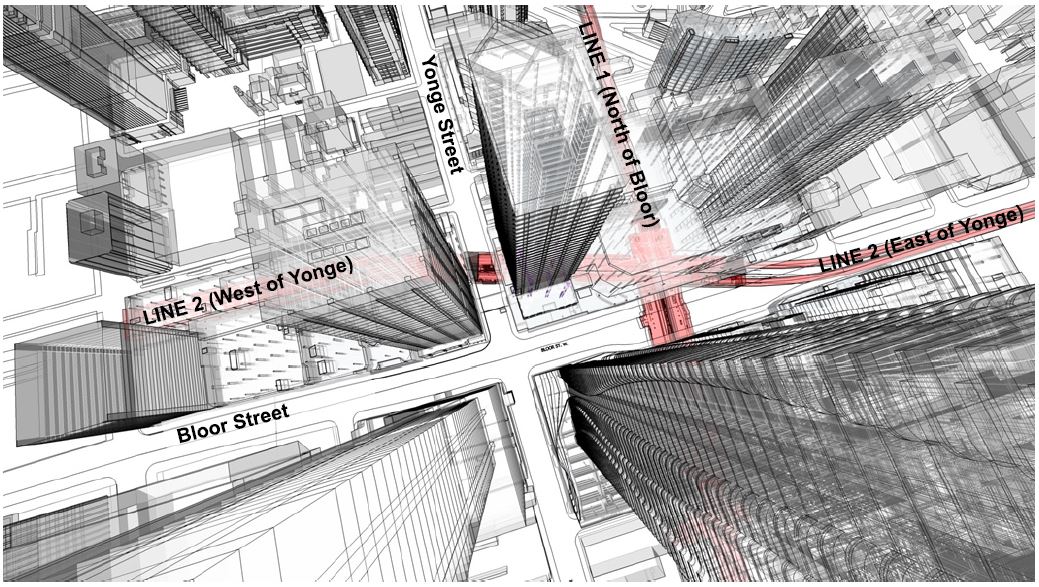
Yonge Station lies on a diagonal between, roughly, Bloor Street East and Park Road (the east end of the Hudson’s Bay building) and the northern half of the block on Yonge between Bloor and Cumberland. The building at 2 Bloor Street East (northeast corner) actually sits on an underground bridge because of local ground water conditions and a nearby stream that continues to appear from time-to-time within the station.

The original Yonge line is east of Yonge Street and its alignment is easy to spot from the surface by a succession of parks and parking lots above the subway where once there were buildings.

Before the Bloor-Danforth line opened in 1966, there was a fare-paid transfer station in the middle of Bloor Street where passengers switched between the subway and extremely frequent streetcar service. The problem of moving people between the Yonge and Bloor routes has been with us for a very long time.
A painting of the proposed Yonge Station by Sigmund Serafin from 1957 shows how the then-new Yonge Line would relate to the proposed station on the Bloor Line. Note the red Gloucester cars on the Bloor line. That’s what everyone thought of as a subway train in those days.

[Many decades ago, I rescued this painting and others from a TTC housecleaning binge. It is now in the collection of the City of Toronto Archives Fonds 16, Series 2449, Item 1]
The connections to the streetcar platforms are now walled off, but they were behind a row of fluted aluminum columns about a third of the way down the platform.
The platforms on the Bloor Station (Line 1) level were expanded decades ago to double their width over much of their length, and the east and west concourses were also expanded to provide more circulation space. However, problem remain on the Yonge Station (Line 2) level where a single centre platform is shared by both directions. It is often crowded and can be dangerous when service is suspended.
The map below shows the site and the degree to which the structure will be expanded. Most of the new construction will be under Bloor Street but some will be under existing buildings on the northeast corner of the Bloor-Yonge intersection. Exactly how this will affect the buildings is unknown because details of the property agreements are in a confidential appendix to the report.
The important point about this land is that it is still owned by the City and is leased. The expanded station will require changes in the lease arrangements.

On Line 2, a new platform will be added south of the existing structure. This will separate eastbound and westbound passengers. The new platform will have its own connections to the upper level into expanded concourse areas, as well as a link to the exit onto Yonge Street at the west end of the station.
Also shown in the diagrams below are new fan plants (red). These are required to improve emergency ventilation at the station and bring it to current fire code.
Updated October 25, 2020: A second version of the plan has been added below (the “Concept Design”) from the presentation to the TTC Board. It is at higher resolution and gives a better site context. Figure 3 from the original report has been left here because it contains notes that are not in the presentation version.
At the north end of Bloor Station, the circulation space will be considerably increased and there also be new elevators linking the east and west concourse areas to the two Yonge Station platforms below.
Not shown in either the report nor the presentation materials is the layout for the fare control area one level up from Bloor Station. This will necessarily be affected both by the relocation of stairs, escalators and elevators, as well as by whatever changes might occur in the mall outside of the station itself.


This project is fully funded with contributions from Toronto’s City Building Fund, as well as the Provincial and Federal governments at a total cost of $1.5 billion. Design is expected to reach the 30 per cent level in mid-2021 for project approval. Final design would be completed in 2023 with an aim for the construction contract award in 2024. The completion date of 2029, before the Richmond Hill extension opens, drives the overall schedule for this project.
TTC Proposes Massive Fleet Plan
At its meeting on October 22, the TTC Board will consider a report setting out plans to purchase new buses, streetcars, subway trains and Wheel-Trans vans in coming years.
TTC Fleet Procurement Strategy and Plan
In an important departure from typical practice, the City is setting out its position including what can be achieved with already-committed City funding without waiting for confirmation of contributions from other governments. Both the provincial and federal governments will face voters sometime in the next few years, and this, in effect says “come to the table”.
The plan has many strong points although some important details are missing. Key to this plan is that it is a system plan, not a scheme for one tiny chunk of the network nor a flavour-of-the-day announcement from one politician.
Overview
The TTC proposes acquisition of hundreds of new and replacement vehicles over the coming years:
- From 13 to 60 new streetcars from Bombardier to be delivered between 2023 and 2025.
- Approximately 300 hybrid-electric buses for one or both of the two qualified suppliers to be delivered between 2022 and 2023.
- Pending outcome of technical evaluation and product comparison work now underway, approximately 300 all-electric long-range buses in 2023 to 2025.
- 70 Wheel-Trans buses for delivery in 2022 and 2023.
- 80 subway trains to replace the existing fleet now used on Line 2 and to provide for future service improvement with ATC (automatic train control).
That list is only part of a larger scheme shown in the table below.
The “ask” for funding on these projects is based on the full quantity of vehicles (column 2 above) as opposed to what the TTC can achieve with only the City’s contribution (column 3).
A political problem for the TTC is that they are seeking funding for the ten year plan within the next few years even though some of the spending is in the latter part of the decade.
For example, the buses are unlikely to be contracted on one big purchase that would lock in a single supplier, and a new contract would be tendered two or three times during the decade. Similarly, the quantity of Wheel-Trans buses represents far more than one fleet replacement (as of June 30 there were about 280 WT buses). Part of this funding would not be required until late in the decade when the next purchases would be at end-of-life.
Commitments that far off are unlikely to be made by either the provincial or federal governments both of which would face at least one if not more elections in the meantime.
A further issue is that there are many more projects in the TTC’s long-range capital plan than the ones listed here, and there is no sense of relative priority for things like ongoing infrastructure maintenance. If the vehicles program soaks up all available funding, other projects could find that the cupboard is bare.
Missing from this report is an overview of the cash flow requirements for each project and the point at which money for each component must be secured. Projects with long timelines such as ATC installation need early commitment even though they would not finish until late in this decade or possibly longer. The same does not apply to the cyclic renewal of the bus fleets and some of the associated infrastructure.

To support the electric vehicle purchases, the TTC together with Toronto Hydro and Ontario Power Generation (OPG) are working on plans for the charging infrastructure that will be required to move to a zero emissions fleet by 2040 in regular buses, Wheel-Trans and non-revenue vehicles.
The subway train order will likely grow because Metrolinx would piggy-back the needs of the Yonge North extension to Richmond Hill and the Scarborough extension to Sheppard for economies of scale and consistency of fleets on the two major rapid transit lines. However, the cost will be on Metrolinx’ account because these are now provincial projects. There is a danger that if future provincial funding is constrained, the provincial projects could elbow aside requests for local projects.
The committed and required funding amounts are set out below.
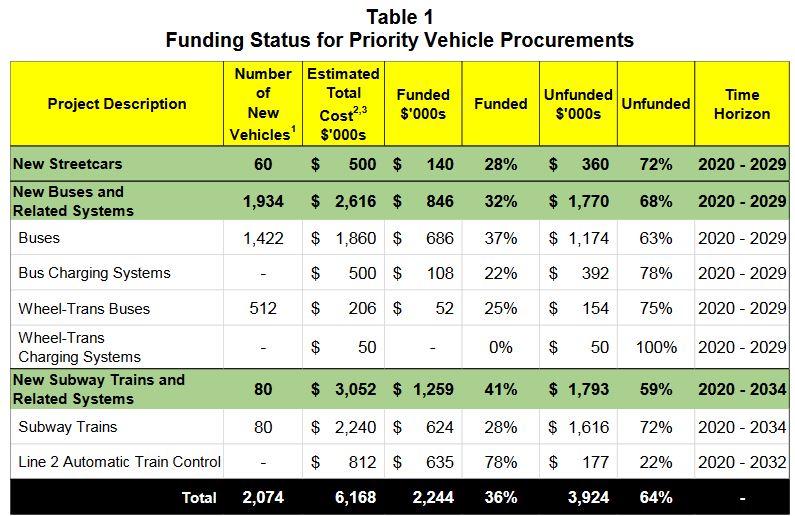
1: Number of Vehicles reflects the current fleet plan as described under the Comments section of the report.
2: Estimated Total Costs includes the following: (1) vendor contract payments for vehicle design, production, delivery and commissioning of vehicles; and (2) delivery costs including procurement, project management, engineering, quality assurance, and project contingency
3. Total Estimated Cost has been revised from $5.84 billion (Class 5) to $6.17 billion (Class 4).
The City’s share is provided by the City Building Fund, a supplementary property tax introduced in the 2020 budget, together with funding that had been allocated to a planned rejuvenation of the Line 2 subway fleet for an additional decade of service. Now that those trains will be replaced, the money set aside to refresh the old fleet is available for this project.
| City Building Fund Project | $ millions |
| Bloor-Yonge Station Expansion | $500 |
| Line 1 Capacity Enhancement | $1,490 |
| Line 2 Capacity Enhancement | $817 |
| Line 2 Automatic Train Control | $623 |
| Other Critical Subway State of Good Repair (Note 1) | $160 |
| New Vehicles and eBus Charging Systems | $1,140 |
| Total City Building Fund | $4,730 |
The vehicle procurements are funded on the City side by a combination of CBF monies (see above) and the previous allocation for renovation of the Line 2 fleet of T1 trains.
| Project | $ millions |
| 80 New Subway Trains | $ 623 |
| T1 Overhaul and Maintenance to 2030 | $ 74 |
| Procurement of Buses | $ 686 |
| eBus Charging Infrastructure | $ 64 |
| Wheel-Trans Buses | $ 22 |
| New Streetcars | $ 140 |
| Total | $1,609 |
| Existing Approved Funding (T1 Life Extension) | $ 474 |
| City Building Fund | $1,140 |
| Total | $1,614 |
Combining the $1.61 billion above with the Line 2 ATC funding brings the City’s total to about $2.2 billion. The TTC and City invite their partners at the provincial and federal levels to make up the difference of just under $4 billion between City allocations and the total required for this portion of the overall capital plan.
The City’s strategy is to start spending its $2.2 billion and hope that the other governments will come in for their share. There are elections at both levels that could provide some leverage, but there are also problems with Toronto’s appetite for capital compared to other parts of Ontario and Canada.
Continue readingHow Much Service Can The TTC Run?
A lot of ink (some real, but much virtual) has been spilled in past weeks on the topic of crowding on TTC buses. This was compounded by less-than sympathetic responses from various places, including the TTC inself, suggesting the speakers/writers have no sense of the real world that transit riders inhabit.
Although there has been a recent plateau, ridership has been building through the summer and photos of crowded buses now appear commonly on social media. This co-incides with a second wave of infections and a selective move back to “stage 2” protocols. Just when concerns about personal safety are rising, the TTC gives the impression of shrugging its shoulders. This is not a recipe for confidence in rebuilding transit ridership.
That said, I must confess that I fall midway between camps that cry out for vast increases in transit (possibly with lower fares) and those who wring their hands wondering how we will even pay for what operates today. Trying to take the middle road is not easy.
Here I will attempt to put various issues and options on the table. Whether those responsible for the TTC act on them is out of my hands.
How Full is Full?
During the early days of the Covid recovery period (remember only a few months ago when we thought this was all going away soon?), the TTC produced charts showing demand levels and crowding configurations for its vehicles.

The degree to which they might achieve these levels depended on the overall level of ridership. This chart shows what happens if the TTC attempted to provide distanced service even though demand was low. At a 30% level, the service would have to match pre-pandemic levels to leave enough room for passengers to spread out.
This is not feasible from either a budgetary or operational point of view. The cost is very high, and there is no headroom for growth beyond that 30 per cent line.

Another variation of this chart foresaw a combination of increased crowding and service as ridership grew. On a system-wide basis, we are now at Level 2 with overall ridership at around 40 per cent and this translates to a crowding standard of 25 per bus, about three quarters of a seated load (see chart above).
The problem, of course, is that there is a big difference between system-wide averages and the conditions from route to route, location to location and time of day.
The TTC reported that as of early September demand on the bus system had reached almost half of pre-covid levels. About one quarter of all trips were running at or above the Level 1 standard of 30 per cent capacity, and almost a tenth were running at or above the Level 2 standard of 50 per cent.
The oft-cited figure that 92 per cent of TTC trips are not crowded comes from this chart. What it really means is that only 8 per cent are over the Level 2 standard, but it does not mean that the balance fall at or below Level 1. This distinction has been lost in translation by those who seek to put the best possible spin on the situation.

A major source of confusion has been the question of what would trigger resumption of full service. The chart above shows that 50 per cent demand would require 100 per cent service to provide some degree of distancing, albeit at Level 2, not Level 1 standards.
This was taken by TTC management to mean 50 per cent overall, but as we well know the recovery on many bus routes outpaces the system average. Many bus routes are likely to be well beyond this level before the system as a whole hits that target.
At the September 24 TTC Board Meeting, management made this point, that bus ridership was growing faster and would have to be dealt with but there is little real progress on this so far. The TTC does run some unscheduled extra service (about which more later) and claims that its effect shows up in the slight downturn in early September in the proportion of trips cresting the 50 per cent capacity line.
Continue readingStudentMoveTO: A Survey of GTHA Post-Secondary Student Travel
Almost every ridership study and projection, almost every major infrastructure and scheme looks at peak period, core focused commuting patterns. Huge efforts go into multi-decade plans to deal with growth, but much of these plans obsess on getting people to and from work downtown.
This leaves millions of trips unaccounted for outside of downtown and outside of traditional commuting hours. In the pandemic era, with that “normal” commuting load stripped away, we now see the importance of the local bus service – much of which does not serve downtown – where ridership remains strong. The subway may be quiet and GO Transit almost deserted, but the bus routes carry well, in some cases too well for comfort.
A major group of transit travellers is students, and in particular those at post-secondary institutions who can face much longer trips over a variety of hours than their younger colleagues in secondary and elementary schools. Many are now learning from home, but when they return to in-person classes, their effect on the transit system should be remembered.
In fall 2019, ten universities and colleges, Metrolinx, the City of Toronto and other organizations launched research into post-secondary student travel patterns. Preliminary results from this study have now been published and these are available on the StudentMoveTO website.
This survey, necessarily, reflects “before times”. It tells a lot about student travel patterns and shows how they differ from the classic transit model. This is interesting not just for students, but as an example of a group and their travel demands that are poorly understood and poorly served by core-oriented transit thinking.
Moreover, as a group who, relative to many others, are less likely to use or have access to cars, they show the problems of a so-called regional transit system that provides much less service at the edges than in the network’s core, Toronto.
The survey cast a wide net across the member institutions.

Collectively these institutions represent over 300,000 students and their travel. With a response rate averaging 6 per cent, there were over 18,000 responses with varying participation rates from each college and university.
An important caveat is that those who chose to participate do not necessarily represent the population as a whole, but as with any survey, one works with the data available. Cross-checks on these samples would be interesting (such as using the postal codes of all students to verify their geographic distribution), but that is work for another day.
Of the students who participated, about 40 per cent filled out a travel diary, and this gives us information about the types of trips they made.

It should be no surprise that trips related to education accounted for only 36 percent of total journeys. People do have other things to do with their lives, especially in the much more social pre-pandemic era.
A considerable chunk of the trip pie, 18 percent, consists of work-related trips as many students also have jobs. This might be a secondary demand pattern overall, but it is part of many students’ lives and commuting burden.
The overall location of students and the institutions they attend is shown in the map below.

Some people commute a very long distance to school in much the same way as many commute to work. Post-secondary institutions, however, are not clustered in a few nodes such as King & Bay Streets, but are scattered around the region.
The map above does not show campuses of other institutions that did not participate in the survey. Those located outside of the south-central part of the GTHA have commuting issues of their own.
Continue readingThe Problem of Scheduled Service Irregularity
In a series of articles, I reviewed the quality of service on many bus routes during a period, the lull in traffic and demand during the pandemic, when it should have been relatively easy for the TTC to operate reliable service.
- TTC Bus Service Frequency and Reliability in 2020 (Introduction)
- TTC Bus Service Frequency and Reliability in 2020 (Part I)
- TTC Bus Service Frequency and Reliability in 2020 (Part II)
- TTC Bus Service Frequency and Reliability in 2020 (Part III)
- TTC Bus Service Frequency and Reliability in 2020 (Part IV)
- TTC Bus Service Frequency and Reliability in 2020 (Part V)
A consistent factor on almost every route was that buses are running in bunches with wide gaps between them. Those gaps translate to crowded buses followed by lightly-used ones, and riders rightly complain about long waits and an uncertain arrival of the next group of vehicles.
The TTC argues that service is not really that bad because they have a large number of unscheduled extras (aka “RAD” or “Run As Directed”) buses that do not show up in vehicle tracking records. Leaving aside the obvious need to track all service, not just the scheduled buses, this does not explain why buses run so close together so much of the time. These are tracked vehicles that have a schedule that should keep them apart.
Or so one might think.
TTC Service Standards include provisions for headway quality (the reliability of spacing between vehicles), but this is fairly generous, and it is never reported on as an official metric of service quality.
However, another problem is that on some routes, the service is actually scheduled to come at uneven headways. This arises from three issues:
- Some routes with more than one branch have different frequencies on each branch. This makes it impossible to “blend” service with, for example, alternating “A” and “B” destinations.
- In response to the pandemic, the TTC quickly adapted schedules by cancelling all express buses, and selectively cancelling individual runs as a “quick fix” to avoid complete schedule rewrites across the system. Where local trips were cancelled, this created gaps in the scheduled service.
- On many routes, notably those that formerly had express service, the TTC scheduled “trippers” to supplement the basic service. However, these trippers were generally not scheduled on a blended basis leaving riders with scheduled, but erratic service.
In some cases, the September and October schedules corrected some of these problems, but many persist. This article looks at a number of routes where the summer (August) schedules had uneven headways to see what, if anything, has changed by mid-October. (The most recent set of schedules went into effect on October 11, 2020.)
All of the data presented here were taken from the TTC’s schedules as they are published in GTFS (General Transit File Specification) format for use by travel planning apps. This almost exactly matches information on the TTC’s online schedule pages.
Continue readingBRT Lite Comes to Scarborough
Updated October 12, 2020 at 6:20 am: Travel time charts originally published with this article included data for April 2018 for Saturdays as well as weekdays causing a dip in values at the end of that month. The charts have been corrected.
With the gradual appearance of red pavement, a reserved lane for buses is appearing on Eglinton Avenue East, along Kingston Road to Morningside, and up Morningside to Ellesmere. This lane has no physical constraints on use by other vehicles and therefore is not really a full BRT implementation, but rather “BRT-Lite”.
Like so much recently in our town, it has acquired a moniker “RapidTO”. I will leave it to readers to concoct a name for the really rapid service provided by the subway.
For reference, here is a portion of the TTC route map showing the affected area (click to enlarge).
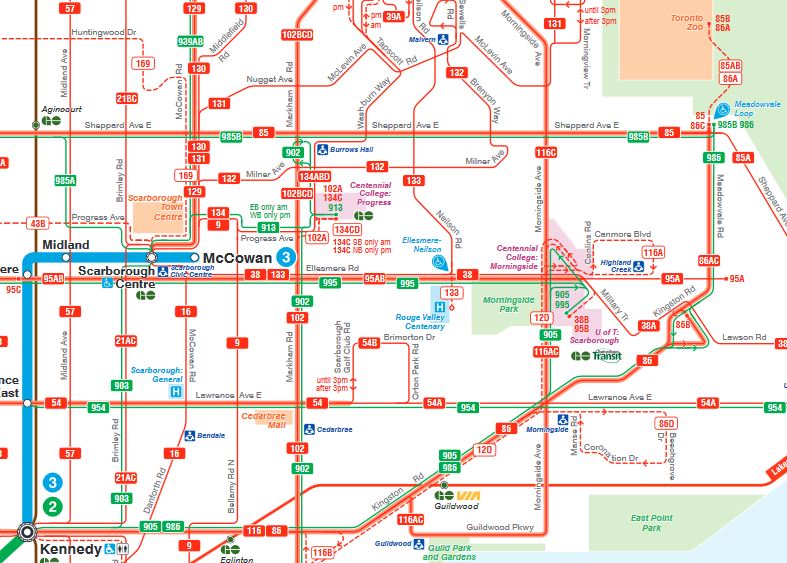
Four routes leave Kennedy Station:
- 86 Scarborough local buses
- 116 Morningside local buses
- 905 Eglinton East express buses
- 986 Scarborough express buses
The reserved lane begins at Brimley and then continues along Kingston Road. At Guildwood, the 116 Morningside route splits off, but the other services continue on reserved lanes.
At Morningside, the reserved lanes turn north along with the 905 Eglinton East Express buses and the 116 Morningside locals which have come up from Guildwood. The various 86 and 986 Scarborough service continue east and north to their destinations without a reserved lane.
The reserved lanes end at Ellesmere near the University of Toronto Scarborough Campus (UTSC).
The lanes on Kingston Road and Morningside will also be used by the 12D service from Victoria Park Station to UTSC, but this is a peak-only operation that I have omitted from this discussion because it is so infrequent (roughly two buses per hour).
This has been announced with much fanfare, but it will be important to track what actually happens with service in this corridor. The TTC has an uncertain attitude to the benefits of reserved lanes, and this goes back years to (at least) the St. Clair right-of-way project.
Reserved lanes can reduce travel times by keeping motorists out of the way assuming, of course, that someone makes the effort to keep the bus lanes clear. The TTC uses this saving in two different ways:
- Running the same number of buses on a shorter scheduled trip time means that more frequent service and capacity can be provided at no extra cost. This is the approach taken with route 116 Morningside.
- Keeping headways (the time between buses) the same but reducing the trip time allows a route to be served with fewer vehicles while maintaining but not improving service. This is the tactic used for 86 Scarborough, offset by express service on the 986.
Over the years, there have been many service reductions on the TTC through the reverse of the second point above. Traffic congestion might become a problem, and TTC management wants to guarantee that fewer or no buses are short-turned. To achieve this, travel times are increased so almost all buses will arrive on time or early at terminals with a generous provision of recovery time before their next trip.
This has usually been implemented by running buses less often so that the trip time can be longer. The downside, however, is that scheduled service is reduced and this becomes a “new norm”. Service increases to deal with capacity problems are often held hostage to budget limitations.
Two other changes will happen on the Eglinton-Kingston-Morningside corridor concurrently with the new bus lanes (effective Sunday, October 11):
- The 905 Eglinton East and 986 Scarborough express buses will resume to operation
- Some stops will be moved or consolidated.
The service to be provided on the express routes is comparable to that provided in March 2020 before much of the express network shut down in response to the pandemic. This will substantially increase service for those who travel between express stops.
Express service stops:
- Eastbound 905 buses stop only at Kennedy Station, Midland Avenue, Brimley Road, McCowan Road, Bellamy Road, Markham Road, Kingston Road and Eglinton Avenue East, Guildwood GO Station, Galloway Road, Lawrence Avenue, Morningside Avenue and Kingston Road, Ellesmere Road, Ellesmere Road and Military Trail, University of Toronto at Scarborough Loop.
- Westbound 905 buses stop only at University of Toronto at Scarborough Loop, Military Trail and Pan Am Drive, Morningside Avenue and Ellesmere Road, Kingston Road, Kingston Road and Lawrence Avenue, Galloway Road, Guildwood GO Station, Eglinton Avenue, Eglinton Avenue East and Markham Road, Bellamy Road, McCowan Road, Brimley Road, Midland Avenue, Kennedy Station.
- Eastbound 986 buses operate express from Kennedy Station to Celeste Drive (Guildwood GO Station), stopping only at Markham Road and Celeste Drive; 986 buses then operate local from Celeste Drive to Meadowvale Loop.
- Westbound 986 buses operate local from Meadowvale Loop to Celeste Drive (Guildwood GO Station); 986 buses then operate express from Celeste Drive to Kennedy Station, stopping only at Markham Road and Kennedy Station.
