Almost every ridership study and projection, almost every major infrastructure and scheme looks at peak period, core focused commuting patterns. Huge efforts go into multi-decade plans to deal with growth, but much of these plans obsess on getting people to and from work downtown.
This leaves millions of trips unaccounted for outside of downtown and outside of traditional commuting hours. In the pandemic era, with that “normal” commuting load stripped away, we now see the importance of the local bus service – much of which does not serve downtown – where ridership remains strong. The subway may be quiet and GO Transit almost deserted, but the bus routes carry well, in some cases too well for comfort.
A major group of transit travellers is students, and in particular those at post-secondary institutions who can face much longer trips over a variety of hours than their younger colleagues in secondary and elementary schools. Many are now learning from home, but when they return to in-person classes, their effect on the transit system should be remembered.
In fall 2019, ten universities and colleges, Metrolinx, the City of Toronto and other organizations launched research into post-secondary student travel patterns. Preliminary results from this study have now been published and these are available on the StudentMoveTO website.
This survey, necessarily, reflects “before times”. It tells a lot about student travel patterns and shows how they differ from the classic transit model. This is interesting not just for students, but as an example of a group and their travel demands that are poorly understood and poorly served by core-oriented transit thinking.
Moreover, as a group who, relative to many others, are less likely to use or have access to cars, they show the problems of a so-called regional transit system that provides much less service at the edges than in the network’s core, Toronto.
The survey cast a wide net across the member institutions.

Collectively these institutions represent over 300,000 students and their travel. With a response rate averaging 6 per cent, there were over 18,000 responses with varying participation rates from each college and university.
An important caveat is that those who chose to participate do not necessarily represent the population as a whole, but as with any survey, one works with the data available. Cross-checks on these samples would be interesting (such as using the postal codes of all students to verify their geographic distribution), but that is work for another day.
Of the students who participated, about 40 per cent filled out a travel diary, and this gives us information about the types of trips they made.

It should be no surprise that trips related to education accounted for only 36 percent of total journeys. People do have other things to do with their lives, especially in the much more social pre-pandemic era.
A considerable chunk of the trip pie, 18 percent, consists of work-related trips as many students also have jobs. This might be a secondary demand pattern overall, but it is part of many students’ lives and commuting burden.
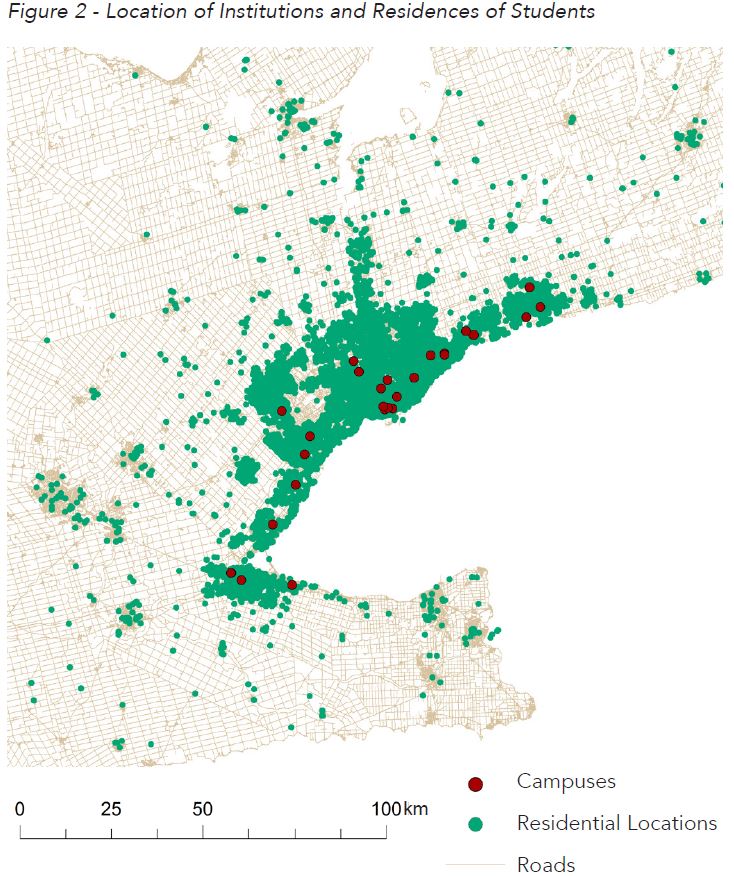
The overall location of students and the institutions they attend is shown in the map below.

Some people commute a very long distance to school in much the same way as many commute to work. Post-secondary institutions, however, are not clustered in a few nodes such as King & Bay Streets, but are scattered around the region.
The map above does not show campuses of other institutions that did not participate in the survey. Those located outside of the south-central part of the GTHA have commuting issues of their own.
Continue reading