Service on several bus routes will change on March 27, but overall the amount of service operated is almost unchanged from the February 13, 2022 schedules.
There is no change in subway service, and the only planned changes for streetcars are those beginning in early April for reconstruction at Dundas West Station.
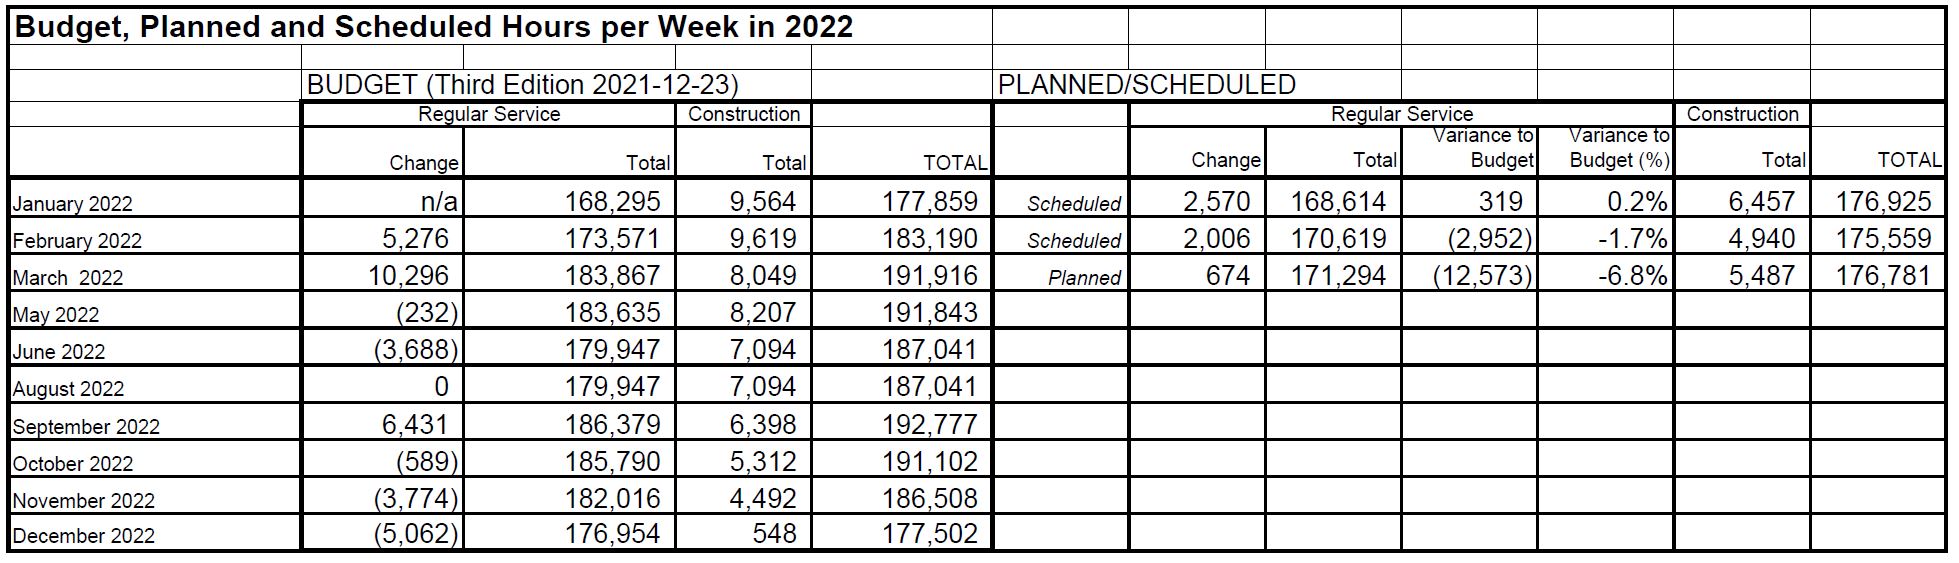
The table below shows the budgeted overall service expressed as weekly operator hours compared with the scheduled and actual values. It is clear that the budget planned to ramp up service substantially by late March, but with the less-than-expected ridership recovery thanks to Covid, this has been deferred.
Planned regular service for the new schedules is 6.8 per cent below the budgeted level. Construction-related service is also below budget, but this has somewhat less effect on the operating deficit because much construction service is funded through the associated capital projects.
The next round of schedules will take effect in mid-May, and by that time the usual seasonal cutbacks start to kick in. We will not really see the degree to which the TTC ramps up to budgeted service levels until September. As a point of comparison, the budgeted regular service in January 2020 pre-pandemic was just under 186,000 hours/week.
Many routes will see a mix of service cuts and improvements through reallocation of hours and vehicles between periods of operation. Some “reliability” improvements involve longer travel times and layovers than in current schedules often with wider scheduled headways (the time between buses). Some of these routes will become candidates for a comparative analysis on this site of before and after service reliability later in the spring.
An important change for the March 27 schedule period is that the number of “biddable crews” (work that is scheduled but for which no operator is pre-assigned) has been reduced from about 160 to 55. This reflects an improved balance between operator staffing levels and the scheduled service. These crews are filled on an overtime basis, or possibly by spare operators or re-assigned “run as directed” (RAD) buses. When these crews are cancelled, this translates into service gaps unless the remaining buses on affected routes are adjusted to run on a wider, but even headway. This has been a pervasive problem on some routes as shown in recent articles here about service reliability.
The number of RAD crews will increase notably on weekdays from 53 to 75 8-hour crews. These buses are used to supplement service, and they also serve as shuttles for service interruptions and subway shutdowns.
Continue reading