
Updated December 9, 2021 at 6:20 am: A reader noted that of the range of articulated buses used as a comparison sample, one vehicle (9003), has been retired. The stats have been updated by adding 9025 to the range so that both the hybrid and artic samples contain the same number of active vehicles. Charts in the article have been updated as well as the linked PDF versions.
January 9, 2022: The follow-up article containing data for January to December has been updated with charts containing all of December 2021. The charts in this article contain only data for December 1-7.
The TTC is about to award one or more contracts for buses in the coming months including 300 conventional hybrids and 300 battery eBuses.
Although they have been conducting a head-to-head comparison of vehicles from three vendors for some time, they have not published results for each of them separately. Moreover, it is not clear the extent to which this comparison will inform the purchase for two reasons:
- Vendors may claim that their newer buses are better than the ones the TTC is testing.
- Some vendors’ products were not in the trial because they did not have a vehicle meeting TTC requirements at the time of the request for proposals.
The TTC eBus fleet consists of 25 buses from each of New Flyer and Proterra, and 10 from BYD. The original plan was for this order to be split equally among the three vendors, but BYD could not deliver their buses on a timely basis, and part of their “share” was divided between the other two vendors.
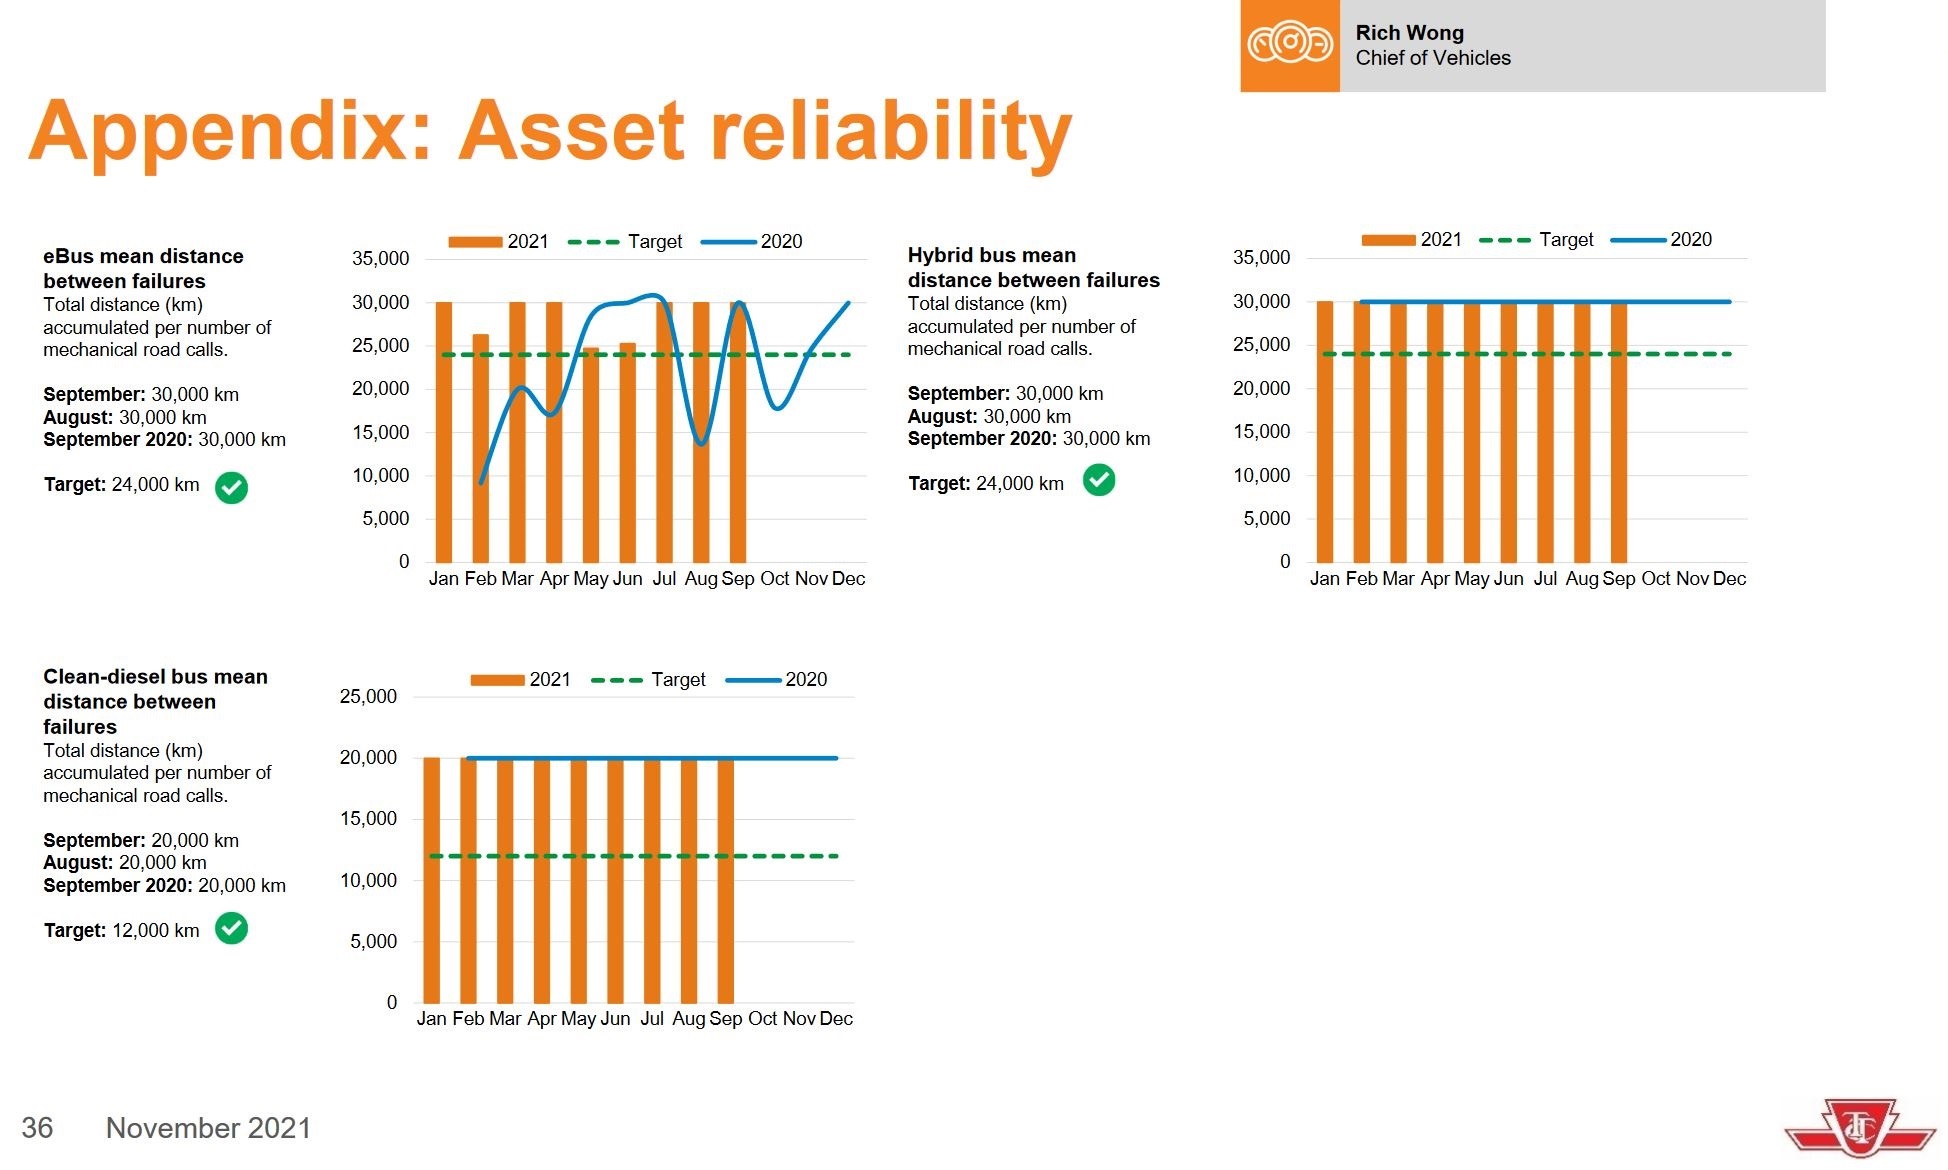
The TTC CEO’s Report includes stats on bus reliability measured as the mean distance between failures.
There are two major problems with these charts:
- The values reported are capped, and we have no idea how far above the target lines the month-to-month values actually reach. If one class of buses is substantially more reliable, but this is not shown due to capping, then it is impossible to make a valid comparison.
- Buses that never leave the garage do not contribute either to accumulated distance nor to breakdown counts. “Problem” buses could be sidelined because the TTC has lots of spares, and the stats for the working buses would make the group as a whole look better than it really is.
Methodology
In an attempt to get a handle on the actual use of the eBus fleet, I turned to vehicle tracking data. If a bus is regularly in service, it will appear in the tracking data, and it will not be simply sitting in a garage.
For this purpose, I used the trip tracking function on Darwin O’Connor’s TransSee website to find out where the eBuses spent their time for the past six months.
For comparison, I also pulled data for the month of September for 25 hybrid and 25 articulated buses. These buses date from 2018 and 2013 respectively.
From the trip reports, I extracted the vehicle number, date and time of the observation, and recorded the hours in which each bus was “seen”. Although this is vulnerable to missing tracking data (such as during the recent TTC cyber outage), any such effect is across the board and does not affect comparisons between vehicle types.
On a summary basis, each vehicle could be seen in 24 hour every day over the period. The number of observations is a broad indication of how much the bus is used. Also, the total number of buses used within a specific hour, broken down by type, shows the patterns of each fleet’s usage and the proportion of the fleet that was active during each hour.
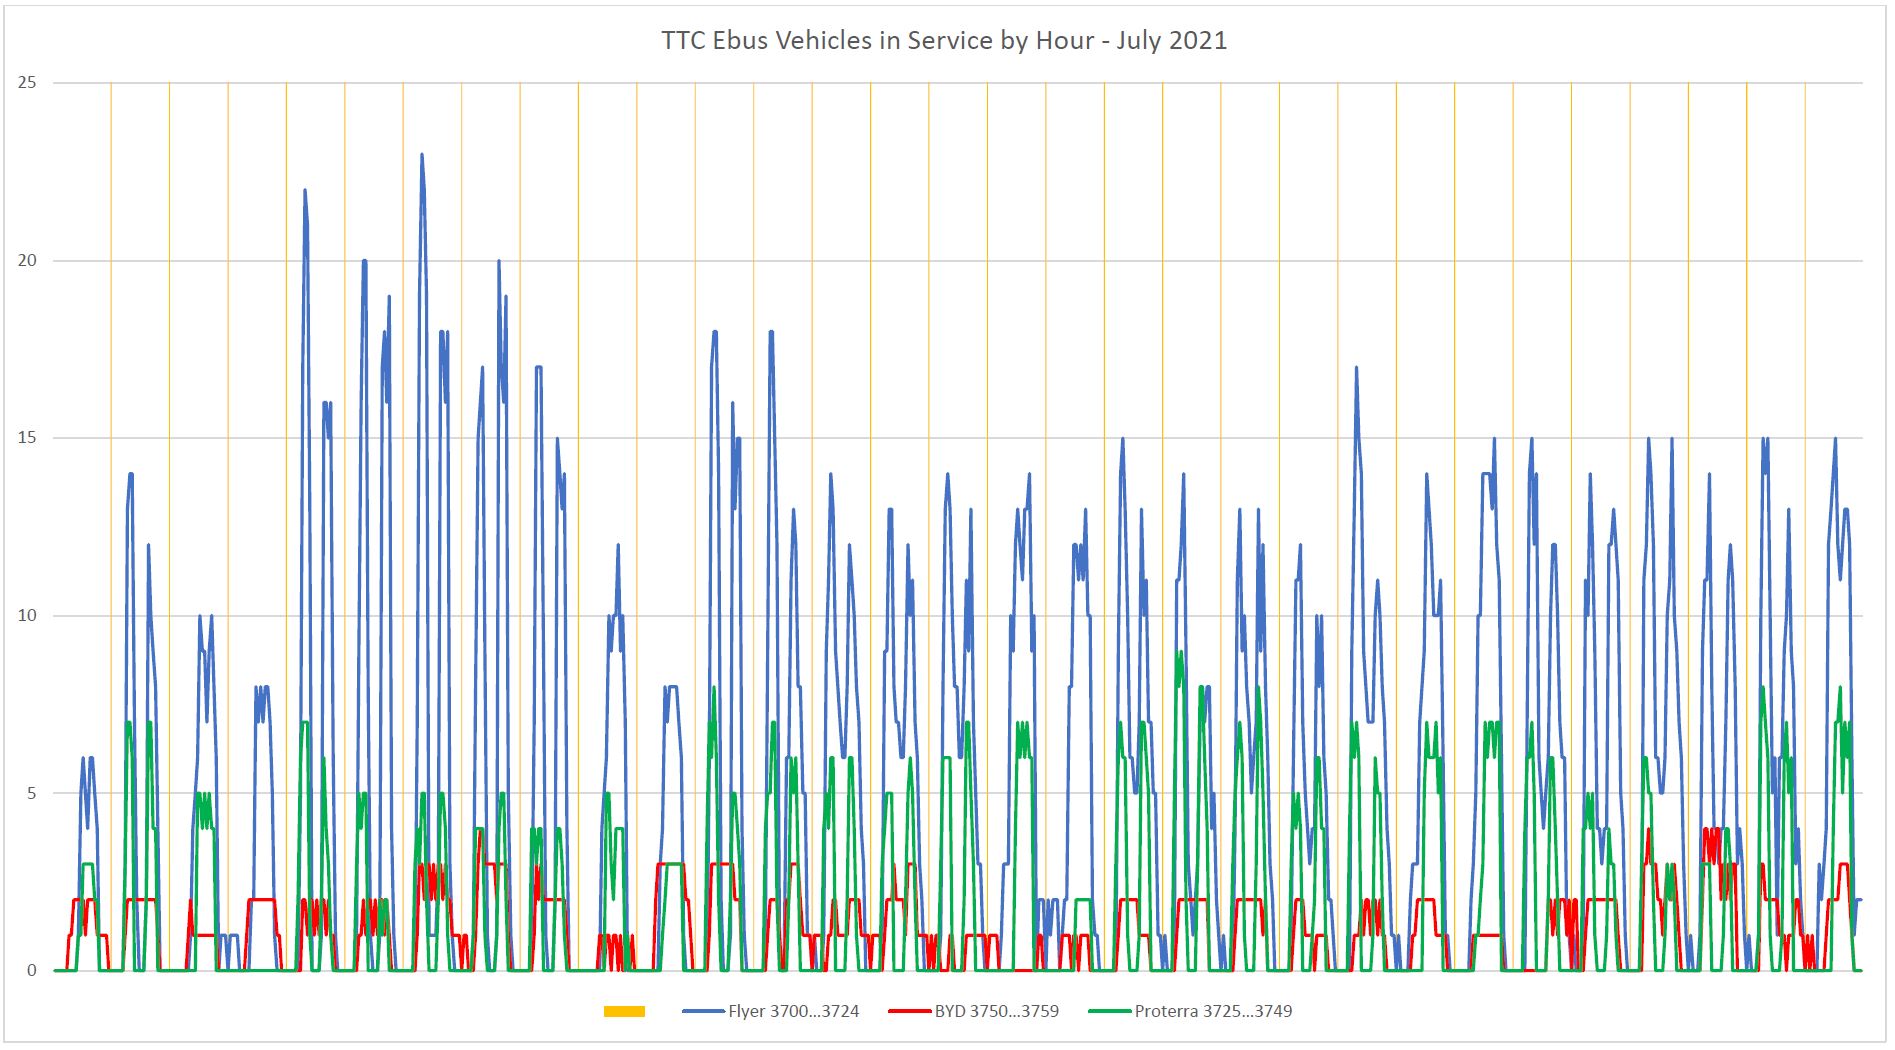
July 2021
Here are the data for July 2021. Each vertical block separated by yellow lines is one day. The data for each group of buses is colour coded.
A few points are quite obvious here:
- The Flyer bus fleet was much more utilized than either the Proterra or BYD fleets, and at times over 80% of all Flyer buses were in service (20 out of 25). Proterra never fielded more than 9 of 25, and BYD never got beyond 4 of 10.
- There is a distinct pattern of double spikes in the usage on weekdays which typically have a higher total number of vehicles. This shows that many (and on some days all) of the eBuses did not stay out through the midday, but returned to their garage. On weekends, usage of Proterra and especially BYD buses was very low.
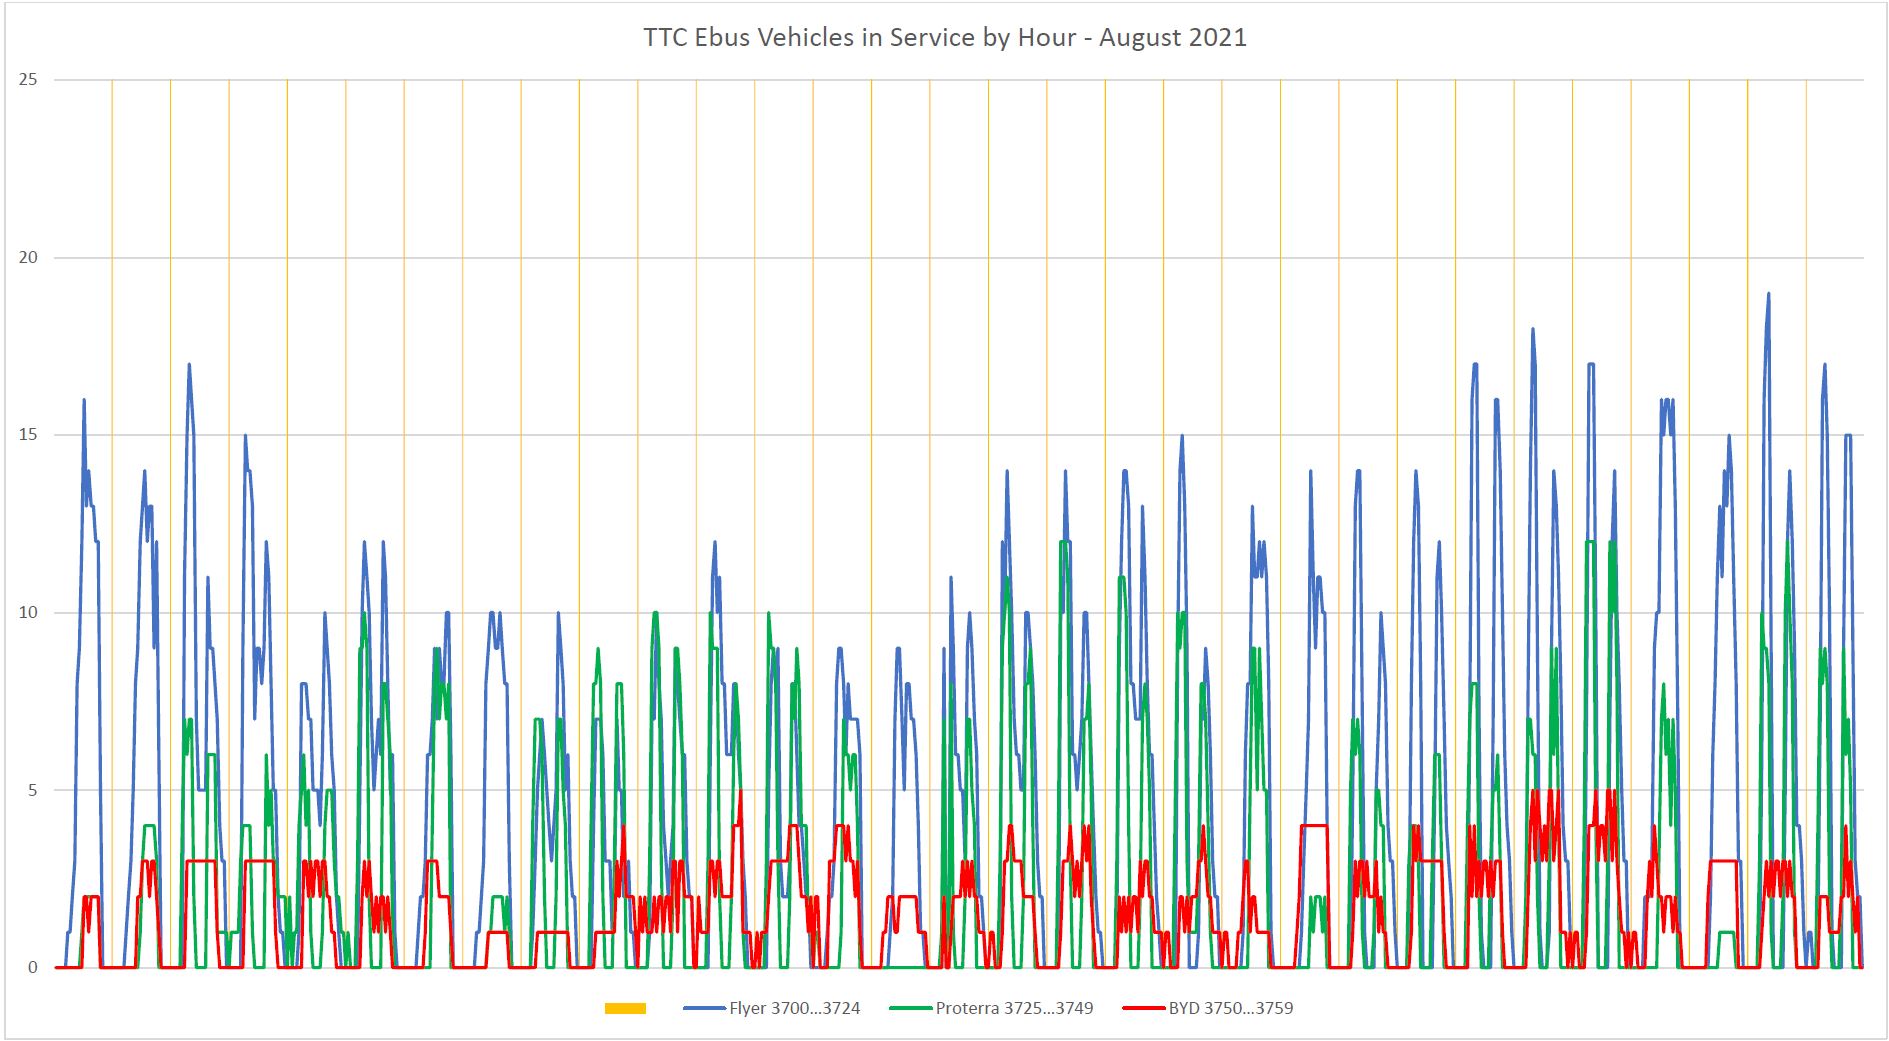
August 2021
In August, the usage of the Flyers fell, but still remained above the other two fleets which made modest gains in the number of vehicles used.
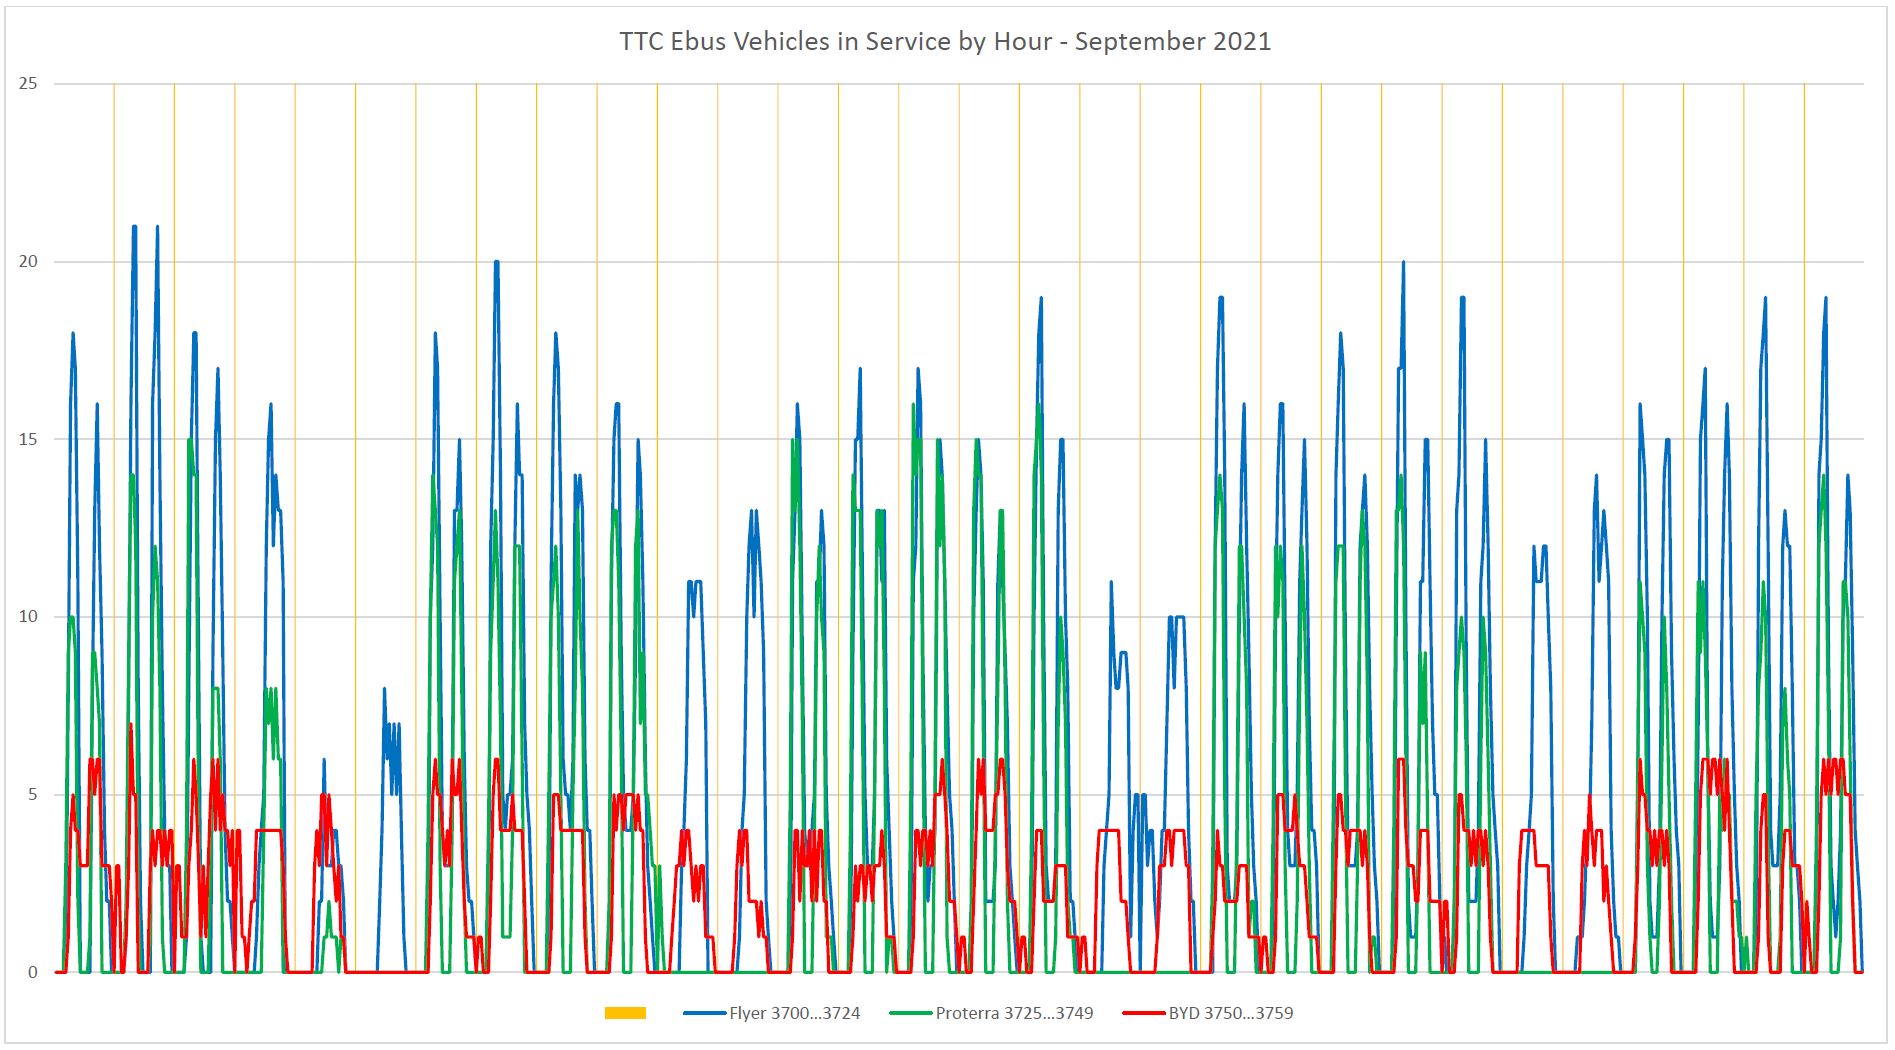
September 2021
During September, Proterra usage increased considerably although it remained lower than the Flyers, and these buses only operated on weekdays. BYD also improved with 5-to-7 buses in service on some occasions, although not for very long.
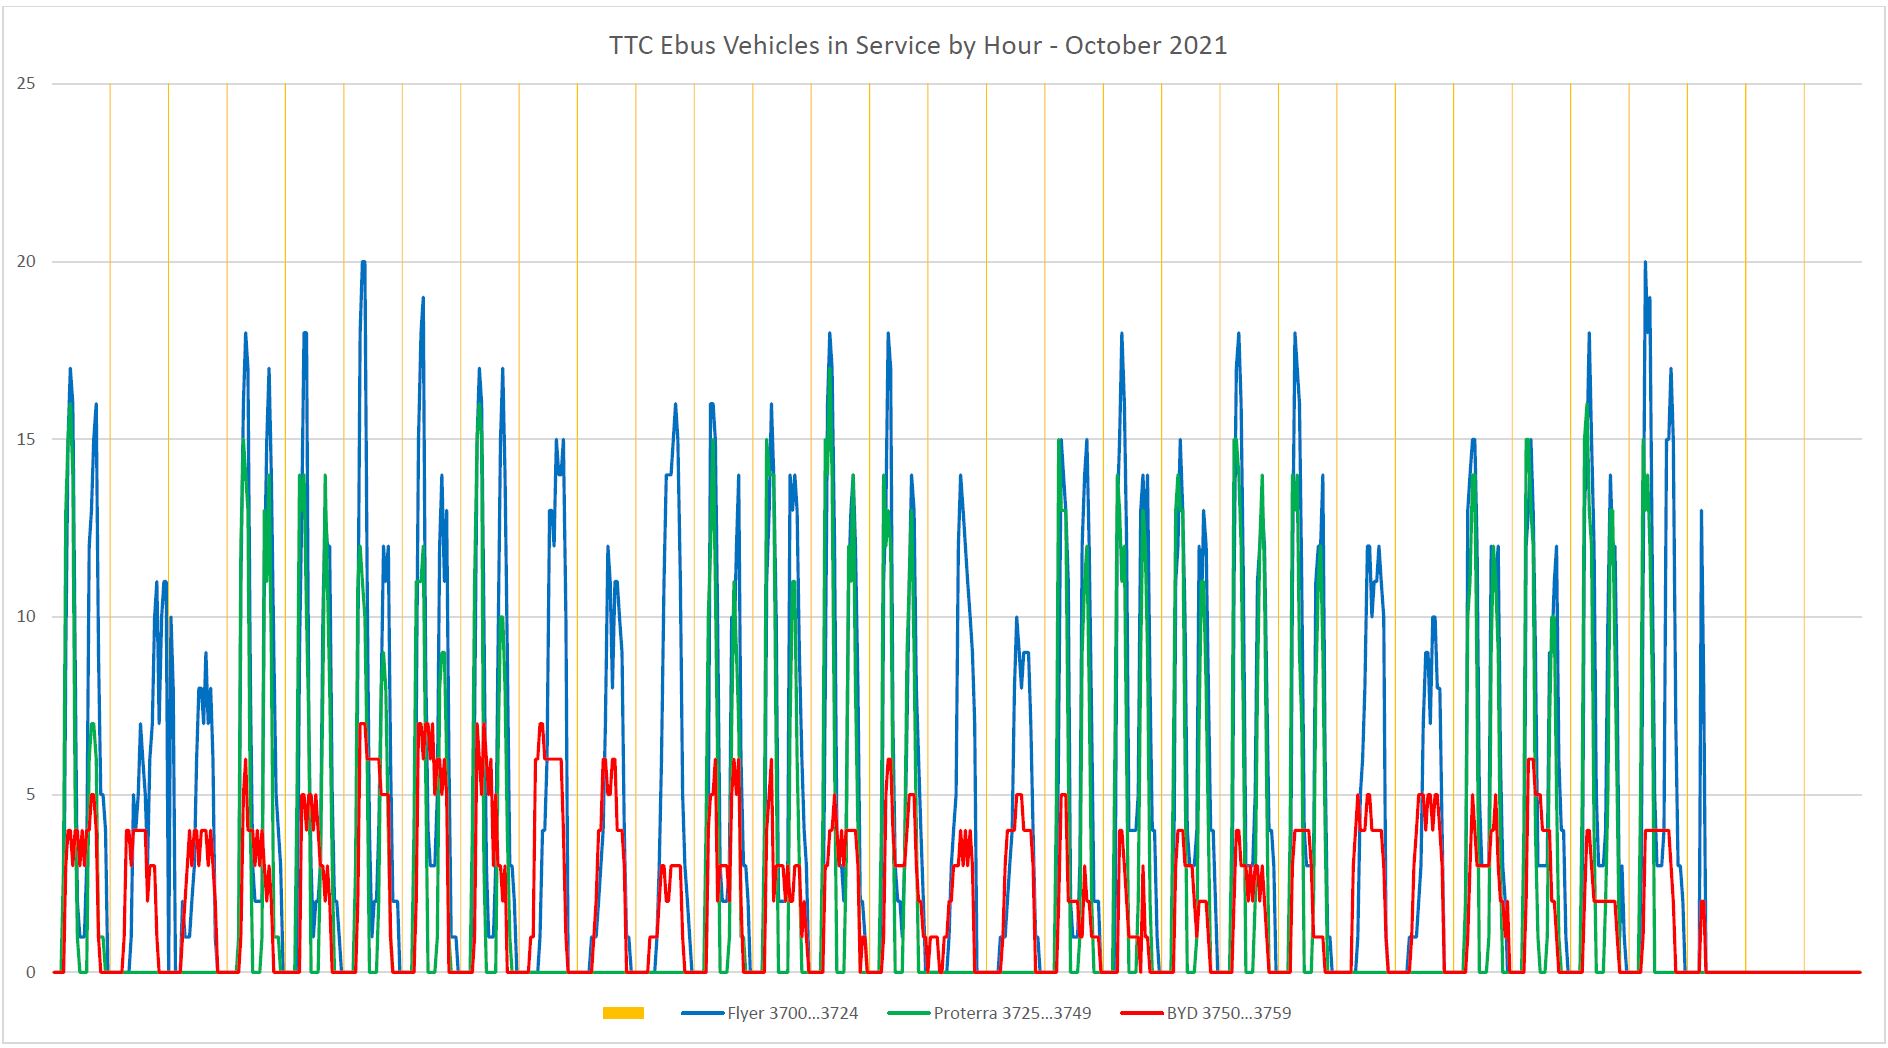
October 2021
In October, there is no data beyond early on October 29 due to the cyber attack on the TTC. The overall pattern in September continues.
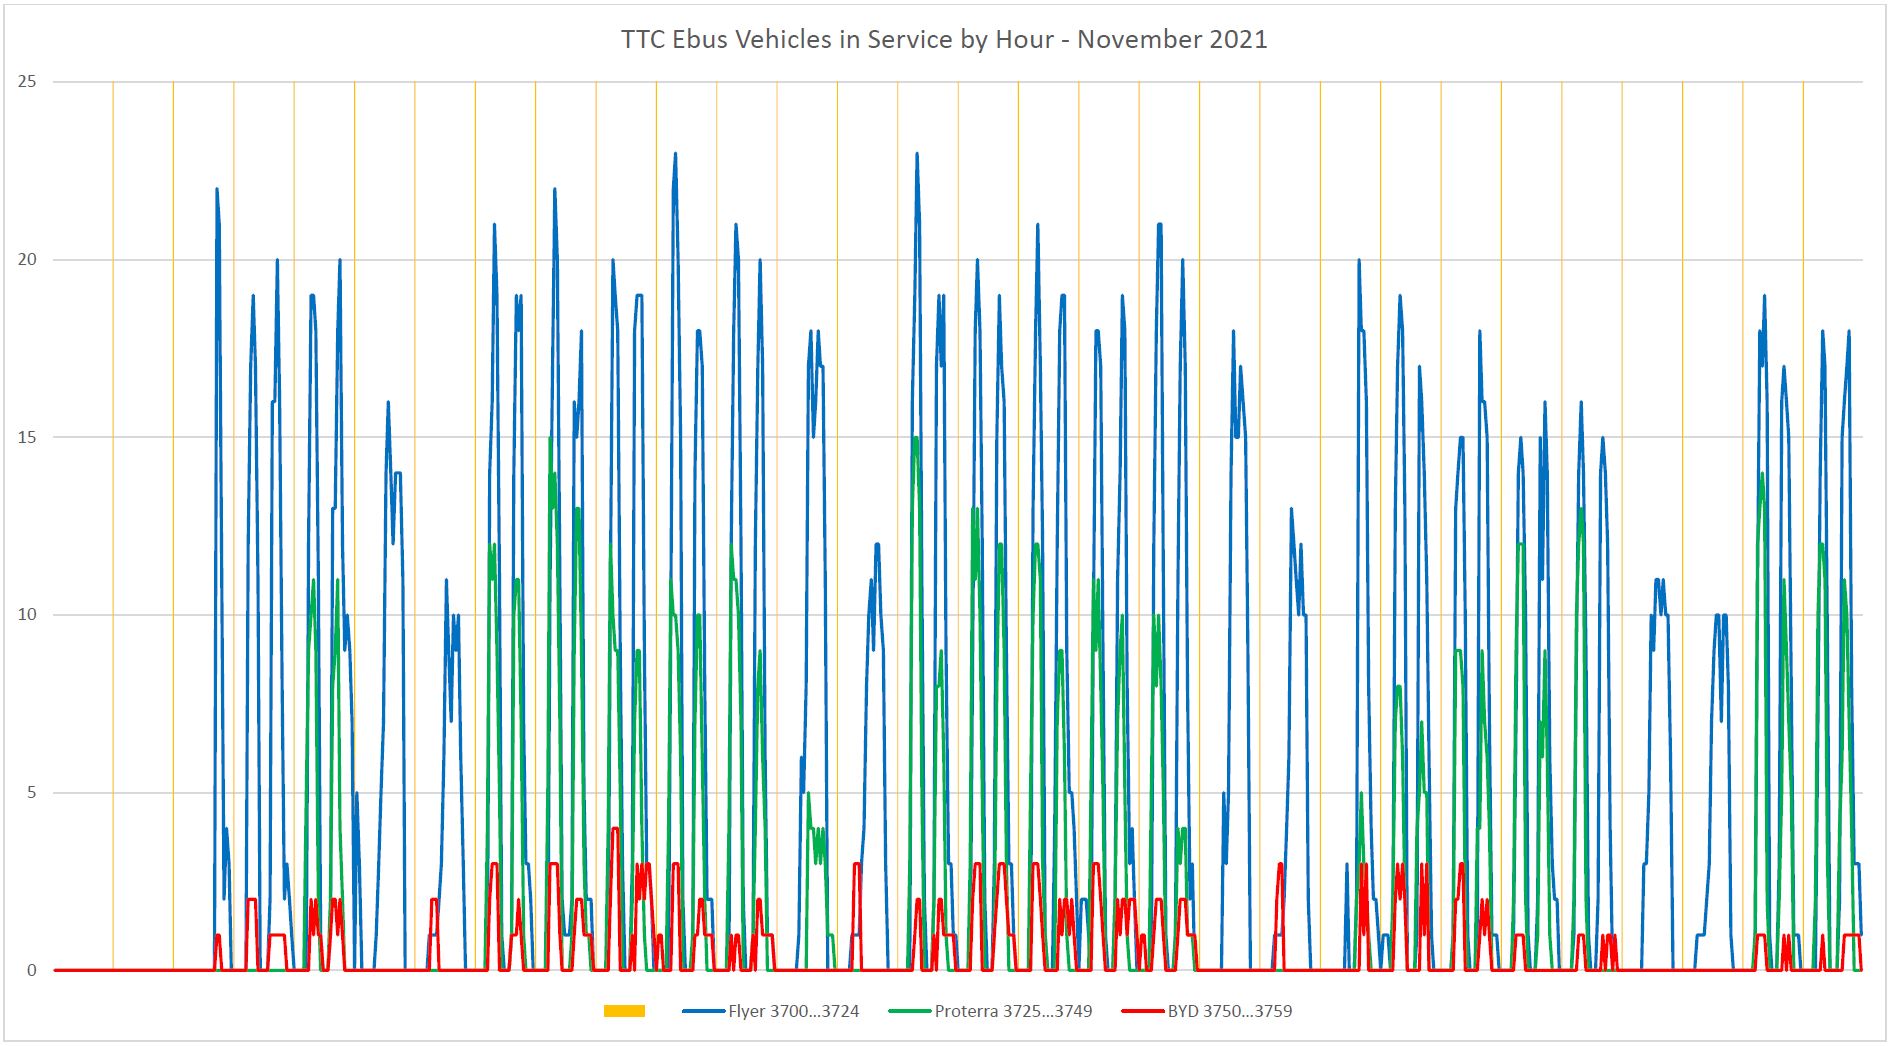
November 2021
In November, data do not begin until a few days in, but the data values have also changed. The usage of Proterra and BYD vehicles has fallen off substantially, especially for the BYD fleet, and weekend operation is almost exclusively with New Flyers.
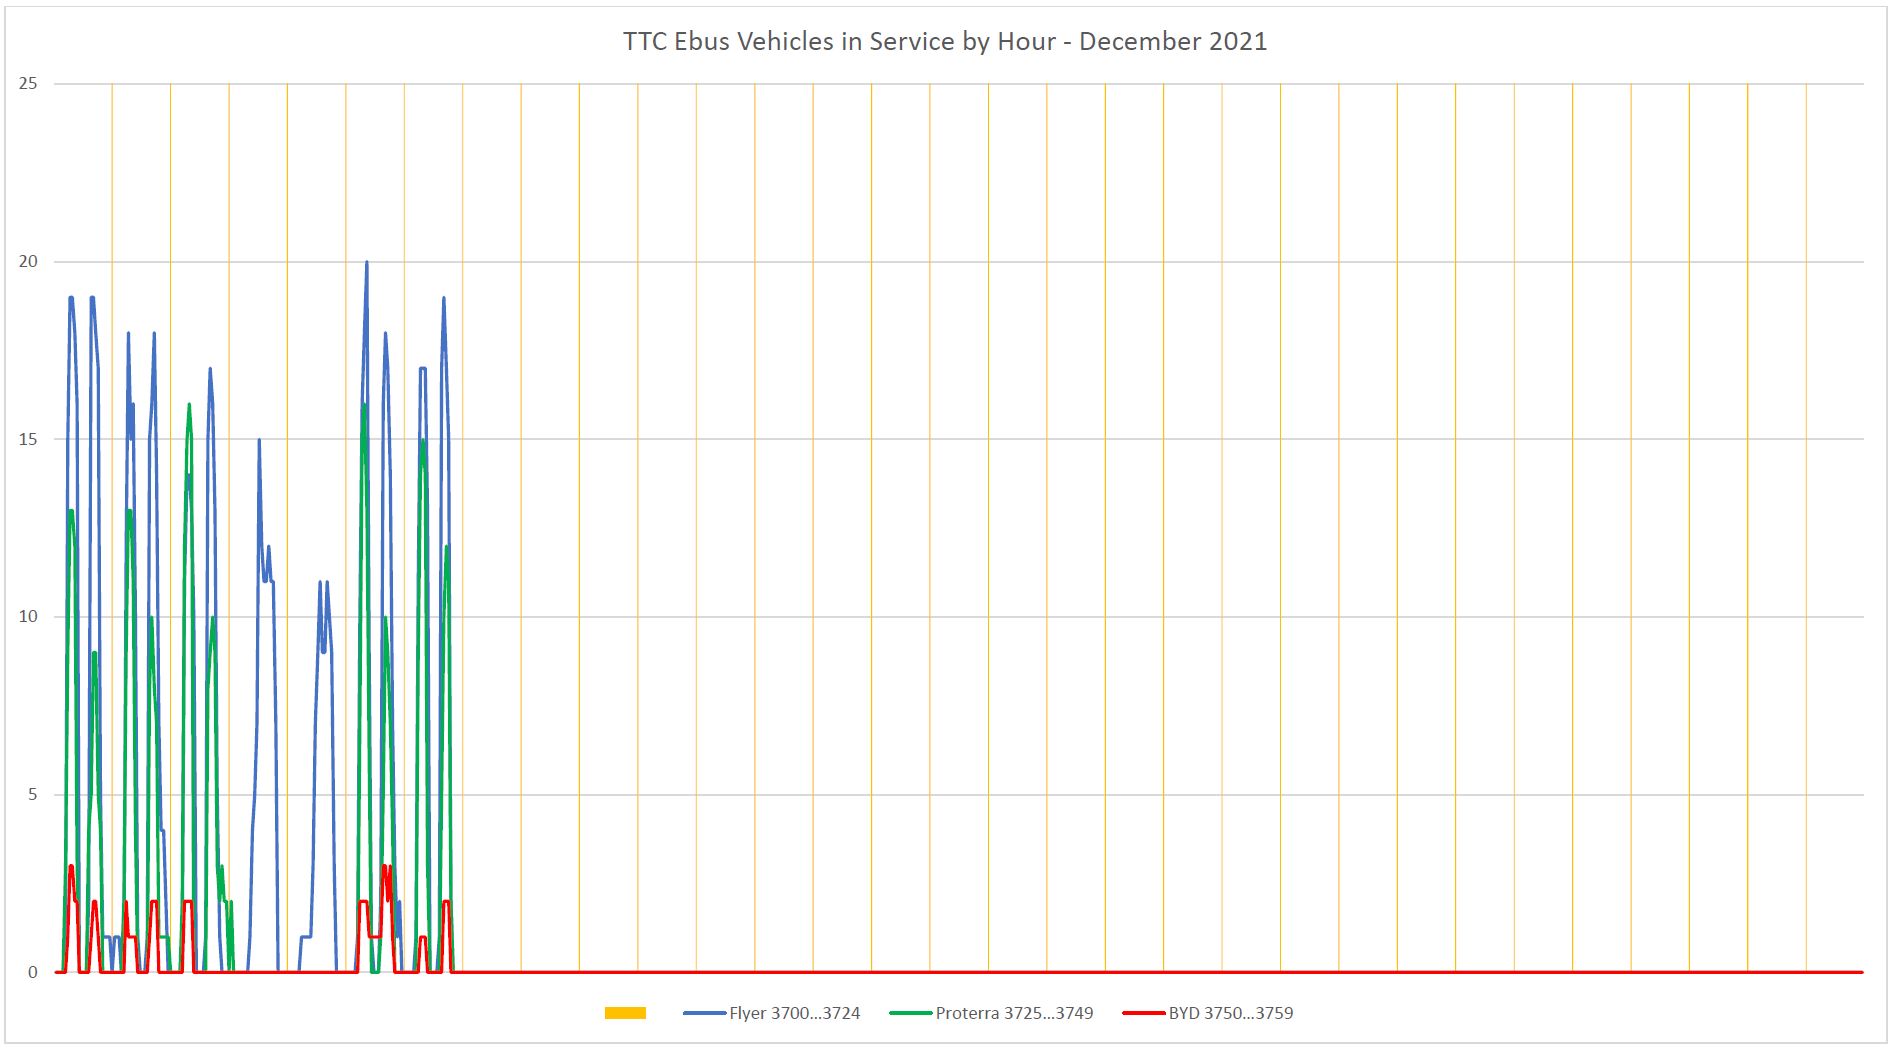
December 2021
December has only just started, but the data so far continue the November pattern.
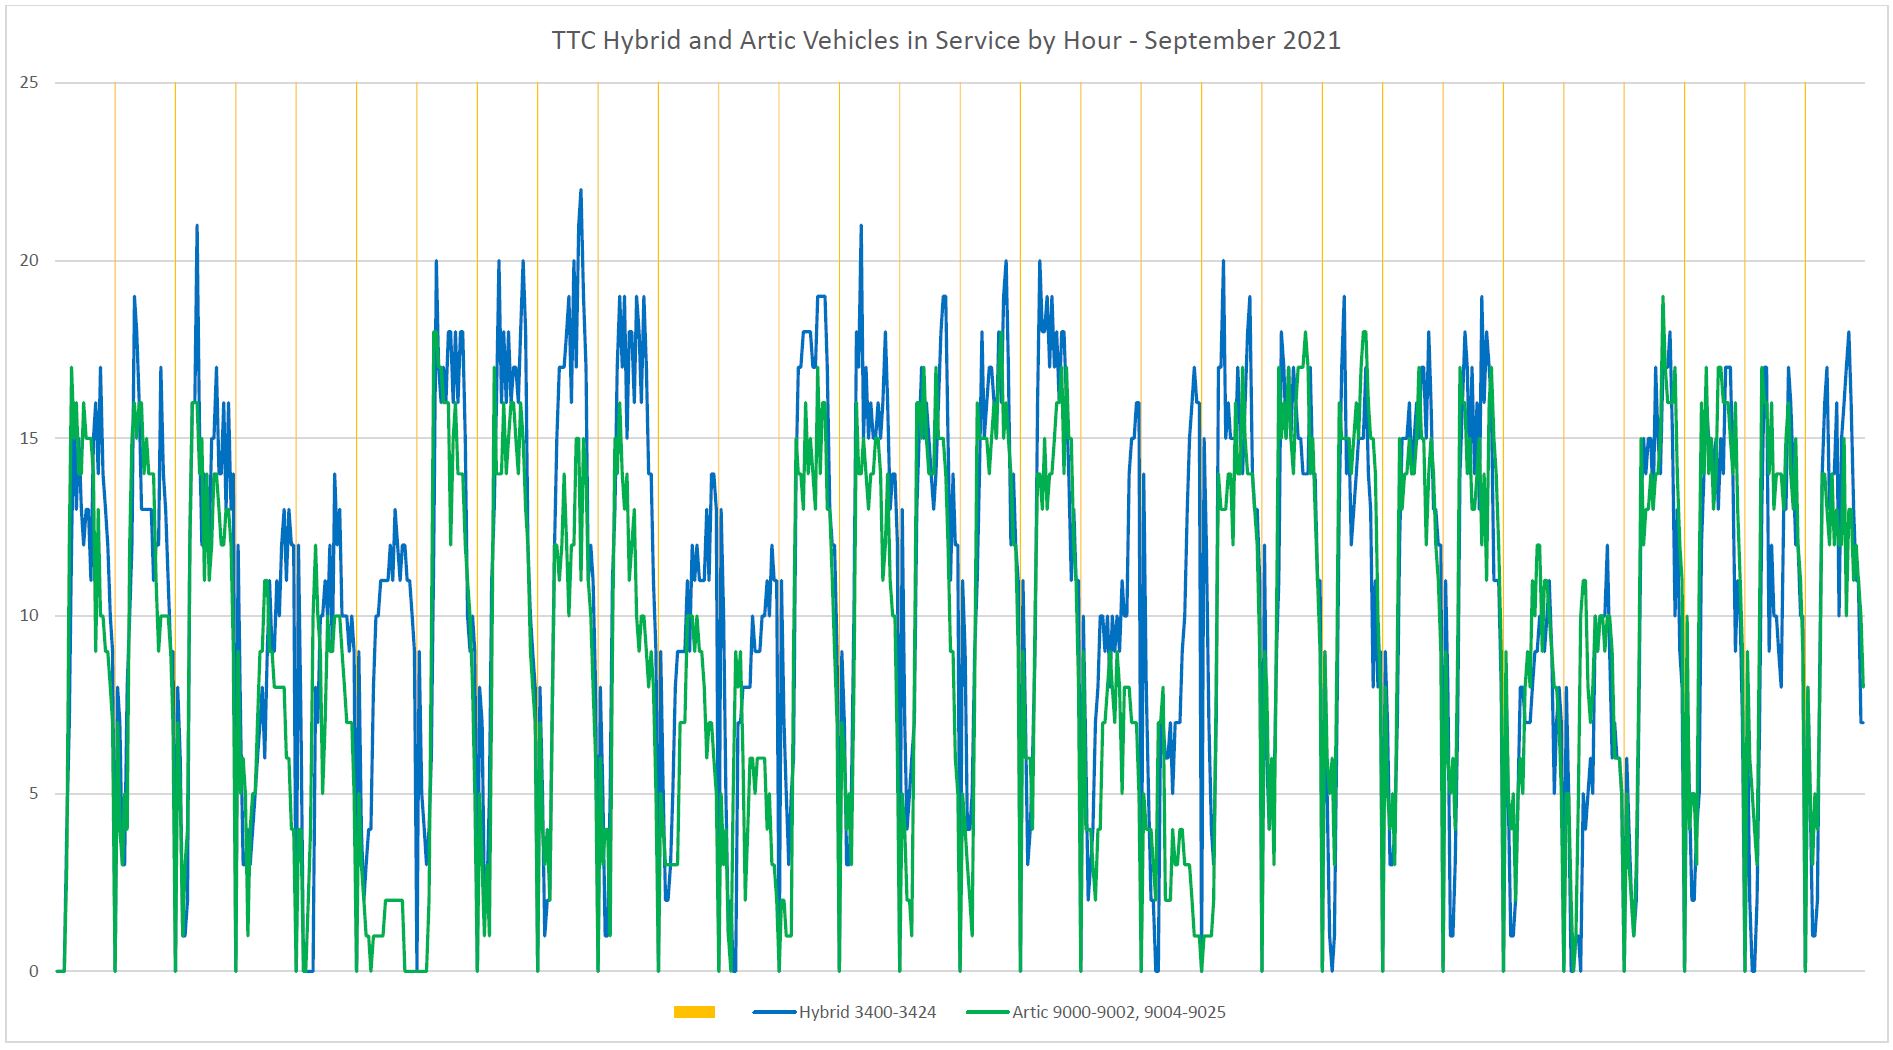
Hybrid and Articulated Buses
Updated: These charts have been updated to use 25 active artics. 9003 (retired) has been replaced by 9025.
By comparison, here are data for two groups of 25 buses from the hybrid and articulated fleets in September. The usage pattern is very different from the eBus fleets with vehicles tending to stay out all day rather than returning to their garage.
Overall Fleet Usage
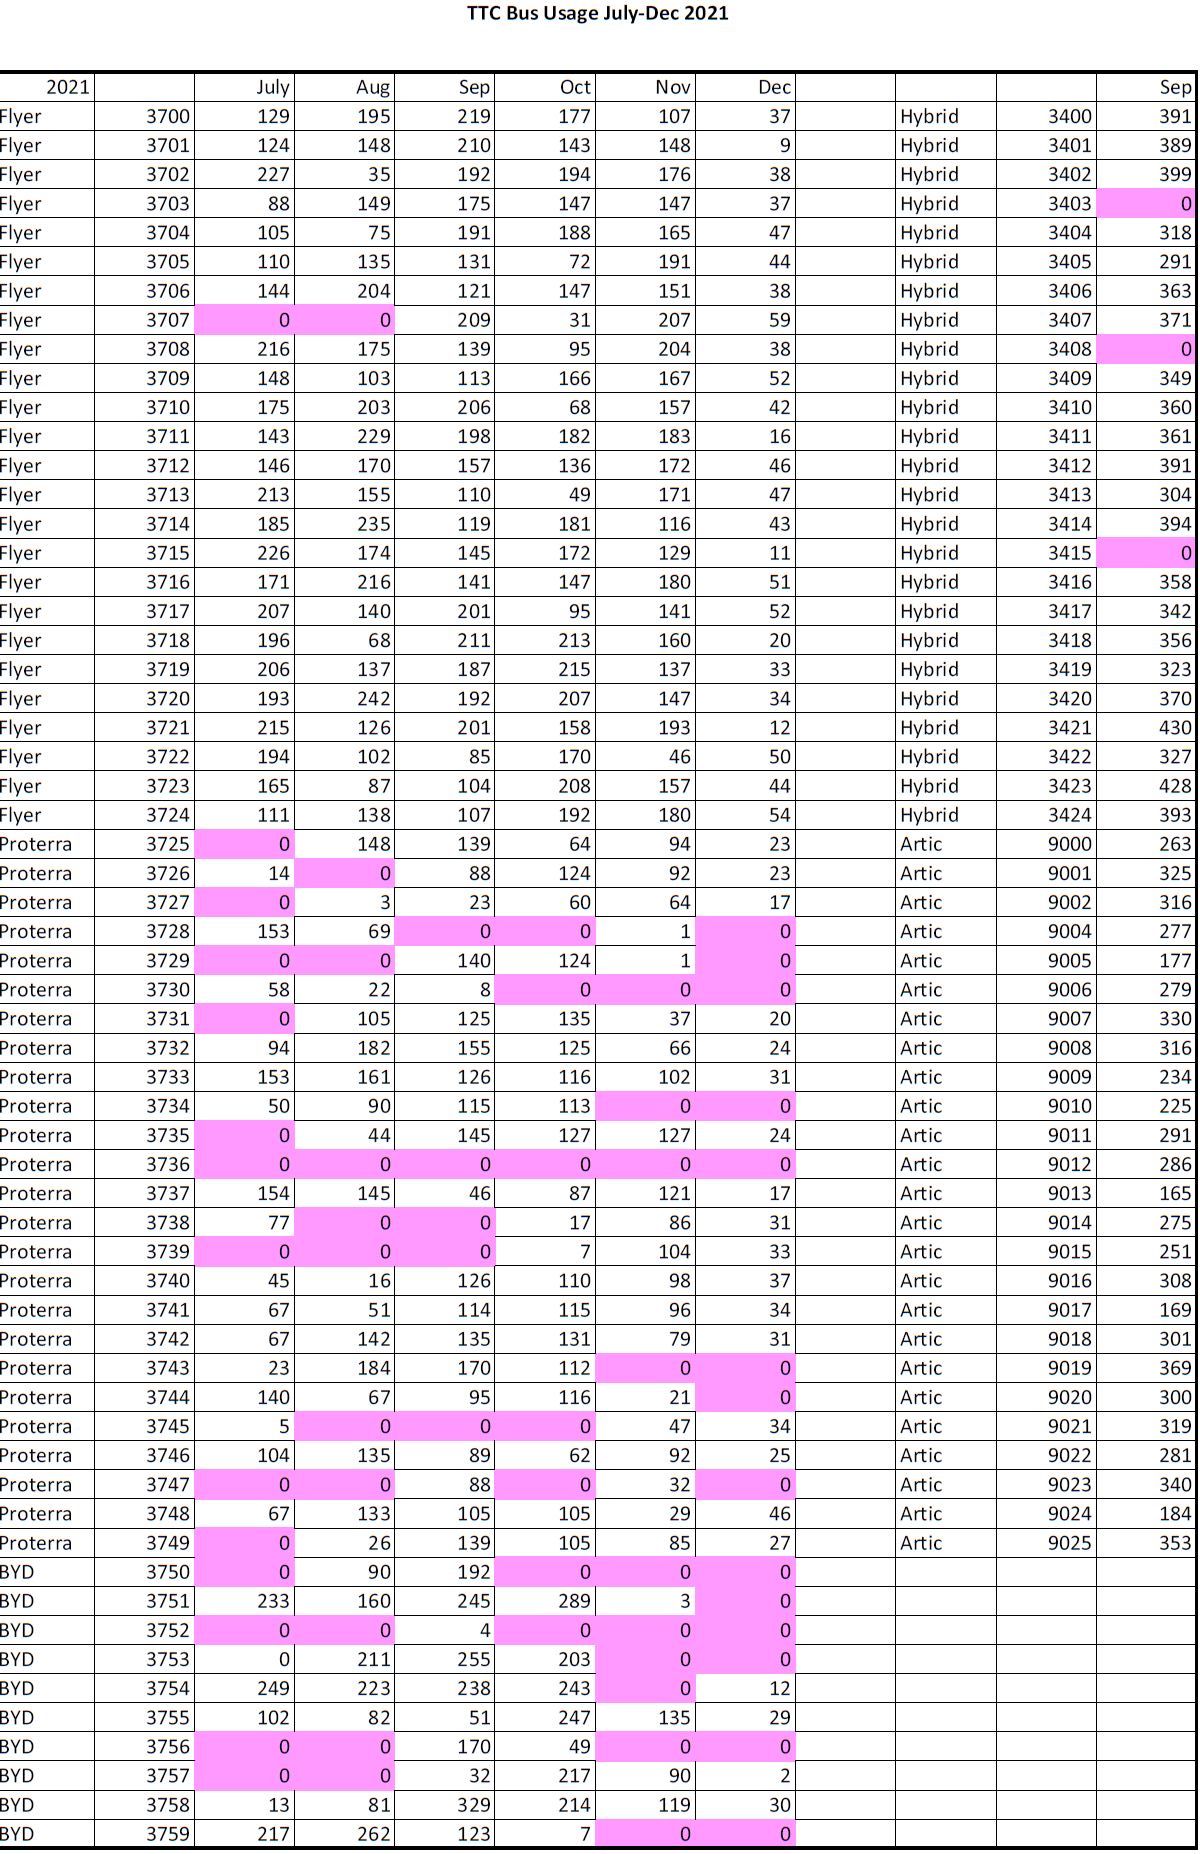
The table below shows the number hours in which each bus was tracked in service. Data are shown for the eBus fleet for July to December, and for a selection of diesel buses for September.
Cases where there were no observations are highlighted. These indicate vehicles that were out of service for an extended period. This has been a problem for both the Proterra and BYD fleets, and the usage of these fleets declined in November and December.
The numbers for the hybrid and articulated samples are much higher showing that the TTC gets more service out of these vehicles than from the eBus fleets. For ongoing service, the utilization of eBuses must improve to avoid a situation where total vehicle requirements explode with no growth in service.
The choice of new vehicles will be important, and the TTC should not be buying less reliable vehicles just to be “green”.
PDF Links
The charts in this article are available as PDFs below.

Do we know what routes these electric buses were used on? The range issues suggest they be used on shorter, “calmer” routes like 23 Dawes versus long intense routes like 54 Lawrence East. Not to mention use on long routes will likely increase costs by requiring the vehicle schedules that have blocks more than, say, 200 km of driving to be reblocked.
And, not sure how the TTC measures reliability, but at the mid size transit agency where I work in the US the miles between roadcalls for our electric and hybrid buses is more like 4,000 miles / 6500 km per roadcall. So I am dubious of those reliability numbers.
Steve: I have the names of routes the buses were on, but have to figure out a way to present them in a compact format. Stay tuned.
As for reliability figures, I cannot help thinking that TTC is goosing the numbers and presenting them in a way that makes the eBuses and hybrids/diesels look comparable by chopping off the top of the charts. Also, I think there is a lot of under-reporting, particularly of in-garage failures that never show up as a road call.
LikeLike
Reading this, I’m wondering why TTC isn’t just ordering New Flyers? Andy
Steve: Because BYD has busy lobbyists.
LikeLike
This is bloody fantastic. I can’t imagine this work was very easy, but boy does it paint a clear picture.
The cynicist and pessimist in me want to joke that, naturally, the TTC will place an order for BYD…but the optimist hopes they find the solution as obvious as you’ve made it, that New Flyer is the only way to go. I’m partially biased too because NF is Canadian, but those stats don’t lie – they’re the obvious choice!
I wonder if the midday rest is for charging or maintenance. They seem to be running only the AM / PM peak on weekdays, and only the midday period on weekends…which suggests they only last so long without a charge up. Not good, not good at all…
…though I suppose given the TTC’s propensity for owning *notably* more buses than they can actually drive, having a huge set of charged “spares” to take over and keep a basic service level all day wouldn’t be too far of a stretch…sigh.
Steve: Thanks. It wasn’t too hard to pull together once Darwin O’Connor at TransSee put me on to a query (available in the “premium” version of the site) that can pull historical lists of vehicle trips. Then it was a matter of scraping the output for the data I wanted and figuring out a way to present it.
There have been comments at a previous TTC Board meeting about charging on route, but they are still sorting this out, and they have talked about building schedules around the vehicles’ capabilities. It will be interesting to see what the operating cost implications will be.
I am sure that the technology will have a place and will mature, but it has been oversold in the short term because everything must be “green” these days even though transit’s biggest contribution is as an alternative to driving.
LikeLike
Very concerning situation. Ottawa is about to find out although with only 4 New Flyers so impact will be minimal. In a recent post you mentioned that the TTC managed to hoodwink the board to buy an extra 100 buses that they are [not] using. Are they keeping those buses “fresh “ in reserve in case things go south with the ebuses? That probably requires foresight management doesn’t seem to have though.
Steve: Having far too many buses is a major problem for any transit system because they can get lazy. I am tempted to start combing through the tracking data for the entire fleet to see which buses have not turned a wheel in a while.
LikeLike
I would have been happy to generate a custom query to make extracting the data easier. I know it was not without its problems.
Here is the trips by route for the New Flyer battery buses since July 1:
LikeLiked by 1 person
It would be nice to get full reports from the TTC with more detailed information about what’s going on. Is there maybe a training issue in that drivers need to be trained on the Proterra and BYD before driving them, so there can be a shortage of drivers for them whereas there’s already a ton of New Flyer drivers? Proterra regularly brag about how reliable their electric buses are, but that doesn’t match this data at all. Surely, other cities would have reported problems if half the buses were broken down all the time. Philly did scrap their Proterra buses over a dispute about whether cracks in the carbon fibre were structural or not, but Edmonton has a large fleet of Proterra buses, and I haven’t heard any negative reports from them. I don’t know about BYD. I’ve read some reports about their chargers being unreliable, so some truckers couldn’t charge their electric charge fleets, so they had poor utilization. Of course, their newer buses can use non-BYD chargers, so that might improve things. Unfortunately, I think BYD may be pretty aggressive with their pricing, leaving little money available afterwards that can be spent on providing good aftermarket service. The new Lion Electric buses will have Canadian battery packs, so they’ll be more Canadian than even the New Flyer buses, but they are still so new that I’m not sure whether their gear can be trusted or not. And, of course, Nova Bus will hopefully have a long range electric bus by then.
There might be a battery shortage over the next year or two, so the prices might go through the roof, so right now might not be the best time to lock in prices for large, multi-year contracts on buses. Then again, the phase out of diesel is coming closer and closer, so maybe it’s better to start the process earlier rather than later.
LikeLike
Very interesting data sets. And unless there are some unforeseen issues, New Flyer is the obvious choice. But this is still a new technology.
Points have been made about battery availability, charge rates and battery charge/mile in both hot and cold conditions and other issues such as charging infrastructure and possible en-route charging.
With the current set of e-Bus test vehicles, even the TTC will admit they cannot handle a full shift on the longer and hillier routes.
There is an obvious solution, but it is not flashy or new. Good old Trolley buses. With overhead wiring, you always have a charge, no need for charging stations anywhere, length of route and gradients do not matter. This a mature, reliable, proven technology.
The TTC can pull records from their own files to show the actual costs of using trolleys in this city – update for 2022 dollars and you have a ready comparison of value for dollar.
It seems simple, any route anywhere, a minimum of spares, mature, proven tech, and yes it is green.
Steve, do you know if any entity has proposed trolley bus tech as an e-Bus solution, or is everyone stuck on only battery e-Bus solutions? Or would this be outside of the “electric” bus trials mandate?
Steve: The focus overwhelmingly seems to be on battery buses with spot recharging. If TB overhead were used, it would be for charging while under wire, not as a full TB system. A related issue is the level of service on a network and which routes would lend themselves to TB operation with only limited off-wire capability, as opposed to having many charging stations at which buses with a smaller battery pack could recharge regularly for short periods.
LikeLiked by 1 person
Artic bus 9003 hit a pole in an accident and retired. So that’s only a comparison with 24 artics.
Steve: Thanks for flagging this. I have updated the charts replacing 9003 with 9025.
LikeLike
Have you ever been to a garage for actual day up day operation. All this info seems to cohere from sitting in at home while searching the internet. You really do not have any sense of the actual reliability of e buses and what their actual mileage range is.
Steve: There are two basic issues here. I cannot sit inside garages for months on end collecting data, but it is extraordinarily simply to pick up the tracking data to see what the buses actually do. There is a stark difference between the three fleets, and that was primarily what I sought to learn with six months’ data. I could have pulled more, but do not expect it would change the results. There is also a big difference in the utilization of eBuses versus diesel hybrids and artics. The TTC itself has noted that schedules will have to be modified to suit the actual range and performance of the eBuses.
Second, the TTC has not published any stats of its own showing the relative performance of the fleets, and frankly I am worried that “the fix is in” for a manufacturer whose products are less than reliable. For ten or twenty buses, this is not an issue. For 150 or 300, it certainly is. There is a related issue that if only part of the fleet is even in service, the TTC stats do not reflect the out of service buses.
If you can prove with real info that my stats are wrong, be my guest. Otherwise I will treat you as yet another incarnation of an eBus fan who leaves really trashy comments on this site.
LikeLike
Another excellent analysis. Thank you, Steve!
What is disturbing is that TTC management has people who, unlike Steve, are paid to do analysis. When an unpaid amateur in his spare time is outperforming the paid professionals there are two alternatives. Either TTC personnel are grossly incompetent or else TTC management tells their people to not do this type of analysis because they do not want to know the results.
I am inclined to go with the latter explanation because the TTC has a lengthy history of doing just that. They do things like playing games with their “dashboard” so that their numbers look good even when their service is lousy. Or never, ever, ever on any of their passenger surveys asking the question, “Have you been sexually touched while on the TTC?” Sexual groping is a huge problem on the TTC whose way of dealing with the problem is ignoring it.
With regard to capping the hours, I see that the ebus and hybrid were capped at 30,000 km and the diesel at 20,000 km. The only way this makes any possible sense is if those buses are on a maintenance schedule of 30,000 or 20,000 km so that the buses are automatically pulled out of service at those km for comprehensive maintenance. Then it makes sense to cap the MTBF at those km.
Steve: You’re quite welcome!
It does not matter what the servicing cycle is for the buses. An in service failure has far more impact on riders than a bus that’s off the road for scheduled inspection and repairs. Indeed, uncapped numbers might reveal that the servicing is doing its intended job by giving long MTBFs thanks to preventative maintenance. But we have no way of knowing, nor of comparing various subfleets, because the data are consolidated and the actual values are not reported. Moreover, the number of buses that never leave the garage is not reported at all. If we have to own ten buses to get five that work reliably, something is badly out of whack, and all the apologists for BYD have some explaining to do. We certainly cannot talk about how eBuses will save us money if they are not reliable and we need a bigger fleet to maintain existing service levels.
Quite bluntly, with the results we have seen, if BYD or Proterra get a substantial order (as opposed to another small quantity as a trial to see if their product has improved), I will put this down to a hefty “marketing” budget.
LikeLike
I don’t think you have to be worried about BYD. I’m pretty sure there’s a concerted behind the scenes effort to block BYD from the North American market. Proterra and New Flyer previously successfully lobbied Congress to block BYD from the US market due to “security” concerns over whether BYD’s non-Internet-connected buses would somehow transmit who knows what to China somehow. Canada tends to do these sorts of things in a less ham-fisted way. Contracts that BYD has previously won, like the Newmarket bus contract or the Loblaws truck contract have mysteriously disappeared. Edmonton, which seemed happy with their BYD buses in the past, went with Proterra for some reason. The main organization pushing for electric buses in Canada would only endorse e-buses with a bizarre Canada-only charging standard. Ottawa awarded a no-bid contract to New Flyer.
I think it’s all a little short-sighted. BYD did a lot of pioneering work in showing that e-buses were feasible and pushed New Flyer and Novabus into actually developing e-buses. I think BYD has a lot of new technology and expertise that Canada could benefit from, and BYD has tried to be a good corporate citizen by opening local factories and accepting unionization, etc. But the era of free trade and open competition ended with Trump, so that might just be how the cookie crumbles.
Steve: That may be true, but BYD also engineered, through the Deputy Mayor, a sales pitch to the TTC Board in the guise of a “deputation”, and the camaraderie between their reps was such that one could assume they had won the lottery because the fix was in. The board overall and management were not quite so sure, and the trial was something of a disaster with late deliveries and poor performance. All the same, rumours of their getting a big order persist in spite of a political climate that is not exactly China-friendly. There is nothing in the performance of their fleet to suggest that they should get a big order, and it’s time TTC management said so.
On the technical side, it is my understanding that Flyer and Proterra are using a North American charging standard, not a Canadian one, and BYD now offers a bus using that standard too.
LikeLike
Regarding recharging. Is there any indication a battery bus (each model) cannot make a full days runs? Are they being assigned to partial days only? That is to say AM & PM rush only.
Steve: No they can’t handle a full day. TTC has already talked about the need to re-cut schedules to take their duty cycle into account, and probably to assign them to routes with less taxing demands for power.
LikeLike
The Proterra buses are restricted to weekday garage to garage runs that don’t have any operator switches. You will almost never see one on a run that has an operator switch mid run.
One of the biggest problems with them is the driver’s area. The design is very bad, and it is very tight and uncomfortable. Because of this many ops will request a change off bus if they get a Proterra. This is one of the main reasons why they restricted them to runs that don’t have an op switch, as doing a change off mid run does impact service.
The other reason they restricted them to these runs is because of reliability. They are very unreliable and break down quite often. Having them on shorter runs like that means they are in service less, which means less chance of them breaking down and impacting service.
They often park the broken ones in the Mt. Dennis storage yard, which is an outdoor grass field on the north side of the division. Sometimes they stay in the storage yard for up to a few months at a time before they get sent to maintenance, which explains why some of them have stayed out of service for long periods of time.
The entire Proterra fleet was pulled from service from October 28th to November 5th because of safety concerns with the frames.
As for 3736, that one had an incident back on June 28th on the 941 SB at Keele and Clearview heights. The bus shut itself off while at full speed, and most of the controls stopped working. It is apparently still being investigated and fixed so 3736 hasn’t been in service.
Another interesting thing to note is how many other systems have been having major problems with their Proterra fleets. SEPTA in Philidelphia pulled theirs from service in Feb 2020 after they noticed the frames were cracking, and they have been parked in storage since then. Samtrans in the San Fransisco area retired theirs in August 2021 due to reliability issues. One Samtrans unit (number 0728) only lasted about 5 months in service before retirement. Foothill transit in California has also been having a lot of problems with their Proterra fleet. All 3 of these systems use the exact same model as TTC, the Proterra catalyst BE40.
LikeLiked by 1 person
Brampton is using charging stations in loops for 2 lines at the moment and these are relatively short line compared to Toronto. They are allocated 5 mint to recharge in the loop but the headway so far is 20 minutes most of the time. I would have to see what charging all buses that pull into Finch or Kipling station. Also it would be problematic for routes with on street loops.
Steve: A related problem at off-street loops like subway stations is the number of times a bus will pull up somewhere other than its official bay for a siesta. The design and scheduling are going to have to be site/route specific.
LikeLike
Some further thoughts on recharging battery buses mid-day. If the rush hour extra service were to be battery buses would there be enough time (circa 10AM – 4PM) to get sufficient recharge to do PM Rush then return to garage for overnight full charge?
Another choice would be to setup recharging facilities at subway stations for at least some of the rush hour fleet. Many stations have a small amount of extra space some of which is used by station fare collectors etc. Some stations have Green P parking lots next to them. These could be utilized in two ways. Parking space for fare collectors etc. thus making more room for a few buses to sit on TTC property to recharge. Yet another choice for some locations would be to set up charging on Green P lot and “pay” the Parking Authority for space. Search for empty space next to stations, lane ways, private lanes/parking spaces TTC could lease etc.
The advantage to spreading charging facilities across the city is to spread the power demand and avoid expensive higher capacity power lines.
Steve: Depending on how much capacity you put in a bus, partial charging from time to time has the dual advantage of spreading out the load and reducing the dead weight you have to drag around the city in each vehicle. There was a time when the focus was on overnight charging on the assumption that much would be saved in energy costs. This fails on two counts. First, as a new overnight demand from vehicles and other energy storage grows, power during that period might not be as cheap, relatively speaking, as it is today. Second, there are costs of being able to fully charge a 250 bus garage overnight both on the vehicles and in the charging infrastructure. The TTC has never published a comparative study to establish which approach is better, but has entered into a long-term arrangement with Hydro to build and operate charging facilities at garages.
LikeLiked by 1 person