This is the fifth and final article in a series reviewing the construction effects of the Ontario Line downtown. It deals with overall issues across the project rather than the specific issues at each station.
In reading the report, there is a sense that working out traffic flows for motorists and trucks took a much higher priority than thinking about transit, pedestrians and cyclists.
The Ontario Line stations are projects on a scale and time frame larger than major building construction projects, and the work will be undertaken by an agency that is not noted for its sensitivity to local concerns. If Eglinton was any indication, there will be plenty of opportunity for finger-pointing between Metrolinx, the City and “Project Co.” (the placeholder name for the yet-to-be-selected P3 partner).
City Led Projects
In addition to the work of building the Ontario Line, there are other planned construction projects downtown. The list below only reaches to 2026.
The following City-led construction projects were included:
- Gardiner Express Rehabilitation – Grand Magazine Street to York Street (2024 to 2026)
- TTC 504 King streetcar track rehabilitation – 2024
- Yonge Tomorrow – Reconfiguration of Yonge Street between Queen Street and College Street
- Sewer Rehabilitation –
- Richmond Street between Simcoe Street and John Street (2023);
- Richmond Street between Peter Street to Spadina Avenue (2023);
- Wellington Street between Clarence Square and Blue Jays Way (2024);
- Front Street between Bay Street and Scott Street (2024).
- Watermain Replacement –
- Adelaide Street between York Street and Victoria Street (2022);
- Dundas Street, between Church Street and Sherbourne Street (2024);
- Front Street between Bathurst Street and Spadina Avenue (2026).
Congestion
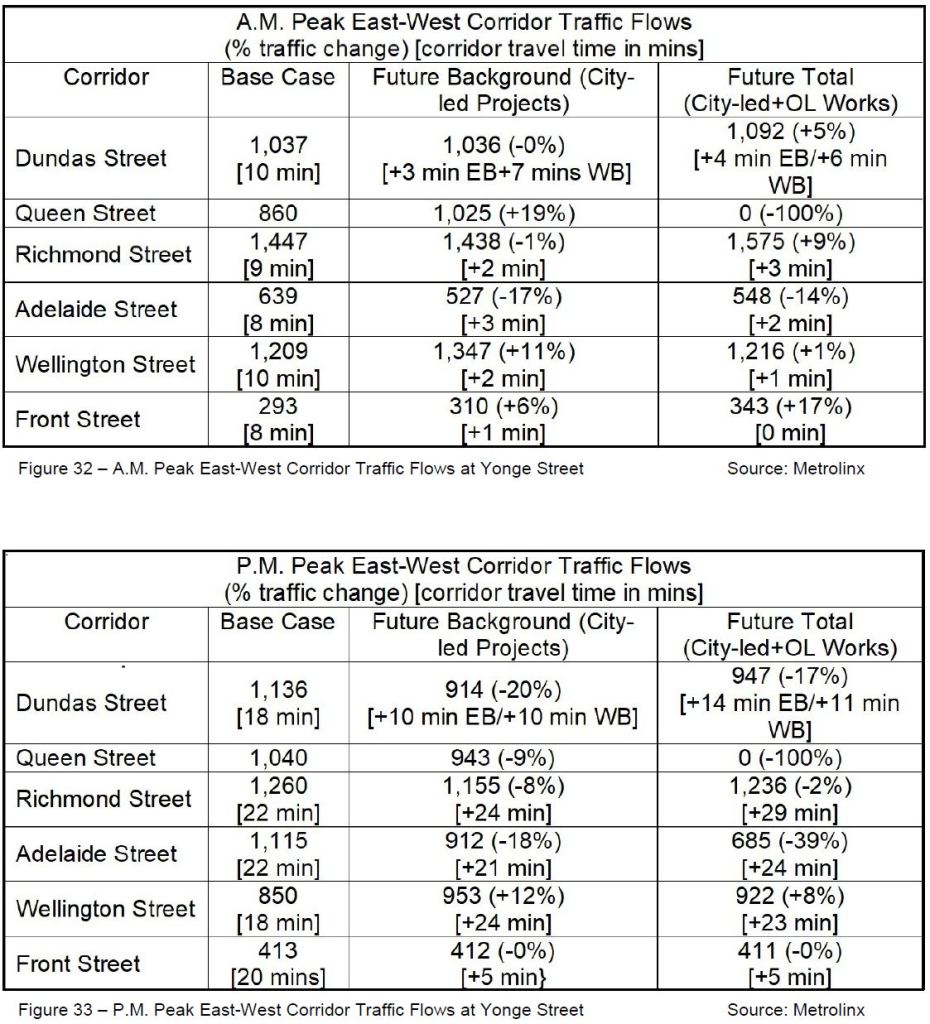
The table below shows the effect of various configurations on traffic volumes and speed for the AM and PM peak periods.
- The Base Case is the existing conditions with no added projects.
- The “Future Background” adds in the City projects listed above, and assumes that they all happen at once. In fact they will take place at different times.
- The “Future Total” adds in the effect of the Ontario Line construction on top of the City projects.
The base number is the projected vehicle count on each corridor at Yonge Street. The number in square brackets shows the existing travel time (Base Case) and the projected change (Future Cases) between Parliament and Bathurst Street.

King is notable by its absence in the table, but it is hard to believe it will not be affected especially with the lack of enforcement of priority measures. It will be under construction in 2024, but in other years traffic will inevitably use any available street regardless of signage or paint on the roadway.
Travel times are already considerably higher in the PM peak than in the AM. The projected changes in the AM peak are small relative to the base case because the road network can absorb the reduced capacity at that time. However, in the PM peak, travel times double (or more) across the core area.
This will have a severe effect on transit service.
Considering the cataclysmic effects shown above, this table bears close scrutiny. An immediately obvious point is that almost all of the change is the result of the City-led projects and the Ontario Line construction adds very little on top of this. But the model assumed that all of the City projects planned out to 2026 would occur at the same time rather than individually.
This is lazy modelling, and it should be redone on a year-by-year basis to evaluate the effect of taking specific chunks out of the road network as planned.
Equally important should be a model run with only the Ontario Line changes included. It is possible that the model with only all of the City projects yields so much congestion that there is no room for “growth” on that account when the OL is added to the mix.
A rather obvious question here is how construction vehicles are supposed to access the OL sites if traffic is so congested during part of the day. Indeed, one might ask whether a moratorium on truck activity during at least the PM peak will be needed.
A well-known characteristic of traffic congestion is that it can build slowly with volume, but at a critical point there is a “knee in the curve” where congestion gets much worse with only a small change in the network. This is seen on a day-to-day basis when all that is needed to snarl an otherwise open road is a curb lane blocked by a delivery truck or utility workers with a few traffic cones.
Continue reading