Track Replacement at Gerrard & Parliament Streets (Updated May 20, 2018)

Updated May 18, 2018: Photos added.

The first of three intersection renewals on the Carlton and Dundas routes began on May 14 at Gerrard and Parliament Streets. Intersections at Broadview/Dundas and Broadview/Gerrard will follow in June and July, as well as track renewal on Broadview between Dundas and Gerrard. Planned renewal of the track from north of Gerrard to Hogarth (the north end of Riverdale Park) has been deferred to a future year, as yet unknown.

Demolition of the intersection began on the morning of Monday, May 14, and by late afternoon Wednesday, May 16, the new foundation was in place and ready to receive track. I happened to drop by just as the first track panel was being unloaded and placed in the street.

Intersections are pre-assembled at Hillcrest before they are delivered to the site so that they can be installed in panels rather than individual parts, a much more labour intensive process once used by the TTC. Preassembly also allows pre-welding of all components in one panel, and the only on-site welding required is to join panels to each other and to odd pieces of track that individually complete the junction and approaches.

Day 4: May 17, 2018

At the time of my visit in the early afternoon, the south quadrant had been installed and assembly of the middle of the intersection was in progress.


Day 5: May 18, 2018

As of mid-day, most of the north-south trackage is in place including the run off tracks that will link to the existing track beyond the work site. Welding was in progress. The eastern quadrant appears ready to receive its track panels.

Day 6: May 19, 2018 (Rain day, no  photos)

Day 7: May 20, 2018

The intersection is now almost completely assembled. Concrete work will follow in two separate stages: one to the height of the ties, and another to the railhead. This arrangement makes repairs easier because only the top layer needs to be demolished.

505 Dundas Streetcars vs Buses: Part I – Travel Times

This article continues the comparison of streetcar and bus operations which began with a review of the 506 Carlton route in the following articles:

Both Carlton and 505 Dundas were converted to full bus operation in mid-February 2018 to deal both with the shortage of streetcars and with numerous construction projects affecting both routes.

The question often arises of which is the faster mode, and that came up in 2017 when Councillor Michael Ford wanted the bus substitution on Queen to continue into the fall so that there could be a controlled test. I have already written about the situation on 501 Queen:

This article deals with travel times on the 505 Dundas route. Part II will review headway reliability (the spacing between streetcars or buses).

Continue reading

King Street Update: April 2018 Data

This article continues the series reviewing streetcar service on the King Street Pilot area between Jarvis and Bathurst Streets. Previous installments are available here.

Except for two major storms, April 2018 continued more or less in the pattern of previous months. Schedule changes in mid-May will reduce the scheduled travel time across the route, and this should reduce queuing at terminals. However, it could also lead to an increase in short-turns when the line is under stress. This is always a balancing act in schedule design.

Because of this, I will not publish an updated headway reliability article this time around, but will return to that subject later in the year when a few months’ experience with the new schedules has accumulated.

The charts in this article contain the same data as in the March versions with the addition of April 2018 data and a few cosmetic fixes.

Updated May 11, 2018 at 10:10 am: Capacity charts reformatted to correct headings and date ranges. No change in content.

Continue reading

506 Carlton Streetcars vs Buses: Part III – Fine Tuning The Charts

This article is a followup to two previous analyses of the 506 Carlton route’s behaviour:

Based on feedback from readers, I have experimented with alternative presentations of the data that better illustrate what is happening on the route. These versions will be added to the repertoire of charts I will use in future analyses, notably for the 505 Dundas route which is the next one in line for review.

Continue reading

TTC Service Changes Effective Sunday, May 13, 2018

The May 2018 service changes bring:

  • Addition of two AM peak “gap trains” on 1 Yonge-University-Spadina and other operational improvements.
  • An update to the schedules for service on the King Street Pilot to reflect the improved travel time on the street and to reduce vehicle queues at terminals.
  • Changes to all routes serving Main Station during construction that will close the loop to transit vehicles.
  • Diversions of the Parliament and Carlton routes around track construction at Gerrard & Parliament.
  • Changes to Don Mills bus schedules to reflect actual operating conditions and Crosstown construction effects.
  • Seasonal changes to reflect declining ridership to post-secondary institutions during the summer.
  • Summer improvements including extension of 121 Fort York Esplanade to Cherry Beach during all operating periods, improved weekend service on 92 Woodbine South, and later service to the Zoo.
  • There is a new summer route 175 Bluffers Park on weekends between Kennedy Station and the park’s parking lot.
  • Service cuts and running time reductions on 6 Bay.
  • Weekend reliability improvements on 96 Wilson and 165 Weston Road North.
  • Weekday reliability improvements on 199 Finch Rocket.

2018.05.13_Service_Changes

Here are the highlights:

1 Yonge-University-Spadina

Two “gap trains” will be added to the morning peak schedule to provide additional service as needed southbound on Yonge. One train will be stationed in Eglinton pocket track, and the other on the hostler track at Davisville.

Trains leaving service in the evening to Wilson Yard will now do so southbound from Vaughan rather than northbound at Wilson. This avoids conflicts between the yard movements and southbound service.

King Street Pilot

Running times on 504 King will be reduced during almost all operating periods, and the saving will be converted into slightly shorter scheduled headways with no change in total vehicles. The four peak period ALRV trippers will be replaced by six CLRV trippers. Flexity cars will now be formally scheduled to cover part of the service with priority going to runs that stay out all day.

514 Cherry service will be improved during the AM peak, weekday early evening, Saturday afternoon and Saturday early evening periods by the addition of one or more cars.

Peak period crewing practices will be changed to step back operation to reduce terminal delays.

Main Station

Main Station Loop will be closed until September 2018 for construction. During this time routes serving the station will be reorganized:

  • 20 Cliffside and 62 Mortimer will be interlined as a single route from Broadview to Kennedy Station.
  • 23 Dawes will be extended west to Woodbine Station.
  • 64 Main will be extended north to Eastdale.
  • 87 Cosburn will loop on street via Danforth and Chisholm.
  • 113 Danforth and 135 Gerrard will be cut back from Main to Victoria Park Station.
  • 506 Carlton will be extended east to Victoria Park Station via Gerrard covering the mileage of the shortened 135 Gerrard route.

Parliament & Gerrard

During the reconstruction of this intersection, buses will divert:

  • 65 Parliament will divert via Sherbourne between Dundas and Carlton.
  • 506 Carlton will divert via Dundas between Sherbourne and River.

Bay Bus

Service on 6 Bay will be reduced by the elimination of one or two buses during most operating periods, and headways will be widened as a result.

This route suffers from excessive running time as shown in a previous analysis I published, and I will be updating this with current data in May.

506 Carlton Streetcars vs Buses: Part II – Headway Reliability & Capacity

Updated April 24, 2018 at 6:15 am: The axis title on the headway history chart at the end of this article has been corrected from “Minutes” to “Seconds” to reflect the units by which headways are stated in the chart.

In Part I, I reviewed the travel times for buses and streetcars on 506 Carlton since September 2017. In Part II, I will turn to headway reliability – the degree to which service actually operates with evenly spaced vehicles – as well as the capacity of service provided. A followup section looks back to September 2015 to compare operations over a longer timespan.

When the TTC reports on service quality, they have a very limited target: that vehicles leave their terminals no more than 1 minute early or 5 minutes late. Performance stats at the route level have not been published for three years, although there are plans to resume this practice soon. However, there are problems with summarizing data at the level the TTC reports:

  • Results are consolidated for entire days and months so that variations are smoothed out, and the raggedness both in hour-to-hour and day-to-day performance is hidden.
  • Relatively poor performance in peak periods can be masked in averages by better performance in the off-peak. Even though there are fewer off-peak vehicles, there are more off-peak hours and hence more trips.
  • There is no measure of service quality except at terminals even though that is not where most riders use the service.
  • The absence of mid-route measurements means that there is no penalty in a missed “target” for line management quality over the length of a route.
  • The six-minute window (+1 to -5) allows pairs of vehicles on routes with short headways to depart from terminals while still being considered “on time”.
  • Route capacity is wasted because some vehicles run half-empty close behind their leaders, and the average rider experience is that vehicles are infrequent and crowded. The TTC has no metric to identify and monitor this problem.

Service on 506 Carlton has been erratic for many years and the shift to bus operation in February 2018 has not improved route performance. Although buses are scheduled closer together for capacity reasons, headways remain erratic and in some cases the variation in headways has widened since the move to bus operation.

Looking at these charts, it is a wonder that anybody tries to ride this line at all. It is a textbook example of providing bad and slowly declining service on what was once a trunk route in the system. As density builds up along the “shoulder downtown”, routes like Carlton have an important role, if only the TTC would make the effort to provide more attractive service.

Continue reading

506 Carlton Streetcars vs Buses: Part I – Travel Times (Updated)

Updated April 23, 2018 at 9:30 am: A section has been added following the original article to discuss travel times over the full route from Main Station to High Park including weekend data.

With the temporary conversion of the 505 Dundas and 506 Carlton routes to bus operation for much of 2018, there is a chance to compare how these routes operate with each vehicle type. In this and future articles, I will review travel times across the routes as well as headway reliability.

Data for 506 Carlton that I have collected runs from June to October 2017, and from January to March 2018. For the purpose of speed comparisons, weekdays from January 8-19 (streetcar) and March 19-28 (bus) 2018 are used. This avoids major storms as well as periods when schools were closed and traffic was lighter than normal.

There are seasonal variations in travel times due to the nature of streets and neighbourhoods transit services run through. As the year progresses, it will be possible to compare data for warmer months when the streets are busy between 2017 and 2018 data, although this must be tempered with the effect of diversions that were in effect during 2017.

There is a slight improvement in travel time at certain periods of the day and certain locations/directions for buses, but this is not large or widespread even in off-peak periods. Buses tend to reach higher peak speeds between stops where conditions permit, but in many cases the speed profiles are comparable for the two modes.

Bus headway reliability has been a topic of some discussion on Twitter along with the capacity of the replacement service, but I will turn to those issues in the second part of this analysis.

Route History

The 506 Carlton route changed from time to time over the past year, and this affects the travel times reported here.

  • June 18, 2017: Service diverted via Dundas and Bathurst both ways for streetscape work on College. This increases travel times on the west end of the route starting in mid-June.
  • June 19 to July 9, 2017: Service diverted via Queen between Parliament and Coxwell for construction on Gerrard.
  • July 10 to 25, 2017: Service diverted to Coxwell-Queen Loop for construction on Upper Gerrard. Bus shuttles provided service east of Coxwell.
  • July 26, 2017: Service returned to Main Station. West end diversion via Dundas continues.
  • October 14, 2017: Service resumes standard routing.
  • February 18, 2018: Conversion to bus operation. Western terminus extended to High Park Station.

Chart Formats

The charts presented here are similar to those I have used in previous articles with some minor changes.

In the chart sets containing percentiles of travel time values, there are three groups of charts.

  • The first three pages show the 85th percentile values by hour through the day. Most trips fall within this range, and using the 85th percentile shaves off the worst of the peaks.
  • The next three pages show the 50th percentile values by hour. The format is the same as in the first group, but the values are the medians – half of the trips take longer, and half take shorter.
  • The last four pages show four percentiles from 25th (only 1/4 of trip take this time or less), 50th (median), 85th (most trips) and 100th (maximum values) for four one-hour periods through the day representing the am peak, midday, pm peak and early evening.

For the collection of 85th percentiles, the travel times rise and fall through the day. Detailed comments appear later in the article, but a few points are worth noting here:

  • Travel times in the summer (until Thanksgiving weekend) were longer than in the fall and winter.
  • Some of the highest values fall not in the AM peak but in the late morning.
  • Where there is a spike up, this indicates a delay severe enough to push the 85th percentile to a high value. Where there is a spike down to zero, there was no service over thr route section and direction during the hour in question (for example below, on September 22 between 11 am and noon).

Data are grouped based on the hour when a vehicle enters the section being measured, in this case crossing Yonge Street westbound.

Sample 85th percentile values for 6 am to noon

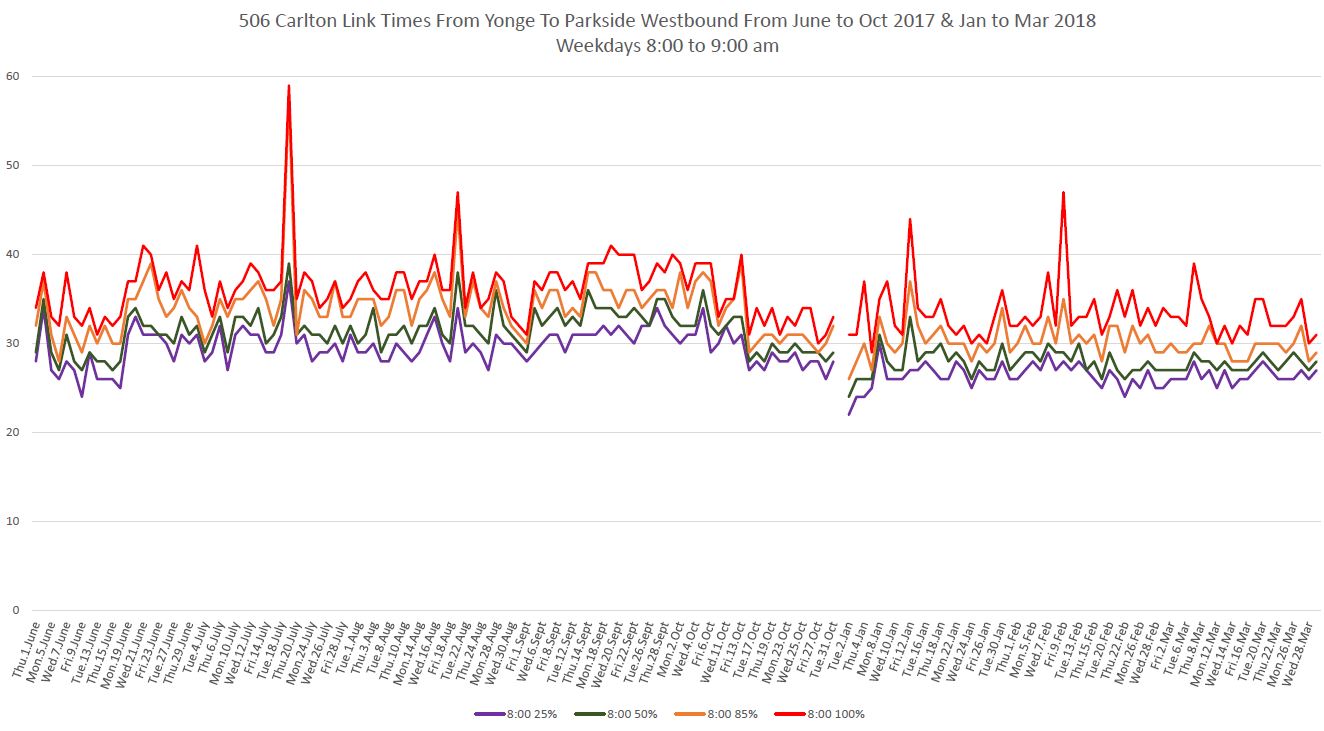
The charts with the four percentile bands give a sense of the range of values. At the low end, the 25th percentile (purple) gives a sense of the best case times as only one quarter of the trips achieve this time or better. At the high end, the 100th percentile (red) shows the maximum that can occur. This might only be one vehicle or it could be several. The space between the lines gives a sense of how spread out the values are.

Sample percentile values for the AM peak hour

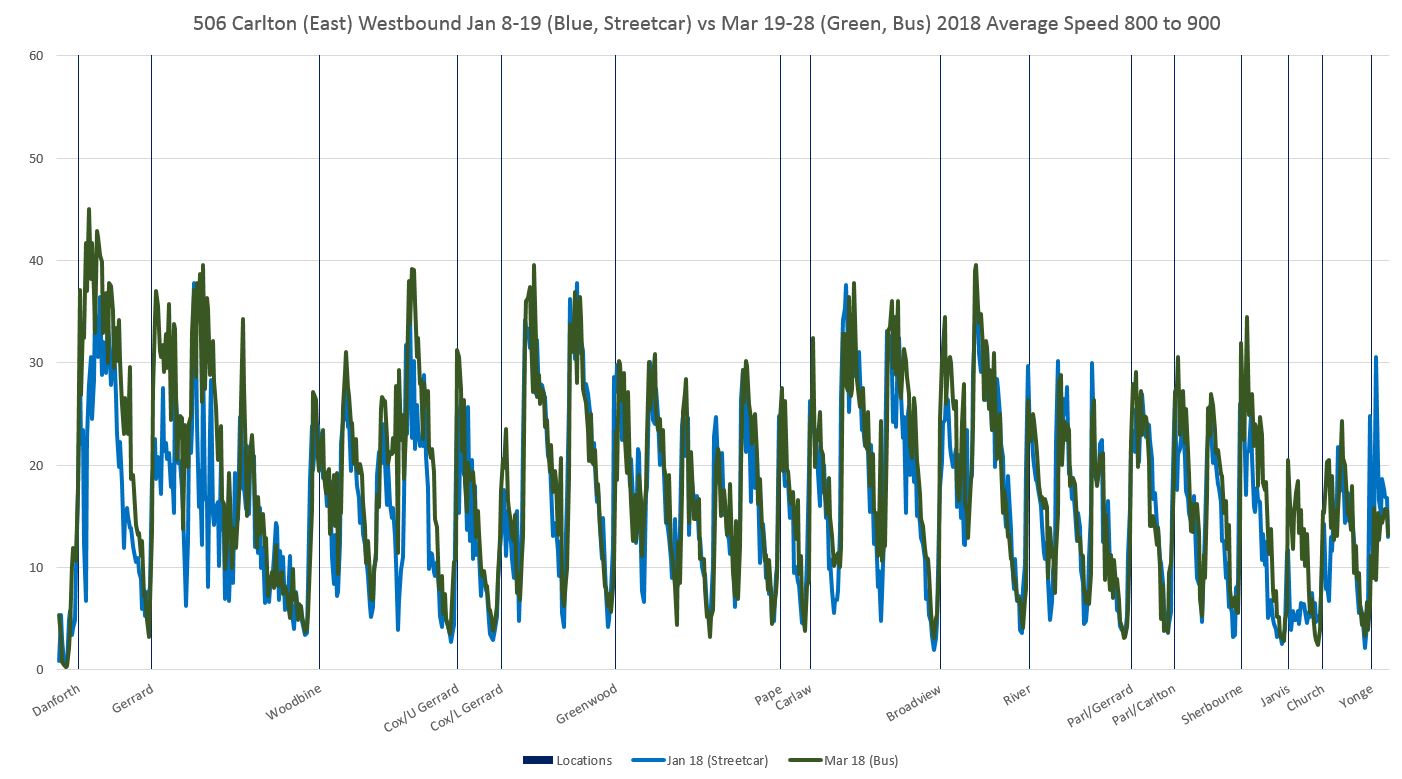
The charts showing average speeds are organized differently to show vehicle behaviour over the length of the route.

  • There are 20 pages to each set of charts, one for each hour from 6-7 am to 1-2 am.
  • To allow the charts room to “breathe”, the data are split into the east and west half of the route divided at Yonge Street, and there are separate chart sets for westbound and eastbound travel.
  • Westbound charts should be read left to right. Eastbound charts should be read right to left.
  • To the degree that the blue (streetcar) line hangs below the green (bus) line, this shows areas where streetcars travel, on average, more slowly than buses during the hour in question, averaged over the period. Where the blue line rises above the green line, the streetcars are faster.
  • One can get a sense of the evolution of travel times for both modes over the course of the day by stepping through the pages to view the rise and fall of values.
  • Late at night, the number of vehicles in service falls, and with that the number of data points. Charts for the period from 1-2 am have less granularity as a result.

Methodology: From the tracking data, we know where each vehicle is every 20 seconds, and from this can derive the speed at that location and time. The route is subdivided into 10m segments, and the calculated speeds are allocated to wherever the vehicle is observed at a given time. The total is then divided by the number of observations to produce average speeds. The downward notches in the charts correspond to places where vehicles stop, or at least slow, typically on the approach to a transit stop or signal. Not all trips stop at all locations, and so a non-zero average can result. Where the downward “notch” approaching a stop is wide, this indicates vehicles queueing on the approach due to congestion.

Continue reading

Service Capacity on 501 Queen

This article arose from a recent Twitter conversation where I was asked whether the capacity of of 501 Queen route had been reduced because crowding appeared to have increased.

Crowding has many sources including service reliability (even distribution of demand among available vehicles), scheduled frequency (how many vehicles are supposed to arrive per hour), actual service provided and the type of vehicle used.

Past articles have looked at service reliability and running times. The mid-February 2018 schedules brought a formal change to the vehicle type on which the 501 schedules are based. For many years, the capacity alleged was based on the longer ALRV (articulated) streetcars, but the service was actually operated by a mix of the shorter CLRVs and ALRVs. This was due to two factors: the declining reliability of the ALRV fleet, and the desire to increase capacity on 504 King. The new schedule assumes that CLRVs will be the primary vehicle type used, and the number of cars per hour (or conversely the headway or time between cars) has been adjusted to reflect this. However, a review of service over recent years shows that the actual capacity operated on Queen is at best comparable to that of a few years back, and more commonly is lower with some of the decline being fairly recent.

The charts in this article have the same format as capacity charts in my articles about the King Street Pilot, most recently the March 2018 update. Of particular note is that the capacity operated on King has been growing with its transition to the larger Flexity cars, and now regularly peaks above 2,500 per hour, peak hour/direction. The capacity on Queen never reaches 2,000/hour because less service is offered there.

501 Queen service was beset by several disruptions and diversions over the past few years notably a water main and streetscape project west of Spadina in 2016 and 2017, and a series of track construction projects reaching over the entire length of the route from southern Etobicoke to Neville Loop. Another upheaval is planned for 2019 with the reconstruction of the King/Queen/Roncesvalles intersection, entrances to Roncesvalles Carhouse and trackage on The Queensway west to Parkside Drive.

Continue reading

King Street Update: March 2018 Data (Part II)

The King Street Pilot project is well regarded for the improvement in travel times it brought to transit riders, and for the large jump in ridership on the route. In past articles, I have reviewed the statistics for travel times, but another important aspect is the reliability of headways – the intervals between streetcars. Early results showed a distinct improvement, but this has not been sustained. Moreover, headway reliability outside of the pilot area remains quite erratic, especially near the terminals.

This brings us to the TTC’s assertion that if only the service would depart on time from the ends of its many routes, the problem of irregular service in the middle would look after itself. This is a completely bogus claim on two counts. First off, erratic service at terminals is the norm, and regularly spaced departures usually depend on hands-on service management by supervisors on the street. Second, service has a fair latitude to be considered “on time”, and even with this leeway, gaps and bunches quickly form that exceed TTC targets.

In theory, if travel times are more consistent thanks to the pilot (or any other transit-supportive changes), then it should be easier to keep service properly spaced. Reality is somewhat different from theory.

This article examines headway behaviour at Yonge Street for the 504 King car, as well as the combined service of the King and 514 Cherry cars. Although these are thought of as “blended” services, like all branching TTC routes, there is no co-ordination between the two routes and the Cherry cars fill gaps in the King service by accident, not by design. Beyond the limits of the Cherry cars (Sumach in the east, Dufferin in the west), the King service is as erratic after the pilot’s introduction as it was before.

Also included is a review of 514 Cherry service on the outer ends of the route. Only recently has the service to Distillery and Dufferin Loops become more reliable and the improvement has more to do with revised schedules than with the King Street Pilot.

Continue reading